Cities with the Highest Percentage of Population Employed in Security & Protection in Georgia
RELATED REPORTS & OPTIONS
Security & Protection
Georgia
Compare Cities
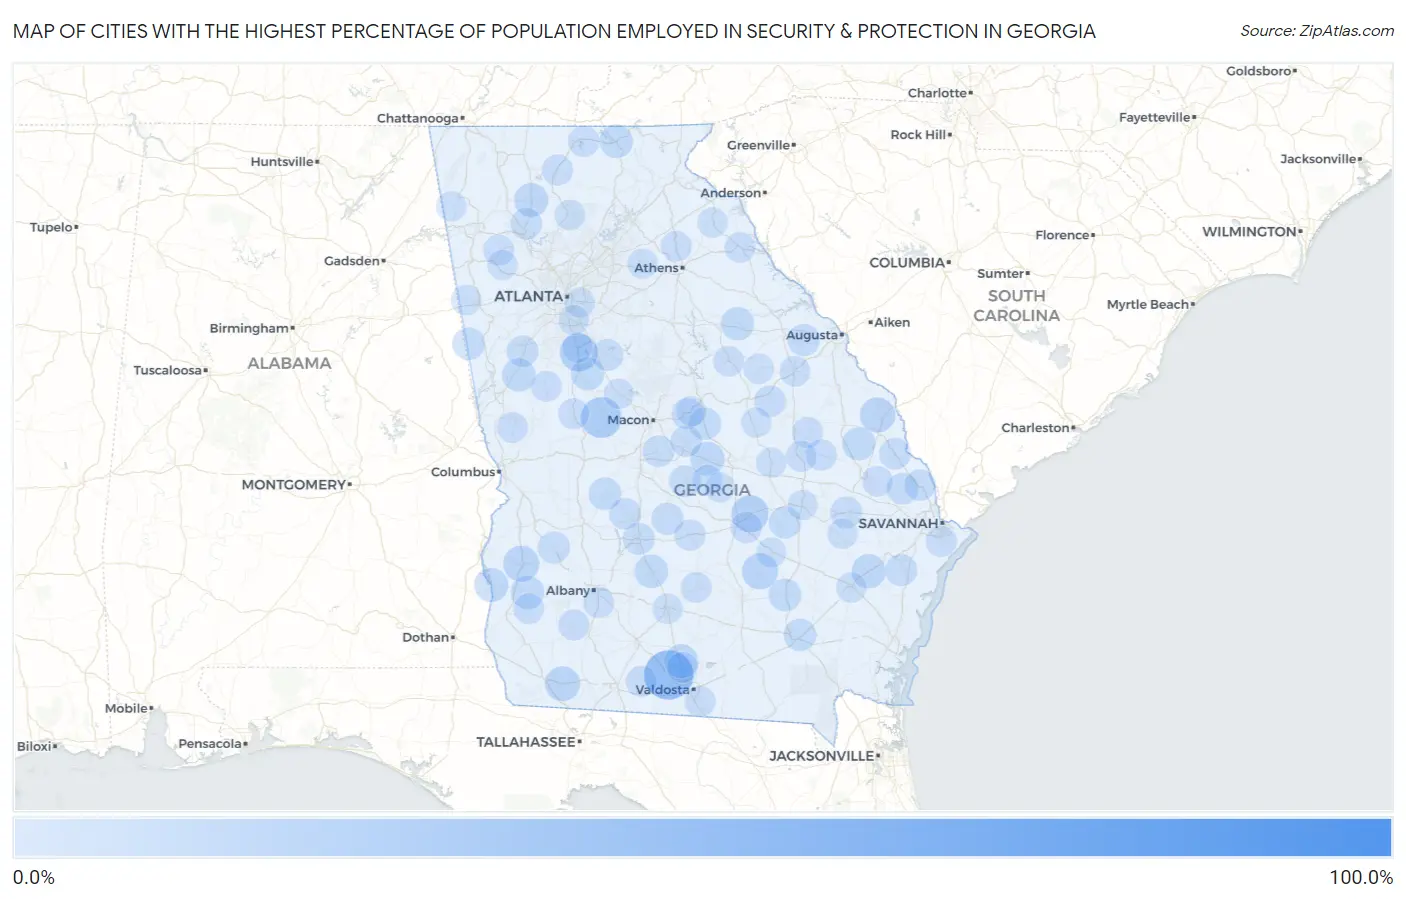
Map of Cities with the Highest Percentage of Population Employed in Security & Protection in Georgia
0.0%
100.0%
Cities with the Highest Percentage of Population Employed in Security & Protection in Georgia
| City | % Employed | vs State | vs National | |
| 1. | Millwood | 100.0% | 2.2%(+97.8)#1 | 2.1%(+97.9)#5 |
| 2. | Morven | 43.4% | 2.2%(+41.2)#2 | 2.1%(+41.2)#51 |
| 3. | Jekyll Island | 28.0% | 2.2%(+25.8)#3 | 2.1%(+25.8)#138 |
| 4. | Culloden | 26.2% | 2.2%(+24.1)#4 | 2.1%(+24.1)#158 |
| 5. | Juliette | 25.0% | 2.2%(+22.8)#5 | 2.1%(+22.9)#179 |
| 6. | Sunny Side | 20.3% | 2.2%(+18.1)#6 | 2.1%(+18.2)#267 |
| 7. | Box Springs | 20.0% | 2.2%(+17.8)#7 | 2.1%(+17.9)#276 |
| 8. | Alamo | 19.1% | 2.2%(+16.9)#8 | 2.1%(+16.9)#304 |
| 9. | Smarr | 18.3% | 2.2%(+16.2)#9 | 2.1%(+16.2)#322 |
| 10. | Denton | 16.9% | 2.2%(+14.8)#10 | 2.1%(+14.8)#386 |
| 11. | Cuthbert | 16.7% | 2.2%(+14.5)#11 | 2.1%(+14.5)#392 |
| 12. | Mershon | 16.7% | 2.2%(+14.5)#12 | 2.1%(+14.5)#402 |
| 13. | Hiltonia | 15.1% | 2.2%(+12.9)#13 | 2.1%(+12.9)#481 |
| 14. | Climax | 14.5% | 2.2%(+12.3)#14 | 2.1%(+12.4)#521 |
| 15. | Ludowici | 13.3% | 2.2%(+11.2)#15 | 2.1%(+11.2)#625 |
| 16. | Montrose | 12.8% | 2.2%(+10.6)#16 | 2.1%(+10.7)#680 |
| 17. | Cecil | 12.8% | 2.2%(+10.6)#17 | 2.1%(+10.6)#682 |
| 18. | Fort Gaines | 12.7% | 2.2%(+10.5)#18 | 2.1%(+10.6)#689 |
| 19. | Fairmount | 12.7% | 2.2%(+10.5)#19 | 2.1%(+10.5)#695 |
| 20. | Ashburn | 11.8% | 2.2%(+9.61)#20 | 2.1%(+9.63)#788 |
| 21. | Blairsville | 11.7% | 2.2%(+9.54)#21 | 2.1%(+9.56)#808 |
| 22. | Lone Oak | 11.4% | 2.2%(+9.26)#22 | 2.1%(+9.28)#846 |
| 23. | Edison | 11.3% | 2.2%(+9.17)#23 | 2.1%(+9.19)#857 |
| 24. | Crawfordville | 11.3% | 2.2%(+9.13)#24 | 2.1%(+9.16)#865 |
| 25. | Orchard Hill | 11.1% | 2.2%(+8.94)#25 | 2.1%(+8.96)#901 |
| 26. | Georgetown Quitman County Unified Government | 11.0% | 2.2%(+8.88)#26 | 2.1%(+8.90)#917 |
| 27. | Rocky Ford | 11.0% | 2.2%(+8.80)#27 | 2.1%(+8.83)#928 |
| 28. | Oglethorpe | 10.2% | 2.2%(+8.02)#28 | 2.1%(+8.04)#1,059 |
| 29. | Alma | 10.2% | 2.2%(+7.98)#29 | 2.1%(+8.01)#1,071 |
| 30. | Ephesus | 9.8% | 2.2%(+7.68)#30 | 2.1%(+7.70)#1,123 |
| 31. | Sunnyside | 9.8% | 2.2%(+7.65)#31 | 2.1%(+7.68)#1,130 |
| 32. | Alston | 9.4% | 2.2%(+7.20)#32 | 2.1%(+7.23)#1,228 |
| 33. | Irwinton | 9.3% | 2.2%(+7.12)#33 | 2.1%(+7.15)#1,246 |
| 34. | Faceville | 9.2% | 2.2%(+7.06)#34 | 2.1%(+7.08)#1,258 |
| 35. | Harlem | 9.1% | 2.2%(+6.97)#35 | 2.1%(+6.99)#1,277 |
| 36. | Pineview | 9.1% | 2.2%(+6.92)#36 | 2.1%(+6.94)#1,292 |
| 37. | Parrott | 9.1% | 2.2%(+6.92)#37 | 2.1%(+6.94)#1,303 |
| 38. | Cordele | 8.9% | 2.2%(+6.71)#38 | 2.1%(+6.74)#1,377 |
| 39. | Riceboro | 8.8% | 2.2%(+6.63)#39 | 2.1%(+6.66)#1,393 |
| 40. | Cochran | 8.7% | 2.2%(+6.53)#40 | 2.1%(+6.55)#1,426 |
| 41. | Warthen | 8.7% | 2.2%(+6.52)#41 | 2.1%(+6.55)#1,433 |
| 42. | Hagan | 8.5% | 2.2%(+6.36)#42 | 2.1%(+6.38)#1,479 |
| 43. | East Newnan | 8.4% | 2.2%(+6.21)#43 | 2.1%(+6.24)#1,521 |
| 44. | White | 8.2% | 2.2%(+6.06)#44 | 2.1%(+6.09)#1,576 |
| 45. | Jenkinsburg | 8.2% | 2.2%(+6.05)#45 | 2.1%(+6.07)#1,582 |
| 46. | Lilly | 8.1% | 2.2%(+5.94)#46 | 2.1%(+5.96)#1,620 |
| 47. | Newington | 8.1% | 2.2%(+5.91)#47 | 2.1%(+5.93)#1,631 |
| 48. | Guyton | 8.0% | 2.2%(+5.88)#48 | 2.1%(+5.90)#1,640 |
| 49. | Robins Afb | 8.0% | 2.2%(+5.81)#49 | 2.1%(+5.83)#1,664 |
| 50. | Davisboro | 7.9% | 2.2%(+5.69)#50 | 2.1%(+5.71)#1,702 |
| 51. | Springfield | 7.8% | 2.2%(+5.68)#51 | 2.1%(+5.70)#1,706 |
| 52. | Jeffersonville | 7.7% | 2.2%(+5.58)#52 | 2.1%(+5.60)#1,744 |
| 53. | Scotland | 7.6% | 2.2%(+5.44)#53 | 2.1%(+5.46)#1,797 |
| 54. | Gordon | 7.5% | 2.2%(+5.30)#54 | 2.1%(+5.32)#1,865 |
| 55. | Twin City | 7.4% | 2.2%(+5.26)#55 | 2.1%(+5.28)#1,889 |
| 56. | Summertown | 7.2% | 2.2%(+5.07)#56 | 2.1%(+5.10)#1,958 |
| 57. | Abbeville | 7.2% | 2.2%(+5.06)#57 | 2.1%(+5.08)#1,968 |
| 58. | East Ellijay | 7.2% | 2.2%(+5.04)#58 | 2.1%(+5.06)#1,978 |
| 59. | Morganton | 7.2% | 2.2%(+5.03)#59 | 2.1%(+5.05)#1,982 |
| 60. | Newton | 7.1% | 2.2%(+4.97)#60 | 2.1%(+4.99)#2,001 |
| 61. | Hahira | 7.1% | 2.2%(+4.93)#61 | 2.1%(+4.96)#2,019 |
| 62. | Montgomery | 7.1% | 2.2%(+4.93)#62 | 2.1%(+4.95)#2,022 |
| 63. | Barwick | 7.0% | 2.2%(+4.83)#63 | 2.1%(+4.85)#2,075 |
| 64. | Putney | 7.0% | 2.2%(+4.80)#64 | 2.1%(+4.82)#2,094 |
| 65. | Swainsboro | 6.8% | 2.2%(+4.66)#65 | 2.1%(+4.68)#2,171 |
| 66. | Taylorsville | 6.8% | 2.2%(+4.61)#66 | 2.1%(+4.63)#2,196 |
| 67. | Thomaston | 6.7% | 2.2%(+4.53)#67 | 2.1%(+4.56)#2,238 |
| 68. | Dasher | 6.7% | 2.2%(+4.52)#68 | 2.1%(+4.55)#2,243 |
| 69. | Ocilla | 6.5% | 2.2%(+4.29)#69 | 2.1%(+4.32)#2,377 |
| 70. | Hamilton | 6.5% | 2.2%(+4.28)#70 | 2.1%(+4.31)#2,382 |
| 71. | Elberton | 6.4% | 2.2%(+4.19)#71 | 2.1%(+4.22)#2,457 |
| 72. | Brooklet | 6.3% | 2.2%(+4.17)#72 | 2.1%(+4.19)#2,476 |
| 73. | Sparta | 6.3% | 2.2%(+4.15)#73 | 2.1%(+4.17)#2,483 |
| 74. | Arlington | 6.3% | 2.2%(+4.12)#74 | 2.1%(+4.14)#2,500 |
| 75. | Wrens | 6.3% | 2.2%(+4.11)#75 | 2.1%(+4.13)#2,512 |
| 76. | Gay | 6.2% | 2.2%(+4.00)#76 | 2.1%(+4.02)#2,577 |
| 77. | Nicholson | 6.1% | 2.2%(+3.97)#77 | 2.1%(+4.00)#2,593 |
| 78. | Ball Ground | 6.1% | 2.2%(+3.90)#78 | 2.1%(+3.92)#2,645 |
| 79. | Cusseta Chattahoochee County Unified Government | 6.0% | 2.2%(+3.85)#79 | 2.1%(+3.88)#2,688 |
| 80. | Unionville | 5.9% | 2.2%(+3.74)#80 | 2.1%(+3.77)#2,783 |
| 81. | Jesup | 5.9% | 2.2%(+3.71)#81 | 2.1%(+3.73)#2,807 |
| 82. | Tallapoosa | 5.8% | 2.2%(+3.67)#82 | 2.1%(+3.70)#2,847 |
| 83. | Ivey | 5.8% | 2.2%(+3.63)#83 | 2.1%(+3.65)#2,880 |
| 84. | Mendes | 5.7% | 2.2%(+3.54)#84 | 2.1%(+3.57)#2,954 |
| 85. | Hampton | 5.7% | 2.2%(+3.51)#85 | 2.1%(+3.53)#2,985 |
| 86. | Mitchell | 5.6% | 2.2%(+3.46)#86 | 2.1%(+3.49)#3,031 |
| 87. | Chester | 5.6% | 2.2%(+3.41)#87 | 2.1%(+3.44)#3,073 |
| 88. | Cadwell | 5.6% | 2.2%(+3.41)#88 | 2.1%(+3.43)#3,080 |
| 89. | Winder | 5.6% | 2.2%(+3.39)#89 | 2.1%(+3.41)#3,094 |
| 90. | Lyerly | 5.6% | 2.2%(+3.38)#90 | 2.1%(+3.41)#3,104 |
| 91. | Panthersville | 5.5% | 2.2%(+3.38)#91 | 2.1%(+3.40)#3,117 |
| 92. | Fairfield Plantation | 5.5% | 2.2%(+3.35)#92 | 2.1%(+3.37)#3,140 |
| 93. | Forsyth | 5.5% | 2.2%(+3.34)#93 | 2.1%(+3.36)#3,146 |
| 94. | Braswell | 5.5% | 2.2%(+3.32)#94 | 2.1%(+3.34)#3,178 |
| 95. | Adrian | 5.5% | 2.2%(+3.31)#95 | 2.1%(+3.33)#3,184 |
| 96. | Morrow | 5.4% | 2.2%(+3.22)#96 | 2.1%(+3.24)#3,267 |
| 97. | Harrison | 5.4% | 2.2%(+3.19)#97 | 2.1%(+3.21)#3,302 |
| 98. | Royston | 5.3% | 2.2%(+3.18)#98 | 2.1%(+3.20)#3,309 |
| 99. | Hazlehurst | 5.3% | 2.2%(+3.14)#99 | 2.1%(+3.16)#3,348 |
| 100. | Lyons | 5.3% | 2.2%(+3.14)#100 | 2.1%(+3.16)#3,349 |
Common Questions
What are the Top 10 Cities with the Highest Percentage of Population Employed in Security & Protection in Georgia?
Top 10 Cities with the Highest Percentage of Population Employed in Security & Protection in Georgia are:
What city has the Highest Percentage of Population Employed in Security & Protection in Georgia?
Morven has the Highest Percentage of Population Employed in Security & Protection in Georgia with 43.4%.
What is the Percentage of Population Employed in Security & Protection in the State of Georgia?
Percentage of Population Employed in Security & Protection in Georgia is 2.2%.
What is the Percentage of Population Employed in Security & Protection in the United States?
Percentage of Population Employed in Security & Protection in the United States is 2.1%.