Zip Codes with the Highest Percentage of Population Employed in Security & Protection in Los Angeles, CA
RELATED REPORTS & OPTIONS
Security & Protection
Los Angeles
Compare Zip Codes
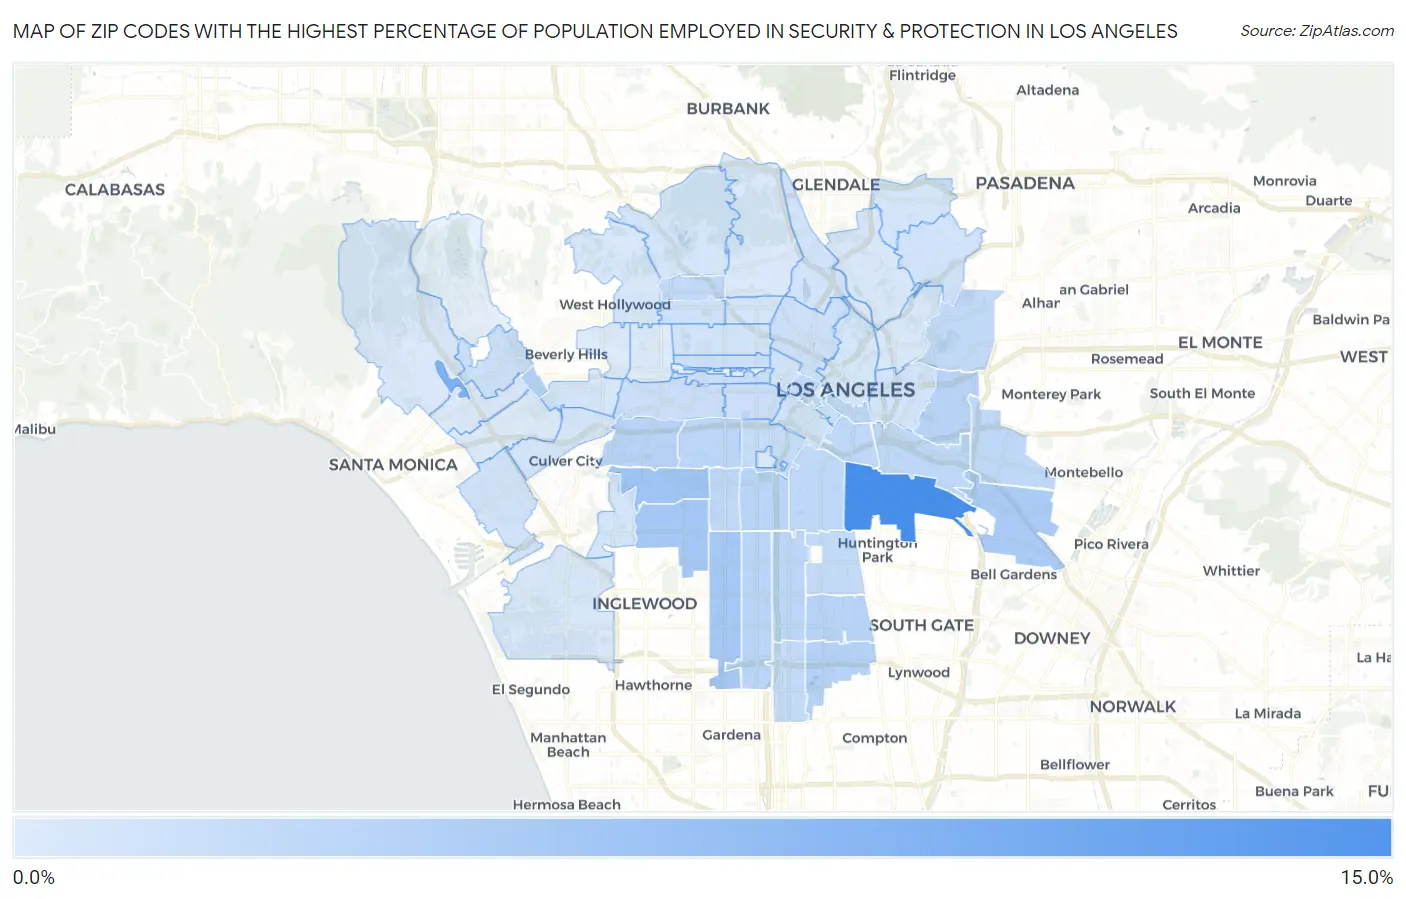
Map of Zip Codes with the Highest Percentage of Population Employed in Security & Protection in Los Angeles
0.30%
11.2%
Zip Codes with the Highest Percentage of Population Employed in Security & Protection in Los Angeles, CA
| Zip Code | % Employed | vs State | vs National | |
| 1. | 90058 | 11.2% | 2.1%(+9.08)#34 | 2.1%(+9.01)#629 |
| 2. | 90073 | 7.1% | 2.1%(+5.06)#78 | 2.1%(+4.99)#1,469 |
| 3. | 90008 | 4.5% | 2.1%(+2.41)#169 | 2.1%(+2.34)#3,623 |
| 4. | 90047 | 4.2% | 2.1%(+2.16)#186 | 2.1%(+2.09)#4,040 |
| 5. | 90043 | 4.2% | 2.1%(+2.14)#189 | 2.1%(+2.07)#4,094 |
| 6. | 90040 | 3.9% | 2.1%(+1.80)#226 | 2.1%(+1.73)#4,742 |
| 7. | 90067 | 3.2% | 2.1%(+1.10)#338 | 2.1%(+1.04)#6,590 |
| 8. | 90059 | 3.1% | 2.1%(+1.02)#353 | 2.1%(+0.952)#6,883 |
| 9. | 90016 | 2.9% | 2.1%(+0.856)#392 | 2.1%(+0.788)#7,490 |
| 10. | 90063 | 2.9% | 2.1%(+0.773)#418 | 2.1%(+0.705)#7,848 |
| 11. | 90002 | 2.8% | 2.1%(+0.724)#439 | 2.1%(+0.656)#8,098 |
| 12. | 90044 | 2.8% | 2.1%(+0.687)#448 | 2.1%(+0.619)#8,245 |
| 13. | 90037 | 2.7% | 2.1%(+0.636)#454 | 2.1%(+0.568)#8,466 |
| 14. | 90003 | 2.6% | 2.1%(+0.500)#496 | 2.1%(+0.432)#9,102 |
| 15. | 90013 | 2.5% | 2.1%(+0.446)#513 | 2.1%(+0.378)#9,377 |
| 16. | 90018 | 2.5% | 2.1%(+0.424)#518 | 2.1%(+0.356)#9,488 |
| 17. | 90021 | 2.4% | 2.1%(+0.357)#539 | 2.1%(+0.289)#9,869 |
| 18. | 90011 | 2.4% | 2.1%(+0.334)#549 | 2.1%(+0.266)#9,983 |
| 19. | 90022 | 2.4% | 2.1%(+0.326)#554 | 2.1%(+0.258)#10,024 |
| 20. | 90023 | 2.3% | 2.1%(+0.223)#583 | 2.1%(+0.155)#10,629 |
| 21. | 90032 | 2.3% | 2.1%(+0.194)#594 | 2.1%(+0.126)#10,797 |
| 22. | 90062 | 2.3% | 2.1%(+0.175)#601 | 2.1%(+0.108)#10,906 |
| 23. | 90017 | 2.2% | 2.1%(+0.151)#610 | 2.1%(+0.083)#11,065 |
| 24. | 90028 | 2.2% | 2.1%(+0.084)#636 | 2.1%(+0.016)#11,488 |
| 25. | 90061 | 2.1% | 2.1%(+0.052)#648 | 2.1%(-0.016)#11,678 |
| 26. | 90001 | 2.1% | 2.1%(+0.046)#651 | 2.1%(-0.022)#11,728 |
| 27. | 90007 | 1.8% | 2.1%(-0.233)#770 | 2.1%(-0.300)#13,573 |
| 28. | 90006 | 1.6% | 2.1%(-0.441)#878 | 2.1%(-0.509)#15,116 |
| 29. | 90005 | 1.6% | 2.1%(-0.498)#907 | 2.1%(-0.566)#15,551 |
| 30. | 90014 | 1.6% | 2.1%(-0.526)#923 | 2.1%(-0.594)#15,769 |
| 31. | 90019 | 1.5% | 2.1%(-0.535)#927 | 2.1%(-0.603)#15,833 |
| 32. | 90024 | 1.4% | 2.1%(-0.664)#989 | 2.1%(-0.732)#16,823 |
| 33. | 90020 | 1.4% | 2.1%(-0.695)#1,007 | 2.1%(-0.763)#17,061 |
| 34. | 90026 | 1.4% | 2.1%(-0.703)#1,008 | 2.1%(-0.771)#17,117 |
| 35. | 90038 | 1.2% | 2.1%(-0.835)#1,076 | 2.1%(-0.903)#18,157 |
| 36. | 90015 | 1.2% | 2.1%(-0.871)#1,094 | 2.1%(-0.939)#18,437 |
| 37. | 90033 | 1.1% | 2.1%(-0.933)#1,120 | 2.1%(-1.00)#18,912 |
| 38. | 90042 | 1.1% | 2.1%(-0.937)#1,124 | 2.1%(-1.00)#18,950 |
| 39. | 90066 | 1.1% | 2.1%(-0.991)#1,148 | 2.1%(-1.06)#19,368 |
| 40. | 90004 | 1.1% | 2.1%(-0.994)#1,150 | 2.1%(-1.06)#19,389 |
| 41. | 90057 | 1.1% | 2.1%(-1.01)#1,155 | 2.1%(-1.08)#19,490 |
| 42. | 90039 | 1.1% | 2.1%(-1.02)#1,160 | 2.1%(-1.09)#19,599 |
| 43. | 90056 | 1.00% | 2.1%(-1.08)#1,179 | 2.1%(-1.15)#20,041 |
| 44. | 90068 | 0.99% | 2.1%(-1.09)#1,183 | 2.1%(-1.16)#20,122 |
| 45. | 90041 | 0.93% | 2.1%(-1.15)#1,203 | 2.1%(-1.22)#20,602 |
| 46. | 90029 | 0.89% | 2.1%(-1.19)#1,223 | 2.1%(-1.26)#20,871 |
| 47. | 90034 | 0.79% | 2.1%(-1.29)#1,258 | 2.1%(-1.36)#21,473 |
| 48. | 90012 | 0.74% | 2.1%(-1.34)#1,270 | 2.1%(-1.41)#21,794 |
| 49. | 90035 | 0.70% | 2.1%(-1.38)#1,288 | 2.1%(-1.45)#22,086 |
| 50. | 90065 | 0.68% | 2.1%(-1.40)#1,301 | 2.1%(-1.47)#22,232 |
| 51. | 90045 | 0.67% | 2.1%(-1.41)#1,302 | 2.1%(-1.48)#22,261 |
| 52. | 90031 | 0.62% | 2.1%(-1.46)#1,317 | 2.1%(-1.53)#22,576 |
| 53. | 90046 | 0.56% | 2.1%(-1.52)#1,336 | 2.1%(-1.58)#22,864 |
| 54. | 90089 | 0.53% | 2.1%(-1.55)#1,345 | 2.1%(-1.62)#23,058 |
| 55. | 90027 | 0.44% | 2.1%(-1.65)#1,357 | 2.1%(-1.71)#23,562 |
| 56. | 90049 | 0.43% | 2.1%(-1.65)#1,359 | 2.1%(-1.71)#23,567 |
| 57. | 90025 | 0.43% | 2.1%(-1.66)#1,361 | 2.1%(-1.72)#23,611 |
| 58. | 90036 | 0.34% | 2.1%(-1.74)#1,384 | 2.1%(-1.81)#23,999 |
| 59. | 90048 | 0.32% | 2.1%(-1.76)#1,389 | 2.1%(-1.82)#24,073 |
| 60. | 90064 | 0.30% | 2.1%(-1.78)#1,392 | 2.1%(-1.85)#24,184 |
1
Common Questions
What are the Top 10 Zip Codes with the Highest Percentage of Population Employed in Security & Protection in Los Angeles, CA?
Top 10 Zip Codes with the Highest Percentage of Population Employed in Security & Protection in Los Angeles, CA are:
What zip code has the Highest Percentage of Population Employed in Security & Protection in Los Angeles, CA?
90058 has the Highest Percentage of Population Employed in Security & Protection in Los Angeles, CA with 11.2%.
What is the Percentage of Population Employed in Security & Protection in Los Angeles, CA?
Percentage of Population Employed in Security & Protection in Los Angeles is 1.5%.
What is the Percentage of Population Employed in Security & Protection in California?
Percentage of Population Employed in Security & Protection in California is 2.1%.
What is the Percentage of Population Employed in Security & Protection in the United States?
Percentage of Population Employed in Security & Protection in the United States is 2.1%.