Spring Valley CDP Lake County, CA Map & Demographics
Spring Valley CDP Lake County Overview
$37,683
PER CAPITA INCOME
$78,000
AVG FAMILY INCOME
$41,486
AVG HOUSEHOLD INCOME
70.5%
WAGE / INCOME GAP [ % ]
29.5¢/ $1
WAGE / INCOME GAP [ $ ]
0.63
INEQUALITY / GINI INDEX
889
TOTAL POPULATION
385
MALE POPULATION
504
FEMALE POPULATION
76.39
MALES / 100 FEMALES
130.91
FEMALES / 100 MALES
55.9
MEDIAN AGE
3.5
AVG FAMILY SIZE
2.5
AVG HOUSEHOLD SIZE
251
LABOR FORCE [ PEOPLE ]
33.2%
PERCENT IN LABOR FORCE
Income in Spring Valley CDP Lake County
Income Overview in Spring Valley CDP Lake County
Per Capita Income in Spring Valley CDP Lake County is $37,683, while median incomes of families and households are $78,000 and $41,486 respectively.
| Characteristic | Number | Measure |
| Per Capita Income | 889 | $37,683 |
| Median Family Income | 200 | $78,000 |
| Mean Family Income | 200 | $133,068 |
| Median Household Income | 356 | $41,486 |
| Mean Household Income | 356 | $85,801 |
| Income Deficit | 200 | $0 |
| Wage / Income Gap (%) | 889 | 70.54% |
| Wage / Income Gap ($) | 889 | 29.46¢ per $1 |
| Gini / Inequality Index | 889 | 0.63 |
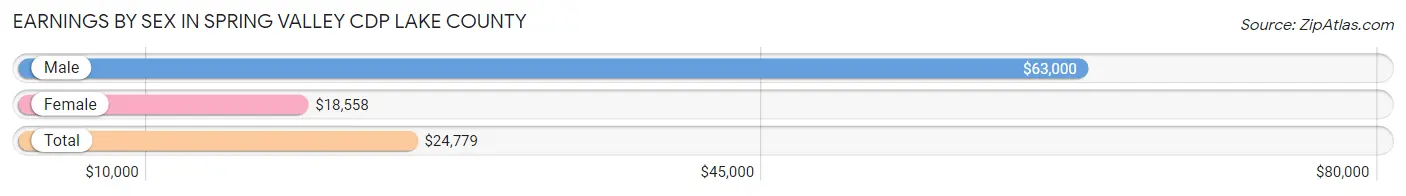
Earnings by Sex in Spring Valley CDP Lake County
Average Earnings in Spring Valley CDP Lake County are $24,779, $63,000 for men and $18,558 for women, a difference of 70.5%.
| Sex | Number | Average Earnings |
| Male | 90 (33.2%) | $63,000 |
| Female | 181 (66.8%) | $18,558 |
| Total | 271 (100.0%) | $24,779 |
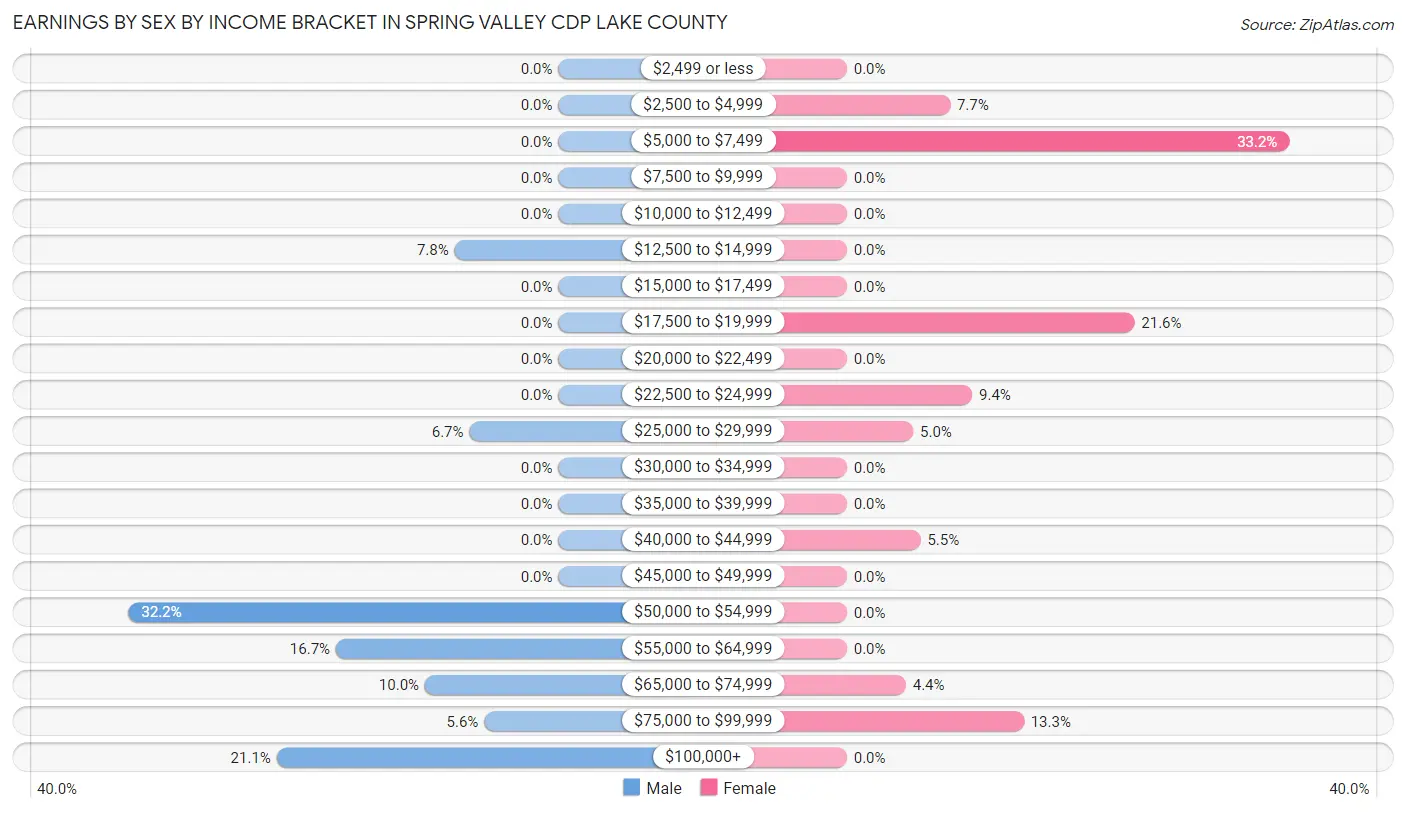
Earnings by Sex by Income Bracket in Spring Valley CDP Lake County
The most common earnings brackets in Spring Valley CDP Lake County are $50,000 to $54,999 for men (29 | 32.2%) and $5,000 to $7,499 for women (60 | 33.2%).
| Income | Male | Female |
| $2,499 or less | 0 (0.0%) | 0 (0.0%) |
| $2,500 to $4,999 | 0 (0.0%) | 14 (7.7%) |
| $5,000 to $7,499 | 0 (0.0%) | 60 (33.2%) |
| $7,500 to $9,999 | 0 (0.0%) | 0 (0.0%) |
| $10,000 to $12,499 | 0 (0.0%) | 0 (0.0%) |
| $12,500 to $14,999 | 7 (7.8%) | 0 (0.0%) |
| $15,000 to $17,499 | 0 (0.0%) | 0 (0.0%) |
| $17,500 to $19,999 | 0 (0.0%) | 39 (21.5%) |
| $20,000 to $22,499 | 0 (0.0%) | 0 (0.0%) |
| $22,500 to $24,999 | 0 (0.0%) | 17 (9.4%) |
| $25,000 to $29,999 | 6 (6.7%) | 9 (5.0%) |
| $30,000 to $34,999 | 0 (0.0%) | 0 (0.0%) |
| $35,000 to $39,999 | 0 (0.0%) | 0 (0.0%) |
| $40,000 to $44,999 | 0 (0.0%) | 10 (5.5%) |
| $45,000 to $49,999 | 0 (0.0%) | 0 (0.0%) |
| $50,000 to $54,999 | 29 (32.2%) | 0 (0.0%) |
| $55,000 to $64,999 | 15 (16.7%) | 0 (0.0%) |
| $65,000 to $74,999 | 9 (10.0%) | 8 (4.4%) |
| $75,000 to $99,999 | 5 (5.6%) | 24 (13.3%) |
| $100,000+ | 19 (21.1%) | 0 (0.0%) |
| Total | 90 (100.0%) | 181 (100.0%) |
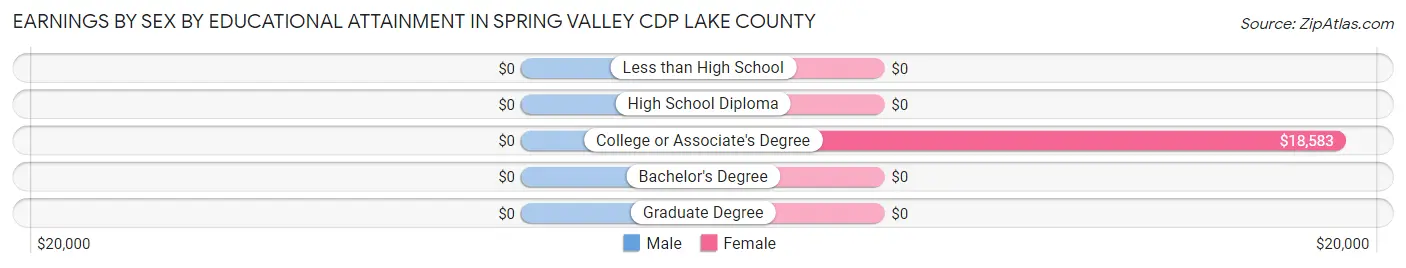
Earnings by Sex by Educational Attainment in Spring Valley CDP Lake County
| Educational Attainment | Male Income | Female Income |
| Less than High School | - | - |
| High School Diploma | - | - |
| College or Associate's Degree | - | - |
| Bachelor's Degree | - | - |
| Graduate Degree | - | - |
| Total | $63,000 | $0 |
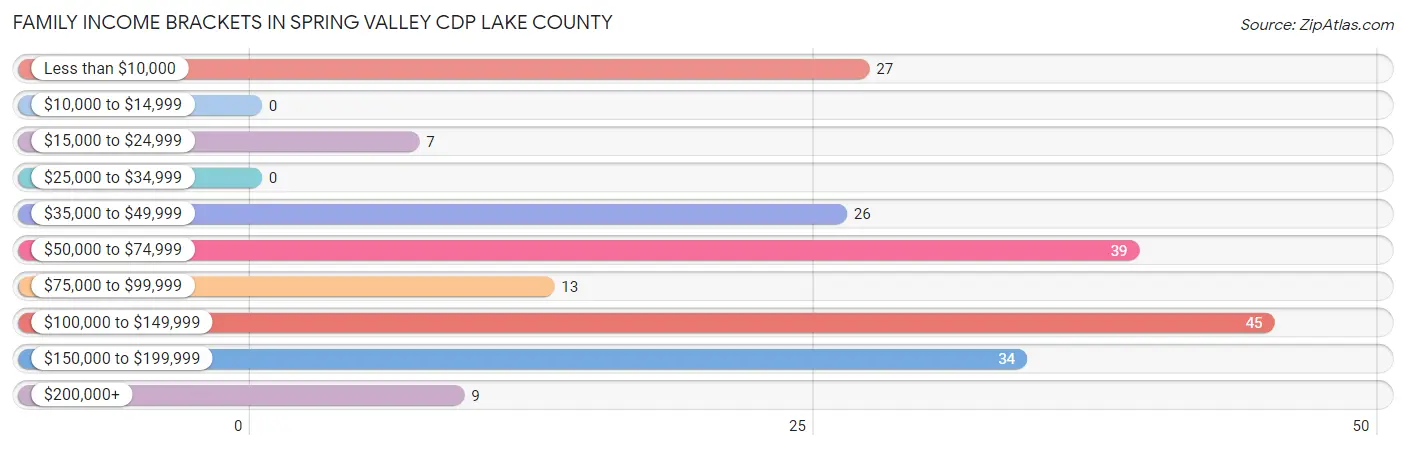
Family Income in Spring Valley CDP Lake County
Family Income Brackets in Spring Valley CDP Lake County
According to the Spring Valley CDP Lake County family income data, there are 45 families falling into the $100,000 to $149,999 income range, which is the most common income bracket and makes up 22.5% of all families.
| Income Bracket | # Families | % Families |
| Less than $10,000 | 27 | 13.5% |
| $10,000 to $14,999 | 0 | 0.0% |
| $15,000 to $24,999 | 7 | 3.5% |
| $25,000 to $34,999 | 0 | 0.0% |
| $35,000 to $49,999 | 26 | 13.0% |
| $50,000 to $74,999 | 39 | 19.5% |
| $75,000 to $99,999 | 13 | 6.5% |
| $100,000 to $149,999 | 45 | 22.5% |
| $150,000 to $199,999 | 34 | 17.0% |
| $200,000+ | 9 | 4.5% |
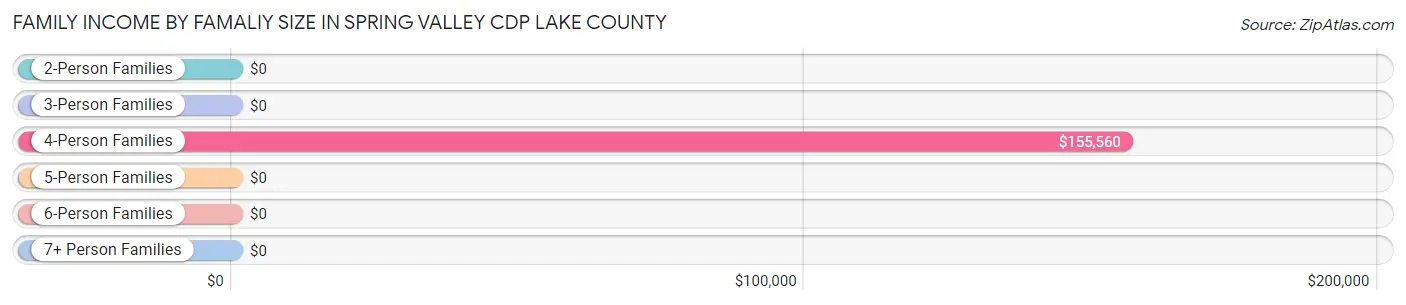
Family Income by Famaliy Size in Spring Valley CDP Lake County
4-person families (63 | 31.5%) account for the highest median family income in Spring Valley CDP Lake County with $155,560 per family, while 4-person families (63 | 31.5%) have the highest median income of $38,890 per family member.
| Income Bracket | # Families | Median Income |
| 2-Person Families | 112 (56.0%) | $0 |
| 3-Person Families | 20 (10.0%) | $0 |
| 4-Person Families | 63 (31.5%) | $155,560 |
| 5-Person Families | 0 (0.0%) | $0 |
| 6-Person Families | 5 (2.5%) | $0 |
| 7+ Person Families | 0 (0.0%) | $0 |
| Total | 200 (100.0%) | $78,000 |
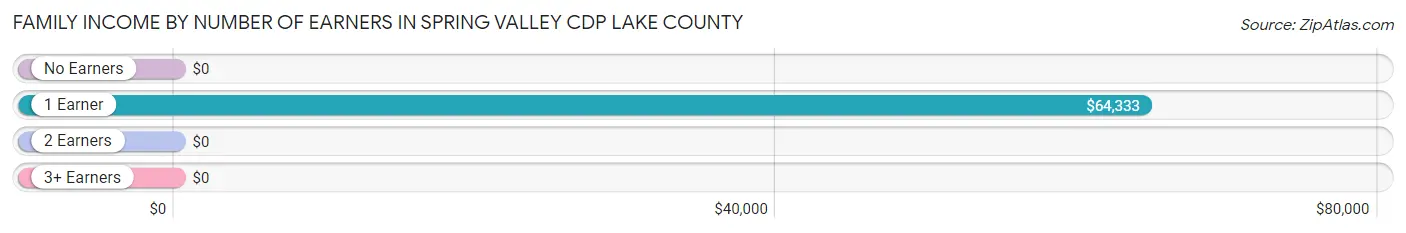
Family Income by Number of Earners in Spring Valley CDP Lake County
| Number of Earners | # Families | Median Income |
| No Earners | 94 (47.0%) | $0 |
| 1 Earner | 34 (17.0%) | $64,333 |
| 2 Earners | 43 (21.5%) | $0 |
| 3+ Earners | 29 (14.5%) | $0 |
| Total | 200 (100.0%) | $78,000 |
Household Income in Spring Valley CDP Lake County
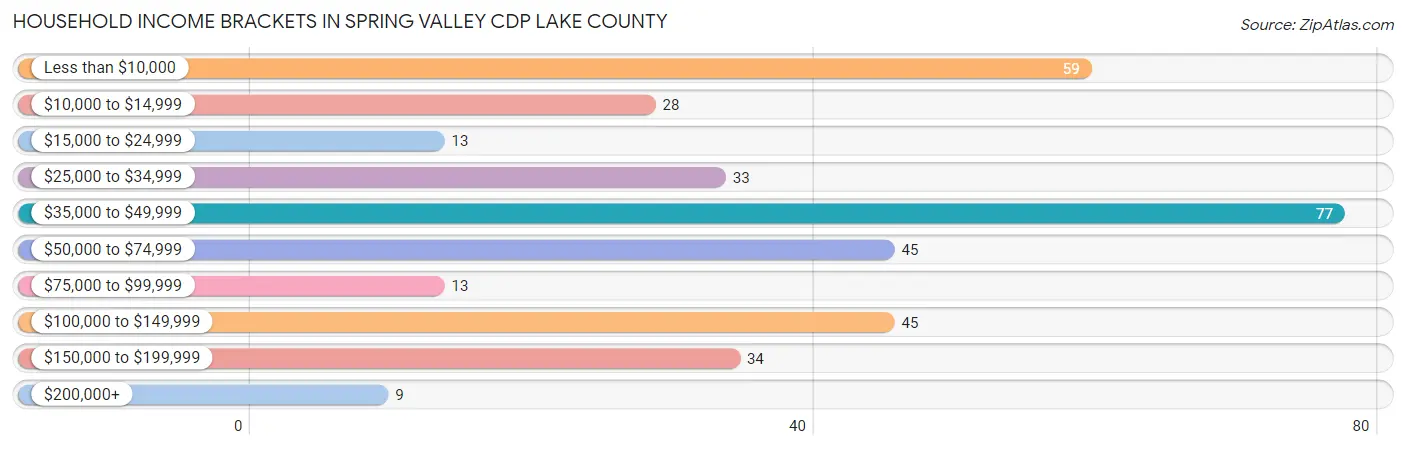
Household Income Brackets in Spring Valley CDP Lake County
With 77 households falling in the category, the $35,000 to $49,999 income range is the most frequent in Spring Valley CDP Lake County, accounting for 21.6% of all households. In contrast, only 9 households (2.5%) fall into the $200,000+ income bracket, making it the least populous group.
| Income Bracket | # Households | % Households |
| Less than $10,000 | 59 | 16.6% |
| $10,000 to $14,999 | 28 | 7.9% |
| $15,000 to $24,999 | 13 | 3.7% |
| $25,000 to $34,999 | 33 | 9.3% |
| $35,000 to $49,999 | 77 | 21.6% |
| $50,000 to $74,999 | 45 | 12.6% |
| $75,000 to $99,999 | 13 | 3.7% |
| $100,000 to $149,999 | 45 | 12.6% |
| $150,000 to $199,999 | 34 | 9.6% |
| $200,000+ | 9 | 2.5% |
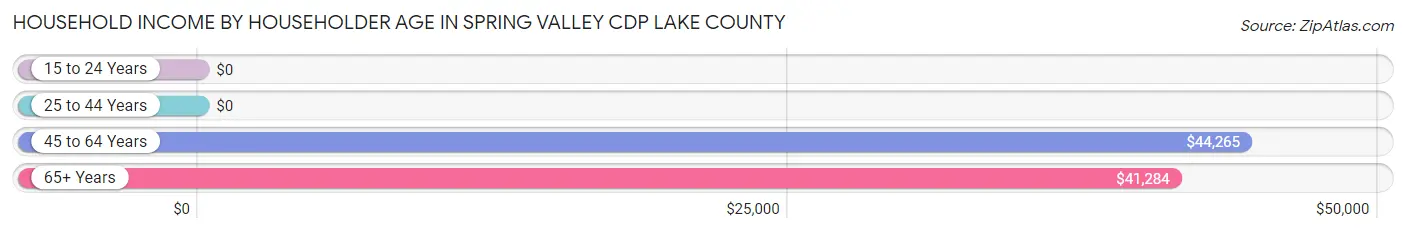
Household Income by Householder Age in Spring Valley CDP Lake County
The median household income in Spring Valley CDP Lake County is $41,486, with the highest median household income of $44,265 found in the 45 to 64 years age bracket for the primary householder. A total of 162 households (45.5%) fall into this category. Meanwhile, the 15 to 24 years age bracket for the primary householder has the lowest median household income of $0, with 14 households (3.9%) in this group.
| Income Bracket | # Households | Median Income |
| 15 to 24 Years | 14 (3.9%) | $0 |
| 25 to 44 Years | 14 (3.9%) | $0 |
| 45 to 64 Years | 162 (45.5%) | $44,265 |
| 65+ Years | 166 (46.6%) | $41,284 |
| Total | 356 (100.0%) | $41,486 |
Poverty in Spring Valley CDP Lake County
Income Below Poverty by Sex and Age in Spring Valley CDP Lake County
With 14.0% poverty level for males and 19.9% for females among the residents of Spring Valley CDP Lake County, 16 and 17 year old males and 15 year old females are the most vulnerable to poverty, with 4 males (100.0%) and 6 females (100.0%) in their respective age groups living below the poverty level.
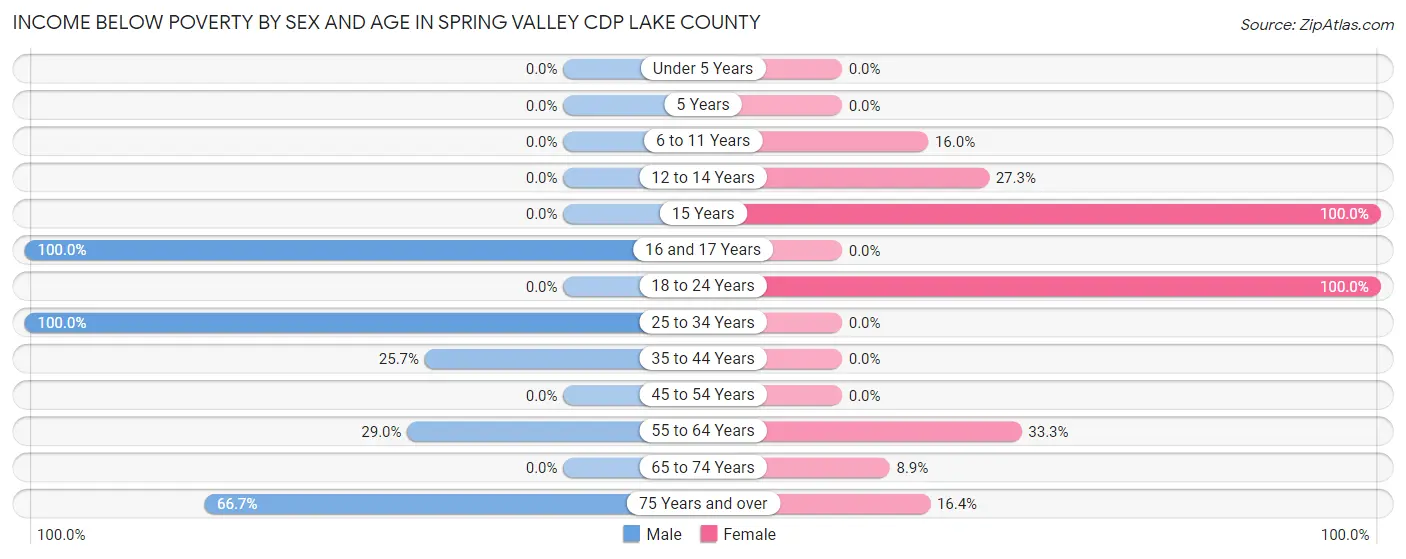
| Age Bracket | Male | Female |
| Under 5 Years | 0 (0.0%) | 0 (0.0%) |
| 5 Years | 0 (0.0%) | 0 (0.0%) |
| 6 to 11 Years | 0 (0.0%) | 4 (16.0%) |
| 12 to 14 Years | 0 (0.0%) | 9 (27.3%) |
| 15 Years | 0 (0.0%) | 6 (100.0%) |
| 16 and 17 Years | 4 (100.0%) | 0 (0.0%) |
| 18 to 24 Years | 0 (0.0%) | 14 (100.0%) |
| 25 to 34 Years | 7 (100.0%) | 0 (0.0%) |
| 35 to 44 Years | 9 (25.7%) | 0 (0.0%) |
| 45 to 54 Years | 0 (0.0%) | 0 (0.0%) |
| 55 to 64 Years | 22 (28.9%) | 48 (33.3%) |
| 65 to 74 Years | 0 (0.0%) | 7 (8.9%) |
| 75 Years and over | 12 (66.7%) | 9 (16.4%) |
| Total | 54 (14.0%) | 97 (19.9%) |
Income Above Poverty by Sex and Age in Spring Valley CDP Lake County
According to the poverty statistics in Spring Valley CDP Lake County, males aged under 5 years and females aged 16 and 17 years are the age groups that are most secure financially, with 100.0% of males and 100.0% of females in these age groups living above the poverty line.
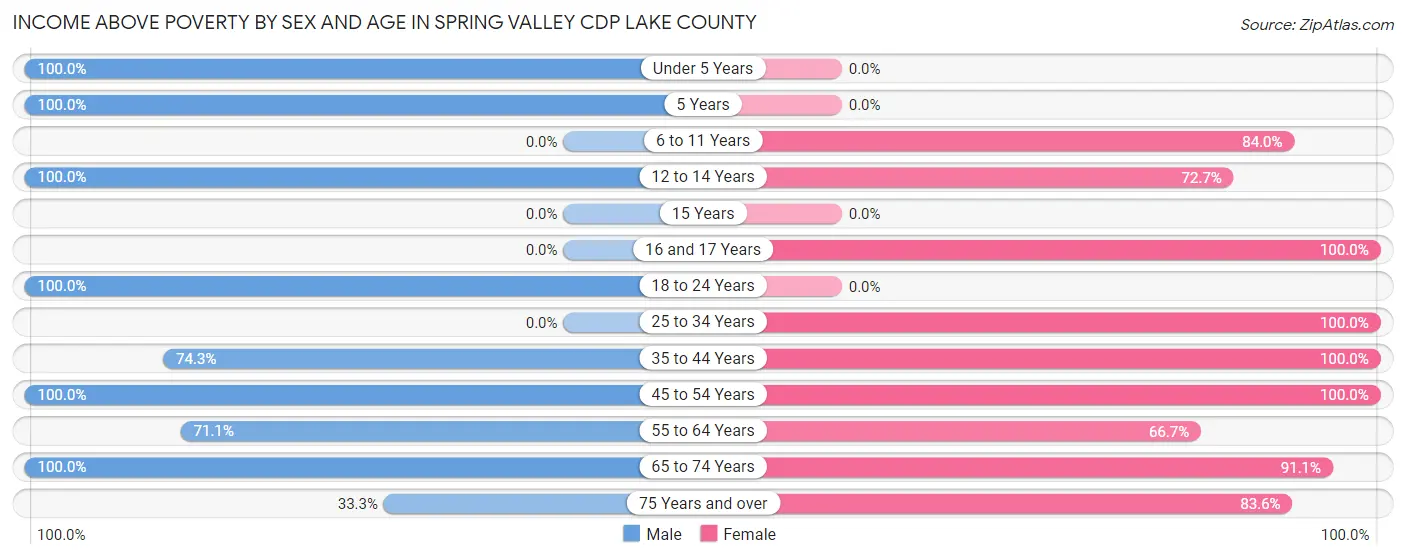
| Age Bracket | Male | Female |
| Under 5 Years | 39 (100.0%) | 0 (0.0%) |
| 5 Years | 7 (100.0%) | 0 (0.0%) |
| 6 to 11 Years | 0 (0.0%) | 21 (84.0%) |
| 12 to 14 Years | 6 (100.0%) | 24 (72.7%) |
| 15 Years | 0 (0.0%) | 0 (0.0%) |
| 16 and 17 Years | 0 (0.0%) | 60 (100.0%) |
| 18 to 24 Years | 81 (100.0%) | 0 (0.0%) |
| 25 to 34 Years | 0 (0.0%) | 36 (100.0%) |
| 35 to 44 Years | 26 (74.3%) | 14 (100.0%) |
| 45 to 54 Years | 15 (100.0%) | 22 (100.0%) |
| 55 to 64 Years | 54 (71.1%) | 96 (66.7%) |
| 65 to 74 Years | 97 (100.0%) | 72 (91.1%) |
| 75 Years and over | 6 (33.3%) | 46 (83.6%) |
| Total | 331 (86.0%) | 391 (80.1%) |
Income Below Poverty Among Married-Couple Families in Spring Valley CDP Lake County
The poverty statistics for married-couple families in Spring Valley CDP Lake County show that 22.8% or 29 of the total 127 families live below the poverty line. Families with no children have the highest poverty rate of 31.2%, comprising of 29 families. On the other hand, families with 1 or 2 children have the lowest poverty rate of 0.0%, which includes 0 families.
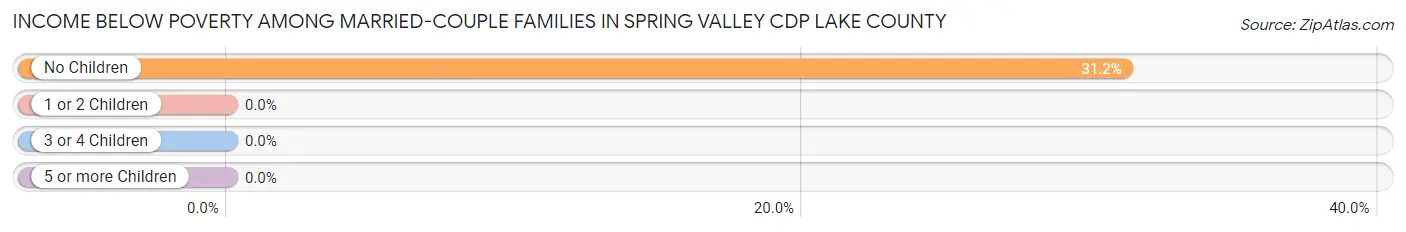
| Children | Above Poverty | Below Poverty |
| No Children | 64 (68.8%) | 29 (31.2%) |
| 1 or 2 Children | 34 (100.0%) | 0 (0.0%) |
| 3 or 4 Children | 0 (0.0%) | 0 (0.0%) |
| 5 or more Children | 0 (0.0%) | 0 (0.0%) |
| Total | 98 (77.2%) | 29 (22.8%) |
Income Below Poverty Among Single-Parent Households in Spring Valley CDP Lake County
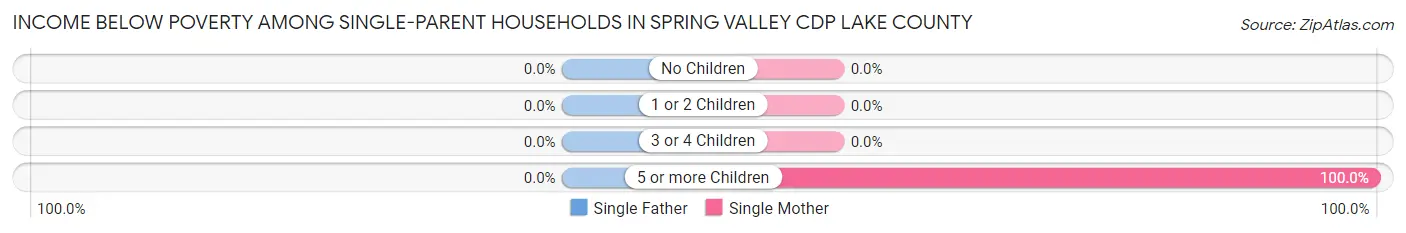
| Children | Single Father | Single Mother |
| No Children | 0 (0.0%) | 0 (0.0%) |
| 1 or 2 Children | 0 (0.0%) | 0 (0.0%) |
| 3 or 4 Children | 0 (0.0%) | 0 (0.0%) |
| 5 or more Children | 0 (0.0%) | 5 (100.0%) |
| Total | 0 (0.0%) | 5 (9.6%) |
Income Below Poverty Among Married-Couple vs Single-Parent Households in Spring Valley CDP Lake County
The poverty data for Spring Valley CDP Lake County shows that 29 of the married-couple family households (22.8%) and 5 of the single-parent households (6.9%) are living below the poverty level. Within the married-couple family households, those with no children have the highest poverty rate, with 29 households (31.2%) falling below the poverty line. Among the single-parent households, those with 5 or more children have the highest poverty rate, with 5 household (100.0%) living below poverty.
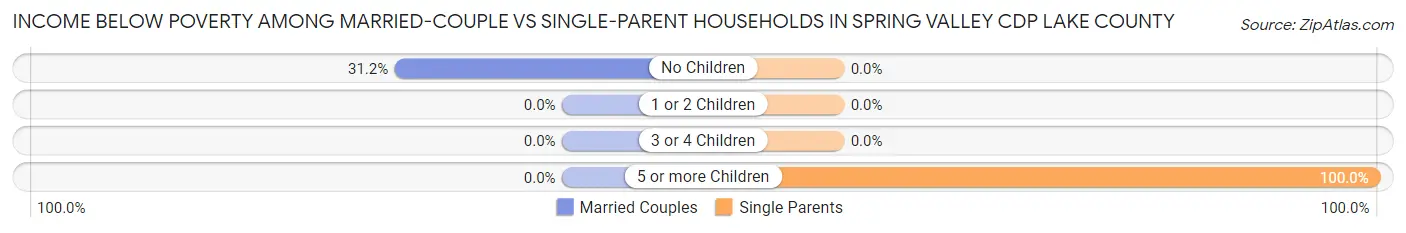
| Children | Married-Couple Families | Single-Parent Households |
| No Children | 29 (31.2%) | 0 (0.0%) |
| 1 or 2 Children | 0 (0.0%) | 0 (0.0%) |
| 3 or 4 Children | 0 (0.0%) | 0 (0.0%) |
| 5 or more Children | 0 (0.0%) | 5 (100.0%) |
| Total | 29 (22.8%) | 5 (6.9%) |
Race in Spring Valley CDP Lake County
The most populous races in Spring Valley CDP Lake County are White / Caucasian (748 | 84.1%), Hispanic or Latino (161 | 18.1%), and Some other Race (74 | 8.3%).
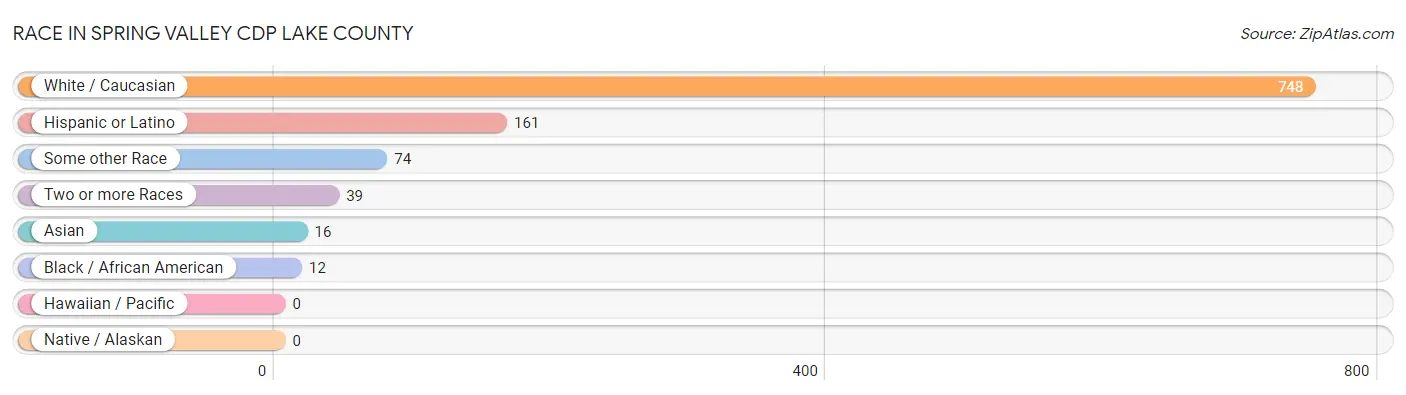
| Race | # Population | % Population |
| Asian | 16 | 1.8% |
| Black / African American | 12 | 1.3% |
| Hawaiian / Pacific | 0 | 0.0% |
| Hispanic or Latino | 161 | 18.1% |
| Native / Alaskan | 0 | 0.0% |
| White / Caucasian | 748 | 84.1% |
| Two or more Races | 39 | 4.4% |
| Some other Race | 74 | 8.3% |
| Total | 889 | 100.0% |
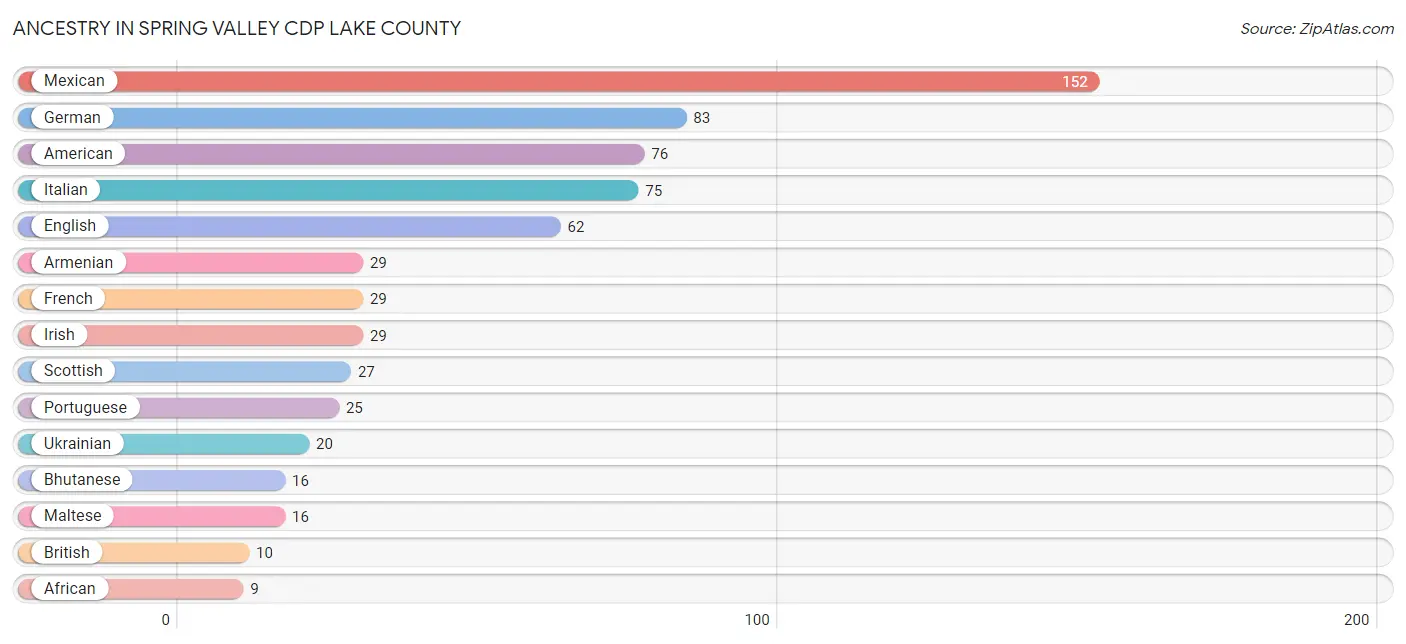
Ancestry in Spring Valley CDP Lake County
The most populous ancestries reported in Spring Valley CDP Lake County are Mexican (152 | 17.1%), German (83 | 9.3%), American (76 | 8.6%), Italian (75 | 8.4%), and English (62 | 7.0%), together accounting for 50.4% of all Spring Valley CDP Lake County residents.
| Ancestry | # Population | % Population |
| African | 9 | 1.0% |
| American | 76 | 8.6% |
| Armenian | 29 | 3.3% |
| Austrian | 8 | 0.9% |
| Bhutanese | 16 | 1.8% |
| British | 10 | 1.1% |
| Czech | 9 | 1.0% |
| Danish | 6 | 0.7% |
| Dutch | 8 | 0.9% |
| English | 62 | 7.0% |
| Finnish | 7 | 0.8% |
| French | 29 | 3.3% |
| German | 83 | 9.3% |
| Irish | 29 | 3.3% |
| Italian | 75 | 8.4% |
| Maltese | 16 | 1.8% |
| Mexican | 152 | 17.1% |
| Portuguese | 25 | 2.8% |
| Pueblo | 5 | 0.6% |
| Scottish | 27 | 3.0% |
| Spanish | 9 | 1.0% |
| Subsaharan African | 9 | 1.0% |
| Ukrainian | 20 | 2.2% | View All 23 Rows |
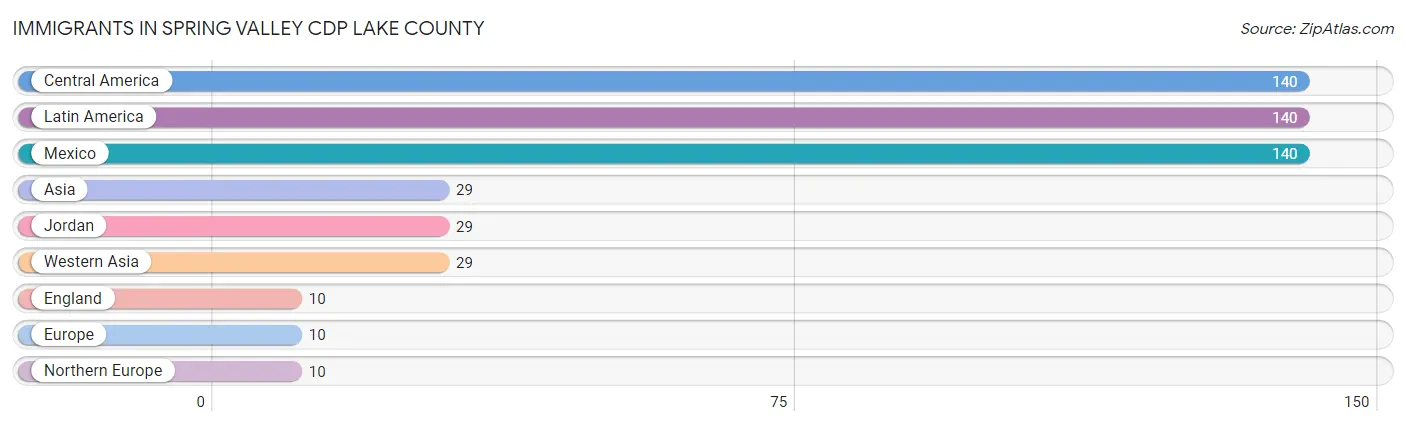
Immigrants in Spring Valley CDP Lake County
The most numerous immigrant groups reported in Spring Valley CDP Lake County came from Central America (140 | 15.8%), Latin America (140 | 15.8%), Mexico (140 | 15.8%), Asia (29 | 3.3%), and Jordan (29 | 3.3%), together accounting for 53.8% of all Spring Valley CDP Lake County residents.
| Immigration Origin | # Population | % Population |
| Asia | 29 | 3.3% |
| Central America | 140 | 15.8% |
| England | 10 | 1.1% |
| Europe | 10 | 1.1% |
| Jordan | 29 | 3.3% |
| Latin America | 140 | 15.8% |
| Mexico | 140 | 15.8% |
| Northern Europe | 10 | 1.1% |
| Western Asia | 29 | 3.3% | View All 9 Rows |
Sex and Age in Spring Valley CDP Lake County
Sex and Age in Spring Valley CDP Lake County
The most populous age groups in Spring Valley CDP Lake County are 15 to 19 Years (85 | 22.1%) for men and 55 to 59 Years (95 | 18.9%) for women.
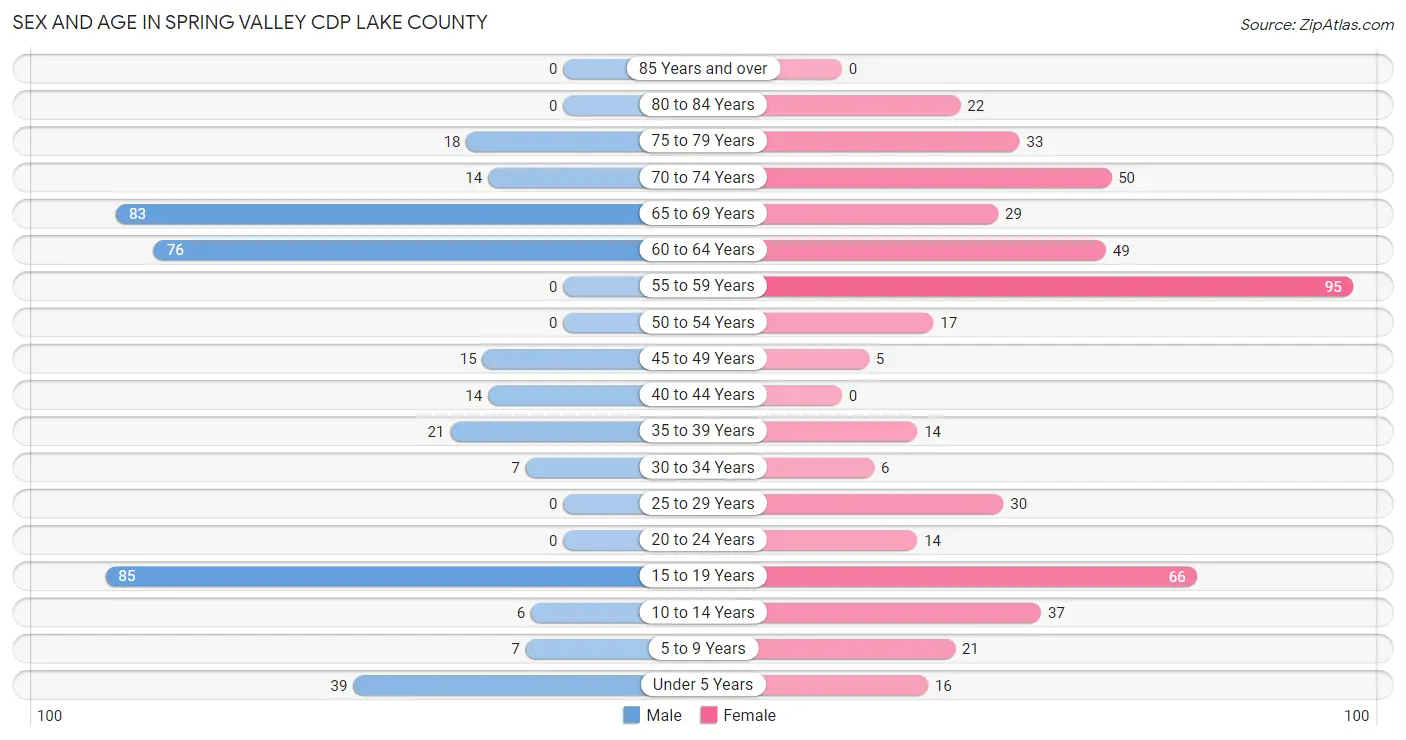
| Age Bracket | Male | Female |
| Under 5 Years | 39 (10.1%) | 16 (3.2%) |
| 5 to 9 Years | 7 (1.8%) | 21 (4.2%) |
| 10 to 14 Years | 6 (1.6%) | 37 (7.3%) |
| 15 to 19 Years | 85 (22.1%) | 66 (13.1%) |
| 20 to 24 Years | 0 (0.0%) | 14 (2.8%) |
| 25 to 29 Years | 0 (0.0%) | 30 (5.9%) |
| 30 to 34 Years | 7 (1.8%) | 6 (1.2%) |
| 35 to 39 Years | 21 (5.4%) | 14 (2.8%) |
| 40 to 44 Years | 14 (3.6%) | 0 (0.0%) |
| 45 to 49 Years | 15 (3.9%) | 5 (1.0%) |
| 50 to 54 Years | 0 (0.0%) | 17 (3.4%) |
| 55 to 59 Years | 0 (0.0%) | 95 (18.9%) |
| 60 to 64 Years | 76 (19.7%) | 49 (9.7%) |
| 65 to 69 Years | 83 (21.6%) | 29 (5.8%) |
| 70 to 74 Years | 14 (3.6%) | 50 (9.9%) |
| 75 to 79 Years | 18 (4.7%) | 33 (6.6%) |
| 80 to 84 Years | 0 (0.0%) | 22 (4.4%) |
| 85 Years and over | 0 (0.0%) | 0 (0.0%) |
| Total | 385 (100.0%) | 504 (100.0%) |
Families and Households in Spring Valley CDP Lake County
Median Family Size in Spring Valley CDP Lake County
The median family size in Spring Valley CDP Lake County is 3.51 persons per family, with single male/father families (21 | 10.5%) accounting for the largest median family size of 4.48 persons per family. On the other hand, married-couple families (127 | 63.5%) represent the smallest median family size with 3.15 persons per family.
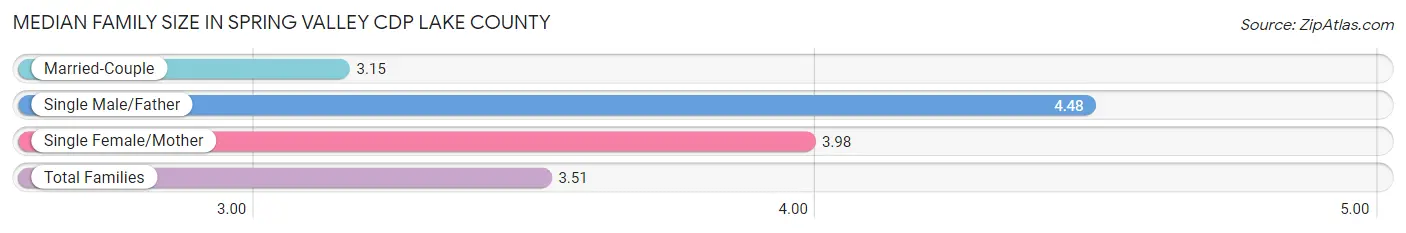
| Family Type | # Families | Family Size |
| Married-Couple | 127 (63.5%) | 3.15 |
| Single Male/Father | 21 (10.5%) | 4.48 |
| Single Female/Mother | 52 (26.0%) | 3.98 |
| Total Families | 200 (100.0%) | 3.51 |
Median Household Size in Spring Valley CDP Lake County
The median household size in Spring Valley CDP Lake County is 2.50 persons per household, with single male/father households (21 | 5.9%) accounting for the largest median household size of 4.9 persons per household. non-family households (156 | 43.8%) represent the smallest median household size with 1.10 persons per household.
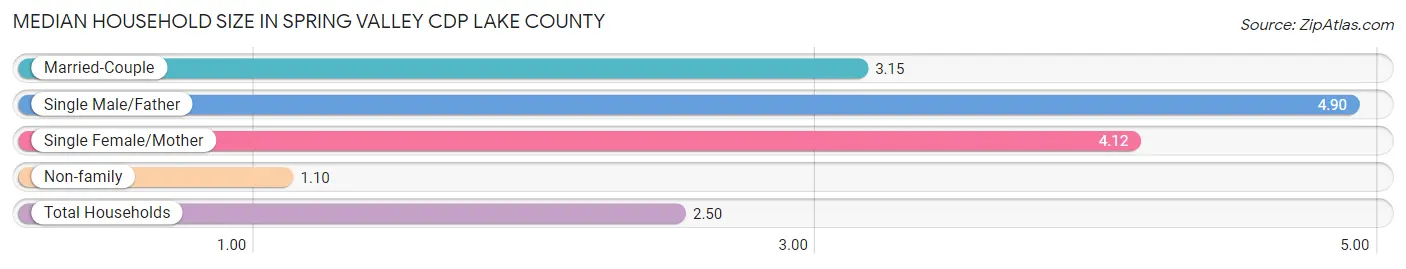
| Household Type | # Households | Household Size |
| Married-Couple | 127 (35.7%) | 3.15 |
| Single Male/Father | 21 (5.9%) | 4.90 |
| Single Female/Mother | 52 (14.6%) | 4.12 |
| Non-family | 156 (43.8%) | 1.10 |
| Total Households | 356 (100.0%) | 2.50 |
Household Size by Marriage Status in Spring Valley CDP Lake County
Out of a total of 356 households in Spring Valley CDP Lake County, 200 (56.2%) are family households, while 156 (43.8%) are nonfamily households. The most numerous type of family households are 2-person households, comprising 106, and the most common type of nonfamily households are 1-person households, comprising 147.
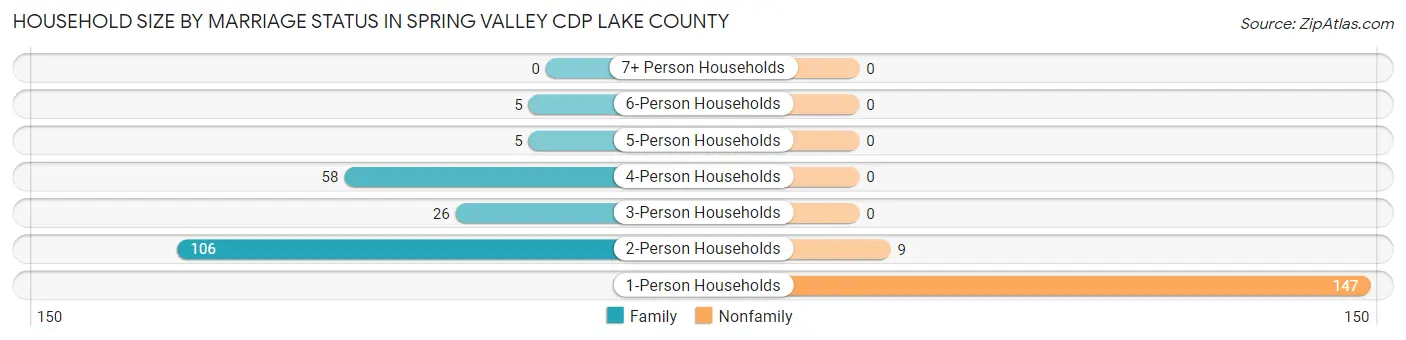
| Household Size | Family Households | Nonfamily Households |
| 1-Person Households | - | 147 (41.3%) |
| 2-Person Households | 106 (29.8%) | 9 (2.5%) |
| 3-Person Households | 26 (7.3%) | 0 (0.0%) |
| 4-Person Households | 58 (16.3%) | 0 (0.0%) |
| 5-Person Households | 5 (1.4%) | 0 (0.0%) |
| 6-Person Households | 5 (1.4%) | 0 (0.0%) |
| 7+ Person Households | 0 (0.0%) | 0 (0.0%) |
| Total | 200 (56.2%) | 156 (43.8%) |
Female Fertility in Spring Valley CDP Lake County
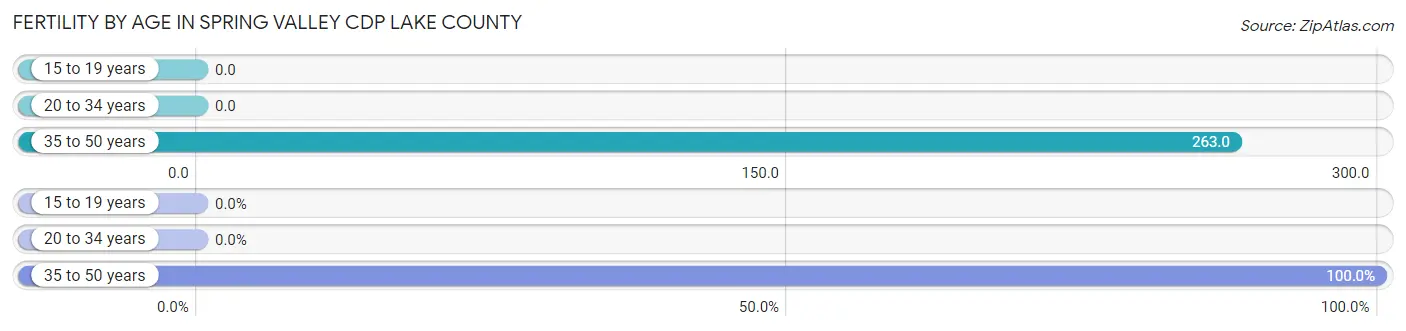
Fertility by Age in Spring Valley CDP Lake County
Average fertility rate in Spring Valley CDP Lake County is 37.0 births per 1,000 women. Women in the age bracket of 35 to 50 years have the highest fertility rate with 263.0 births per 1,000 women. Women in the age bracket of 35 to 50 years acount for 100.0% of all women with births.
| Age Bracket | Women with Births | Births / 1,000 Women |
| 15 to 19 years | 0 (0.0%) | 0.0 |
| 20 to 34 years | 0 (0.0%) | 0.0 |
| 35 to 50 years | 5 (100.0%) | 263.0 |
| Total | 5 (100.0%) | 37.0 |
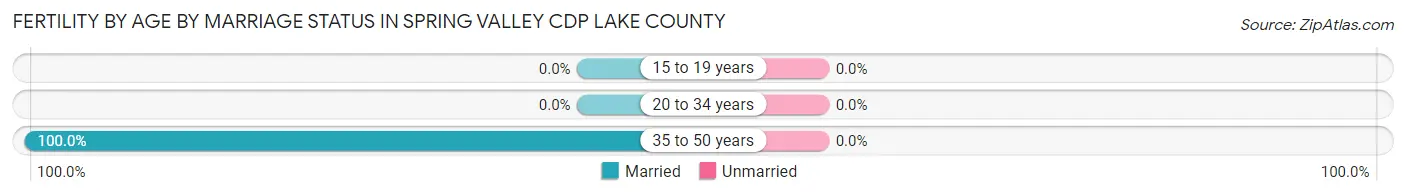
Fertility by Age by Marriage Status in Spring Valley CDP Lake County
| Age Bracket | Married | Unmarried |
| 15 to 19 years | 0 (0.0%) | 0 (0.0%) |
| 20 to 34 years | 0 (0.0%) | 0 (0.0%) |
| 35 to 50 years | 5 (100.0%) | 0 (0.0%) |
| Total | 5 (100.0%) | 0 (0.0%) |
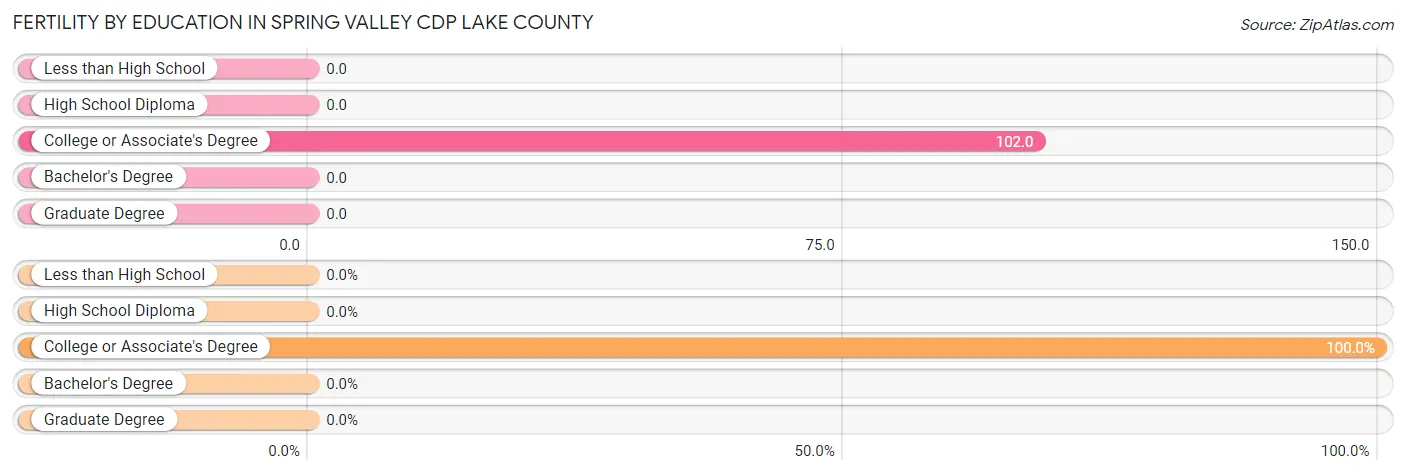
Fertility by Education in Spring Valley CDP Lake County
| Educational Attainment | Women with Births | Births / 1,000 Women |
| Less than High School | 0 (0.0%) | 0.0 |
| High School Diploma | 0 (0.0%) | 0.0 |
| College or Associate's Degree | 5 (100.0%) | 102.0 |
| Bachelor's Degree | 0 (0.0%) | 0.0 |
| Graduate Degree | 0 (0.0%) | 0.0 |
| Total | 5 (100.0%) | 37.0 |
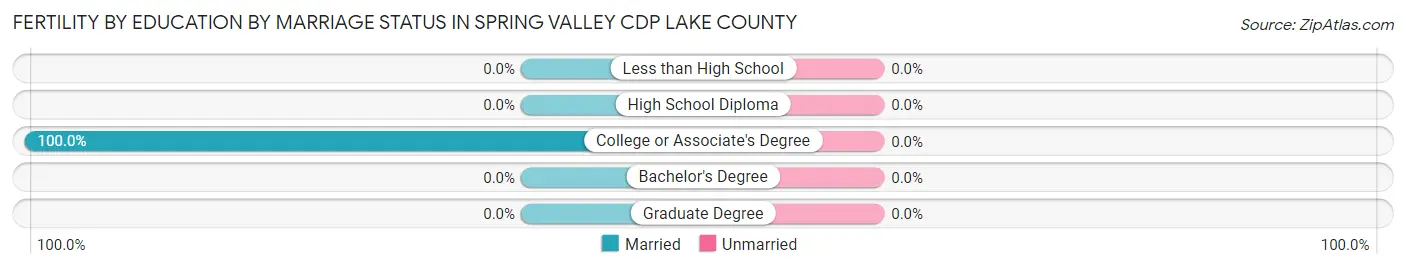
Fertility by Education by Marriage Status in Spring Valley CDP Lake County
| Educational Attainment | Married | Unmarried |
| Less than High School | 0 (0.0%) | 0 (0.0%) |
| High School Diploma | 0 (0.0%) | 0 (0.0%) |
| College or Associate's Degree | 5 (100.0%) | 0 (0.0%) |
| Bachelor's Degree | 0 (0.0%) | 0 (0.0%) |
| Graduate Degree | 0 (0.0%) | 0 (0.0%) |
| Total | 5 (100.0%) | 0 (0.0%) |
Employment Characteristics in Spring Valley CDP Lake County
Employment by Class of Employer in Spring Valley CDP Lake County
Among the 251 employed individuals in Spring Valley CDP Lake County, private company employees (152 | 60.6%), local government employees (34 | 13.6%), and self-employed (not incorporated) (31 | 12.3%) make up the most common classes of employment.
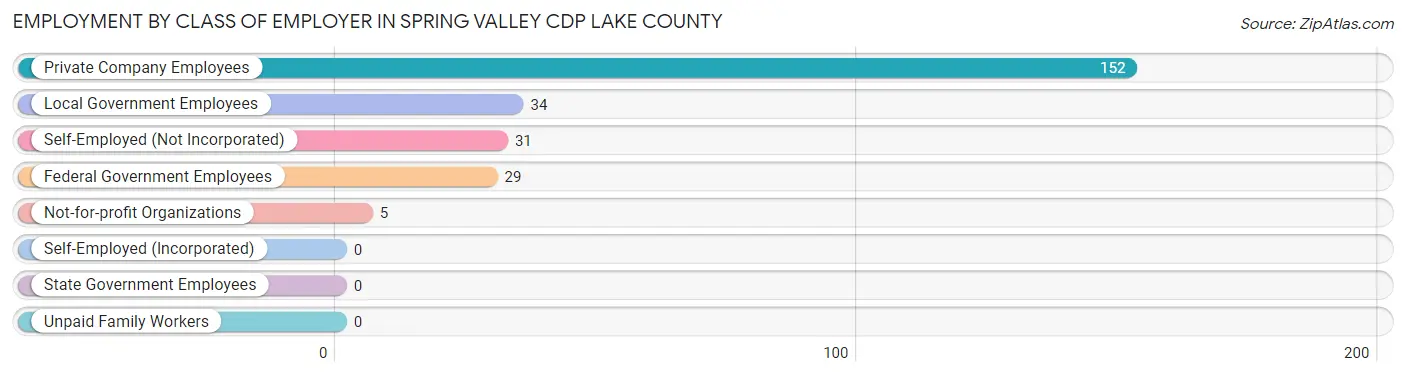
| Employer Class | # Employees | % Employees |
| Private Company Employees | 152 | 60.6% |
| Self-Employed (Incorporated) | 0 | 0.0% |
| Self-Employed (Not Incorporated) | 31 | 12.3% |
| Not-for-profit Organizations | 5 | 2.0% |
| Local Government Employees | 34 | 13.6% |
| State Government Employees | 0 | 0.0% |
| Federal Government Employees | 29 | 11.6% |
| Unpaid Family Workers | 0 | 0.0% |
| Total | 251 | 100.0% |
Employment Status by Age in Spring Valley CDP Lake County
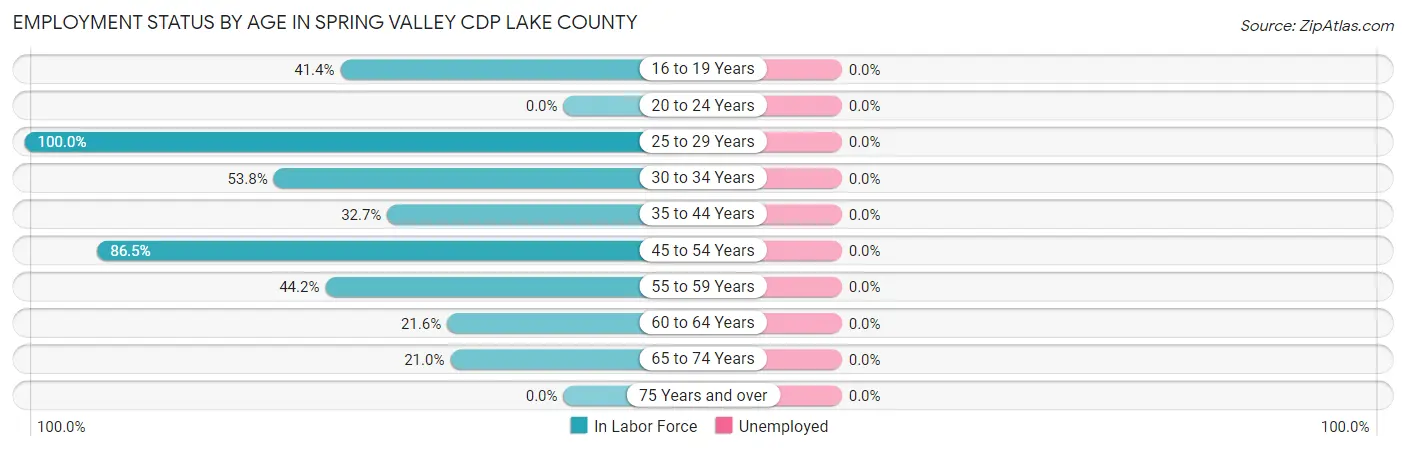
| Age Bracket | In Labor Force | Unemployed |
| 16 to 19 Years | 60 (41.4%) | 0 (0.0%) |
| 20 to 24 Years | 0 (0.0%) | 0 (0.0%) |
| 25 to 29 Years | 30 (100.0%) | 0 (0.0%) |
| 30 to 34 Years | 7 (53.8%) | 0 (0.0%) |
| 35 to 44 Years | 16 (32.7%) | 0 (0.0%) |
| 45 to 54 Years | 32 (86.5%) | 0 (0.0%) |
| 55 to 59 Years | 42 (44.2%) | 0 (0.0%) |
| 60 to 64 Years | 27 (21.6%) | 0 (0.0%) |
| 65 to 74 Years | 37 (21.0%) | 0 (0.0%) |
| 75 Years and over | 0 (0.0%) | 0 (0.0%) |
| Total | 251 (33.2%) | 0 (0.0%) |
Employment Status by Educational Attainment in Spring Valley CDP Lake County
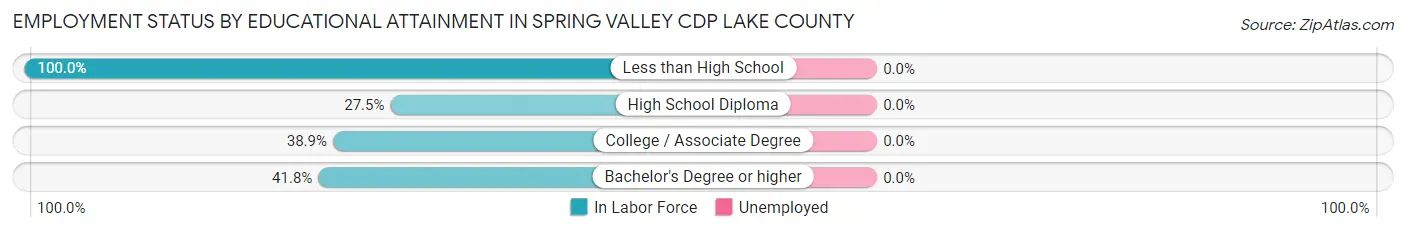
| Educational Attainment | In Labor Force | Unemployed |
| Less than High School | 41 (100.0%) | 0 (0.0%) |
| High School Diploma | 22 (27.5%) | 0 (0.0%) |
| College / Associate Degree | 58 (38.9%) | 0 (0.0%) |
| Bachelor's Degree or higher | 33 (41.8%) | 0 (0.0%) |
| Total | 154 (44.1%) | 0 (0.0%) |
Employment Occupations by Sex in Spring Valley CDP Lake County
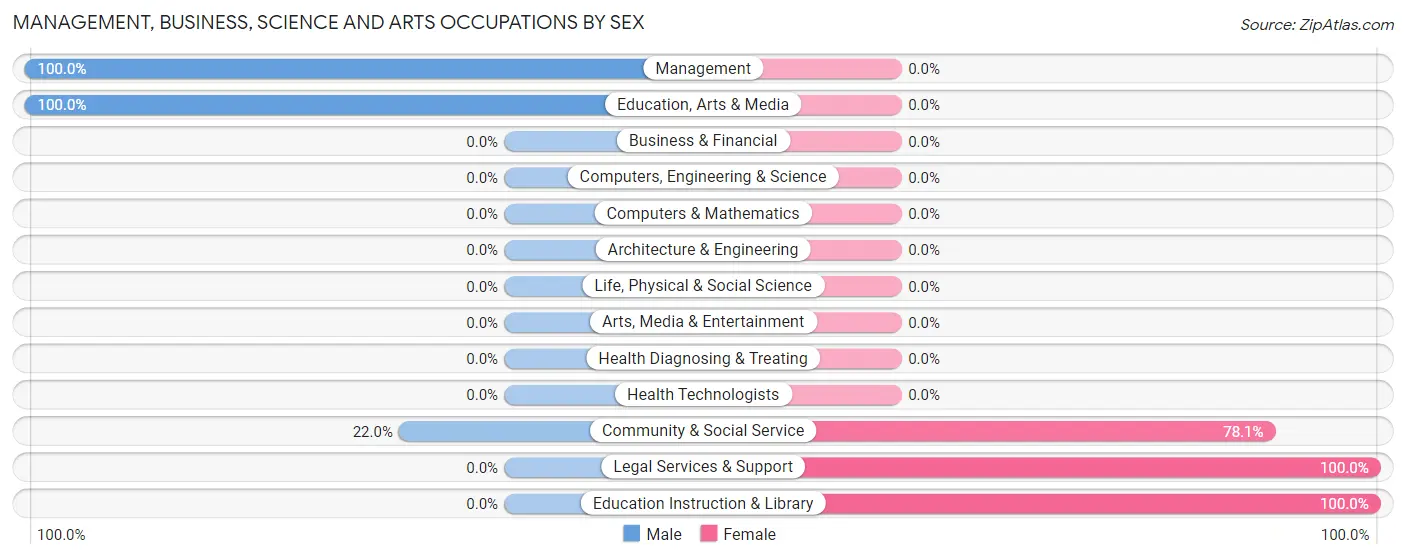
Management, Business, Science and Arts Occupations
The most common Management, Business, Science and Arts occupations in Spring Valley CDP Lake County are Community & Social Service (41 | 16.3%), Education Instruction & Library (24 | 9.6%), Education, Arts & Media (9 | 3.6%), Legal Services & Support (8 | 3.2%), and Management (7 | 2.8%).
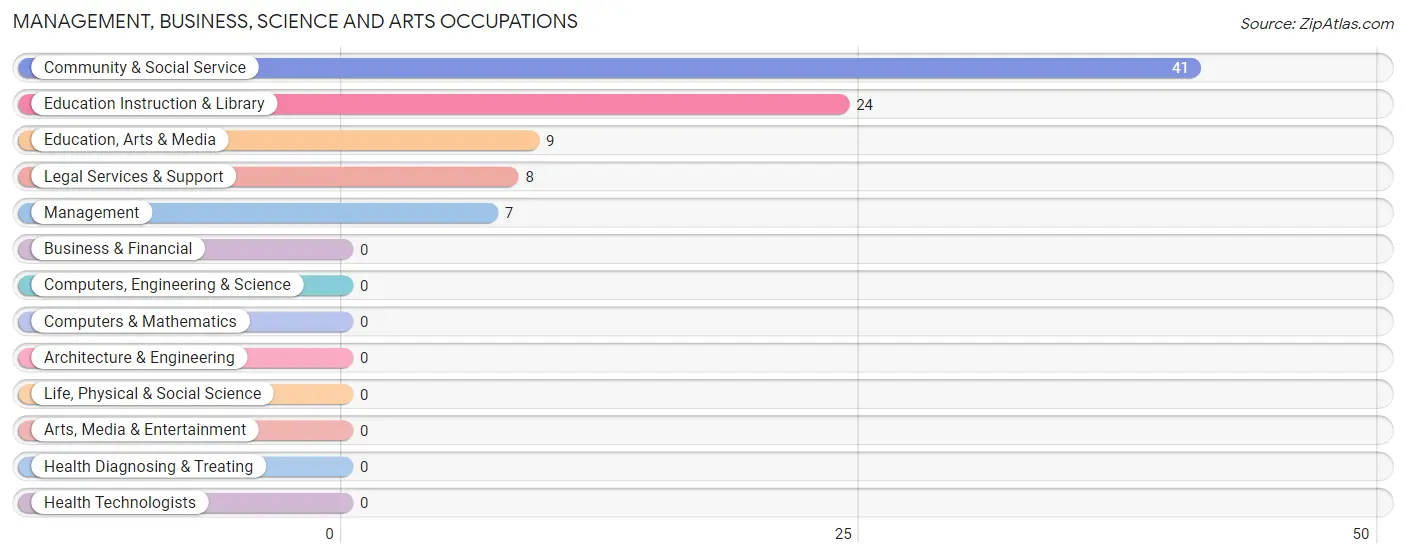
Management, Business, Science and Arts Occupations by Sex
Within the Management, Business, Science and Arts occupations in Spring Valley CDP Lake County, the most male-oriented occupations are Management (100.0%), Education, Arts & Media (100.0%), and Community & Social Service (22.0%), while the most female-oriented occupations are Legal Services & Support (100.0%), Education Instruction & Library (100.0%), and Community & Social Service (78.0%).
| Occupation | Male | Female |
| Management | 7 (100.0%) | 0 (0.0%) |
| Business & Financial | 0 (0.0%) | 0 (0.0%) |
| Computers, Engineering & Science | 0 (0.0%) | 0 (0.0%) |
| Computers & Mathematics | 0 (0.0%) | 0 (0.0%) |
| Architecture & Engineering | 0 (0.0%) | 0 (0.0%) |
| Life, Physical & Social Science | 0 (0.0%) | 0 (0.0%) |
| Community & Social Service | 9 (22.0%) | 32 (78.0%) |
| Education, Arts & Media | 9 (100.0%) | 0 (0.0%) |
| Legal Services & Support | 0 (0.0%) | 8 (100.0%) |
| Education Instruction & Library | 0 (0.0%) | 24 (100.0%) |
| Arts, Media & Entertainment | 0 (0.0%) | 0 (0.0%) |
| Health Diagnosing & Treating | 0 (0.0%) | 0 (0.0%) |
| Health Technologists | 0 (0.0%) | 0 (0.0%) |
| Total (Category) | 16 (33.3%) | 32 (66.7%) |
| Total (Overall) | 84 (33.5%) | 167 (66.5%) |
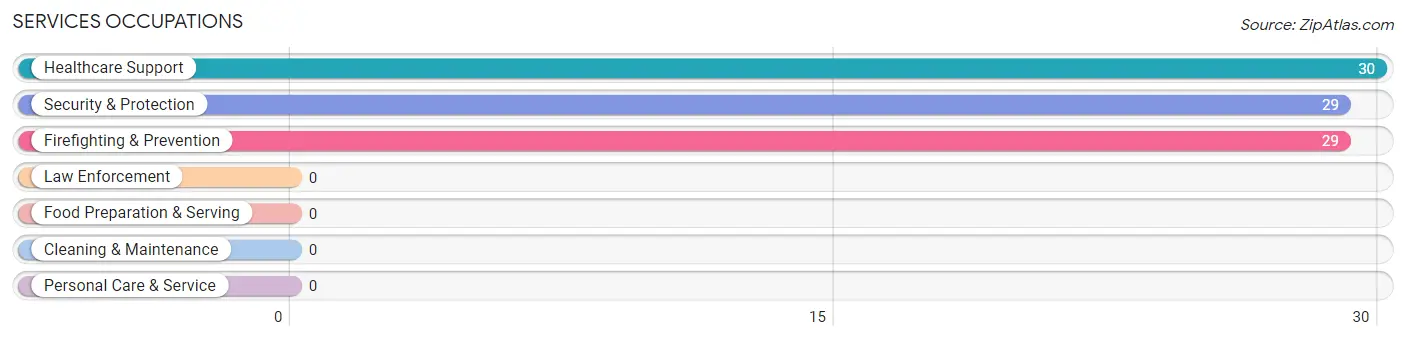
Services Occupations
The most common Services occupations in Spring Valley CDP Lake County are Healthcare Support (30 | 11.9%), Security & Protection (29 | 11.6%), and Firefighting & Prevention (29 | 11.6%).
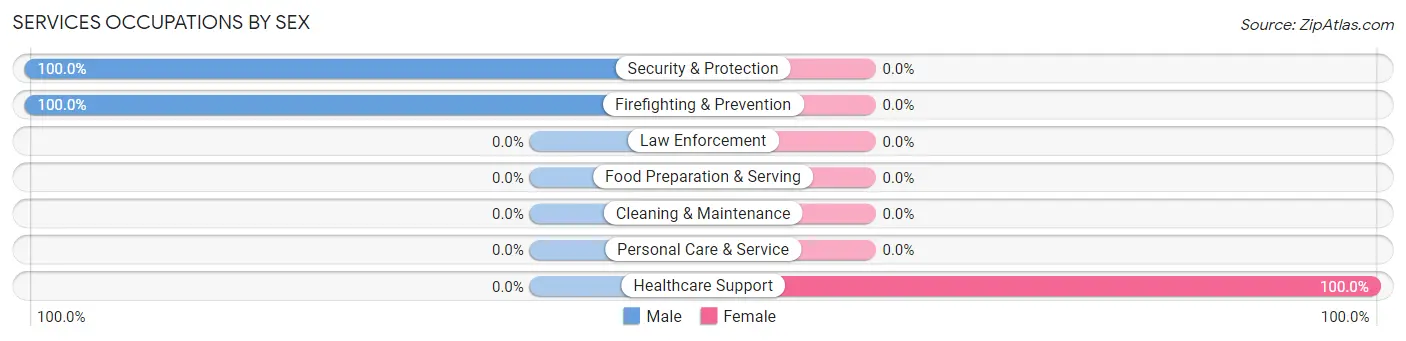
Services Occupations by Sex
| Occupation | Male | Female |
| Healthcare Support | 0 (0.0%) | 30 (100.0%) |
| Security & Protection | 29 (100.0%) | 0 (0.0%) |
| Firefighting & Prevention | 29 (100.0%) | 0 (0.0%) |
| Law Enforcement | 0 (0.0%) | 0 (0.0%) |
| Food Preparation & Serving | 0 (0.0%) | 0 (0.0%) |
| Cleaning & Maintenance | 0 (0.0%) | 0 (0.0%) |
| Personal Care & Service | 0 (0.0%) | 0 (0.0%) |
| Total (Category) | 29 (49.1%) | 30 (50.8%) |
| Total (Overall) | 84 (33.5%) | 167 (66.5%) |
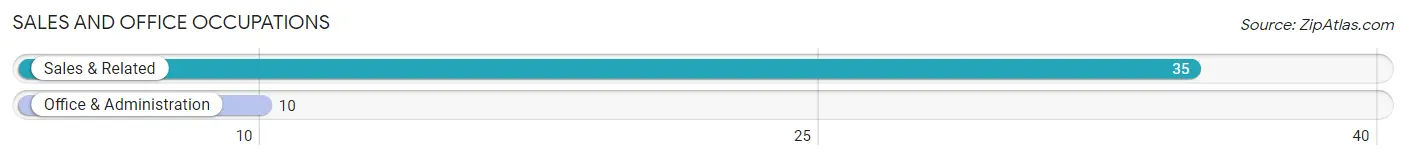
Sales and Office Occupations
The most common Sales and Office occupations in Spring Valley CDP Lake County are Sales & Related (35 | 13.9%), and Office & Administration (10 | 4.0%).
Sales and Office Occupations by Sex
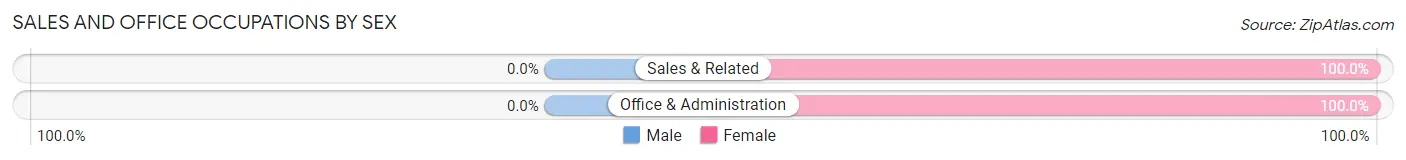
| Occupation | Male | Female |
| Sales & Related | 0 (0.0%) | 35 (100.0%) |
| Office & Administration | 0 (0.0%) | 10 (100.0%) |
| Total (Category) | 0 (0.0%) | 45 (100.0%) |
| Total (Overall) | 84 (33.5%) | 167 (66.5%) |
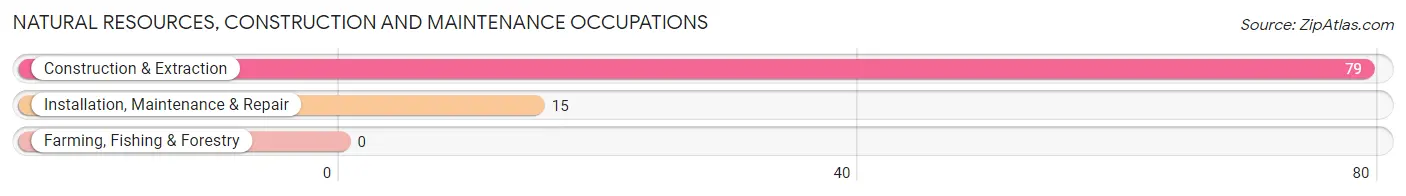
Natural Resources, Construction and Maintenance Occupations
The most common Natural Resources, Construction and Maintenance occupations in Spring Valley CDP Lake County are Construction & Extraction (79 | 31.5%), and Installation, Maintenance & Repair (15 | 6.0%).
Natural Resources, Construction and Maintenance Occupations by Sex
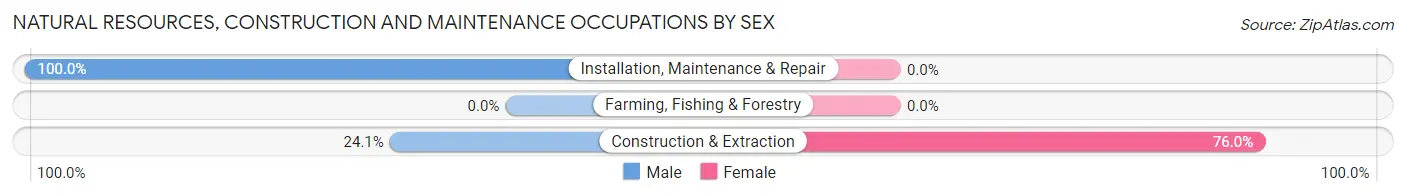
| Occupation | Male | Female |
| Farming, Fishing & Forestry | 0 (0.0%) | 0 (0.0%) |
| Construction & Extraction | 19 (24.0%) | 60 (75.9%) |
| Installation, Maintenance & Repair | 15 (100.0%) | 0 (0.0%) |
| Total (Category) | 34 (36.2%) | 60 (63.8%) |
| Total (Overall) | 84 (33.5%) | 167 (66.5%) |
Production, Transportation and Moving Occupations
The most common Production, Transportation and Moving occupations in Spring Valley CDP Lake County are , and Transportation (5 | 2.0%).
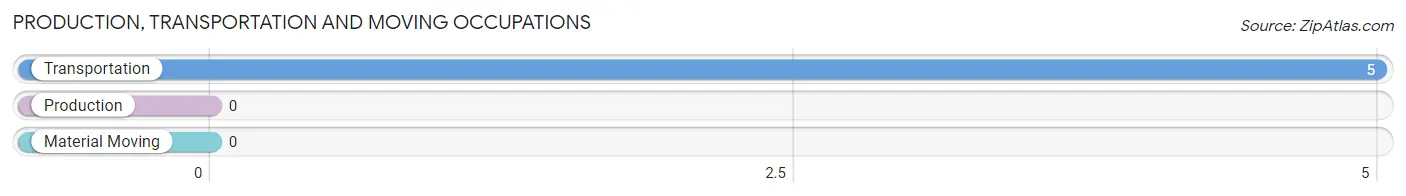
Production, Transportation and Moving Occupations by Sex
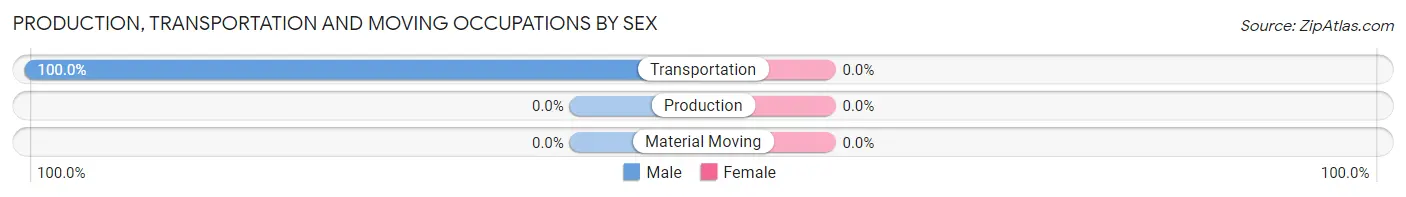
| Occupation | Male | Female |
| Production | 0 (0.0%) | 0 (0.0%) |
| Transportation | 5 (100.0%) | 0 (0.0%) |
| Material Moving | 0 (0.0%) | 0 (0.0%) |
| Total (Category) | 5 (100.0%) | 0 (0.0%) |
| Total (Overall) | 84 (33.5%) | 167 (66.5%) |
Employment Industries by Sex in Spring Valley CDP Lake County
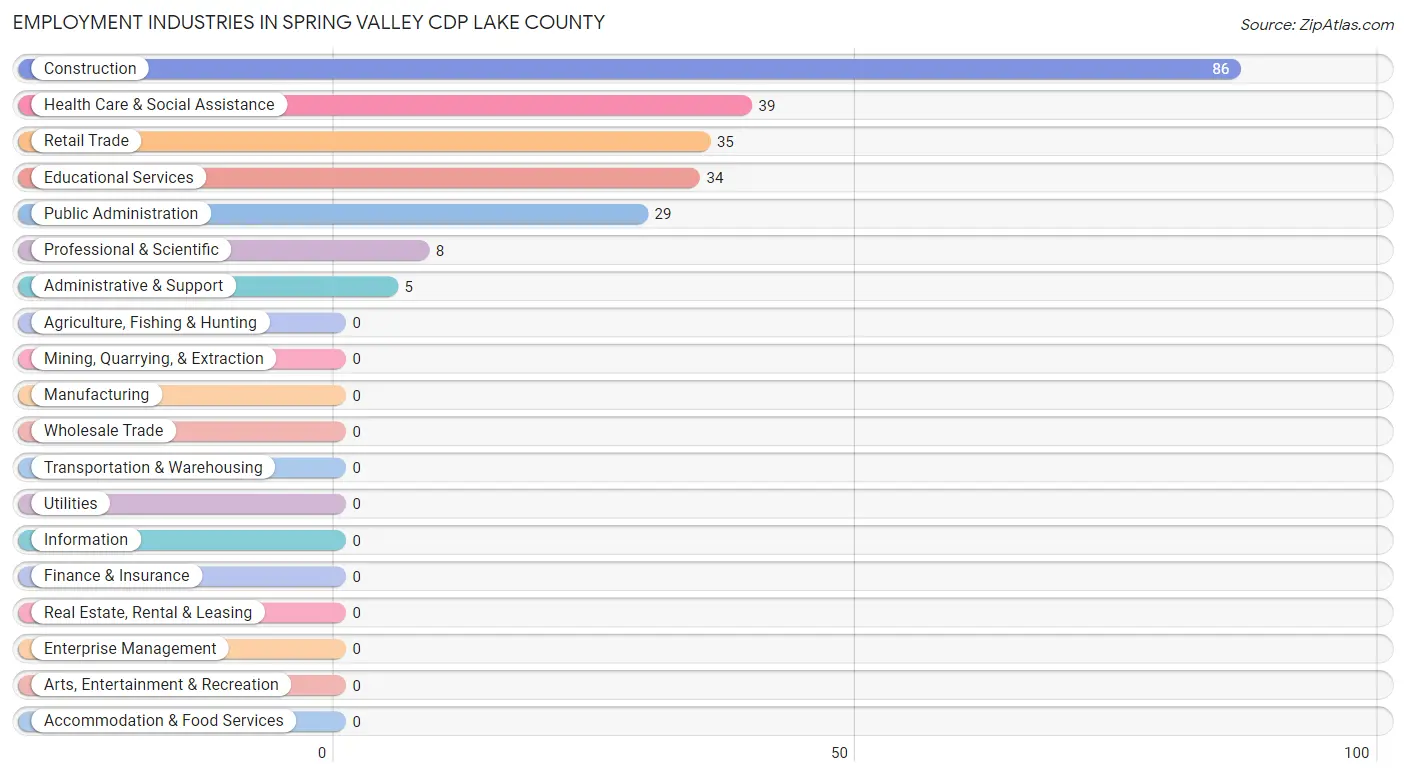
Employment Industries in Spring Valley CDP Lake County
The major employment industries in Spring Valley CDP Lake County include Construction (86 | 34.3%), Health Care & Social Assistance (39 | 15.5%), Retail Trade (35 | 13.9%), Educational Services (34 | 13.6%), and Public Administration (29 | 11.6%).
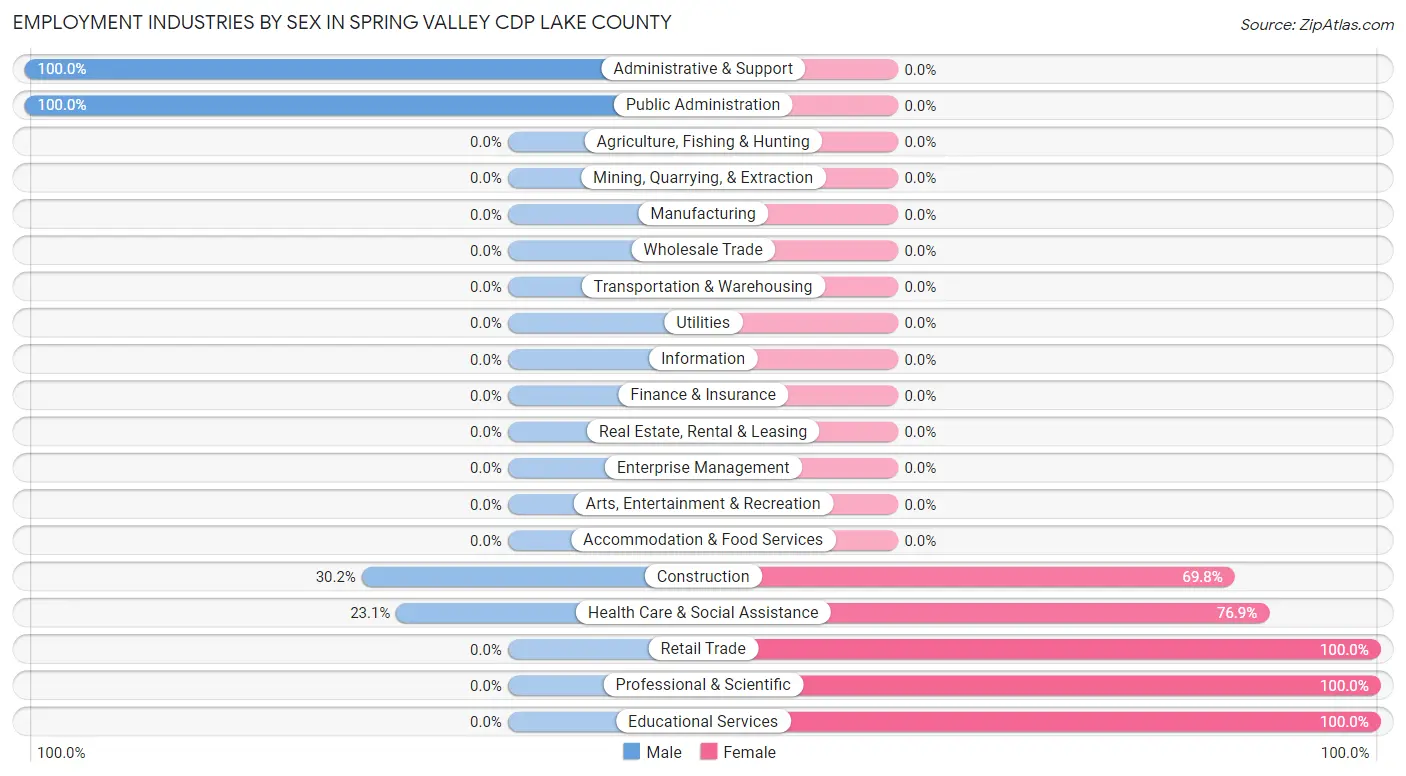
Employment Industries by Sex in Spring Valley CDP Lake County
The Spring Valley CDP Lake County industries that see more men than women are Administrative & Support (100.0%), Public Administration (100.0%), and Construction (30.2%), whereas the industries that tend to have a higher number of women are Retail Trade (100.0%), Professional & Scientific (100.0%), and Educational Services (100.0%).
| Industry | Male | Female |
| Agriculture, Fishing & Hunting | 0 (0.0%) | 0 (0.0%) |
| Mining, Quarrying, & Extraction | 0 (0.0%) | 0 (0.0%) |
| Construction | 26 (30.2%) | 60 (69.8%) |
| Manufacturing | 0 (0.0%) | 0 (0.0%) |
| Wholesale Trade | 0 (0.0%) | 0 (0.0%) |
| Retail Trade | 0 (0.0%) | 35 (100.0%) |
| Transportation & Warehousing | 0 (0.0%) | 0 (0.0%) |
| Utilities | 0 (0.0%) | 0 (0.0%) |
| Information | 0 (0.0%) | 0 (0.0%) |
| Finance & Insurance | 0 (0.0%) | 0 (0.0%) |
| Real Estate, Rental & Leasing | 0 (0.0%) | 0 (0.0%) |
| Professional & Scientific | 0 (0.0%) | 8 (100.0%) |
| Enterprise Management | 0 (0.0%) | 0 (0.0%) |
| Administrative & Support | 5 (100.0%) | 0 (0.0%) |
| Educational Services | 0 (0.0%) | 34 (100.0%) |
| Health Care & Social Assistance | 9 (23.1%) | 30 (76.9%) |
| Arts, Entertainment & Recreation | 0 (0.0%) | 0 (0.0%) |
| Accommodation & Food Services | 0 (0.0%) | 0 (0.0%) |
| Public Administration | 29 (100.0%) | 0 (0.0%) |
| Total | 84 (33.5%) | 167 (66.5%) |
Education in Spring Valley CDP Lake County
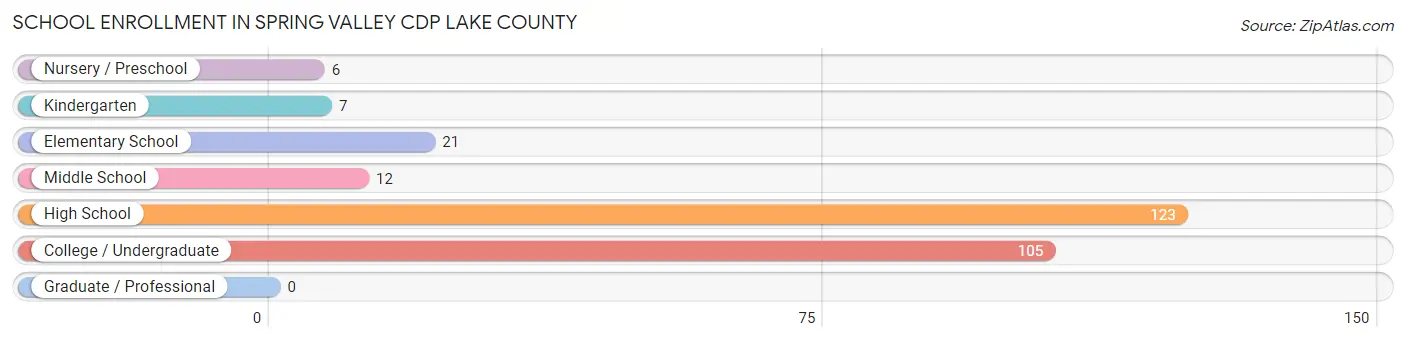
School Enrollment in Spring Valley CDP Lake County
The most common levels of schooling among the 274 students in Spring Valley CDP Lake County are high school (123 | 44.9%), college / undergraduate (105 | 38.3%), and elementary school (21 | 7.7%).
| School Level | # Students | % Students |
| Nursery / Preschool | 6 | 2.2% |
| Kindergarten | 7 | 2.5% |
| Elementary School | 21 | 7.7% |
| Middle School | 12 | 4.4% |
| High School | 123 | 44.9% |
| College / Undergraduate | 105 | 38.3% |
| Graduate / Professional | 0 | 0.0% |
| Total | 274 | 100.0% |
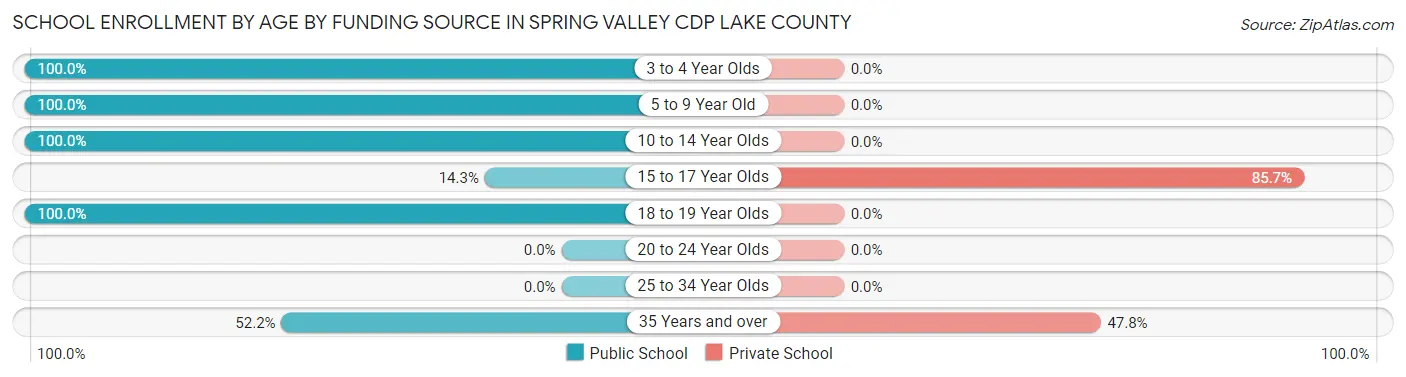
School Enrollment by Age by Funding Source in Spring Valley CDP Lake County
Out of a total of 274 students who are enrolled in schools in Spring Valley CDP Lake County, 82 (29.9%) attend a private institution, while the remaining 192 (70.1%) are enrolled in public schools. The age group of 15 to 17 year olds has the highest likelihood of being enrolled in private schools, with 60 (85.7% in the age bracket) enrolled. Conversely, the age group of 3 to 4 year olds has the lowest likelihood of being enrolled in a private school, with 6 (100.0% in the age bracket) attending a public institution.
| Age Bracket | Public School | Private School |
| 3 to 4 Year Olds | 6 (100.0%) | 0 (0.0%) |
| 5 to 9 Year Old | 28 (100.0%) | 0 (0.0%) |
| 10 to 14 Year Olds | 43 (100.0%) | 0 (0.0%) |
| 15 to 17 Year Olds | 10 (14.3%) | 60 (85.7%) |
| 18 to 19 Year Olds | 81 (100.0%) | 0 (0.0%) |
| 20 to 24 Year Olds | 0 (0.0%) | 0 (0.0%) |
| 25 to 34 Year Olds | 0 (0.0%) | 0 (0.0%) |
| 35 Years and over | 24 (52.2%) | 22 (47.8%) |
| Total | 192 (70.1%) | 82 (29.9%) |
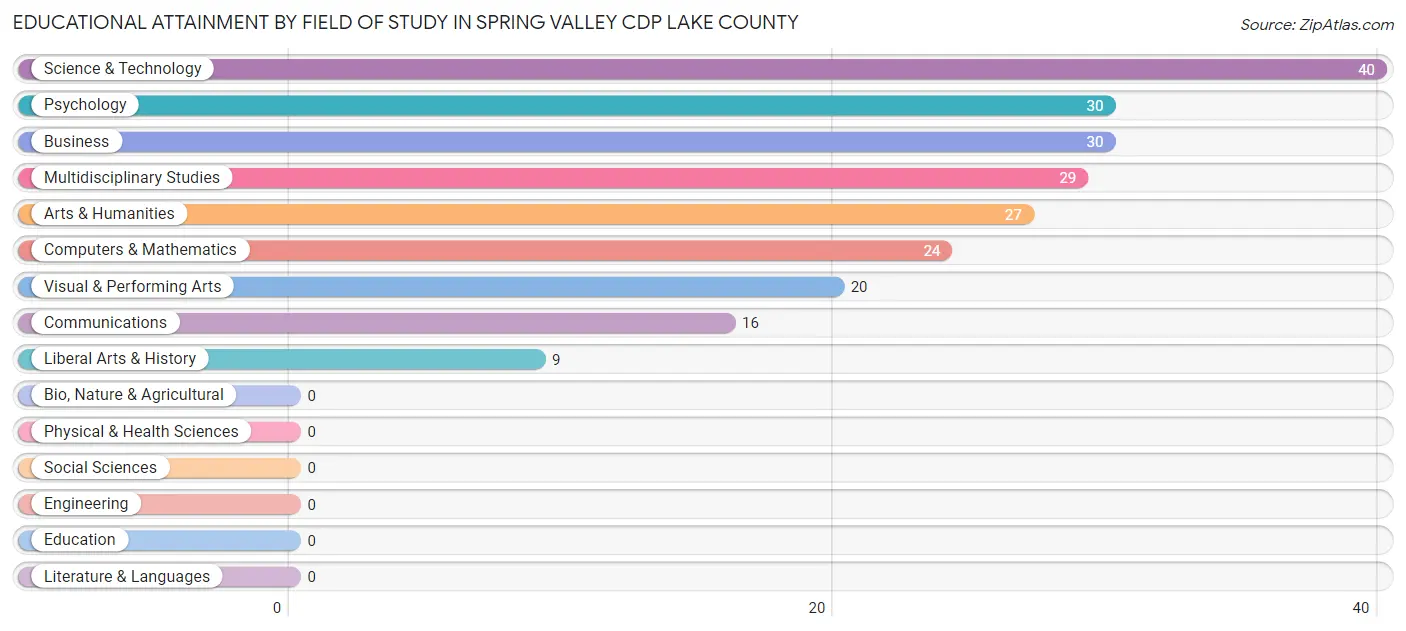
Educational Attainment by Field of Study in Spring Valley CDP Lake County
Science & technology (40 | 17.8%), psychology (30 | 13.3%), business (30 | 13.3%), multidisciplinary studies (29 | 12.9%), and arts & humanities (27 | 12.0%) are the most common fields of study among 225 individuals in Spring Valley CDP Lake County who have obtained a bachelor's degree or higher.
| Field of Study | # Graduates | % Graduates |
| Computers & Mathematics | 24 | 10.7% |
| Bio, Nature & Agricultural | 0 | 0.0% |
| Physical & Health Sciences | 0 | 0.0% |
| Psychology | 30 | 13.3% |
| Social Sciences | 0 | 0.0% |
| Engineering | 0 | 0.0% |
| Multidisciplinary Studies | 29 | 12.9% |
| Science & Technology | 40 | 17.8% |
| Business | 30 | 13.3% |
| Education | 0 | 0.0% |
| Literature & Languages | 0 | 0.0% |
| Liberal Arts & History | 9 | 4.0% |
| Visual & Performing Arts | 20 | 8.9% |
| Communications | 16 | 7.1% |
| Arts & Humanities | 27 | 12.0% |
| Total | 225 | 100.0% |
Transportation & Commute in Spring Valley CDP Lake County
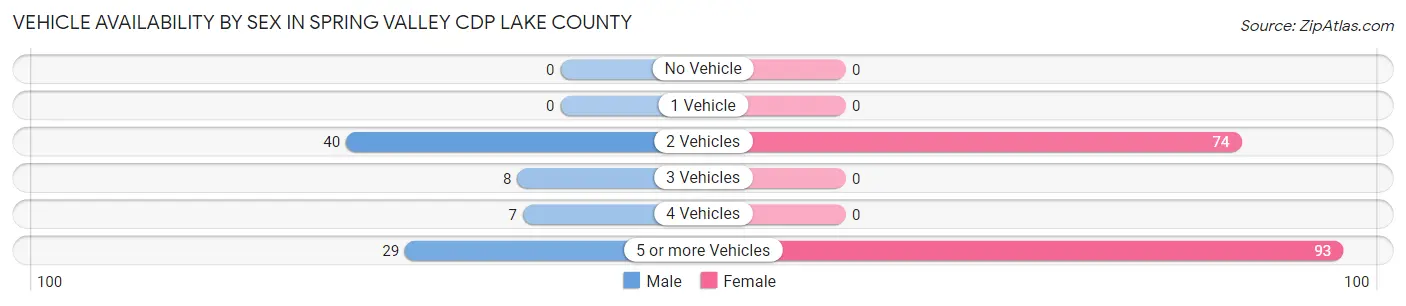
Vehicle Availability by Sex in Spring Valley CDP Lake County
The most prevalent vehicle ownership categories in Spring Valley CDP Lake County are males with 2 vehicles (40, accounting for 47.6%) and females with 2 vehicles (74, making up 23.9%).
| Vehicles Available | Male | Female |
| No Vehicle | 0 (0.0%) | 0 (0.0%) |
| 1 Vehicle | 0 (0.0%) | 0 (0.0%) |
| 2 Vehicles | 40 (47.6%) | 74 (44.3%) |
| 3 Vehicles | 8 (9.5%) | 0 (0.0%) |
| 4 Vehicles | 7 (8.3%) | 0 (0.0%) |
| 5 or more Vehicles | 29 (34.5%) | 93 (55.7%) |
| Total | 84 (100.0%) | 167 (100.0%) |
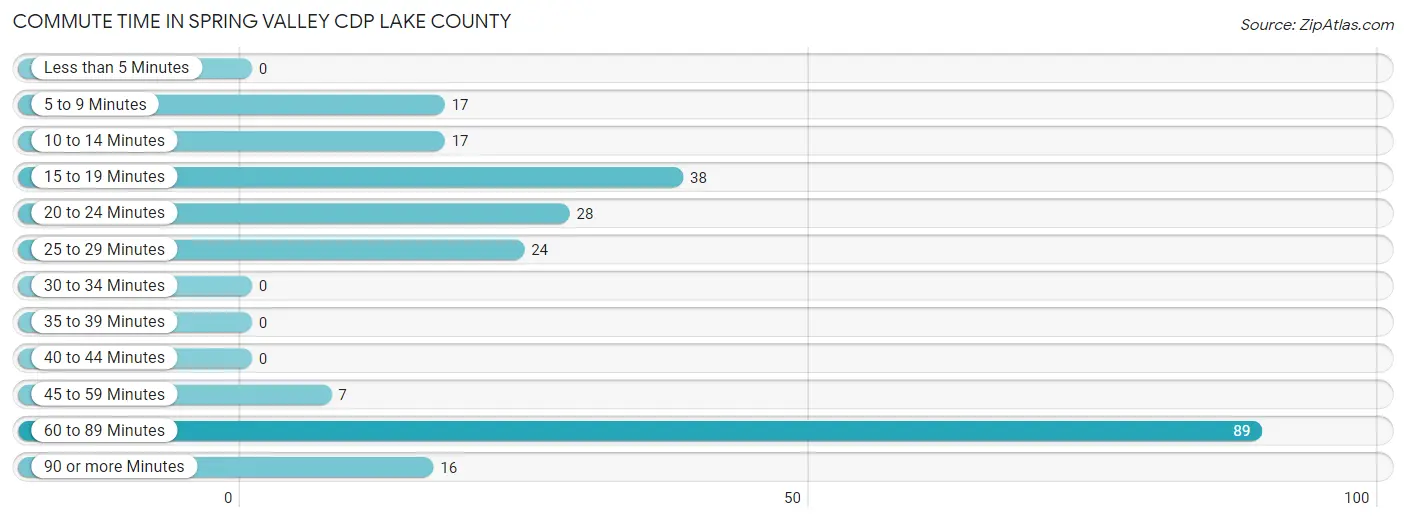
Commute Time in Spring Valley CDP Lake County
The most frequently occuring commute durations in Spring Valley CDP Lake County are 60 to 89 minutes (89 commuters, 37.7%), 15 to 19 minutes (38 commuters, 16.1%), and 20 to 24 minutes (28 commuters, 11.9%).
| Commute Time | # Commuters | % Commuters |
| Less than 5 Minutes | 0 | 0.0% |
| 5 to 9 Minutes | 17 | 7.2% |
| 10 to 14 Minutes | 17 | 7.2% |
| 15 to 19 Minutes | 38 | 16.1% |
| 20 to 24 Minutes | 28 | 11.9% |
| 25 to 29 Minutes | 24 | 10.2% |
| 30 to 34 Minutes | 0 | 0.0% |
| 35 to 39 Minutes | 0 | 0.0% |
| 40 to 44 Minutes | 0 | 0.0% |
| 45 to 59 Minutes | 7 | 3.0% |
| 60 to 89 Minutes | 89 | 37.7% |
| 90 or more Minutes | 16 | 6.8% |
Commute Time by Sex in Spring Valley CDP Lake County
The most common commute times in Spring Valley CDP Lake County are 60 to 89 minutes (29 commuters, 42.0%) for males and 60 to 89 minutes (60 commuters, 35.9%) for females.
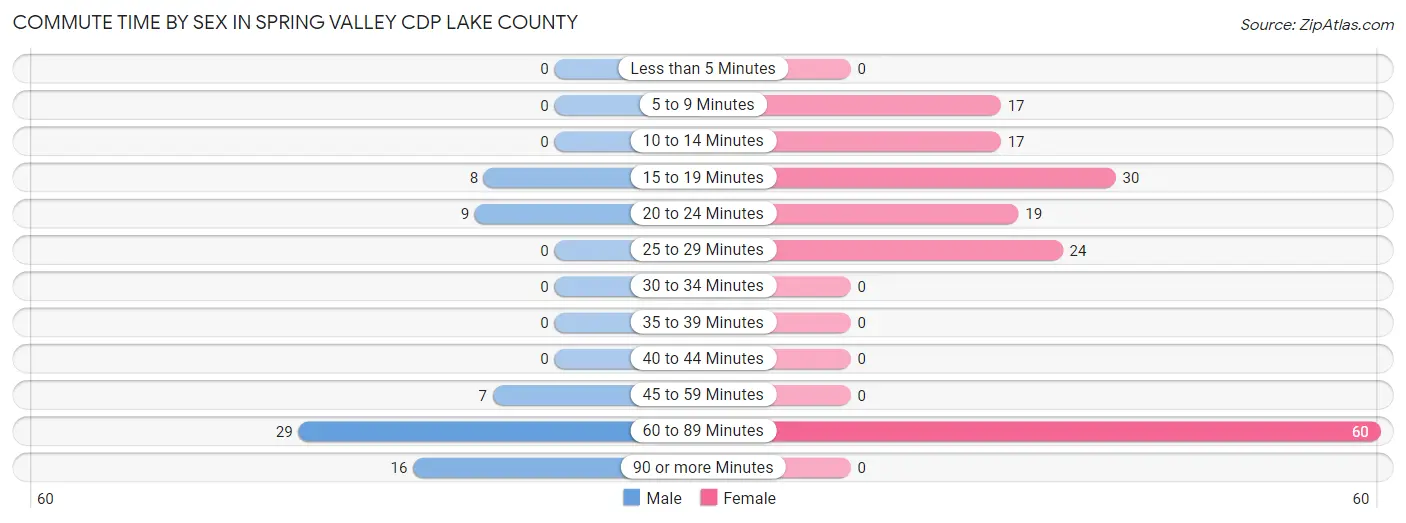
| Commute Time | Male | Female |
| Less than 5 Minutes | 0 (0.0%) | 0 (0.0%) |
| 5 to 9 Minutes | 0 (0.0%) | 17 (10.2%) |
| 10 to 14 Minutes | 0 (0.0%) | 17 (10.2%) |
| 15 to 19 Minutes | 8 (11.6%) | 30 (18.0%) |
| 20 to 24 Minutes | 9 (13.0%) | 19 (11.4%) |
| 25 to 29 Minutes | 0 (0.0%) | 24 (14.4%) |
| 30 to 34 Minutes | 0 (0.0%) | 0 (0.0%) |
| 35 to 39 Minutes | 0 (0.0%) | 0 (0.0%) |
| 40 to 44 Minutes | 0 (0.0%) | 0 (0.0%) |
| 45 to 59 Minutes | 7 (10.1%) | 0 (0.0%) |
| 60 to 89 Minutes | 29 (42.0%) | 60 (35.9%) |
| 90 or more Minutes | 16 (23.2%) | 0 (0.0%) |
Time of Departure to Work by Sex in Spring Valley CDP Lake County
The most frequent times of departure to work in Spring Valley CDP Lake County are 4:00 PM to 11:59 PM (29, 42.0%) for males and 4:00 PM to 11:59 PM (60, 35.9%) for females.
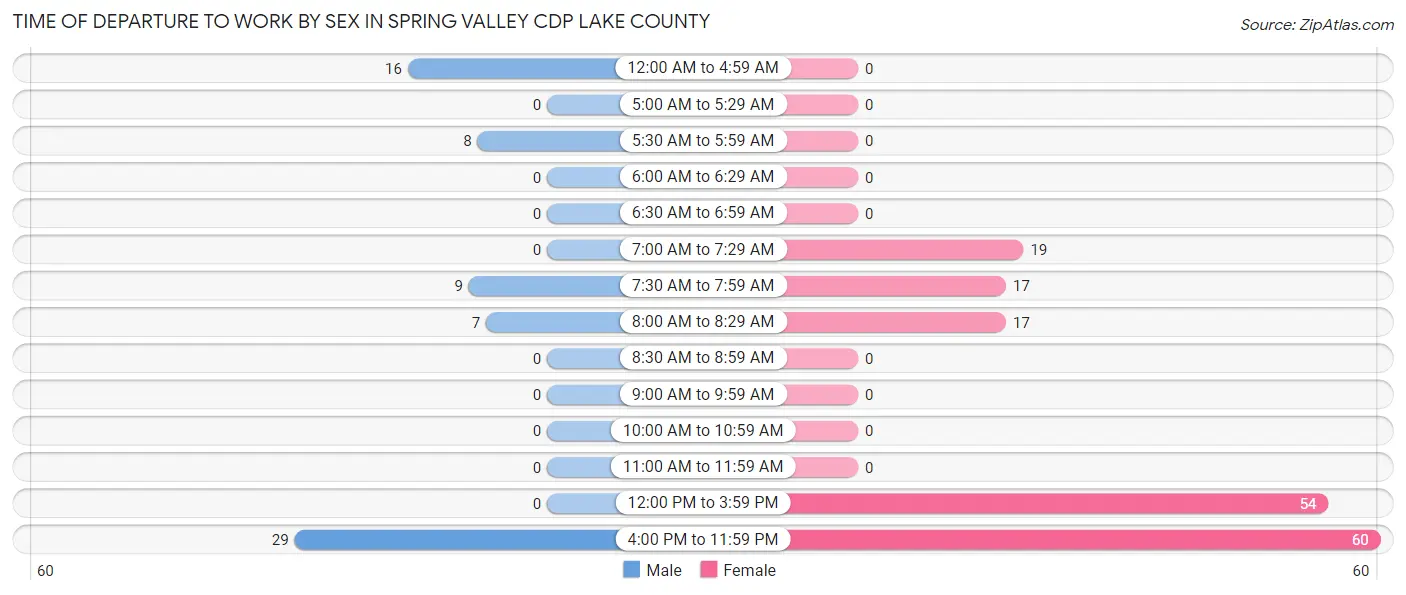
| Time of Departure | Male | Female |
| 12:00 AM to 4:59 AM | 16 (23.2%) | 0 (0.0%) |
| 5:00 AM to 5:29 AM | 0 (0.0%) | 0 (0.0%) |
| 5:30 AM to 5:59 AM | 8 (11.6%) | 0 (0.0%) |
| 6:00 AM to 6:29 AM | 0 (0.0%) | 0 (0.0%) |
| 6:30 AM to 6:59 AM | 0 (0.0%) | 0 (0.0%) |
| 7:00 AM to 7:29 AM | 0 (0.0%) | 19 (11.4%) |
| 7:30 AM to 7:59 AM | 9 (13.0%) | 17 (10.2%) |
| 8:00 AM to 8:29 AM | 7 (10.1%) | 17 (10.2%) |
| 8:30 AM to 8:59 AM | 0 (0.0%) | 0 (0.0%) |
| 9:00 AM to 9:59 AM | 0 (0.0%) | 0 (0.0%) |
| 10:00 AM to 10:59 AM | 0 (0.0%) | 0 (0.0%) |
| 11:00 AM to 11:59 AM | 0 (0.0%) | 0 (0.0%) |
| 12:00 PM to 3:59 PM | 0 (0.0%) | 54 (32.3%) |
| 4:00 PM to 11:59 PM | 29 (42.0%) | 60 (35.9%) |
| Total | 69 (100.0%) | 167 (100.0%) |
Housing Occupancy in Spring Valley CDP Lake County
Occupancy by Ownership in Spring Valley CDP Lake County
Of the total 356 dwellings in Spring Valley CDP Lake County, owner-occupied units account for 298 (83.7%), while renter-occupied units make up 58 (16.3%).
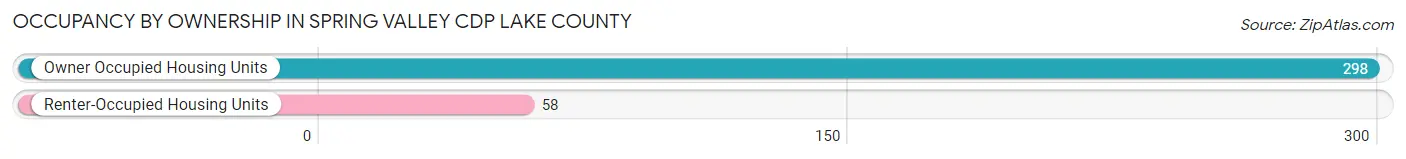
| Occupancy | # Housing Units | % Housing Units |
| Owner Occupied Housing Units | 298 | 83.7% |
| Renter-Occupied Housing Units | 58 | 16.3% |
| Total Occupied Housing Units | 356 | 100.0% |
Occupancy by Household Size in Spring Valley CDP Lake County
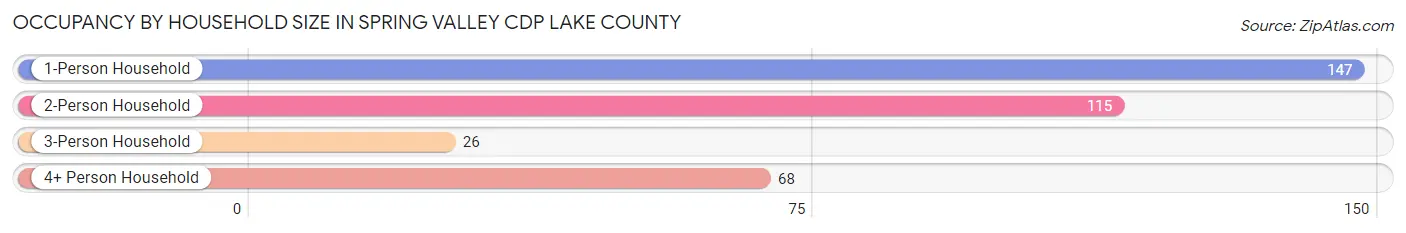
| Household Size | # Housing Units | % Housing Units |
| 1-Person Household | 147 | 41.3% |
| 2-Person Household | 115 | 32.3% |
| 3-Person Household | 26 | 7.3% |
| 4+ Person Household | 68 | 19.1% |
| Total Housing Units | 356 | 100.0% |
Occupancy by Ownership by Household Size in Spring Valley CDP Lake County
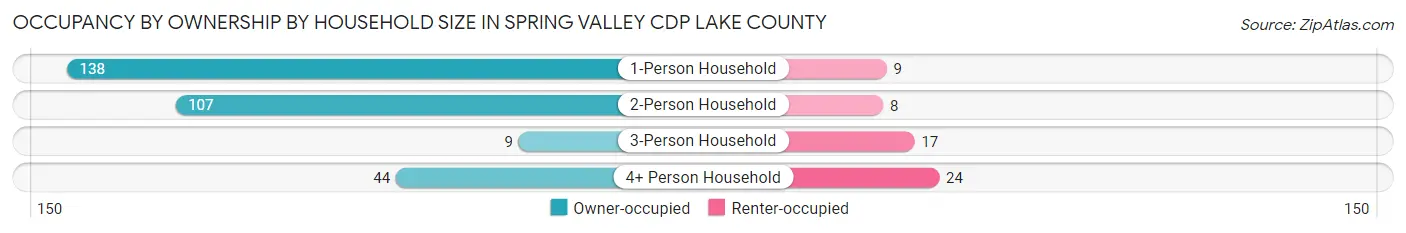
| Household Size | Owner-occupied | Renter-occupied |
| 1-Person Household | 138 (93.9%) | 9 (6.1%) |
| 2-Person Household | 107 (93.0%) | 8 (7.0%) |
| 3-Person Household | 9 (34.6%) | 17 (65.4%) |
| 4+ Person Household | 44 (64.7%) | 24 (35.3%) |
| Total Housing Units | 298 (83.7%) | 58 (16.3%) |
Occupancy by Educational Attainment in Spring Valley CDP Lake County
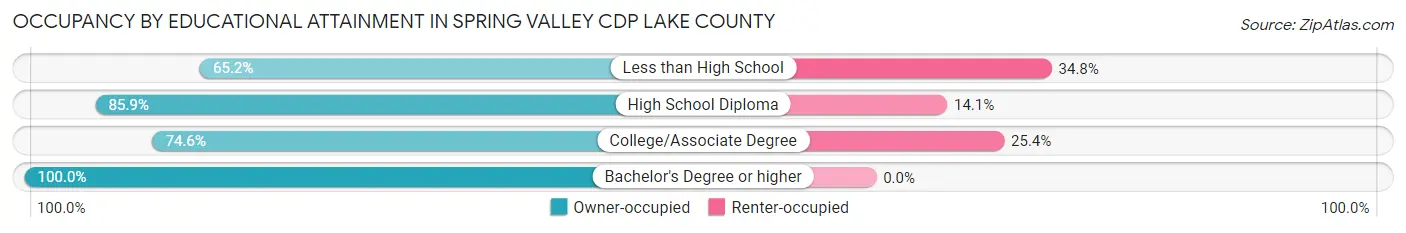
| Household Size | Owner-occupied | Renter-occupied |
| Less than High School | 60 (65.2%) | 32 (34.8%) |
| High School Diploma | 55 (85.9%) | 9 (14.1%) |
| College/Associate Degree | 50 (74.6%) | 17 (25.4%) |
| Bachelor's Degree or higher | 133 (100.0%) | 0 (0.0%) |
Occupancy by Age of Householder in Spring Valley CDP Lake County
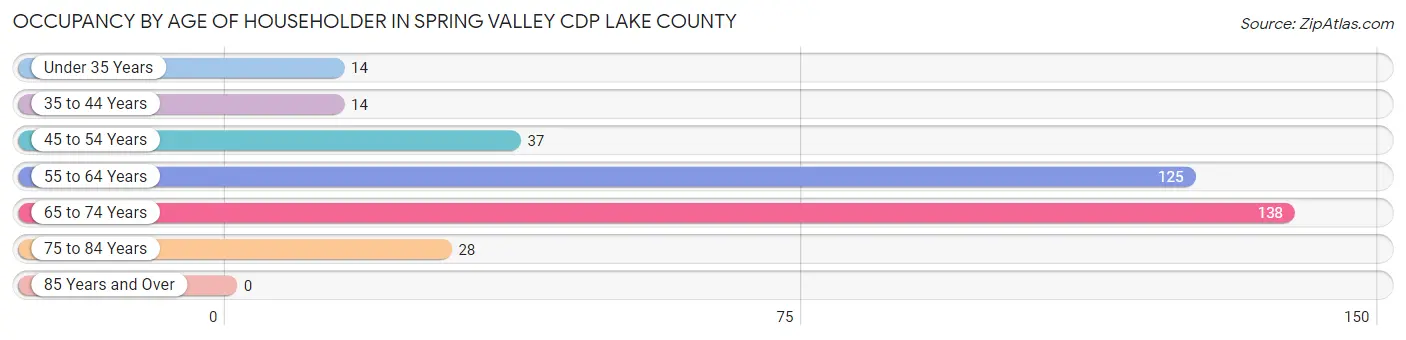
| Age Bracket | # Households | % Households |
| Under 35 Years | 14 | 3.9% |
| 35 to 44 Years | 14 | 3.9% |
| 45 to 54 Years | 37 | 10.4% |
| 55 to 64 Years | 125 | 35.1% |
| 65 to 74 Years | 138 | 38.8% |
| 75 to 84 Years | 28 | 7.9% |
| 85 Years and Over | 0 | 0.0% |
| Total | 356 | 100.0% |
Housing Finances in Spring Valley CDP Lake County
Median Income by Occupancy in Spring Valley CDP Lake County
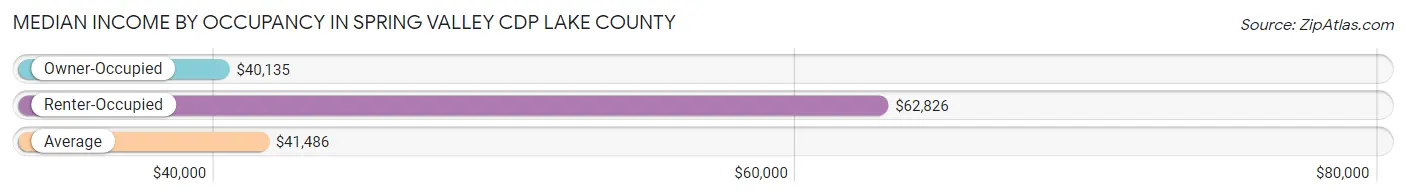
| Occupancy Type | # Households | Median Income |
| Owner-Occupied | 298 (83.7%) | $40,135 |
| Renter-Occupied | 58 (16.3%) | $62,826 |
| Average | 356 (100.0%) | $41,486 |
Occupancy by Householder Income Bracket in Spring Valley CDP Lake County
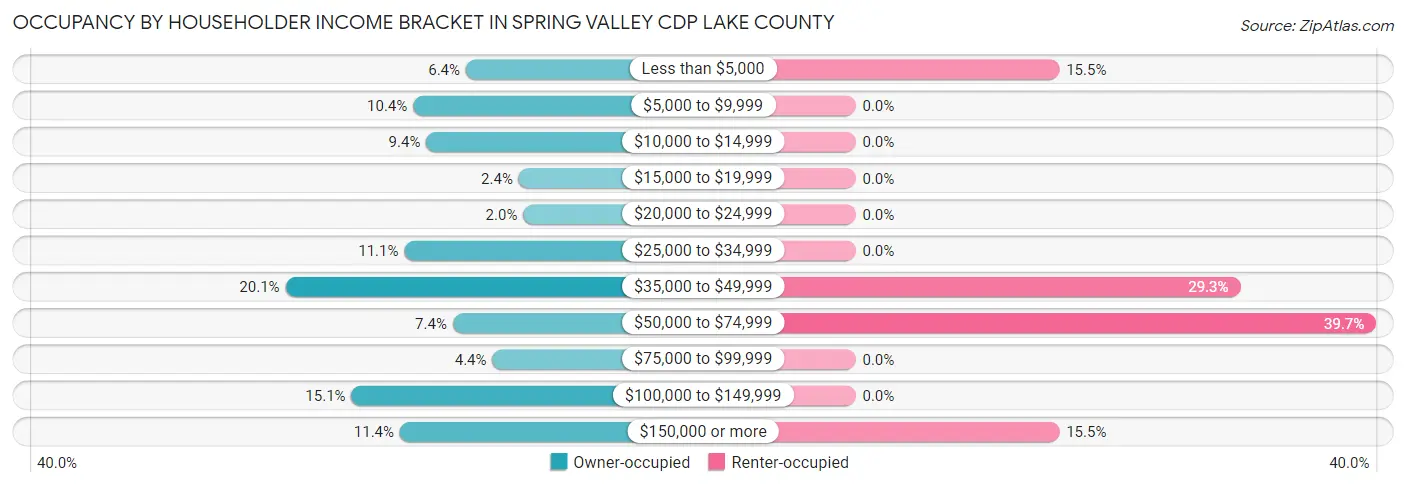
| Income Bracket | Owner-occupied | Renter-occupied |
| Less than $5,000 | 19 (6.4%) | 9 (15.5%) |
| $5,000 to $9,999 | 31 (10.4%) | 0 (0.0%) |
| $10,000 to $14,999 | 28 (9.4%) | 0 (0.0%) |
| $15,000 to $19,999 | 7 (2.4%) | 0 (0.0%) |
| $20,000 to $24,999 | 6 (2.0%) | 0 (0.0%) |
| $25,000 to $34,999 | 33 (11.1%) | 0 (0.0%) |
| $35,000 to $49,999 | 60 (20.1%) | 17 (29.3%) |
| $50,000 to $74,999 | 22 (7.4%) | 23 (39.7%) |
| $75,000 to $99,999 | 13 (4.4%) | 0 (0.0%) |
| $100,000 to $149,999 | 45 (15.1%) | 0 (0.0%) |
| $150,000 or more | 34 (11.4%) | 9 (15.5%) |
| Total | 298 (100.0%) | 58 (100.0%) |
Monthly Housing Cost Tiers in Spring Valley CDP Lake County
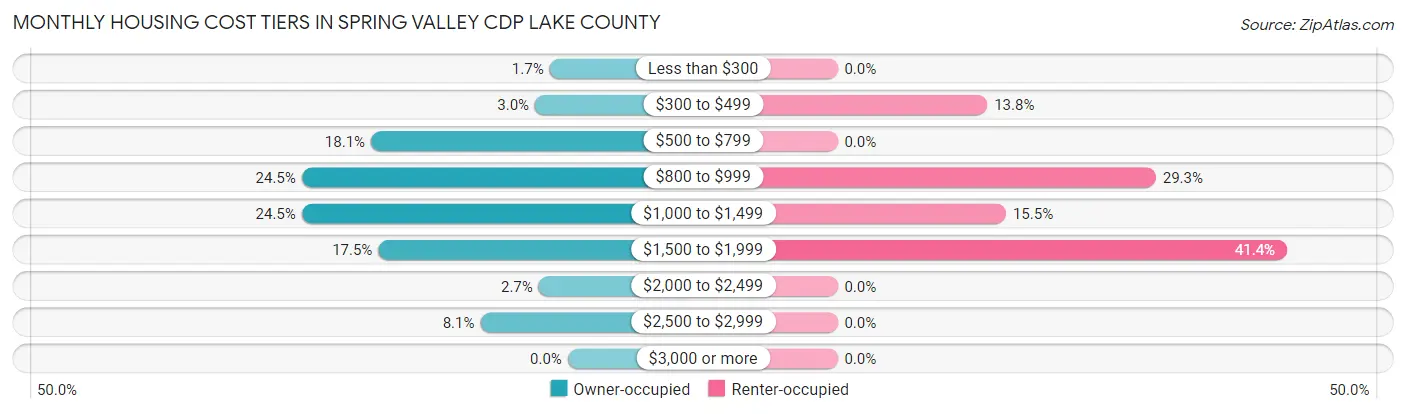
| Monthly Cost | Owner-occupied | Renter-occupied |
| Less than $300 | 5 (1.7%) | 0 (0.0%) |
| $300 to $499 | 9 (3.0%) | 8 (13.8%) |
| $500 to $799 | 54 (18.1%) | 0 (0.0%) |
| $800 to $999 | 73 (24.5%) | 17 (29.3%) |
| $1,000 to $1,499 | 73 (24.5%) | 9 (15.5%) |
| $1,500 to $1,999 | 52 (17.4%) | 24 (41.4%) |
| $2,000 to $2,499 | 8 (2.7%) | 0 (0.0%) |
| $2,500 to $2,999 | 24 (8.1%) | 0 (0.0%) |
| $3,000 or more | 0 (0.0%) | 0 (0.0%) |
| Total | 298 (100.0%) | 58 (100.0%) |
Physical Housing Characteristics in Spring Valley CDP Lake County
Housing Structures in Spring Valley CDP Lake County
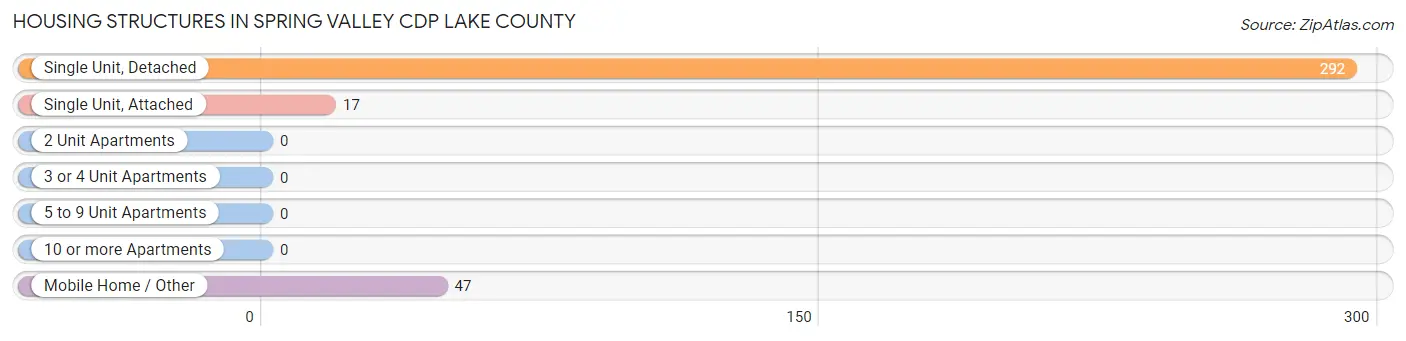
| Structure Type | # Housing Units | % Housing Units |
| Single Unit, Detached | 292 | 82.0% |
| Single Unit, Attached | 17 | 4.8% |
| 2 Unit Apartments | 0 | 0.0% |
| 3 or 4 Unit Apartments | 0 | 0.0% |
| 5 to 9 Unit Apartments | 0 | 0.0% |
| 10 or more Apartments | 0 | 0.0% |
| Mobile Home / Other | 47 | 13.2% |
| Total | 356 | 100.0% |
Housing Structures by Occupancy in Spring Valley CDP Lake County
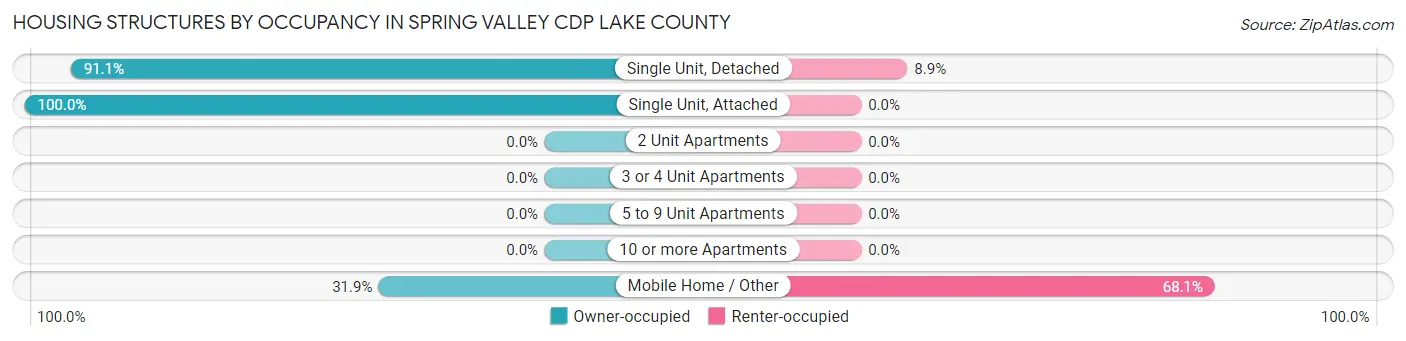
| Structure Type | Owner-occupied | Renter-occupied |
| Single Unit, Detached | 266 (91.1%) | 26 (8.9%) |
| Single Unit, Attached | 17 (100.0%) | 0 (0.0%) |
| 2 Unit Apartments | 0 (0.0%) | 0 (0.0%) |
| 3 or 4 Unit Apartments | 0 (0.0%) | 0 (0.0%) |
| 5 to 9 Unit Apartments | 0 (0.0%) | 0 (0.0%) |
| 10 or more Apartments | 0 (0.0%) | 0 (0.0%) |
| Mobile Home / Other | 15 (31.9%) | 32 (68.1%) |
| Total | 298 (83.7%) | 58 (16.3%) |
Housing Structures by Number of Rooms in Spring Valley CDP Lake County
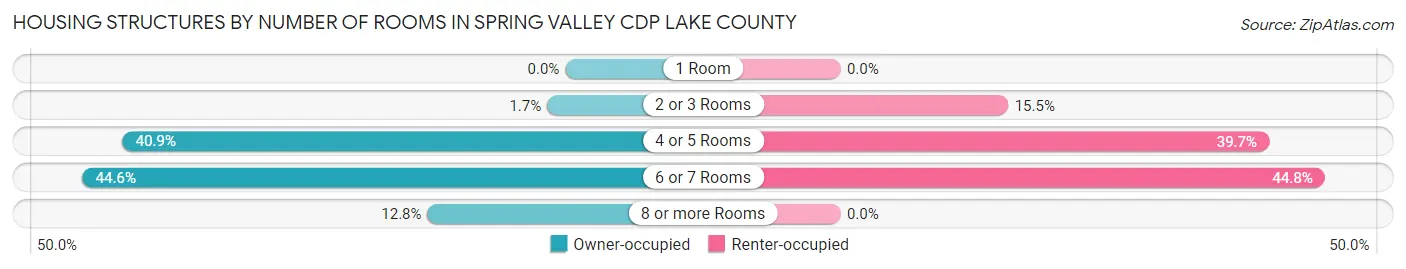
| Number of Rooms | Owner-occupied | Renter-occupied |
| 1 Room | 0 (0.0%) | 0 (0.0%) |
| 2 or 3 Rooms | 5 (1.7%) | 9 (15.5%) |
| 4 or 5 Rooms | 122 (40.9%) | 23 (39.7%) |
| 6 or 7 Rooms | 133 (44.6%) | 26 (44.8%) |
| 8 or more Rooms | 38 (12.8%) | 0 (0.0%) |
| Total | 298 (100.0%) | 58 (100.0%) |
Housing Structure by Heating Type in Spring Valley CDP Lake County
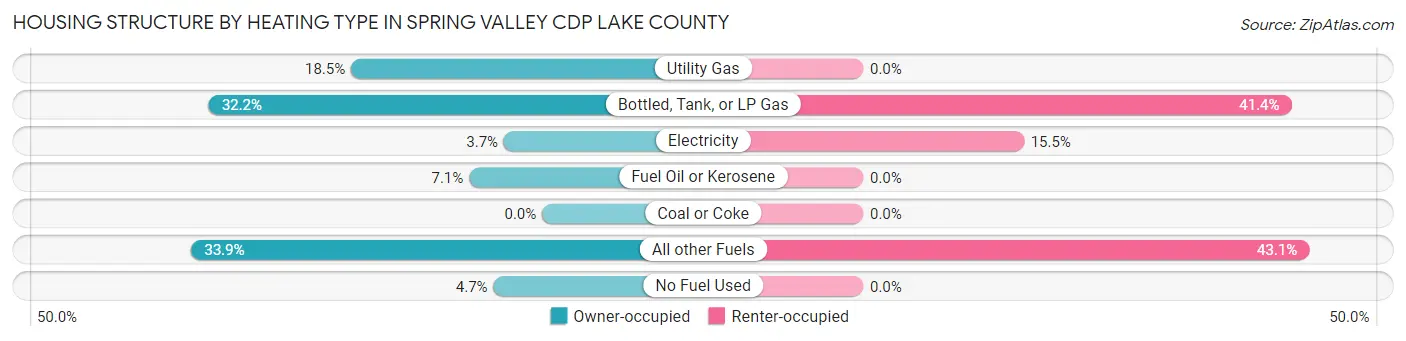
| Heating Type | Owner-occupied | Renter-occupied |
| Utility Gas | 55 (18.5%) | 0 (0.0%) |
| Bottled, Tank, or LP Gas | 96 (32.2%) | 24 (41.4%) |
| Electricity | 11 (3.7%) | 9 (15.5%) |
| Fuel Oil or Kerosene | 21 (7.0%) | 0 (0.0%) |
| Coal or Coke | 0 (0.0%) | 0 (0.0%) |
| All other Fuels | 101 (33.9%) | 25 (43.1%) |
| No Fuel Used | 14 (4.7%) | 0 (0.0%) |
| Total | 298 (100.0%) | 58 (100.0%) |
Household Vehicle Usage in Spring Valley CDP Lake County
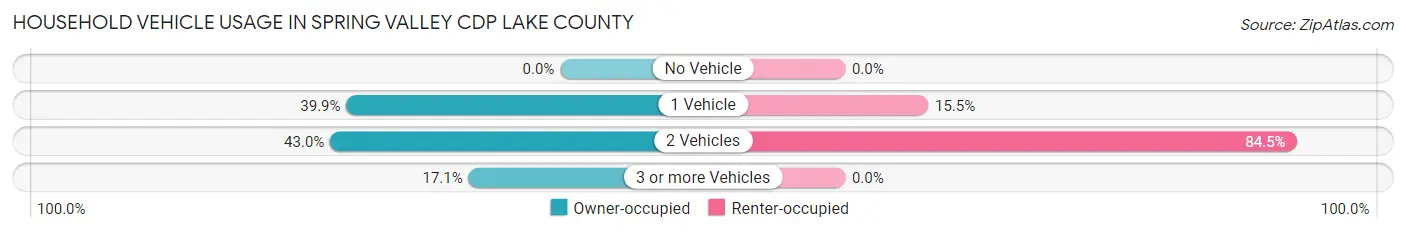
| Vehicles per Household | Owner-occupied | Renter-occupied |
| No Vehicle | 0 (0.0%) | 0 (0.0%) |
| 1 Vehicle | 119 (39.9%) | 9 (15.5%) |
| 2 Vehicles | 128 (42.9%) | 49 (84.5%) |
| 3 or more Vehicles | 51 (17.1%) | 0 (0.0%) |
| Total | 298 (100.0%) | 58 (100.0%) |
Real Estate & Mortgages in Spring Valley CDP Lake County
Real Estate and Mortgage Overview in Spring Valley CDP Lake County
| Characteristic | Without Mortgage | With Mortgage |
| Housing Units | 143 | 155 |
| Median Property Value | $334,300 | $388,700 |
| Median Household Income | - | - |
| Monthly Housing Costs | $811 | $0 |
| Real Estate Taxes | $3,444 | $0 |
Property Value by Mortgage Status in Spring Valley CDP Lake County
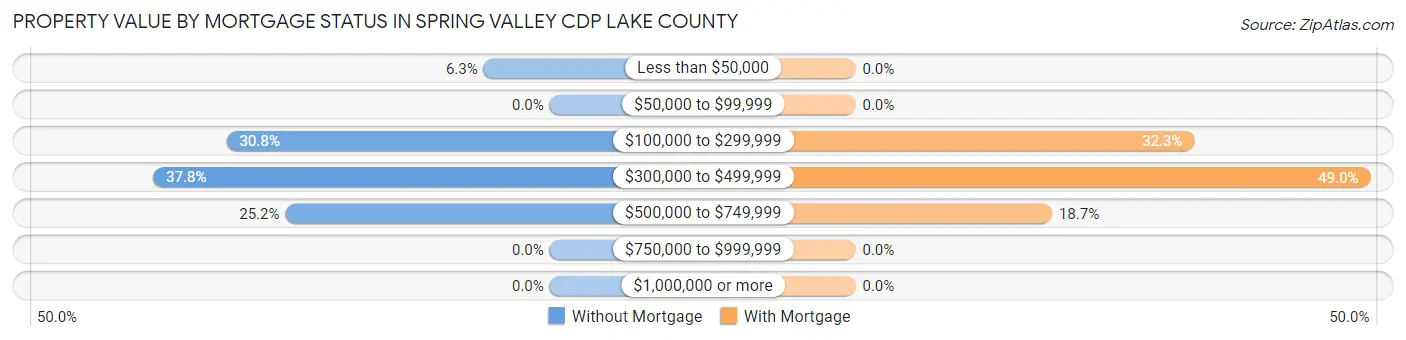
| Property Value | Without Mortgage | With Mortgage |
| Less than $50,000 | 9 (6.3%) | 0 (0.0%) |
| $50,000 to $99,999 | 0 (0.0%) | 0 (0.0%) |
| $100,000 to $299,999 | 44 (30.8%) | 50 (32.3%) |
| $300,000 to $499,999 | 54 (37.8%) | 76 (49.0%) |
| $500,000 to $749,999 | 36 (25.2%) | 29 (18.7%) |
| $750,000 to $999,999 | 0 (0.0%) | 0 (0.0%) |
| $1,000,000 or more | 0 (0.0%) | 0 (0.0%) |
| Total | 143 (100.0%) | 155 (100.0%) |
Household Income by Mortgage Status in Spring Valley CDP Lake County
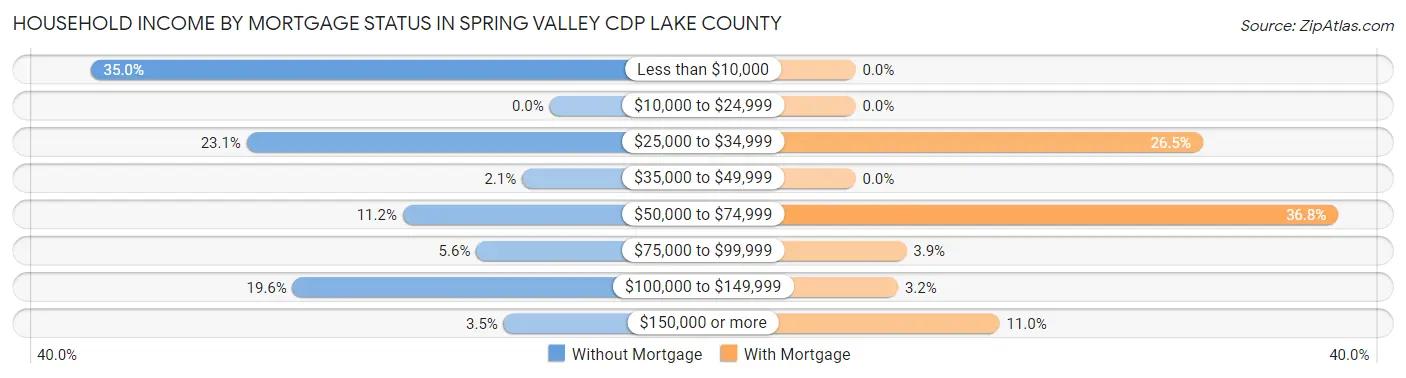
| Household Income | Without Mortgage | With Mortgage |
| Less than $10,000 | 50 (35.0%) | 0 (0.0%) |
| $10,000 to $24,999 | 0 (0.0%) | 0 (0.0%) |
| $25,000 to $34,999 | 33 (23.1%) | 41 (26.5%) |
| $35,000 to $49,999 | 3 (2.1%) | 0 (0.0%) |
| $50,000 to $74,999 | 16 (11.2%) | 57 (36.8%) |
| $75,000 to $99,999 | 8 (5.6%) | 6 (3.9%) |
| $100,000 to $149,999 | 28 (19.6%) | 5 (3.2%) |
| $150,000 or more | 5 (3.5%) | 17 (11.0%) |
| Total | 143 (100.0%) | 155 (100.0%) |
Property Value to Household Income Ratio in Spring Valley CDP Lake County
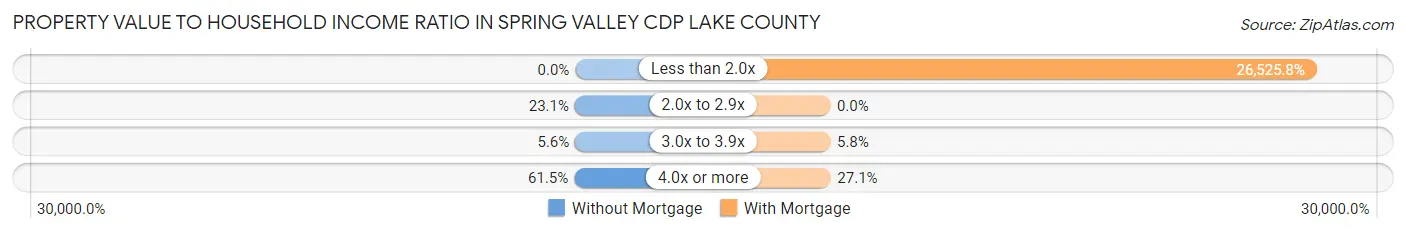
| Value-to-Income Ratio | Without Mortgage | With Mortgage |
| Less than 2.0x | 0 (0.0%) | 41,115 (26,525.8%) |
| 2.0x to 2.9x | 33 (23.1%) | 0 (0.0%) |
| 3.0x to 3.9x | 8 (5.6%) | 9 (5.8%) |
| 4.0x or more | 88 (61.5%) | 42 (27.1%) |
| Total | 143 (100.0%) | 155 (100.0%) |
Real Estate Taxes by Mortgage Status in Spring Valley CDP Lake County
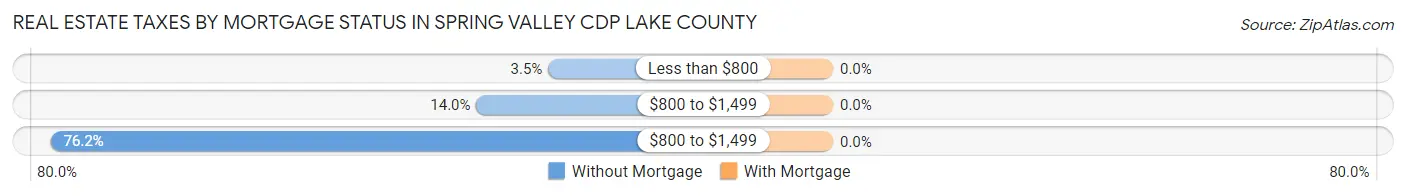
| Property Taxes | Without Mortgage | With Mortgage |
| Less than $800 | 5 (3.5%) | 0 (0.0%) |
| $800 to $1,499 | 20 (14.0%) | 0 (0.0%) |
| $800 to $1,499 | 109 (76.2%) | 0 (0.0%) |
| Total | 143 (100.0%) | 155 (100.0%) |
Health & Disability in Spring Valley CDP Lake County
Health Insurance Coverage by Age in Spring Valley CDP Lake County
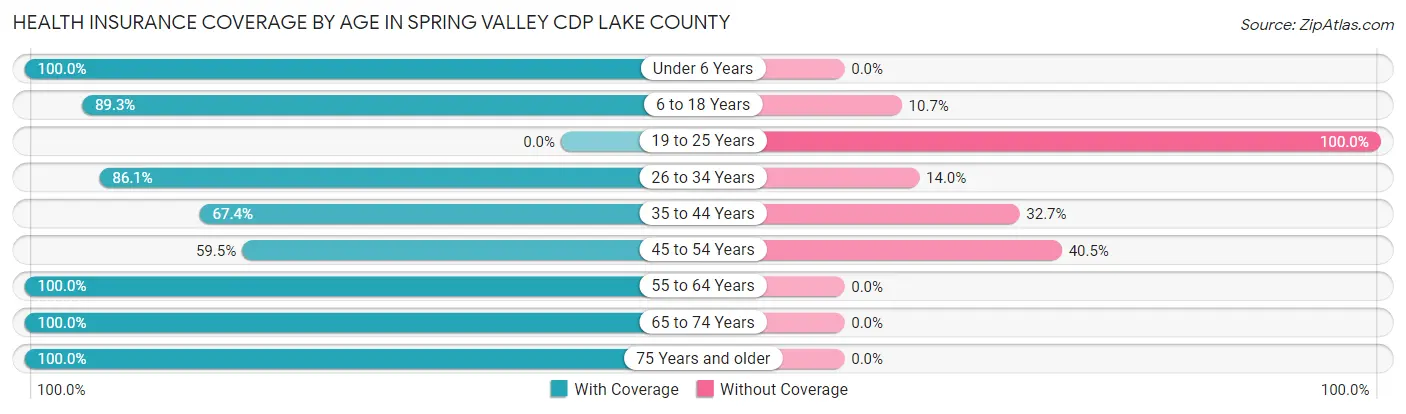
| Age Bracket | With Coverage | Without Coverage |
| Under 6 Years | 62 (100.0%) | 0 (0.0%) |
| 6 to 18 Years | 192 (89.3%) | 23 (10.7%) |
| 19 to 25 Years | 0 (0.0%) | 14 (100.0%) |
| 26 to 34 Years | 37 (86.1%) | 6 (14.0%) |
| 35 to 44 Years | 33 (67.3%) | 16 (32.7%) |
| 45 to 54 Years | 22 (59.5%) | 15 (40.5%) |
| 55 to 64 Years | 220 (100.0%) | 0 (0.0%) |
| 65 to 74 Years | 176 (100.0%) | 0 (0.0%) |
| 75 Years and older | 73 (100.0%) | 0 (0.0%) |
| Total | 815 (91.7%) | 74 (8.3%) |
Health Insurance Coverage by Citizenship Status in Spring Valley CDP Lake County
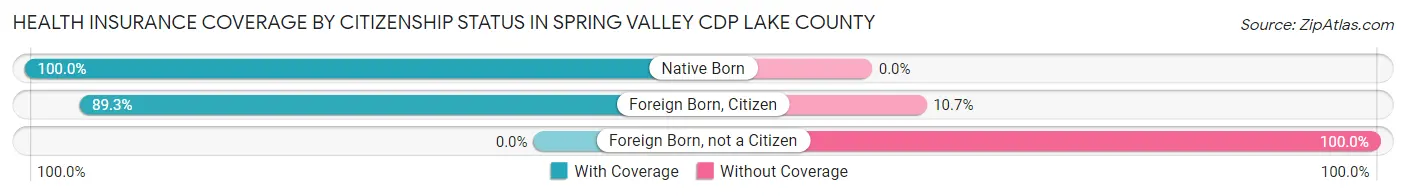
| Citizenship Status | With Coverage | Without Coverage |
| Native Born | 62 (100.0%) | 0 (0.0%) |
| Foreign Born, Citizen | 192 (89.3%) | 23 (10.7%) |
| Foreign Born, not a Citizen | 0 (0.0%) | 14 (100.0%) |
Health Insurance Coverage by Household Income in Spring Valley CDP Lake County
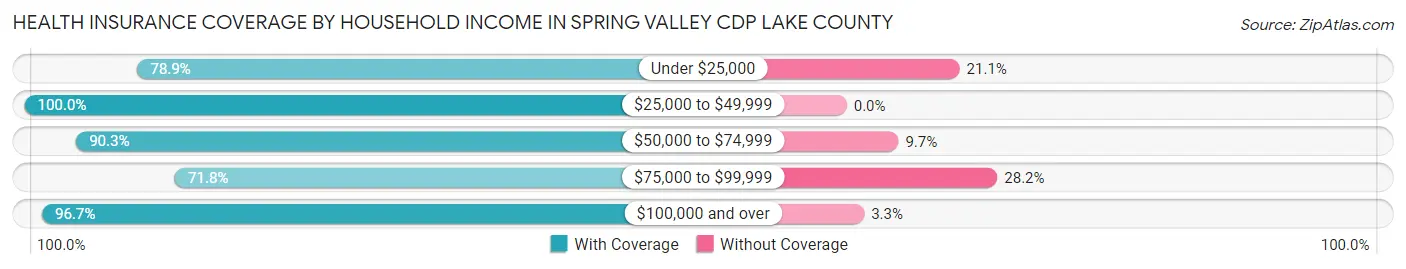
| Household Income | With Coverage | Without Coverage |
| Under $25,000 | 138 (78.9%) | 37 (21.1%) |
| $25,000 to $49,999 | 184 (100.0%) | 0 (0.0%) |
| $50,000 to $74,999 | 140 (90.3%) | 15 (9.7%) |
| $75,000 to $99,999 | 28 (71.8%) | 11 (28.2%) |
| $100,000 and over | 325 (96.7%) | 11 (3.3%) |
Public vs Private Health Insurance Coverage by Age in Spring Valley CDP Lake County
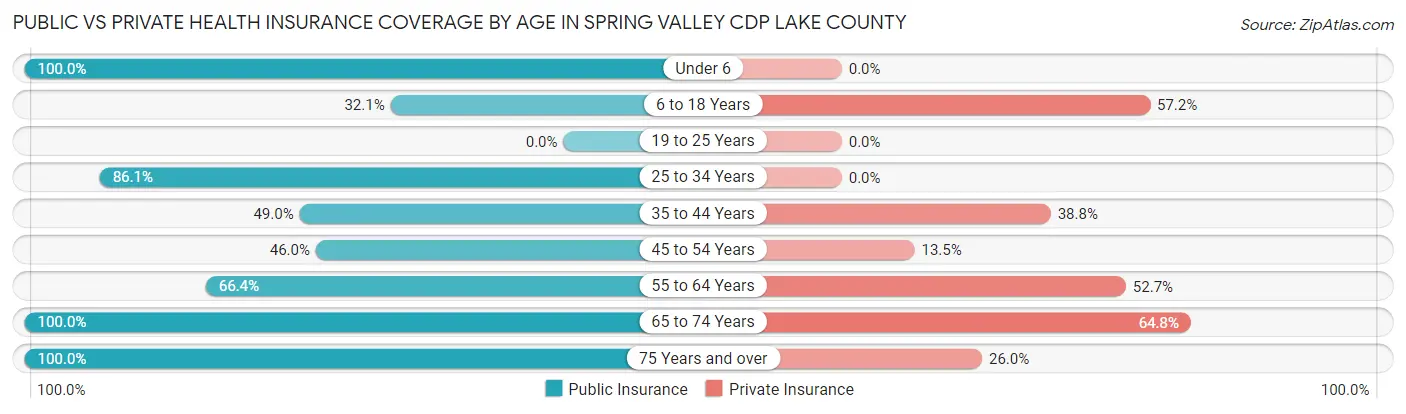
| Age Bracket | Public Insurance | Private Insurance |
| Under 6 | 62 (100.0%) | 0 (0.0%) |
| 6 to 18 Years | 69 (32.1%) | 123 (57.2%) |
| 19 to 25 Years | 0 (0.0%) | 0 (0.0%) |
| 25 to 34 Years | 37 (86.1%) | 0 (0.0%) |
| 35 to 44 Years | 24 (49.0%) | 19 (38.8%) |
| 45 to 54 Years | 17 (46.0%) | 5 (13.5%) |
| 55 to 64 Years | 146 (66.4%) | 116 (52.7%) |
| 65 to 74 Years | 176 (100.0%) | 114 (64.8%) |
| 75 Years and over | 73 (100.0%) | 19 (26.0%) |
| Total | 604 (67.9%) | 396 (44.5%) |
Disability Status by Sex by Age in Spring Valley CDP Lake County
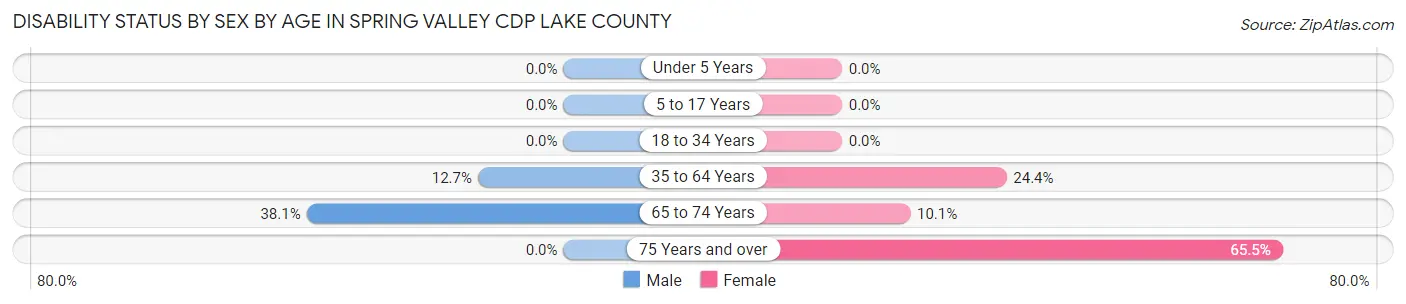
| Age Bracket | Male | Female |
| Under 5 Years | 0 (0.0%) | 0 (0.0%) |
| 5 to 17 Years | 0 (0.0%) | 0 (0.0%) |
| 18 to 34 Years | 0 (0.0%) | 0 (0.0%) |
| 35 to 64 Years | 16 (12.7%) | 44 (24.4%) |
| 65 to 74 Years | 37 (38.1%) | 8 (10.1%) |
| 75 Years and over | 0 (0.0%) | 36 (65.4%) |
Disability Class by Sex by Age in Spring Valley CDP Lake County
Disability Class: Hearing Difficulty
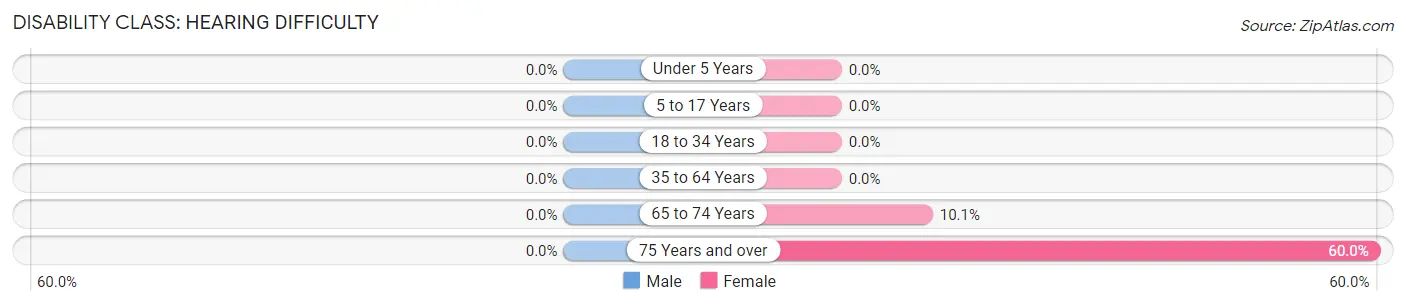
| Age Bracket | Male | Female |
| Under 5 Years | 0 (0.0%) | 0 (0.0%) |
| 5 to 17 Years | 0 (0.0%) | 0 (0.0%) |
| 18 to 34 Years | 0 (0.0%) | 0 (0.0%) |
| 35 to 64 Years | 0 (0.0%) | 0 (0.0%) |
| 65 to 74 Years | 0 (0.0%) | 8 (10.1%) |
| 75 Years and over | 0 (0.0%) | 33 (60.0%) |
Disability Class: Vision Difficulty
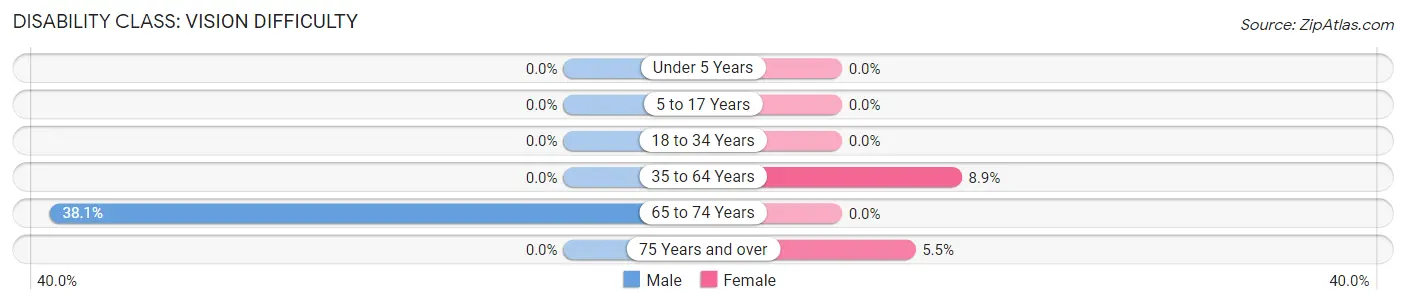
| Age Bracket | Male | Female |
| Under 5 Years | 0 (0.0%) | 0 (0.0%) |
| 5 to 17 Years | 0 (0.0%) | 0 (0.0%) |
| 18 to 34 Years | 0 (0.0%) | 0 (0.0%) |
| 35 to 64 Years | 0 (0.0%) | 16 (8.9%) |
| 65 to 74 Years | 37 (38.1%) | 0 (0.0%) |
| 75 Years and over | 0 (0.0%) | 3 (5.4%) |
Disability Class: Cognitive Difficulty
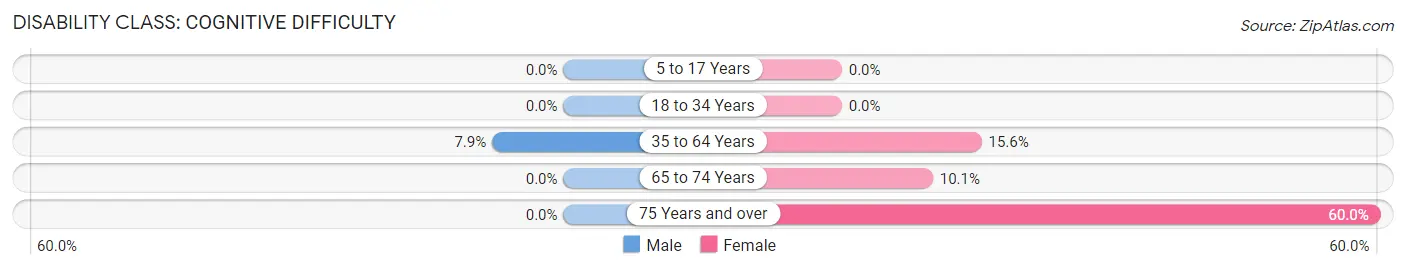
| Age Bracket | Male | Female |
| 5 to 17 Years | 0 (0.0%) | 0 (0.0%) |
| 18 to 34 Years | 0 (0.0%) | 0 (0.0%) |
| 35 to 64 Years | 10 (7.9%) | 28 (15.6%) |
| 65 to 74 Years | 0 (0.0%) | 8 (10.1%) |
| 75 Years and over | 0 (0.0%) | 33 (60.0%) |
Disability Class: Ambulatory Difficulty
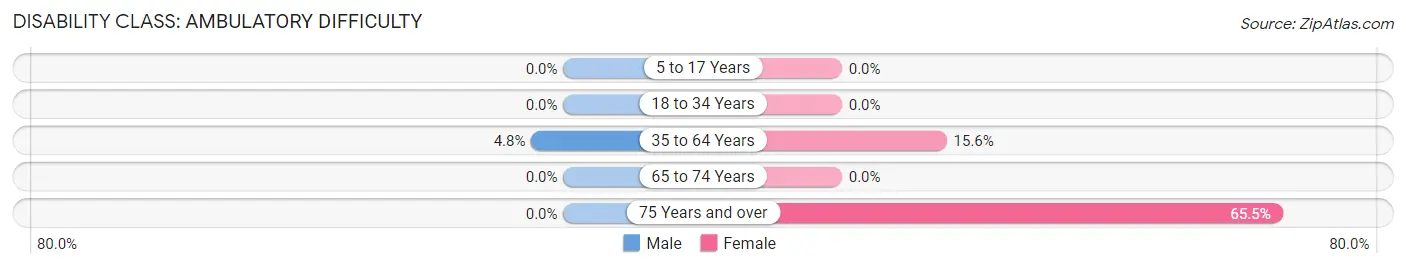
| Age Bracket | Male | Female |
| 5 to 17 Years | 0 (0.0%) | 0 (0.0%) |
| 18 to 34 Years | 0 (0.0%) | 0 (0.0%) |
| 35 to 64 Years | 6 (4.8%) | 28 (15.6%) |
| 65 to 74 Years | 0 (0.0%) | 0 (0.0%) |
| 75 Years and over | 0 (0.0%) | 36 (65.4%) |
Disability Class: Self-Care Difficulty
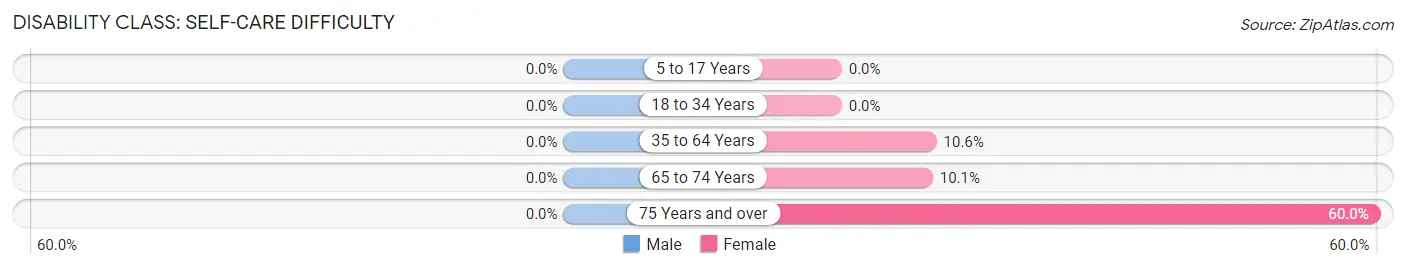
| Age Bracket | Male | Female |
| 5 to 17 Years | 0 (0.0%) | 0 (0.0%) |
| 18 to 34 Years | 0 (0.0%) | 0 (0.0%) |
| 35 to 64 Years | 0 (0.0%) | 19 (10.6%) |
| 65 to 74 Years | 0 (0.0%) | 8 (10.1%) |
| 75 Years and over | 0 (0.0%) | 33 (60.0%) |
Technology Access in Spring Valley CDP Lake County
Computing Device Access in Spring Valley CDP Lake County
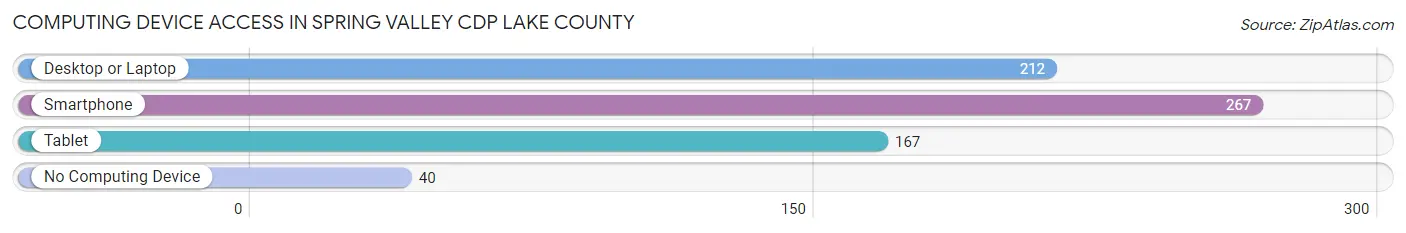
| Device Type | # Households | % Households |
| Desktop or Laptop | 212 | 59.6% |
| Smartphone | 267 | 75.0% |
| Tablet | 167 | 46.9% |
| No Computing Device | 40 | 11.2% |
| Total | 356 | 100.0% |
Internet Access in Spring Valley CDP Lake County
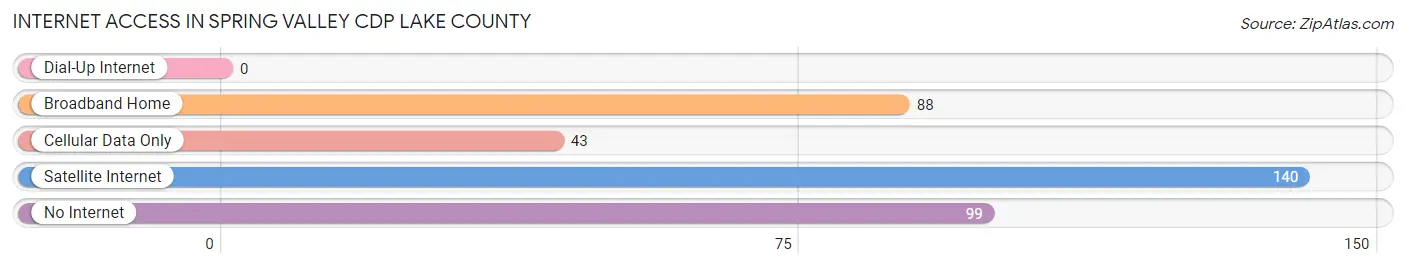
| Internet Type | # Households | % Households |
| Dial-Up Internet | 0 | 0.0% |
| Broadband Home | 88 | 24.7% |
| Cellular Data Only | 43 | 12.1% |
| Satellite Internet | 140 | 39.3% |
| No Internet | 99 | 27.8% |
| Total | 356 | 100.0% |
Spring Valley CDP Lake County Summary
Introduction
Spring Valley Cdp is a census-designated place (CDP) located in Lake County, California. It is located in the northern part of the county, about 10 miles east of Clearlake. The population of Spring Valley Cdp was 1,845 at the 2010 census.
History
The area that is now Spring Valley Cdp was originally inhabited by the Pomo people. The first non-native settlers arrived in the area in the late 1800s. The first post office was established in 1891. The area was originally known as “Spring Valley”, but the name was changed to “Spring Valley Cdp” in the 1970s.
Geography
Spring Valley Cdp is located at 38°58'25"N 122°37'45"W (38.973611, -122.629167). It is situated in the northern part of Lake County, about 10 miles east of Clearlake. The total area of the CDP is 2.2 square miles, all of which is land.
The terrain of Spring Valley Cdp is mostly flat, with some rolling hills. The area is mostly rural, with some residential development. The climate is Mediterranean, with hot, dry summers and mild, wet winters.
Economy
The economy of Spring Valley Cdp is largely based on agriculture. The area is known for its production of walnuts, almonds, and other tree nuts. Other crops grown in the area include grapes, olives, and hay.
The area also has some light industry, including a few small manufacturing plants. There are also some small businesses in the area, including restaurants, gas stations, and convenience stores.
Demographics
As of the 2010 census, the population of Spring Valley Cdp was 1,845. The racial makeup of the CDP was 79.3% White, 0.7% African American, 0.7% Native American, 0.7% Asian, 0.2% Pacific Islander, 16.2% from other races, and 2.3% from two or more races. Hispanic or Latino of any race were 28.2% of the population.
The median household income in Spring Valley Cdp was $37,917, and the median family income was $41,250. About 17.3% of families and 20.2% of the population were below the poverty line, including 28.3% of those under age 18 and 8.3% of those age 65 or over.
Conclusion
Spring Valley Cdp is a census-designated place located in Lake County, California. It is situated in the northern part of the county, about 10 miles east of Clearlake. The population of Spring Valley Cdp was 1,845 at the 2010 census. The economy of the area is largely based on agriculture, with some light industry and small businesses. The racial makeup of the CDP was 79.3% White, 0.7% African American, 0.7% Native American, 0.7% Asian, 0.2% Pacific Islander, 16.2% from other races, and 2.3% from two or more races. The median household income in Spring Valley Cdp was $37,917, and the median family income was $41,250.
Common Questions
What is Per Capita Income in Spring Valley CDP Lake County?
Per Capita income in Spring Valley CDP Lake County is $37,683.
What is the Median Family Income in Spring Valley CDP Lake County?
Median Family Income in Spring Valley CDP Lake County is $78,000.
What is the Median Household income in Spring Valley CDP Lake County?
Median Household Income in Spring Valley CDP Lake County is $41,486.
What is Income or Wage Gap in Spring Valley CDP Lake County?
Income or Wage Gap in Spring Valley CDP Lake County is 70.5%.
Women in Spring Valley CDP Lake County earn 29.5 cents for every dollar earned by a man.
What is Inequality or Gini Index in Spring Valley CDP Lake County?
Inequality or Gini Index in Spring Valley CDP Lake County is 0.63.
What is the Total Population of Spring Valley CDP Lake County?
Total Population of Spring Valley CDP Lake County is 889.
What is the Total Male Population of Spring Valley CDP Lake County?
Total Male Population of Spring Valley CDP Lake County is 385.
What is the Total Female Population of Spring Valley CDP Lake County?
Total Female Population of Spring Valley CDP Lake County is 504.
What is the Ratio of Males per 100 Females in Spring Valley CDP Lake County?
There are 76.39 Males per 100 Females in Spring Valley CDP Lake County.
What is the Ratio of Females per 100 Males in Spring Valley CDP Lake County?
There are 130.91 Females per 100 Males in Spring Valley CDP Lake County.
What is the Median Population Age in Spring Valley CDP Lake County?
Median Population Age in Spring Valley CDP Lake County is 55.9 Years.
What is the Average Family Size in Spring Valley CDP Lake County
Average Family Size in Spring Valley CDP Lake County is 3.5 People.
What is the Average Household Size in Spring Valley CDP Lake County
Average Household Size in Spring Valley CDP Lake County is 2.5 People.
How Large is the Labor Force in Spring Valley CDP Lake County?
There are 251 People in the Labor Forcein in Spring Valley CDP Lake County.
What is the Percentage of People in the Labor Force in Spring Valley CDP Lake County?
33.2% of People are in the Labor Force in Spring Valley CDP Lake County.