Cities with the Highest Percentage of Population Employed in Security & Protection in New Mexico
RELATED REPORTS & OPTIONS
Security & Protection
New Mexico
Compare Cities
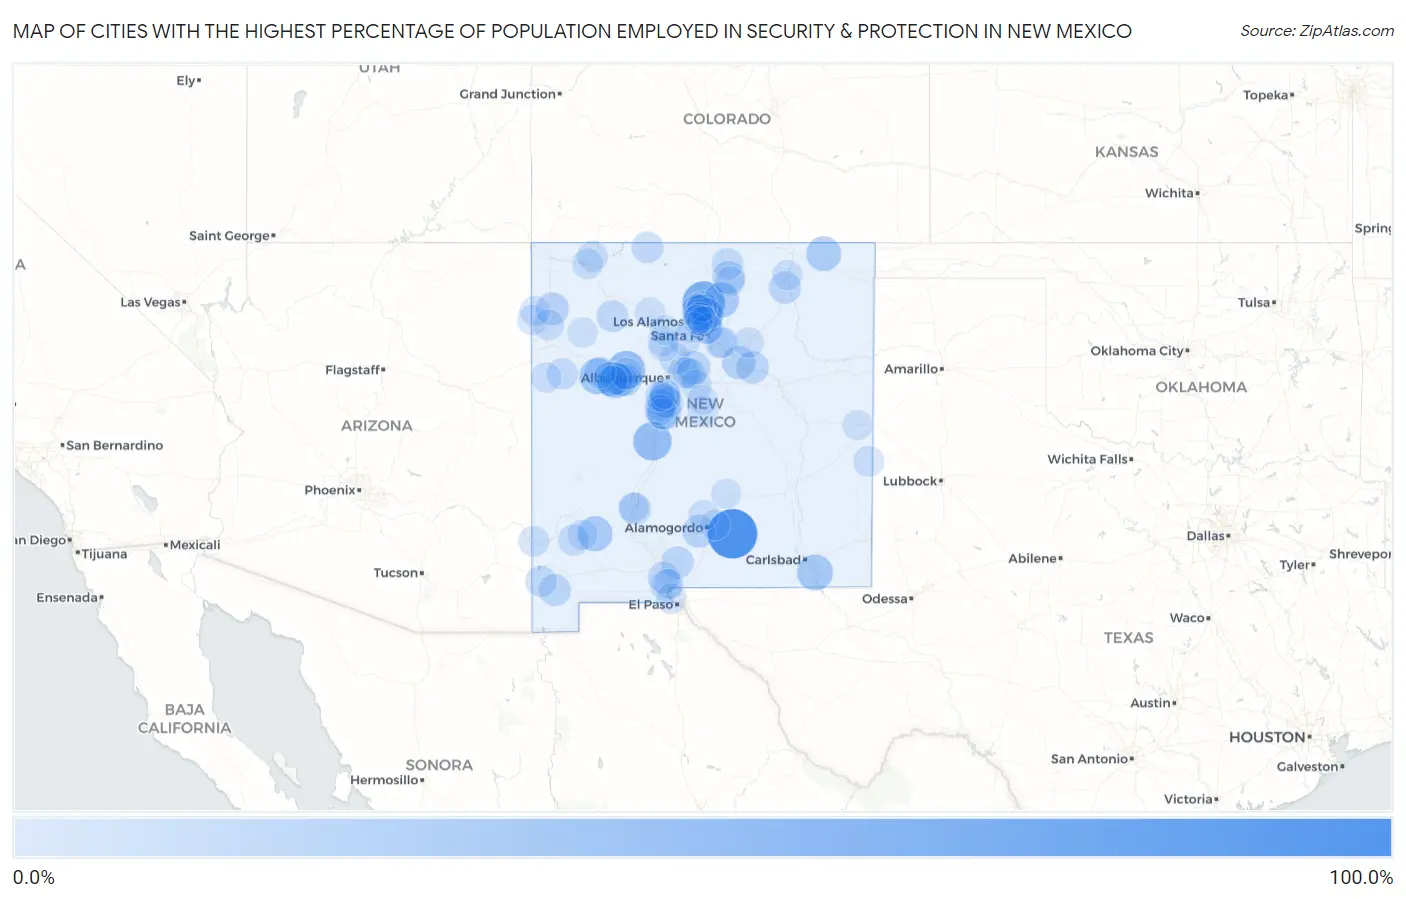
Map of Cities with the Highest Percentage of Population Employed in Security & Protection in New Mexico
0.0%
100.0%
Cities with the Highest Percentage of Population Employed in Security & Protection in New Mexico
| City | % Employed | vs State | vs National | |
| 1. | Weed | 100.0% | 2.8%(+97.2)#1 | 2.1%(+97.9)#3 |
| 2. | Lyden | 63.5% | 2.8%(+60.7)#2 | 2.1%(+61.3)#13 |
| 3. | Cuartelez | 49.7% | 2.8%(+47.0)#3 | 2.1%(+47.6)#33 |
| 4. | Lemitar | 44.3% | 2.8%(+41.5)#4 | 2.1%(+42.1)#44 |
| 5. | Seboyeta | 42.2% | 2.8%(+39.4)#5 | 2.1%(+40.0)#54 |
| 6. | Borrego Pass | 38.9% | 2.8%(+36.1)#6 | 2.1%(+36.7)#65 |
| 7. | South Acomita Village | 33.3% | 2.8%(+30.6)#7 | 2.1%(+31.2)#91 |
| 8. | San Rafael | 32.6% | 2.8%(+29.9)#8 | 2.1%(+30.5)#98 |
| 9. | Malaga | 31.9% | 2.8%(+29.1)#9 | 2.1%(+29.7)#103 |
| 10. | Picuris Pueblo | 29.0% | 2.8%(+26.3)#10 | 2.1%(+26.9)#125 |
| 11. | San Lorenzo | 27.5% | 2.8%(+24.7)#11 | 2.1%(+25.4)#143 |
| 12. | Folsom | 26.7% | 2.8%(+23.9)#12 | 2.1%(+24.5)#152 |
| 13. | Madrone | 25.9% | 2.8%(+23.1)#13 | 2.1%(+23.7)#164 |
| 14. | Fort Wingate | 25.3% | 2.8%(+22.6)#14 | 2.1%(+23.2)#172 |
| 15. | Mccartys Village | 21.8% | 2.8%(+19.1)#15 | 2.1%(+19.7)#236 |
| 16. | Sena | 19.3% | 2.8%(+16.6)#16 | 2.1%(+17.2)#296 |
| 17. | Naschitti | 17.5% | 2.8%(+14.8)#17 | 2.1%(+15.4)#354 |
| 18. | San Pedro | 17.3% | 2.8%(+14.5)#18 | 2.1%(+15.2)#367 |
| 19. | Holloman Afb | 17.0% | 2.8%(+14.2)#19 | 2.1%(+14.9)#384 |
| 20. | Laguna | 16.4% | 2.8%(+13.6)#20 | 2.1%(+14.2)#413 |
| 21. | Arroyo Seco | 16.4% | 2.8%(+13.6)#21 | 2.1%(+14.2)#415 |
| 22. | La Puebla | 16.3% | 2.8%(+13.5)#22 | 2.1%(+14.1)#423 |
| 23. | Tecolotito | 15.2% | 2.8%(+12.4)#23 | 2.1%(+13.0)#475 |
| 24. | Paraje | 14.5% | 2.8%(+11.7)#24 | 2.1%(+12.3)#525 |
| 25. | Springer | 14.5% | 2.8%(+11.7)#25 | 2.1%(+12.3)#526 |
| 26. | Tesuque Pueblo | 13.8% | 2.8%(+11.0)#26 | 2.1%(+11.6)#584 |
| 27. | Elephant Butte | 13.6% | 2.8%(+10.9)#27 | 2.1%(+11.5)#601 |
| 28. | Tome | 13.5% | 2.8%(+10.7)#28 | 2.1%(+11.3)#615 |
| 29. | White Sands | 13.3% | 2.8%(+10.5)#29 | 2.1%(+11.1)#635 |
| 30. | Windmill | 13.0% | 2.8%(+10.3)#30 | 2.1%(+10.9)#658 |
| 31. | North Acomita Village | 12.9% | 2.8%(+10.1)#31 | 2.1%(+10.7)#674 |
| 32. | White Cliffs | 12.4% | 2.8%(+9.67)#32 | 2.1%(+10.3)#718 |
| 33. | Chamberino | 11.9% | 2.8%(+9.16)#33 | 2.1%(+9.77)#772 |
| 34. | Paguate | 11.8% | 2.8%(+9.00)#34 | 2.1%(+9.62)#793 |
| 35. | Pueblo Pintado | 11.8% | 2.8%(+9.00)#35 | 2.1%(+9.62)#797 |
| 36. | Valencia | 11.7% | 2.8%(+8.98)#36 | 2.1%(+9.60)#804 |
| 37. | Las Maravillas | 11.7% | 2.8%(+8.96)#37 | 2.1%(+9.57)#807 |
| 38. | San Miguel | 11.6% | 2.8%(+8.86)#38 | 2.1%(+9.47)#823 |
| 39. | Sausal | 11.6% | 2.8%(+8.82)#39 | 2.1%(+9.43)#828 |
| 40. | Dulce | 11.5% | 2.8%(+8.72)#40 | 2.1%(+9.33)#840 |
| 41. | Questa | 10.7% | 2.8%(+7.93)#41 | 2.1%(+8.55)#969 |
| 42. | Ramah | 9.9% | 2.8%(+7.13)#42 | 2.1%(+7.74)#1,115 |
| 43. | Grants | 9.9% | 2.8%(+7.09)#43 | 2.1%(+7.70)#1,121 |
| 44. | Skyline Ganipa | 9.8% | 2.8%(+7.02)#44 | 2.1%(+7.63)#1,145 |
| 45. | Tyrone | 9.7% | 2.8%(+6.97)#45 | 2.1%(+7.58)#1,152 |
| 46. | Cotton City | 9.7% | 2.8%(+6.92)#46 | 2.1%(+7.53)#1,159 |
| 47. | Sandia Park | 9.5% | 2.8%(+6.76)#47 | 2.1%(+7.38)#1,190 |
| 48. | Santa Ana Pueblo | 9.2% | 2.8%(+6.44)#48 | 2.1%(+7.06)#1,263 |
| 49. | Edith Enclave | 9.1% | 2.8%(+6.33)#49 | 2.1%(+6.94)#1,297 |
| 50. | Chimayo | 9.0% | 2.8%(+6.26)#50 | 2.1%(+6.87)#1,330 |
| 51. | Pecos | 8.7% | 2.8%(+5.96)#51 | 2.1%(+6.57)#1,423 |
| 52. | El Duende | 8.4% | 2.8%(+5.66)#52 | 2.1%(+6.27)#1,512 |
| 53. | Sandia Knolls | 7.7% | 2.8%(+4.96)#53 | 2.1%(+5.57)#1,752 |
| 54. | Ohkay Owingeh | 7.6% | 2.8%(+4.84)#54 | 2.1%(+5.45)#1,800 |
| 55. | Virden | 7.4% | 2.8%(+4.65)#55 | 2.1%(+5.26)#1,900 |
| 56. | Isleta | 7.3% | 2.8%(+4.56)#56 | 2.1%(+5.17)#1,938 |
| 57. | Santa Clara Pueblo | 7.1% | 2.8%(+4.38)#57 | 2.1%(+4.99)#1,995 |
| 58. | Aztec | 7.0% | 2.8%(+4.29)#58 | 2.1%(+4.90)#2,051 |
| 59. | El Cerro | 6.9% | 2.8%(+4.14)#59 | 2.1%(+4.75)#2,131 |
| 60. | Indian Hills | 6.9% | 2.8%(+4.10)#60 | 2.1%(+4.72)#2,151 |
| 61. | Causey | 6.8% | 2.8%(+4.02)#61 | 2.1%(+4.63)#2,197 |
| 62. | Tohatchi | 6.7% | 2.8%(+3.97)#62 | 2.1%(+4.58)#2,230 |
| 63. | Lee Acres | 6.5% | 2.8%(+3.75)#63 | 2.1%(+4.37)#2,351 |
| 64. | Hernandez | 6.5% | 2.8%(+3.75)#64 | 2.1%(+4.36)#2,352 |
| 65. | La Cueva | 6.4% | 2.8%(+3.68)#65 | 2.1%(+4.30)#2,398 |
| 66. | Navajo | 6.2% | 2.8%(+3.49)#66 | 2.1%(+4.10)#2,521 |
| 67. | Casa Colorada | 6.0% | 2.8%(+3.25)#67 | 2.1%(+3.87)#2,697 |
| 68. | Black Rock | 5.9% | 2.8%(+3.13)#68 | 2.1%(+3.75)#2,799 |
| 69. | Pueblitos | 5.9% | 2.8%(+3.09)#69 | 2.1%(+3.71)#2,841 |
| 70. | Sunland Park | 5.8% | 2.8%(+3.03)#70 | 2.1%(+3.65)#2,888 |
| 71. | Willard | 5.6% | 2.8%(+2.84)#71 | 2.1%(+3.45)#3,056 |
| 72. | Bosque Farms | 5.6% | 2.8%(+2.79)#72 | 2.1%(+3.41)#3,099 |
| 73. | Nambe | 5.5% | 2.8%(+2.76)#73 | 2.1%(+3.37)#3,135 |
| 74. | San Jose Cdp Rio Arriba County | 5.5% | 2.8%(+2.74)#74 | 2.1%(+3.36)#3,152 |
| 75. | White Rock | 5.2% | 2.8%(+2.47)#75 | 2.1%(+3.08)#3,457 |
| 76. | Cochiti | 5.2% | 2.8%(+2.41)#76 | 2.1%(+3.02)#3,504 |
| 77. | Tularosa | 5.1% | 2.8%(+2.29)#77 | 2.1%(+2.90)#3,638 |
| 78. | Maxwell | 5.0% | 2.8%(+2.28)#78 | 2.1%(+2.89)#3,646 |
| 79. | High Rolls | 5.0% | 2.8%(+2.27)#79 | 2.1%(+2.88)#3,654 |
| 80. | Peak Place | 5.0% | 2.8%(+2.26)#80 | 2.1%(+2.88)#3,663 |
| 81. | Santa Clara | 5.0% | 2.8%(+2.25)#81 | 2.1%(+2.86)#3,678 |
| 82. | Las Vegas | 5.0% | 2.8%(+2.25)#82 | 2.1%(+2.86)#3,679 |
| 83. | Crystal | 5.0% | 2.8%(+2.24)#83 | 2.1%(+2.85)#3,696 |
| 84. | Los Lunas | 4.9% | 2.8%(+2.10)#84 | 2.1%(+2.71)#3,853 |
| 85. | Edgewood | 4.7% | 2.8%(+1.97)#85 | 2.1%(+2.59)#3,992 |
| 86. | Jemez Pueblo | 4.7% | 2.8%(+1.96)#86 | 2.1%(+2.58)#4,008 |
| 87. | La Villita | 4.7% | 2.8%(+1.96)#87 | 2.1%(+2.57)#4,010 |
| 88. | Cuba | 4.6% | 2.8%(+1.87)#88 | 2.1%(+2.48)#4,138 |
| 89. | Zia Pueblo | 4.5% | 2.8%(+1.77)#89 | 2.1%(+2.39)#4,276 |
| 90. | La Mesilla | 4.4% | 2.8%(+1.62)#90 | 2.1%(+2.24)#4,486 |
| 91. | Jacona | 4.4% | 2.8%(+1.62)#91 | 2.1%(+2.24)#4,488 |
| 92. | Taos Pueblo | 4.3% | 2.8%(+1.53)#92 | 2.1%(+2.14)#4,627 |
| 93. | Crownpoint | 4.2% | 2.8%(+1.46)#93 | 2.1%(+2.08)#4,715 |
| 94. | Berino | 4.2% | 2.8%(+1.44)#94 | 2.1%(+2.06)#4,747 |
| 95. | Estancia | 4.1% | 2.8%(+1.37)#95 | 2.1%(+1.98)#4,861 |
| 96. | Jemez Springs | 4.1% | 2.8%(+1.36)#96 | 2.1%(+1.97)#4,889 |
| 97. | Ruidoso | 4.1% | 2.8%(+1.35)#97 | 2.1%(+1.96)#4,905 |
| 98. | San Ildefonso Pueblo | 4.1% | 2.8%(+1.35)#98 | 2.1%(+1.96)#4,910 |
| 99. | Cannon Afb | 4.0% | 2.8%(+1.26)#99 | 2.1%(+1.87)#5,057 |
| 100. | Truth Or Consequences | 4.0% | 2.8%(+1.23)#100 | 2.1%(+1.84)#5,122 |
Common Questions
What are the Top 10 Cities with the Highest Percentage of Population Employed in Security & Protection in New Mexico?
Top 10 Cities with the Highest Percentage of Population Employed in Security & Protection in New Mexico are:
#1
100.0%
#2
63.5%
#3
49.7%
#4
44.3%
#5
42.2%
#6
33.3%
#7
32.6%
#8
31.9%
#9
29.0%
#10
27.5%
What city has the Highest Percentage of Population Employed in Security & Protection in New Mexico?
Weed has the Highest Percentage of Population Employed in Security & Protection in New Mexico with 100.0%.
What is the Percentage of Population Employed in Security & Protection in the State of New Mexico?
Percentage of Population Employed in Security & Protection in New Mexico is 2.8%.
What is the Percentage of Population Employed in Security & Protection in the United States?
Percentage of Population Employed in Security & Protection in the United States is 2.1%.