Cities with the Highest Percentage of Population Employed in Security & Protection in Colorado
RELATED REPORTS & OPTIONS
Security & Protection
Colorado
Compare Cities
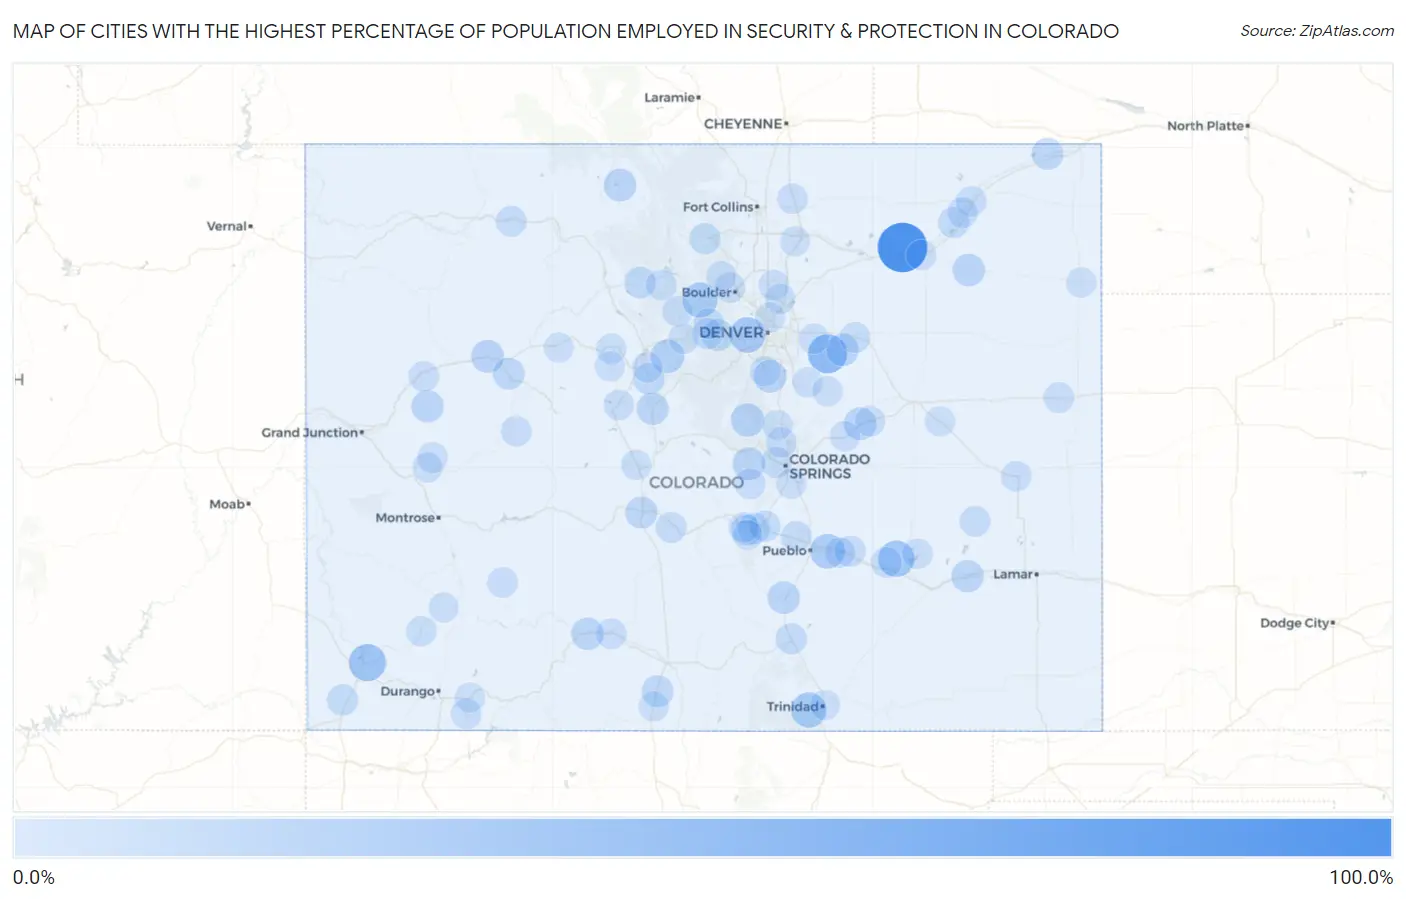
Map of Cities with the Highest Percentage of Population Employed in Security & Protection in Colorado
0.0%
100.0%
Cities with the Highest Percentage of Population Employed in Security & Protection in Colorado
| City | % Employed | vs State | vs National | |
| 1. | Saddle Ridge | 93.3% | 2.0%(+91.3)#1 | 2.1%(+91.2)#8 |
| 2. | Brick Center | 44.3% | 2.0%(+42.3)#2 | 2.1%(+42.2)#43 |
| 3. | Dolores | 34.2% | 2.0%(+32.2)#3 | 2.1%(+32.0)#86 |
| 4. | Crowley | 31.0% | 2.0%(+28.9)#4 | 2.1%(+28.8)#111 |
| 5. | Nathrop | 29.6% | 2.0%(+27.6)#5 | 2.1%(+27.5)#121 |
| 6. | East Pleasant View | 27.6% | 2.0%(+25.5)#6 | 2.1%(+25.4)#142 |
| 7. | Pine Valley | 26.5% | 2.0%(+24.5)#7 | 2.1%(+24.4)#154 |
| 8. | Cokedale | 25.8% | 2.0%(+23.8)#8 | 2.1%(+23.7)#166 |
| 9. | Eldora | 24.6% | 2.0%(+22.6)#9 | 2.1%(+22.5)#193 |
| 10. | Twin Lakes Cdp Lake County | 24.2% | 2.0%(+22.2)#10 | 2.1%(+22.0)#200 |
| 11. | Vineland | 23.8% | 2.0%(+21.8)#11 | 2.1%(+21.7)#206 |
| 12. | Montezuma | 18.6% | 2.0%(+16.6)#12 | 2.1%(+16.5)#312 |
| 13. | Westcreek | 17.2% | 2.0%(+15.2)#13 | 2.1%(+15.0)#373 |
| 14. | Sedalia | 15.8% | 2.0%(+13.8)#14 | 2.1%(+13.6)#448 |
| 15. | Chacra | 15.6% | 2.0%(+13.6)#15 | 2.1%(+13.4)#458 |
| 16. | Midland | 14.9% | 2.0%(+12.9)#16 | 2.1%(+12.8)#491 |
| 17. | Walden | 14.8% | 2.0%(+12.8)#17 | 2.1%(+12.6)#499 |
| 18. | Ramah | 14.7% | 2.0%(+12.7)#18 | 2.1%(+12.6)#502 |
| 19. | Colorado City | 14.0% | 2.0%(+12.0)#19 | 2.1%(+11.9)#564 |
| 20. | Akron | 13.7% | 2.0%(+11.7)#20 | 2.1%(+11.6)#588 |
| 21. | Collbran | 13.2% | 2.0%(+11.2)#21 | 2.1%(+11.0)#643 |
| 22. | Comanche Creek | 13.1% | 2.0%(+11.1)#22 | 2.1%(+11.0)#650 |
| 23. | Gerrard | 13.1% | 2.0%(+11.1)#23 | 2.1%(+11.0)#652 |
| 24. | Las Animas | 13.0% | 2.0%(+11.0)#24 | 2.1%(+10.8)#665 |
| 25. | Fairplay | 12.8% | 2.0%(+10.7)#25 | 2.1%(+10.6)#687 |
| 26. | Poncha Springs | 11.8% | 2.0%(+9.84)#26 | 2.1%(+9.70)#782 |
| 27. | Floyd Hill | 11.8% | 2.0%(+9.76)#27 | 2.1%(+9.62)#791 |
| 28. | Cattle Creek | 11.0% | 2.0%(+8.95)#28 | 2.1%(+8.81)#931 |
| 29. | Sedgwick | 10.8% | 2.0%(+8.84)#29 | 2.1%(+8.69)#946 |
| 30. | La Jara | 10.8% | 2.0%(+8.78)#30 | 2.1%(+8.64)#956 |
| 31. | Blue River | 9.9% | 2.0%(+7.89)#31 | 2.1%(+7.74)#1,114 |
| 32. | Hot Sulphur Springs | 9.2% | 2.0%(+7.21)#32 | 2.1%(+7.06)#1,260 |
| 33. | Towaoc | 8.9% | 2.0%(+6.89)#33 | 2.1%(+6.75)#1,369 |
| 34. | Florence | 8.4% | 2.0%(+6.43)#34 | 2.1%(+6.28)#1,510 |
| 35. | Walsenburg | 8.4% | 2.0%(+6.39)#35 | 2.1%(+6.25)#1,518 |
| 36. | Merino | 8.4% | 2.0%(+6.38)#36 | 2.1%(+6.23)#1,523 |
| 37. | Penrose | 8.0% | 2.0%(+6.01)#37 | 2.1%(+5.87)#1,652 |
| 38. | Estes Park | 7.7% | 2.0%(+5.74)#38 | 2.1%(+5.60)#1,746 |
| 39. | Canon City | 7.5% | 2.0%(+5.51)#39 | 2.1%(+5.37)#1,847 |
| 40. | Boone | 7.4% | 2.0%(+5.40)#40 | 2.1%(+5.26)#1,898 |
| 41. | Upper Witter Gulch | 7.1% | 2.0%(+5.12)#41 | 2.1%(+4.98)#2,013 |
| 42. | Howard | 7.1% | 2.0%(+5.07)#42 | 2.1%(+4.93)#2,037 |
| 43. | Hayden | 6.9% | 2.0%(+4.87)#43 | 2.1%(+4.73)#2,146 |
| 44. | Williamsburg | 6.8% | 2.0%(+4.79)#44 | 2.1%(+4.65)#2,184 |
| 45. | Haswell | 6.7% | 2.0%(+4.66)#45 | 2.1%(+4.52)#2,274 |
| 46. | Manitou Springs | 6.5% | 2.0%(+4.45)#46 | 2.1%(+4.31)#2,381 |
| 47. | Pueblo West | 6.4% | 2.0%(+4.36)#47 | 2.1%(+4.22)#2,459 |
| 48. | Olney Springs | 6.2% | 2.0%(+4.25)#48 | 2.1%(+4.10)#2,527 |
| 49. | Byers | 6.2% | 2.0%(+4.20)#49 | 2.1%(+4.06)#2,562 |
| 50. | Pine Brook Hill | 6.1% | 2.0%(+4.13)#50 | 2.1%(+3.99)#2,601 |
| 51. | Victor | 6.1% | 2.0%(+4.09)#51 | 2.1%(+3.95)#2,626 |
| 52. | Bethune | 6.1% | 2.0%(+4.09)#52 | 2.1%(+3.95)#2,627 |
| 53. | Ignacio | 6.0% | 2.0%(+4.01)#53 | 2.1%(+3.87)#2,695 |
| 54. | Idaho Springs | 5.9% | 2.0%(+3.93)#54 | 2.1%(+3.79)#2,763 |
| 55. | Del Norte | 5.9% | 2.0%(+3.93)#55 | 2.1%(+3.79)#2,767 |
| 56. | Kit Carson | 5.8% | 2.0%(+3.79)#56 | 2.1%(+3.65)#2,886 |
| 57. | Leadville | 5.8% | 2.0%(+3.78)#57 | 2.1%(+3.63)#2,899 |
| 58. | Marble | 5.8% | 2.0%(+3.76)#58 | 2.1%(+3.62)#2,912 |
| 59. | Pierce | 5.7% | 2.0%(+3.73)#59 | 2.1%(+3.59)#2,935 |
| 60. | Sterling | 5.7% | 2.0%(+3.68)#60 | 2.1%(+3.54)#2,973 |
| 61. | Atwood | 5.7% | 2.0%(+3.68)#61 | 2.1%(+3.53)#2,980 |
| 62. | Granby | 5.7% | 2.0%(+3.65)#62 | 2.1%(+3.50)#3,008 |
| 63. | Watkins | 5.6% | 2.0%(+3.63)#63 | 2.1%(+3.49)#3,026 |
| 64. | Black Hawk | 5.6% | 2.0%(+3.55)#64 | 2.1%(+3.41)#3,113 |
| 65. | Battlement Mesa | 5.5% | 2.0%(+3.48)#65 | 2.1%(+3.34)#3,174 |
| 66. | Calhan | 5.5% | 2.0%(+3.48)#66 | 2.1%(+3.34)#3,177 |
| 67. | Breckenridge | 5.4% | 2.0%(+3.36)#67 | 2.1%(+3.22)#3,288 |
| 68. | Sugar City | 5.3% | 2.0%(+3.29)#68 | 2.1%(+3.15)#3,377 |
| 69. | Winter Park | 5.2% | 2.0%(+3.24)#69 | 2.1%(+3.09)#3,439 |
| 70. | Cedaredge | 5.2% | 2.0%(+3.19)#70 | 2.1%(+3.05)#3,481 |
| 71. | Air Force Academy | 5.1% | 2.0%(+3.12)#71 | 2.1%(+2.97)#3,563 |
| 72. | Dacono | 5.1% | 2.0%(+3.09)#72 | 2.1%(+2.95)#3,593 |
| 73. | Simla | 4.9% | 2.0%(+2.86)#73 | 2.1%(+2.71)#3,855 |
| 74. | Rico | 4.8% | 2.0%(+2.79)#74 | 2.1%(+2.65)#3,928 |
| 75. | Lake City | 4.7% | 2.0%(+2.69)#75 | 2.1%(+2.55)#4,042 |
| 76. | Vail | 4.7% | 2.0%(+2.65)#76 | 2.1%(+2.51)#4,100 |
| 77. | Avondale | 4.6% | 2.0%(+2.63)#77 | 2.1%(+2.49)#4,128 |
| 78. | Brookside | 4.6% | 2.0%(+2.58)#78 | 2.1%(+2.44)#4,203 |
| 79. | Buena Vista | 4.5% | 2.0%(+2.54)#79 | 2.1%(+2.40)#4,236 |
| 80. | Brush | 4.5% | 2.0%(+2.50)#80 | 2.1%(+2.36)#4,310 |
| 81. | Red Cliff | 4.4% | 2.0%(+2.39)#81 | 2.1%(+2.25)#4,473 |
| 82. | Silver Plume | 4.4% | 2.0%(+2.39)#82 | 2.1%(+2.25)#4,475 |
| 83. | Hugo | 4.3% | 2.0%(+2.31)#83 | 2.1%(+2.16)#4,597 |
| 84. | Romeo | 4.2% | 2.0%(+2.21)#84 | 2.1%(+2.07)#4,732 |
| 85. | Louviers | 4.2% | 2.0%(+2.16)#85 | 2.1%(+2.02)#4,796 |
| 86. | Jamestown | 4.1% | 2.0%(+2.14)#86 | 2.1%(+2.00)#4,841 |
| 87. | Palmer Lake | 4.1% | 2.0%(+2.10)#87 | 2.1%(+1.96)#4,921 |
| 88. | Bayfield | 4.1% | 2.0%(+2.07)#88 | 2.1%(+1.93)#4,977 |
| 89. | Todd Creek | 4.1% | 2.0%(+2.06)#89 | 2.1%(+1.92)#4,982 |
| 90. | Fort Carson | 4.0% | 2.0%(+2.04)#90 | 2.1%(+1.90)#5,010 |
| 91. | Ponderosa Park | 4.0% | 2.0%(+2.03)#91 | 2.1%(+1.88)#5,032 |
| 92. | Evans | 4.0% | 2.0%(+2.00)#92 | 2.1%(+1.85)#5,083 |
| 93. | Trinidad | 4.0% | 2.0%(+1.98)#93 | 2.1%(+1.84)#5,126 |
| 94. | Kiowa | 4.0% | 2.0%(+1.98)#94 | 2.1%(+1.84)#5,129 |
| 95. | Ophir | 4.0% | 2.0%(+1.96)#95 | 2.1%(+1.82)#5,165 |
| 96. | Wray | 4.0% | 2.0%(+1.96)#96 | 2.1%(+1.82)#5,171 |
| 97. | Eagle | 4.0% | 2.0%(+1.96)#97 | 2.1%(+1.81)#5,175 |
| 98. | Welby | 4.0% | 2.0%(+1.95)#98 | 2.1%(+1.80)#5,198 |
| 99. | Rockvale | 3.9% | 2.0%(+1.92)#99 | 2.1%(+1.77)#5,250 |
| 100. | Orchard City | 3.9% | 2.0%(+1.87)#100 | 2.1%(+1.73)#5,338 |
Common Questions
What are the Top 10 Cities with the Highest Percentage of Population Employed in Security & Protection in Colorado?
Top 10 Cities with the Highest Percentage of Population Employed in Security & Protection in Colorado are:
#1
93.3%
#2
44.3%
#3
34.2%
#4
31.0%
#5
27.6%
#6
25.8%
#7
24.6%
#8
23.8%
#9
18.6%
#10
17.2%
What city has the Highest Percentage of Population Employed in Security & Protection in Colorado?
Saddle Ridge has the Highest Percentage of Population Employed in Security & Protection in Colorado with 93.3%.
What is the Percentage of Population Employed in Security & Protection in the State of Colorado?
Percentage of Population Employed in Security & Protection in Colorado is 2.0%.
What is the Percentage of Population Employed in Security & Protection in the United States?
Percentage of Population Employed in Security & Protection in the United States is 2.1%.