Cities with the Highest Percentage of Population Employed in Security & Protection in Mississippi
RELATED REPORTS & OPTIONS
Security & Protection
Mississippi
Compare Cities
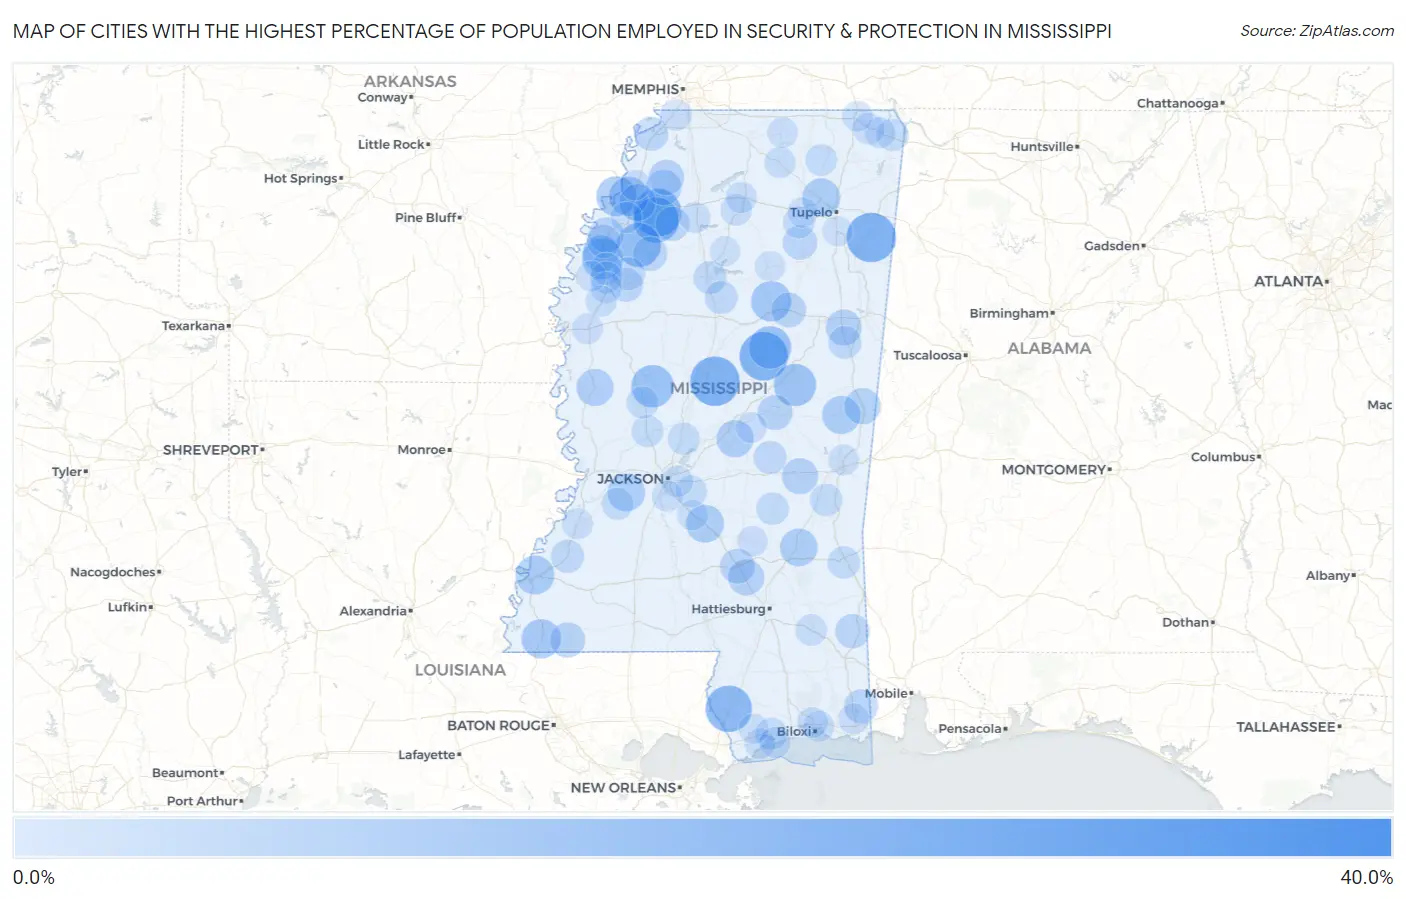
Map of Cities with the Highest Percentage of Population Employed in Security & Protection in Mississippi
0.0%
40.0%
Cities with the Highest Percentage of Population Employed in Security & Protection in Mississippi
| City | % Employed | vs State | vs National | |
| 1. | Eastabuchie | 37.8% | 2.4%(+35.4)#1 | 2.1%(+35.7)#70 |
| 2. | Redwood | 23.9% | 2.4%(+21.5)#2 | 2.1%(+21.8)#202 |
| 3. | Smithville | 23.2% | 2.4%(+20.9)#3 | 2.1%(+21.1)#215 |
| 4. | Sallis | 23.2% | 2.4%(+20.8)#4 | 2.1%(+21.0)#217 |
| 5. | Mccool | 22.2% | 2.4%(+19.8)#5 | 2.1%(+20.1)#232 |
| 6. | Marks | 21.5% | 2.4%(+19.2)#6 | 2.1%(+19.4)#241 |
| 7. | Hide A Way Lake | 20.1% | 2.4%(+17.7)#7 | 2.1%(+18.0)#271 |
| 8. | Lambert | 19.1% | 2.4%(+16.8)#8 | 2.1%(+17.0)#301 |
| 9. | Tutwiler | 17.6% | 2.4%(+15.3)#9 | 2.1%(+15.5)#348 |
| 10. | Eden | 16.1% | 2.4%(+13.7)#10 | 2.1%(+13.9)#432 |
| 11. | Weir | 16.0% | 2.4%(+13.7)#11 | 2.1%(+13.9)#433 |
| 12. | Noxapater | 15.8% | 2.4%(+13.4)#12 | 2.1%(+13.7)#443 |
| 13. | Winstonville | 14.6% | 2.4%(+12.2)#13 | 2.1%(+12.4)#514 |
| 14. | Walthall | 13.9% | 2.4%(+11.5)#14 | 2.1%(+11.7)#574 |
| 15. | Friars Point | 13.3% | 2.4%(+10.9)#15 | 2.1%(+11.1)#633 |
| 16. | Coahoma | 12.9% | 2.4%(+10.5)#16 | 2.1%(+10.8)#670 |
| 17. | Woodville | 12.6% | 2.4%(+10.3)#17 | 2.1%(+10.5)#697 |
| 18. | Morgantown | 12.2% | 2.4%(+9.80)#18 | 2.1%(+10.0)#740 |
| 19. | Sherman | 11.5% | 2.4%(+9.14)#19 | 2.1%(+9.36)#836 |
| 20. | De Kalb | 11.5% | 2.4%(+9.13)#20 | 2.1%(+9.36)#837 |
| 21. | Mendenhall | 11.3% | 2.4%(+8.97)#21 | 2.1%(+9.20)#856 |
| 22. | Learned | 11.1% | 2.4%(+8.73)#22 | 2.1%(+8.96)#906 |
| 23. | Sandersville | 11.0% | 2.4%(+8.65)#23 | 2.1%(+8.88)#919 |
| 24. | Lena | 10.5% | 2.4%(+8.15)#24 | 2.1%(+8.38)#1,011 |
| 25. | Anguilla | 10.4% | 2.4%(+8.05)#25 | 2.1%(+8.28)#1,022 |
| 26. | Shelby | 10.4% | 2.4%(+8.00)#26 | 2.1%(+8.23)#1,031 |
| 27. | Jonestown | 10.2% | 2.4%(+7.78)#27 | 2.1%(+8.01)#1,070 |
| 28. | Scooba | 9.7% | 2.4%(+7.34)#28 | 2.1%(+7.57)#1,154 |
| 29. | Hickory | 9.5% | 2.4%(+7.12)#29 | 2.1%(+7.35)#1,199 |
| 30. | Seminary | 9.4% | 2.4%(+7.06)#30 | 2.1%(+7.29)#1,216 |
| 31. | Artesia | 9.4% | 2.4%(+7.00)#31 | 2.1%(+7.23)#1,227 |
| 32. | Sledge | 8.9% | 2.4%(+6.56)#32 | 2.1%(+6.79)#1,351 |
| 33. | Crenshaw | 8.9% | 2.4%(+6.56)#33 | 2.1%(+6.79)#1,355 |
| 34. | Alligator | 8.7% | 2.4%(+6.32)#34 | 2.1%(+6.55)#1,431 |
| 35. | Centreville | 8.5% | 2.4%(+6.14)#35 | 2.1%(+6.37)#1,485 |
| 36. | Pearl River | 8.5% | 2.4%(+6.12)#36 | 2.1%(+6.35)#1,492 |
| 37. | Collins | 8.3% | 2.4%(+5.88)#37 | 2.1%(+6.11)#1,571 |
| 38. | Mathiston | 8.1% | 2.4%(+5.71)#38 | 2.1%(+5.94)#1,626 |
| 39. | Webb | 7.9% | 2.4%(+5.48)#39 | 2.1%(+5.71)#1,704 |
| 40. | Leakesville | 7.8% | 2.4%(+5.44)#40 | 2.1%(+5.67)#1,721 |
| 41. | New Houlka | 7.8% | 2.4%(+5.42)#41 | 2.1%(+5.65)#1,729 |
| 42. | Crowder | 7.5% | 2.4%(+5.08)#42 | 2.1%(+5.30)#1,875 |
| 43. | Tunica Resorts | 7.5% | 2.4%(+5.08)#43 | 2.1%(+5.30)#1,878 |
| 44. | Big Point | 7.3% | 2.4%(+4.95)#44 | 2.1%(+5.18)#1,935 |
| 45. | Ruleville | 7.1% | 2.4%(+4.69)#45 | 2.1%(+4.92)#2,040 |
| 46. | Duncan | 7.0% | 2.4%(+4.60)#46 | 2.1%(+4.83)#2,086 |
| 47. | Fayette | 6.7% | 2.4%(+4.30)#47 | 2.1%(+4.53)#2,251 |
| 48. | Gluckstadt | 6.5% | 2.4%(+4.16)#48 | 2.1%(+4.39)#2,335 |
| 49. | Grenada | 6.4% | 2.4%(+4.05)#49 | 2.1%(+4.28)#2,407 |
| 50. | Conehatta | 6.4% | 2.4%(+4.05)#50 | 2.1%(+4.28)#2,411 |
| 51. | Crawford | 6.4% | 2.4%(+4.02)#51 | 2.1%(+4.25)#2,427 |
| 52. | Drew | 6.4% | 2.4%(+4.01)#52 | 2.1%(+4.24)#2,437 |
| 53. | Duck Hill | 6.4% | 2.4%(+3.99)#53 | 2.1%(+4.22)#2,460 |
| 54. | Waynesboro | 5.9% | 2.4%(+3.51)#54 | 2.1%(+3.74)#2,804 |
| 55. | Stonewall | 5.9% | 2.4%(+3.50)#55 | 2.1%(+3.73)#2,812 |
| 56. | Louin | 5.8% | 2.4%(+3.40)#56 | 2.1%(+3.63)#2,903 |
| 57. | Iuka | 5.6% | 2.4%(+3.19)#57 | 2.1%(+3.42)#3,086 |
| 58. | Canton | 5.5% | 2.4%(+3.12)#58 | 2.1%(+3.35)#3,159 |
| 59. | Merigold | 5.5% | 2.4%(+3.11)#59 | 2.1%(+3.34)#3,176 |
| 60. | Renova | 5.5% | 2.4%(+3.10)#60 | 2.1%(+3.33)#3,192 |
| 61. | Delisle | 5.4% | 2.4%(+3.06)#61 | 2.1%(+3.29)#3,224 |
| 62. | Utica | 5.4% | 2.4%(+3.04)#62 | 2.1%(+3.27)#3,243 |
| 63. | Bentonia | 5.3% | 2.4%(+2.93)#63 | 2.1%(+3.16)#3,353 |
| 64. | Yazoo City | 5.3% | 2.4%(+2.88)#64 | 2.1%(+3.11)#3,422 |
| 65. | Dumas | 5.2% | 2.4%(+2.82)#65 | 2.1%(+3.05)#3,485 |
| 66. | Robinhood | 5.0% | 2.4%(+2.64)#66 | 2.1%(+2.87)#3,670 |
| 67. | Algoma | 5.0% | 2.4%(+2.64)#67 | 2.1%(+2.86)#3,674 |
| 68. | Glen | 5.0% | 2.4%(+2.62)#68 | 2.1%(+2.85)#3,692 |
| 69. | Beaumont | 4.9% | 2.4%(+2.54)#69 | 2.1%(+2.77)#3,783 |
| 70. | Taylor | 4.8% | 2.4%(+2.46)#70 | 2.1%(+2.69)#3,888 |
| 71. | University | 4.7% | 2.4%(+2.37)#71 | 2.1%(+2.60)#3,979 |
| 72. | Lynchburg | 4.7% | 2.4%(+2.35)#72 | 2.1%(+2.58)#4,001 |
| 73. | Pearl | 4.7% | 2.4%(+2.33)#73 | 2.1%(+2.56)#4,024 |
| 74. | Lyon | 4.6% | 2.4%(+2.26)#74 | 2.1%(+2.49)#4,121 |
| 75. | Hickory Flat | 4.6% | 2.4%(+2.23)#75 | 2.1%(+2.46)#4,171 |
| 76. | Boyle | 4.6% | 2.4%(+2.23)#76 | 2.1%(+2.46)#4,175 |
| 77. | Shaw | 4.5% | 2.4%(+2.15)#77 | 2.1%(+2.38)#4,281 |
| 78. | Burnsville | 4.4% | 2.4%(+2.04)#78 | 2.1%(+2.27)#4,443 |
| 79. | Cleary | 4.4% | 2.4%(+2.02)#79 | 2.1%(+2.25)#4,477 |
| 80. | St Martin | 4.4% | 2.4%(+2.01)#80 | 2.1%(+2.24)#4,482 |
| 81. | D Iberville | 4.4% | 2.4%(+2.00)#81 | 2.1%(+2.23)#4,502 |
| 82. | Port Gibson | 4.4% | 2.4%(+1.99)#82 | 2.1%(+2.22)#4,504 |
| 83. | Pass Christian | 4.3% | 2.4%(+1.94)#83 | 2.1%(+2.16)#4,596 |
| 84. | Pope | 4.3% | 2.4%(+1.88)#84 | 2.1%(+2.11)#4,671 |
| 85. | Marion | 4.2% | 2.4%(+1.86)#85 | 2.1%(+2.09)#4,693 |
| 86. | Leland | 4.2% | 2.4%(+1.86)#86 | 2.1%(+2.09)#4,694 |
| 87. | Bay St Louis | 4.2% | 2.4%(+1.86)#87 | 2.1%(+2.09)#4,696 |
| 88. | Ashland | 4.1% | 2.4%(+1.77)#88 | 2.1%(+2.00)#4,839 |
| 89. | Braxton | 4.1% | 2.4%(+1.73)#89 | 2.1%(+1.96)#4,916 |
| 90. | Escatawpa | 4.1% | 2.4%(+1.72)#90 | 2.1%(+1.95)#4,942 |
| 91. | Lula | 4.1% | 2.4%(+1.70)#91 | 2.1%(+1.93)#4,969 |
| 92. | Standing Pine | 4.0% | 2.4%(+1.66)#92 | 2.1%(+1.89)#5,020 |
| 93. | Corinth | 4.0% | 2.4%(+1.63)#93 | 2.1%(+1.86)#5,075 |
| 94. | Taylorsville | 4.0% | 2.4%(+1.61)#94 | 2.1%(+1.84)#5,132 |
| 95. | Pace | 3.8% | 2.4%(+1.47)#95 | 2.1%(+1.70)#5,417 |
| 96. | Coffeeville | 3.7% | 2.4%(+1.36)#96 | 2.1%(+1.59)#5,629 |
| 97. | Derma | 3.7% | 2.4%(+1.31)#97 | 2.1%(+1.54)#5,731 |
| 98. | Pontotoc | 3.7% | 2.4%(+1.31)#98 | 2.1%(+1.54)#5,732 |
| 99. | Shannon | 3.6% | 2.4%(+1.23)#99 | 2.1%(+1.46)#5,894 |
| 100. | Kiln | 3.6% | 2.4%(+1.21)#100 | 2.1%(+1.44)#5,938 |
Common Questions
What are the Top 10 Cities with the Highest Percentage of Population Employed in Security & Protection in Mississippi?
Top 10 Cities with the Highest Percentage of Population Employed in Security & Protection in Mississippi are:
#1
23.2%
#2
23.2%
#3
22.2%
#4
21.5%
#5
20.1%
#6
19.1%
#7
17.6%
#8
16.1%
#9
16.0%
#10
15.8%
What city has the Highest Percentage of Population Employed in Security & Protection in Mississippi?
Smithville has the Highest Percentage of Population Employed in Security & Protection in Mississippi with 23.2%.
What is the Percentage of Population Employed in Security & Protection in the State of Mississippi?
Percentage of Population Employed in Security & Protection in Mississippi is 2.4%.
What is the Percentage of Population Employed in Security & Protection in the United States?
Percentage of Population Employed in Security & Protection in the United States is 2.1%.