Cities with the Highest Percentage of Population Employed in Security & Protection in Connecticut
RELATED REPORTS & OPTIONS
Security & Protection
Connecticut
Compare Cities
Map of Cities with the Highest Percentage of Population Employed in Security & Protection in Connecticut
0.0%
10.0%
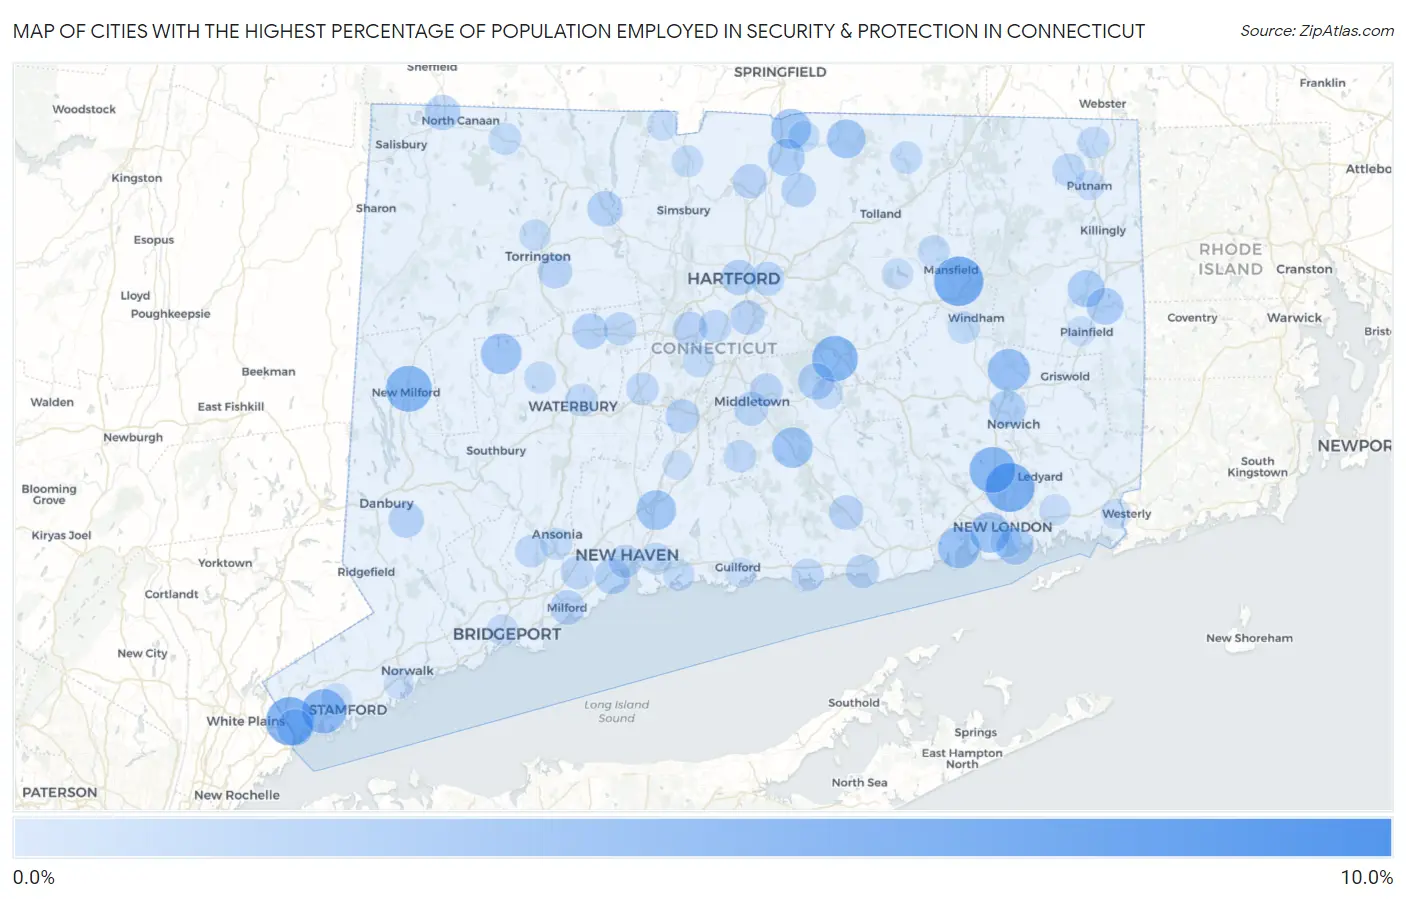
Cities with the Highest Percentage of Population Employed in Security & Protection in Connecticut
| City | % Employed | vs State | vs National | |
| 1. | Gaylordsville | 9.9% | 1.8%(+8.04)#1 | 2.1%(+7.70)#1,122 |
| 2. | Dayville | 7.0% | 1.8%(+5.15)#2 | 2.1%(+4.81)#2,096 |
| 3. | Mansfield Center | 6.6% | 1.8%(+4.75)#3 | 2.1%(+4.42)#2,319 |
| 4. | Gales Ferry | 6.4% | 1.8%(+4.55)#4 | 2.1%(+4.22)#2,456 |
| 5. | Glenville | 6.2% | 1.8%(+4.42)#5 | 2.1%(+4.08)#2,540 |
| 6. | Riverton | 5.9% | 1.8%(+4.11)#6 | 2.1%(+3.77)#2,778 |
| 7. | Lake Bungee | 5.8% | 1.8%(+3.95)#7 | 2.1%(+3.62)#2,917 |
| 8. | New Milford | 5.6% | 1.8%(+3.80)#8 | 2.1%(+3.46)#3,049 |
| 9. | Oxoboxo River | 5.5% | 1.8%(+3.73)#9 | 2.1%(+3.40)#3,118 |
| 10. | Terramuggus | 5.5% | 1.8%(+3.65)#10 | 2.1%(+3.32)#3,199 |
| 11. | Newtown Borough | 5.2% | 1.8%(+3.36)#11 | 2.1%(+3.02)#3,512 |
| 12. | Cos Cob | 5.1% | 1.8%(+3.28)#12 | 2.1%(+2.94)#3,599 |
| 13. | Trumbull Center | 4.7% | 1.8%(+2.93)#13 | 2.1%(+2.59)#3,986 |
| 14. | Sacred Heart University | 4.7% | 1.8%(+2.93)#14 | 2.1%(+2.59)#3,987 |
| 15. | East | 4.6% | 1.8%(+2.83)#15 | 2.1%(+2.50)#4,111 |
| 16. | Stepney | 4.6% | 1.8%(+2.78)#16 | 2.1%(+2.45)#4,195 |
| 17. | Baltic | 4.4% | 1.8%(+2.63)#17 | 2.1%(+2.29)#4,403 |
| 18. | Niantic | 4.3% | 1.8%(+2.46)#18 | 2.1%(+2.12)#4,652 |
| 19. | Weston | 4.3% | 1.8%(+2.45)#19 | 2.1%(+2.11)#4,663 |
| 20. | Bethlehem Village | 4.1% | 1.8%(+2.24)#20 | 2.1%(+1.91)#4,999 |
| 21. | Higganum | 4.0% | 1.8%(+2.16)#21 | 2.1%(+1.82)#5,159 |
| 22. | Waterford | 4.0% | 1.8%(+2.14)#22 | 2.1%(+1.80)#5,194 |
| 23. | Quinnipiac University | 3.9% | 1.8%(+2.05)#23 | 2.1%(+1.72)#5,364 |
| 24. | Sherwood Manor | 3.8% | 1.8%(+1.98)#24 | 2.1%(+1.65)#5,506 |
| 25. | North Haven | 3.8% | 1.8%(+1.95)#25 | 2.1%(+1.61)#5,568 |
| 26. | Litchfield Borough | 3.5% | 1.8%(+1.68)#26 | 2.1%(+1.35)#6,127 |
| 27. | Somers | 3.5% | 1.8%(+1.67)#27 | 2.1%(+1.33)#6,175 |
| 28. | Wauregan | 3.0% | 1.8%(+1.22)#28 | 2.1%(+0.882)#7,379 |
| 29. | Southwood Acres | 3.0% | 1.8%(+1.21)#29 | 2.1%(+0.875)#7,413 |
| 30. | Groton | 3.0% | 1.8%(+1.20)#30 | 2.1%(+0.861)#7,460 |
| 31. | Moosup | 2.9% | 1.8%(+1.12)#31 | 2.1%(+0.779)#7,729 |
| 32. | Pemberwick | 2.9% | 1.8%(+1.09)#32 | 2.1%(+0.755)#7,814 |
| 33. | Norwich | 2.9% | 1.8%(+1.09)#33 | 2.1%(+0.751)#7,822 |
| 34. | Botsford | 2.9% | 1.8%(+1.07)#34 | 2.1%(+0.733)#7,888 |
| 35. | Lake Pocotopaug | 2.8% | 1.8%(+1.02)#35 | 2.1%(+0.685)#8,045 |
| 36. | West Haven | 2.7% | 1.8%(+0.927)#36 | 2.1%(+0.591)#8,350 |
| 37. | New Hartford Center | 2.6% | 1.8%(+0.765)#37 | 2.1%(+0.429)#8,907 |
| 38. | Terryville | 2.6% | 1.8%(+0.748)#38 | 2.1%(+0.412)#8,979 |
| 39. | Bethel | 2.5% | 1.8%(+0.737)#39 | 2.1%(+0.401)#9,019 |
| 40. | Hartford | 2.5% | 1.8%(+0.733)#40 | 2.1%(+0.396)#9,040 |
| 41. | Canaan | 2.5% | 1.8%(+0.707)#41 | 2.1%(+0.371)#9,133 |
| 42. | Noroton Heights | 2.5% | 1.8%(+0.680)#42 | 2.1%(+0.344)#9,232 |
| 43. | Broad Brook | 2.3% | 1.8%(+0.536)#43 | 2.1%(+0.199)#9,804 |
| 44. | Wethersfield | 2.3% | 1.8%(+0.468)#44 | 2.1%(+0.132)#10,081 |
| 45. | Windsor Locks | 2.3% | 1.8%(+0.467)#45 | 2.1%(+0.131)#10,084 |
| 46. | Milford City Balance | 2.3% | 1.8%(+0.459)#46 | 2.1%(+0.123)#10,131 |
| 47. | Northwest Harwinton | 2.3% | 1.8%(+0.459)#47 | 2.1%(+0.123)#10,132 |
| 48. | Deep River Center | 2.3% | 1.8%(+0.453)#48 | 2.1%(+0.117)#10,151 |
| 49. | New Britain | 2.2% | 1.8%(+0.373)#49 | 2.1%(+0.037)#10,506 |
| 50. | Meriden | 2.2% | 1.8%(+0.367)#50 | 2.1%(+0.031)#10,540 |
| 51. | Ball Pond | 2.2% | 1.8%(+0.350)#51 | 2.1%(+0.014)#10,614 |
| 52. | Middletown | 2.1% | 1.8%(+0.329)#52 | 2.1%(-0.007)#10,714 |
| 53. | Jewett City Borough | 2.1% | 1.8%(+0.290)#53 | 2.1%(-0.046)#10,873 |
| 54. | East Hartford | 2.1% | 1.8%(+0.285)#54 | 2.1%(-0.051)#10,890 |
| 55. | Lakes West | 2.1% | 1.8%(+0.283)#55 | 2.1%(-0.053)#10,902 |
| 56. | Saybrook Manor | 2.0% | 1.8%(+0.193)#56 | 2.1%(-0.143)#11,347 |
| 57. | Bristol | 2.0% | 1.8%(+0.169)#57 | 2.1%(-0.167)#11,467 |
| 58. | Orange | 2.0% | 1.8%(+0.145)#58 | 2.1%(-0.191)#11,604 |
| 59. | Portland | 1.9% | 1.8%(+0.113)#59 | 2.1%(-0.223)#11,743 |
| 60. | New Haven | 1.9% | 1.8%(+0.110)#60 | 2.1%(-0.226)#11,785 |
| 61. | Newington | 1.9% | 1.8%(+0.044)#61 | 2.1%(-0.292)#12,090 |
| 62. | South Woodstock | 1.8% | 1.8%(+0.026)#62 | 2.1%(-0.310)#12,179 |
| 63. | Durham | 1.8% | 1.8%(+0.017)#63 | 2.1%(-0.319)#12,229 |
| 64. | Naugatuck Borough | 1.8% | 1.8%(+0.006)#64 | 2.1%(-0.330)#12,284 |
| 65. | Clinton | 1.8% | 1.8%(-0.020)#65 | 2.1%(-0.356)#12,420 |
| 66. | Waterbury | 1.8% | 1.8%(-0.055)#66 | 2.1%(-0.391)#12,582 |
| 67. | Northford | 1.7% | 1.8%(-0.073)#67 | 2.1%(-0.409)#12,668 |
| 68. | Plantsville | 1.7% | 1.8%(-0.084)#68 | 2.1%(-0.420)#12,731 |
| 69. | Shelton | 1.7% | 1.8%(-0.084)#69 | 2.1%(-0.420)#12,734 |
| 70. | Norfolk | 1.7% | 1.8%(-0.103)#70 | 2.1%(-0.439)#12,823 |
| 71. | South Windham | 1.7% | 1.8%(-0.112)#71 | 2.1%(-0.448)#12,869 |
| 72. | New London | 1.7% | 1.8%(-0.126)#72 | 2.1%(-0.462)#12,944 |
| 73. | East Haven | 1.7% | 1.8%(-0.134)#73 | 2.1%(-0.470)#12,983 |
| 74. | Stafford Springs | 1.7% | 1.8%(-0.145)#74 | 2.1%(-0.481)#13,047 |
| 75. | Kensington | 1.7% | 1.8%(-0.148)#75 | 2.1%(-0.484)#13,073 |
| 76. | Derby | 1.6% | 1.8%(-0.194)#76 | 2.1%(-0.530)#13,301 |
| 77. | Storrs | 1.6% | 1.8%(-0.225)#77 | 2.1%(-0.561)#13,472 |
| 78. | Brookfield Center | 1.6% | 1.8%(-0.225)#78 | 2.1%(-0.561)#13,486 |
| 79. | Watertown | 1.6% | 1.8%(-0.242)#79 | 2.1%(-0.578)#13,570 |
| 80. | North Grosvenor Dale | 1.6% | 1.8%(-0.244)#80 | 2.1%(-0.580)#13,589 |
| 81. | Branford Center | 1.5% | 1.8%(-0.301)#81 | 2.1%(-0.637)#13,876 |
| 82. | Salmon Brook | 1.5% | 1.8%(-0.304)#82 | 2.1%(-0.640)#13,890 |
| 83. | Torrington | 1.5% | 1.8%(-0.316)#83 | 2.1%(-0.652)#13,968 |
| 84. | Daniels Farm | 1.5% | 1.8%(-0.320)#84 | 2.1%(-0.656)#13,981 |
| 85. | Poplar Plains | 1.4% | 1.8%(-0.384)#85 | 2.1%(-0.720)#14,334 |
| 86. | Hazardville | 1.4% | 1.8%(-0.384)#86 | 2.1%(-0.720)#14,355 |
| 87. | Old Mystic | 1.4% | 1.8%(-0.397)#87 | 2.1%(-0.733)#14,395 |
| 88. | Bridgeport | 1.4% | 1.8%(-0.401)#88 | 2.1%(-0.737)#14,427 |
| 89. | Coventry Lake | 1.4% | 1.8%(-0.435)#89 | 2.1%(-0.771)#14,608 |
| 90. | East Hampton | 1.4% | 1.8%(-0.442)#90 | 2.1%(-0.779)#14,647 |
| 91. | Stamford | 1.4% | 1.8%(-0.461)#91 | 2.1%(-0.797)#14,770 |
| 92. | North Granby | 1.3% | 1.8%(-0.470)#92 | 2.1%(-0.806)#14,808 |
| 93. | Norwalk | 1.2% | 1.8%(-0.636)#93 | 2.1%(-0.972)#15,723 |
| 94. | Putnam | 1.2% | 1.8%(-0.637)#94 | 2.1%(-0.973)#15,734 |
| 95. | Pawcatuck | 1.1% | 1.8%(-0.666)#95 | 2.1%(-1.00)#15,887 |
| 96. | Fairfield University | 1.1% | 1.8%(-0.720)#96 | 2.1%(-1.06)#16,169 |
| 97. | Plainfield Village | 1.1% | 1.8%(-0.727)#97 | 2.1%(-1.06)#16,222 |
| 98. | Guilford Center | 1.1% | 1.8%(-0.741)#98 | 2.1%(-1.08)#16,298 |
| 99. | Compo | 1.1% | 1.8%(-0.746)#99 | 2.1%(-1.08)#16,330 |
| 100. | Wallingford Center | 1.1% | 1.8%(-0.758)#100 | 2.1%(-1.09)#16,412 |
Common Questions
What are the Top 10 Cities with the Highest Percentage of Population Employed in Security & Protection in Connecticut?
Top 10 Cities with the Highest Percentage of Population Employed in Security & Protection in Connecticut are:
#1
6.6%
#2
6.4%
#3
6.2%
#4
5.6%
#5
5.5%
#6
5.5%
#7
5.1%
#8
4.4%
#9
4.3%
#10
4.1%
What city has the Highest Percentage of Population Employed in Security & Protection in Connecticut?
Mansfield Center has the Highest Percentage of Population Employed in Security & Protection in Connecticut with 6.6%.
What is the Percentage of Population Employed in Security & Protection in the State of Connecticut?
Percentage of Population Employed in Security & Protection in Connecticut is 1.8%.
What is the Percentage of Population Employed in Security & Protection in the United States?
Percentage of Population Employed in Security & Protection in the United States is 2.1%.