Hamilton Branch, CA Map & Demographics
Hamilton Branch Map
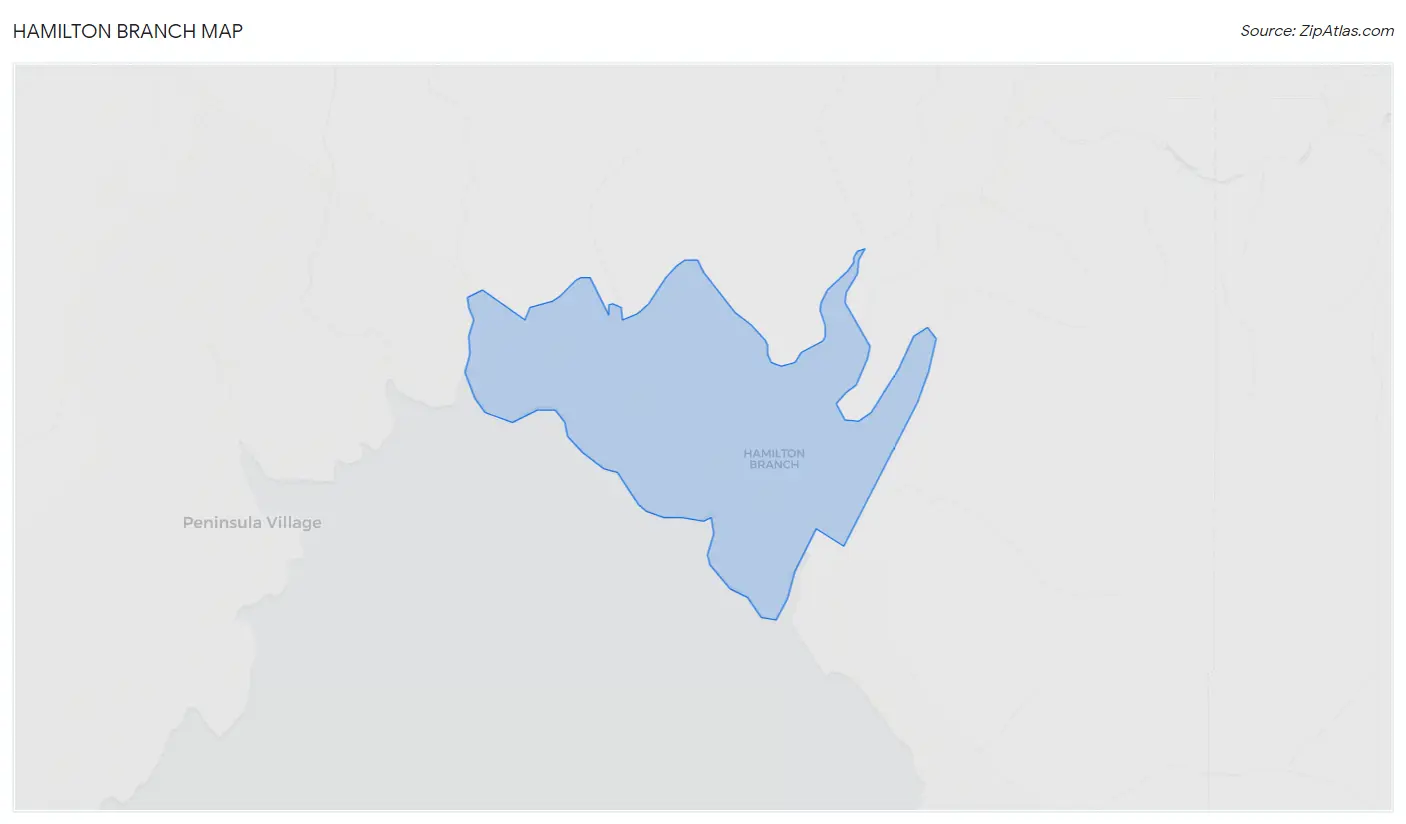
Hamilton Branch Overview
$45,480
PER CAPITA INCOME
$131,250
AVG FAMILY INCOME
$93,750
AVG HOUSEHOLD INCOME
41.3%
WAGE / INCOME GAP [ % ]
58.7¢/ $1
WAGE / INCOME GAP [ $ ]
0.37
INEQUALITY / GINI INDEX
454
TOTAL POPULATION
236
MALE POPULATION
218
FEMALE POPULATION
108.26
MALES / 100 FEMALES
92.37
FEMALES / 100 MALES
60.1
MEDIAN AGE
2.6
AVG FAMILY SIZE
2.1
AVG HOUSEHOLD SIZE
164
LABOR FORCE [ PEOPLE ]
40.9%
PERCENT IN LABOR FORCE
Income in Hamilton Branch
Income Overview in Hamilton Branch
Per Capita Income in Hamilton Branch is $45,480, while median incomes of families and households are $131,250 and $93,750 respectively.
| Characteristic | Number | Measure |
| Per Capita Income | 454 | $45,480 |
| Median Family Income | 152 | $131,250 |
| Mean Family Income | 152 | $117,736 |
| Median Household Income | 215 | $93,750 |
| Mean Household Income | 215 | $97,781 |
| Income Deficit | 152 | $0 |
| Wage / Income Gap (%) | 454 | 41.28% |
| Wage / Income Gap ($) | 454 | 58.72¢ per $1 |
| Gini / Inequality Index | 454 | 0.37 |
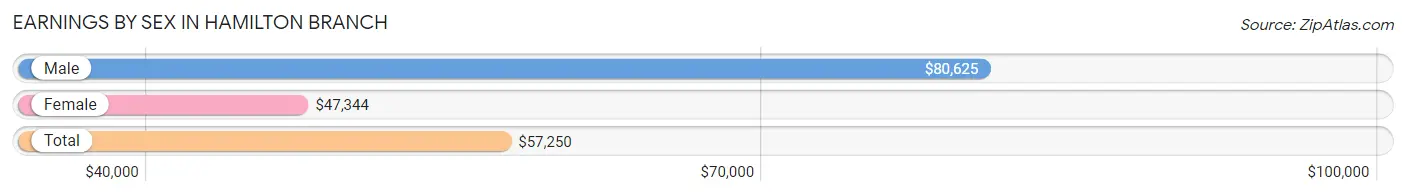
Earnings by Sex in Hamilton Branch
Average Earnings in Hamilton Branch are $57,250, $80,625 for men and $47,344 for women, a difference of 41.3%.
| Sex | Number | Average Earnings |
| Male | 110 (61.5%) | $80,625 |
| Female | 69 (38.6%) | $47,344 |
| Total | 179 (100.0%) | $57,250 |
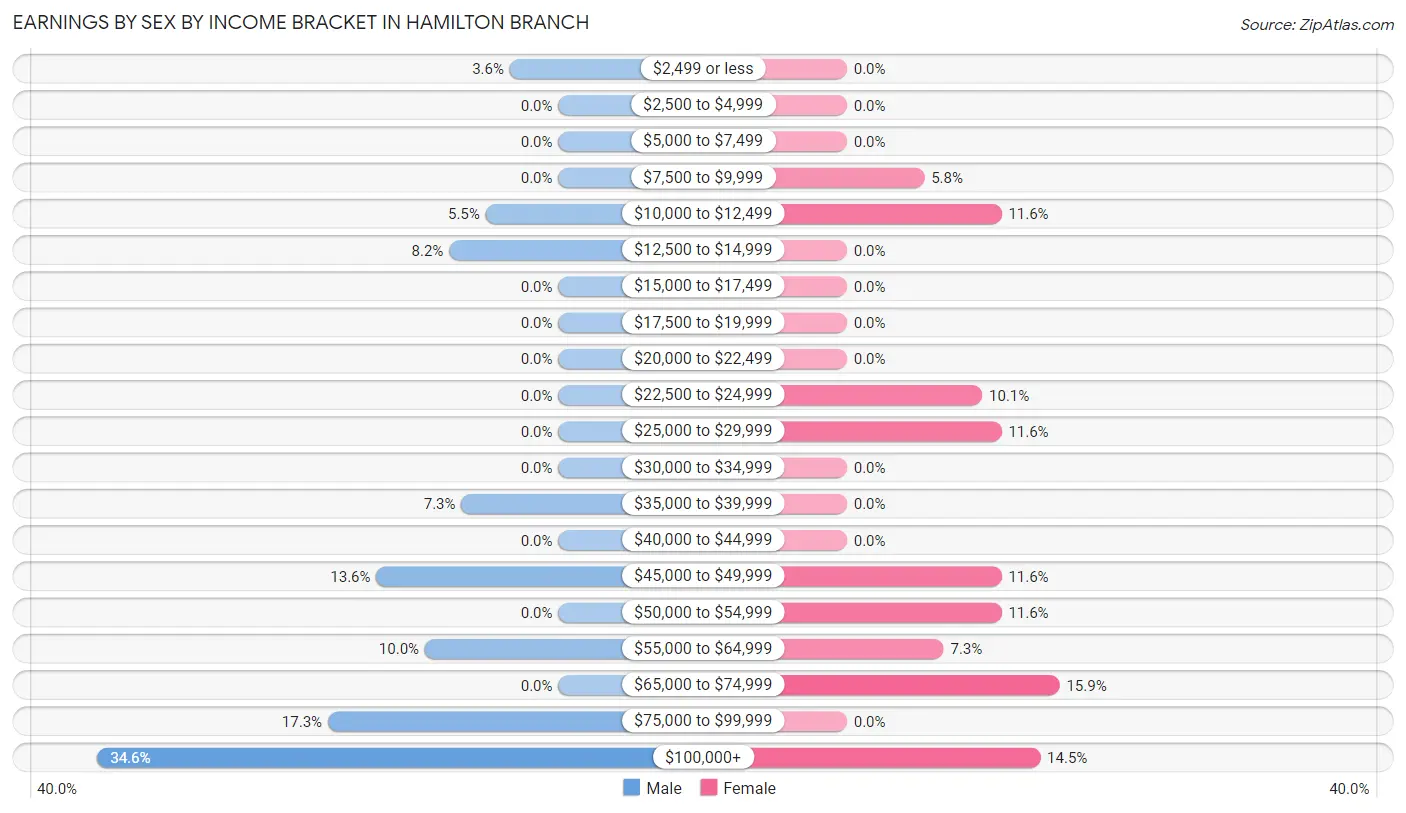
Earnings by Sex by Income Bracket in Hamilton Branch
The most common earnings brackets in Hamilton Branch are $100,000+ for men (38 | 34.5%) and $65,000 to $74,999 for women (11 | 15.9%).
| Income | Male | Female |
| $2,499 or less | 4 (3.6%) | 0 (0.0%) |
| $2,500 to $4,999 | 0 (0.0%) | 0 (0.0%) |
| $5,000 to $7,499 | 0 (0.0%) | 0 (0.0%) |
| $7,500 to $9,999 | 0 (0.0%) | 4 (5.8%) |
| $10,000 to $12,499 | 6 (5.4%) | 8 (11.6%) |
| $12,500 to $14,999 | 9 (8.2%) | 0 (0.0%) |
| $15,000 to $17,499 | 0 (0.0%) | 0 (0.0%) |
| $17,500 to $19,999 | 0 (0.0%) | 0 (0.0%) |
| $20,000 to $22,499 | 0 (0.0%) | 0 (0.0%) |
| $22,500 to $24,999 | 0 (0.0%) | 7 (10.1%) |
| $25,000 to $29,999 | 0 (0.0%) | 8 (11.6%) |
| $30,000 to $34,999 | 0 (0.0%) | 0 (0.0%) |
| $35,000 to $39,999 | 8 (7.3%) | 0 (0.0%) |
| $40,000 to $44,999 | 0 (0.0%) | 0 (0.0%) |
| $45,000 to $49,999 | 15 (13.6%) | 8 (11.6%) |
| $50,000 to $54,999 | 0 (0.0%) | 8 (11.6%) |
| $55,000 to $64,999 | 11 (10.0%) | 5 (7.2%) |
| $65,000 to $74,999 | 0 (0.0%) | 11 (15.9%) |
| $75,000 to $99,999 | 19 (17.3%) | 0 (0.0%) |
| $100,000+ | 38 (34.5%) | 10 (14.5%) |
| Total | 110 (100.0%) | 69 (100.0%) |
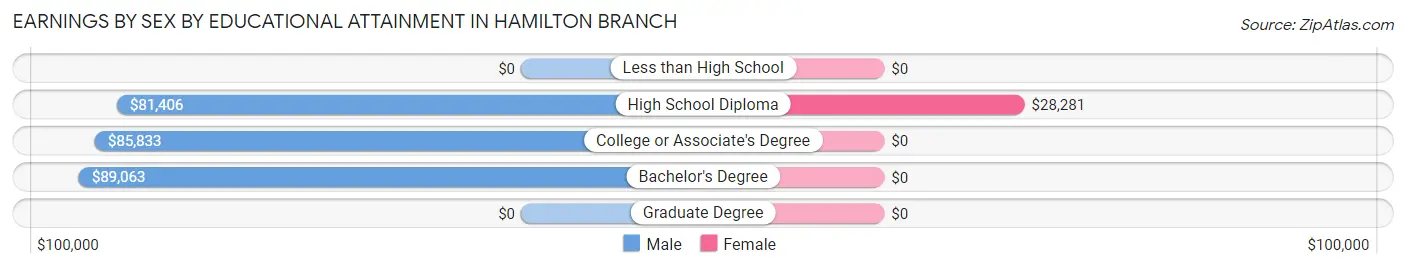
Earnings by Sex by Educational Attainment in Hamilton Branch
Average earnings in Hamilton Branch are $80,625 for men and $47,344 for women, a difference of 41.3%. Men with an educational attainment of bachelor's degree enjoy the highest average annual earnings of $89,063, while those with high school diploma education earn the least with $81,406. Women with an educational attainment of high school diploma earn the most with the average annual earnings of $28,281, while those with high school diploma education have the smallest earnings of $28,281.
| Educational Attainment | Male Income | Female Income |
| Less than High School | - | - |
| High School Diploma | $81,406 | $28,281 |
| College or Associate's Degree | $85,833 | $0 |
| Bachelor's Degree | $89,063 | $0 |
| Graduate Degree | - | - |
| Total | $80,625 | $47,344 |
Family Income in Hamilton Branch
Family Income Brackets in Hamilton Branch
According to the Hamilton Branch family income data, there are 60 families falling into the $150,000 to $199,999 income range, which is the most common income bracket and makes up 39.5% of all families.
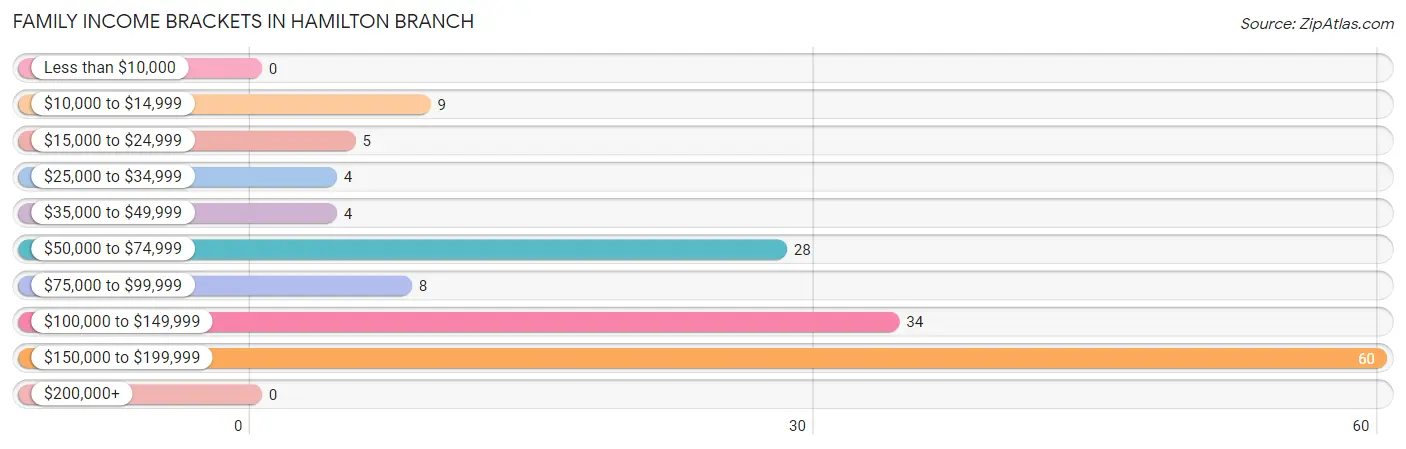
| Income Bracket | # Families | % Families |
| Less than $10,000 | 0 | 0.0% |
| $10,000 to $14,999 | 9 | 5.9% |
| $15,000 to $24,999 | 5 | 3.3% |
| $25,000 to $34,999 | 4 | 2.6% |
| $35,000 to $49,999 | 4 | 2.6% |
| $50,000 to $74,999 | 28 | 18.4% |
| $75,000 to $99,999 | 8 | 5.3% |
| $100,000 to $149,999 | 34 | 22.4% |
| $150,000 to $199,999 | 60 | 39.5% |
| $200,000+ | 0 | 0.0% |
Family Income by Famaliy Size in Hamilton Branch
3-person families (40 | 26.3%) account for the highest median family income in Hamilton Branch with $168,077 per family, while 2-person families (96 | 63.2%) have the highest median income of $59,306 per family member.
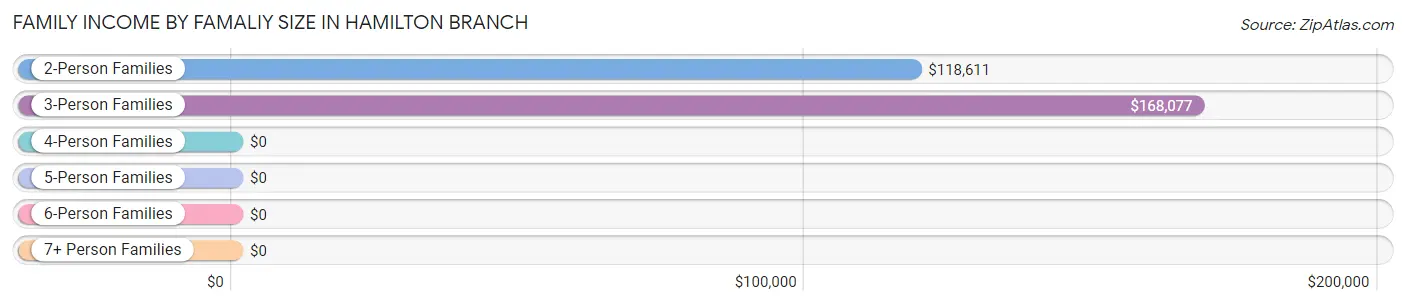
| Income Bracket | # Families | Median Income |
| 2-Person Families | 96 (63.2%) | $118,611 |
| 3-Person Families | 40 (26.3%) | $168,077 |
| 4-Person Families | 14 (9.2%) | $0 |
| 5-Person Families | 2 (1.3%) | $0 |
| 6-Person Families | 0 (0.0%) | $0 |
| 7+ Person Families | 0 (0.0%) | $0 |
| Total | 152 (100.0%) | $131,250 |
Family Income by Number of Earners in Hamilton Branch
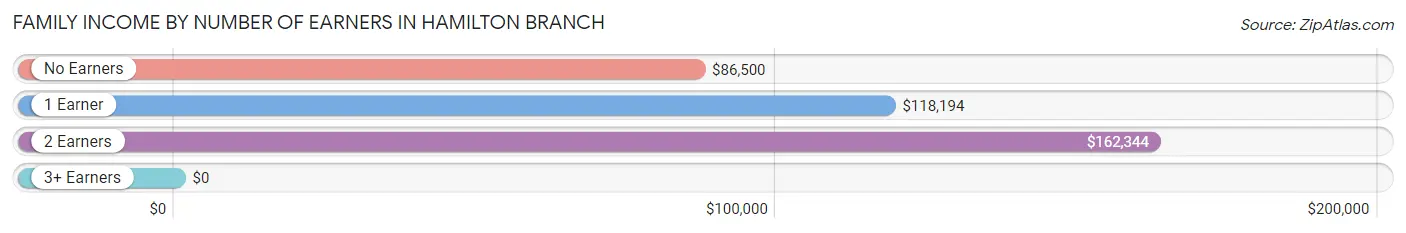
| Number of Earners | # Families | Median Income |
| No Earners | 42 (27.6%) | $86,500 |
| 1 Earner | 57 (37.5%) | $118,194 |
| 2 Earners | 53 (34.9%) | $162,344 |
| 3+ Earners | 0 (0.0%) | $0 |
| Total | 152 (100.0%) | $131,250 |
Household Income in Hamilton Branch
Household Income Brackets in Hamilton Branch
With 67 households falling in the category, the $150,000 to $199,999 income range is the most frequent in Hamilton Branch, accounting for 31.2% of all households.

| Income Bracket | # Households | % Households |
| Less than $10,000 | 5 | 2.3% |
| $10,000 to $14,999 | 32 | 14.9% |
| $15,000 to $24,999 | 5 | 2.3% |
| $25,000 to $34,999 | 10 | 4.7% |
| $35,000 to $49,999 | 11 | 5.1% |
| $50,000 to $74,999 | 38 | 17.7% |
| $75,000 to $99,999 | 8 | 3.7% |
| $100,000 to $149,999 | 39 | 18.1% |
| $150,000 to $199,999 | 67 | 31.2% |
| $200,000+ | 0 | 0.0% |
Household Income by Householder Age in Hamilton Branch
The median household income in Hamilton Branch is $93,750, with the highest median household income of $167,885 found in the 25 to 44 years age bracket for the primary householder. A total of 42 households (19.5%) fall into this category.
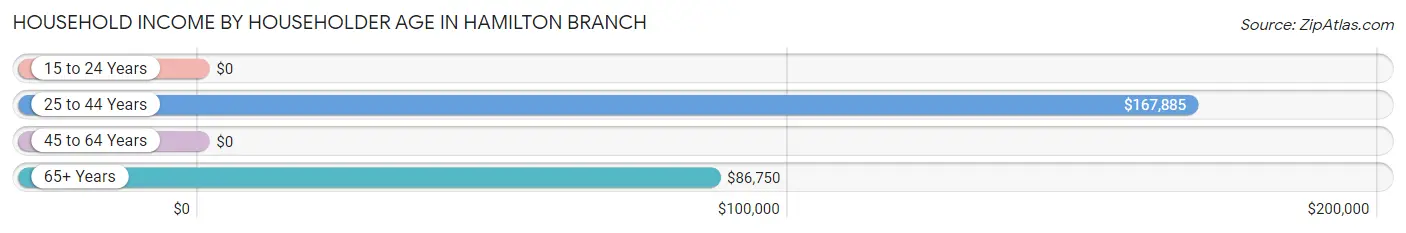
| Income Bracket | # Households | Median Income |
| 15 to 24 Years | 0 (0.0%) | $0 |
| 25 to 44 Years | 42 (19.5%) | $167,885 |
| 45 to 64 Years | 74 (34.4%) | $0 |
| 65+ Years | 99 (46.1%) | $86,750 |
| Total | 215 (100.0%) | $93,750 |
Poverty in Hamilton Branch
Income Below Poverty by Sex and Age in Hamilton Branch
With 5.9% poverty level for males and 19.7% for females among the residents of Hamilton Branch, 25 to 34 year old males and under 5 year old females are the most vulnerable to poverty, with 9 males (29.0%) and 10 females (83.3%) in their respective age groups living below the poverty level.
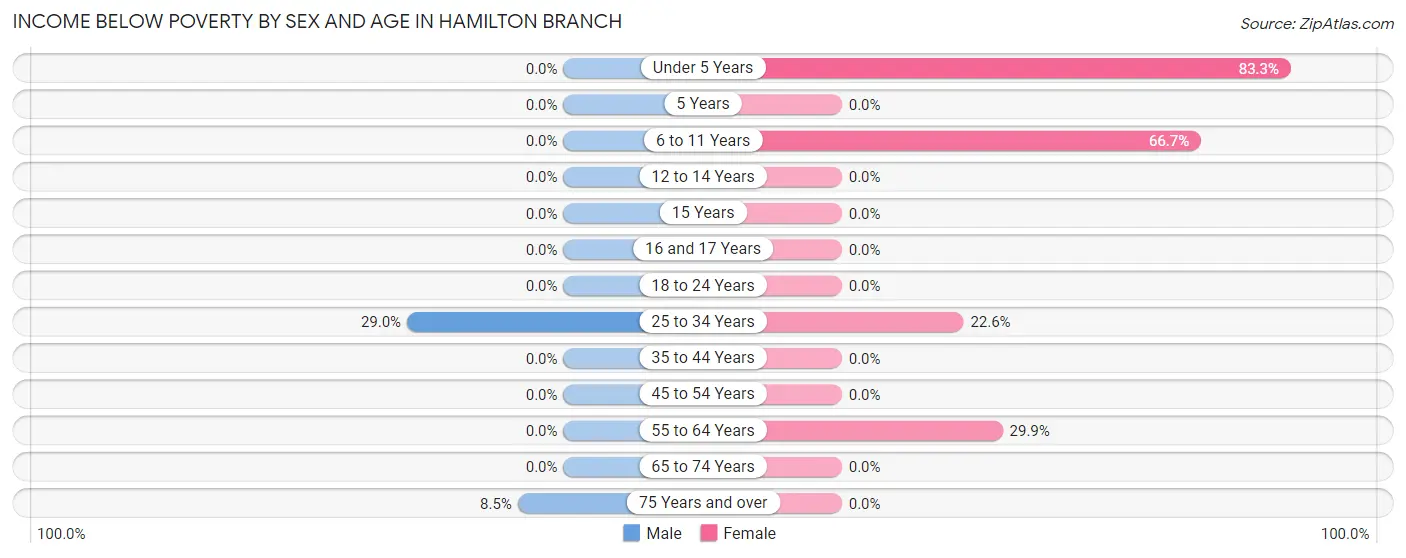
| Age Bracket | Male | Female |
| Under 5 Years | 0 (0.0%) | 10 (83.3%) |
| 5 Years | 0 (0.0%) | 0 (0.0%) |
| 6 to 11 Years | 0 (0.0%) | 6 (66.7%) |
| 12 to 14 Years | 0 (0.0%) | 0 (0.0%) |
| 15 Years | 0 (0.0%) | 0 (0.0%) |
| 16 and 17 Years | 0 (0.0%) | 0 (0.0%) |
| 18 to 24 Years | 0 (0.0%) | 0 (0.0%) |
| 25 to 34 Years | 9 (29.0%) | 7 (22.6%) |
| 35 to 44 Years | 0 (0.0%) | 0 (0.0%) |
| 45 to 54 Years | 0 (0.0%) | 0 (0.0%) |
| 55 to 64 Years | 0 (0.0%) | 20 (29.8%) |
| 65 to 74 Years | 0 (0.0%) | 0 (0.0%) |
| 75 Years and over | 5 (8.5%) | 0 (0.0%) |
| Total | 14 (5.9%) | 43 (19.7%) |
Income Above Poverty by Sex and Age in Hamilton Branch
According to the poverty statistics in Hamilton Branch, males aged 5 years and females aged 35 to 44 years are the age groups that are most secure financially, with 100.0% of males and 100.0% of females in these age groups living above the poverty line.
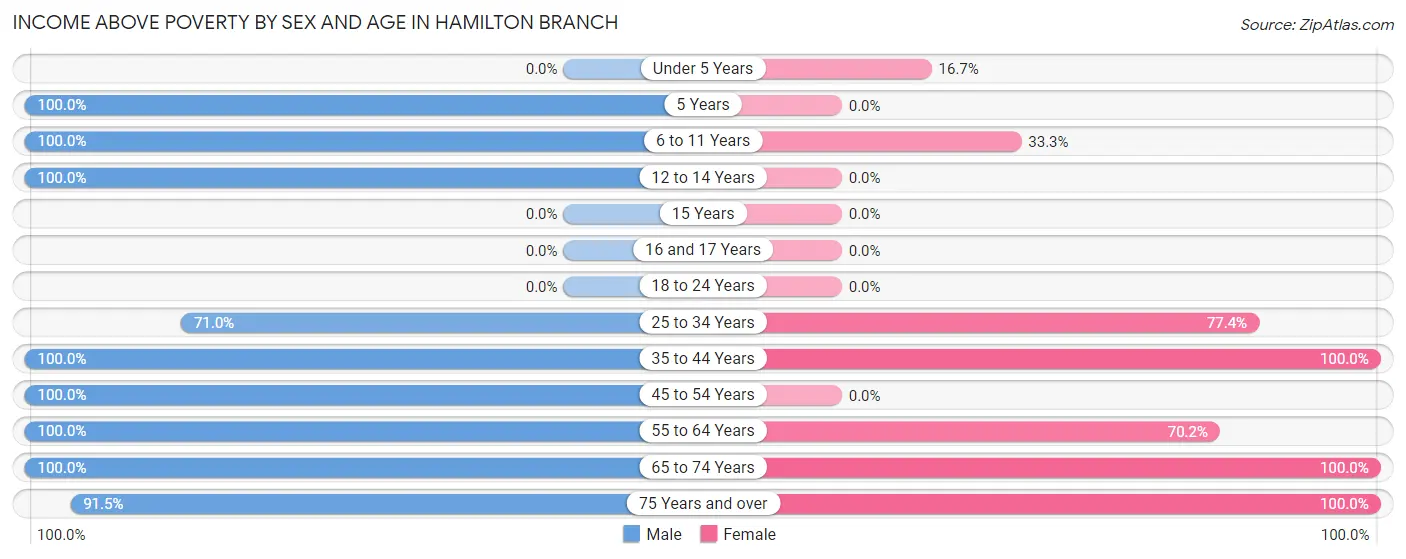
| Age Bracket | Male | Female |
| Under 5 Years | 0 (0.0%) | 2 (16.7%) |
| 5 Years | 3 (100.0%) | 0 (0.0%) |
| 6 to 11 Years | 22 (100.0%) | 3 (33.3%) |
| 12 to 14 Years | 7 (100.0%) | 0 (0.0%) |
| 15 Years | 0 (0.0%) | 0 (0.0%) |
| 16 and 17 Years | 0 (0.0%) | 0 (0.0%) |
| 18 to 24 Years | 0 (0.0%) | 0 (0.0%) |
| 25 to 34 Years | 22 (71.0%) | 24 (77.4%) |
| 35 to 44 Years | 24 (100.0%) | 35 (100.0%) |
| 45 to 54 Years | 5 (100.0%) | 0 (0.0%) |
| 55 to 64 Years | 41 (100.0%) | 47 (70.2%) |
| 65 to 74 Years | 44 (100.0%) | 41 (100.0%) |
| 75 Years and over | 54 (91.5%) | 23 (100.0%) |
| Total | 222 (94.1%) | 175 (80.3%) |
Income Below Poverty Among Married-Couple Families in Hamilton Branch
The poverty statistics for married-couple families in Hamilton Branch show that 6.2% or 9 of the total 145 families live below the poverty line. Families with 1 or 2 children have the highest poverty rate of 24.3%, comprising of 9 families. On the other hand, families with no children have the lowest poverty rate of 0.0%, which includes 0 families.
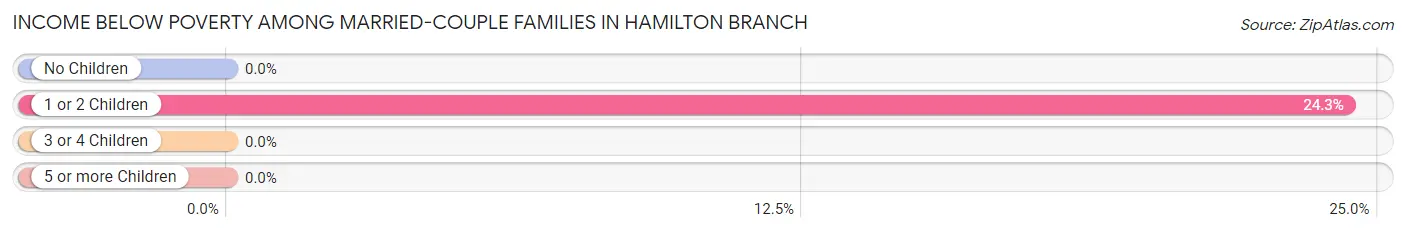
| Children | Above Poverty | Below Poverty |
| No Children | 106 (100.0%) | 0 (0.0%) |
| 1 or 2 Children | 28 (75.7%) | 9 (24.3%) |
| 3 or 4 Children | 2 (100.0%) | 0 (0.0%) |
| 5 or more Children | 0 (0.0%) | 0 (0.0%) |
| Total | 136 (93.8%) | 9 (6.2%) |
Income Below Poverty Among Single-Parent Households in Hamilton Branch
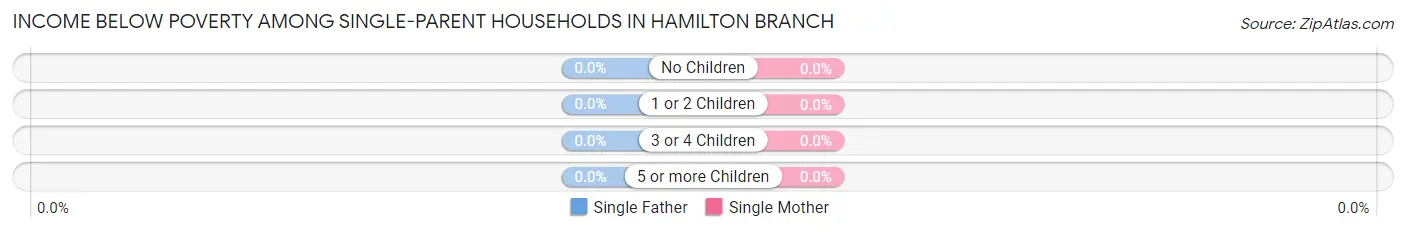
| Children | Single Father | Single Mother |
| No Children | 0 (0.0%) | 0 (0.0%) |
| 1 or 2 Children | 0 (0.0%) | 0 (0.0%) |
| 3 or 4 Children | 0 (0.0%) | 0 (0.0%) |
| 5 or more Children | 0 (0.0%) | 0 (0.0%) |
| Total | 0 (0.0%) | 0 (0.0%) |
Income Below Poverty Among Married-Couple vs Single-Parent Households in Hamilton Branch
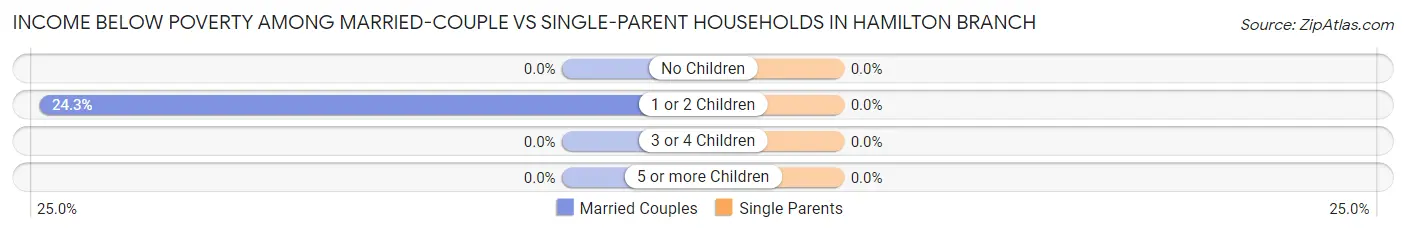
| Children | Married-Couple Families | Single-Parent Households |
| No Children | 0 (0.0%) | 0 (0.0%) |
| 1 or 2 Children | 9 (24.3%) | 0 (0.0%) |
| 3 or 4 Children | 0 (0.0%) | 0 (0.0%) |
| 5 or more Children | 0 (0.0%) | 0 (0.0%) |
| Total | 9 (6.2%) | 0 (0.0%) |
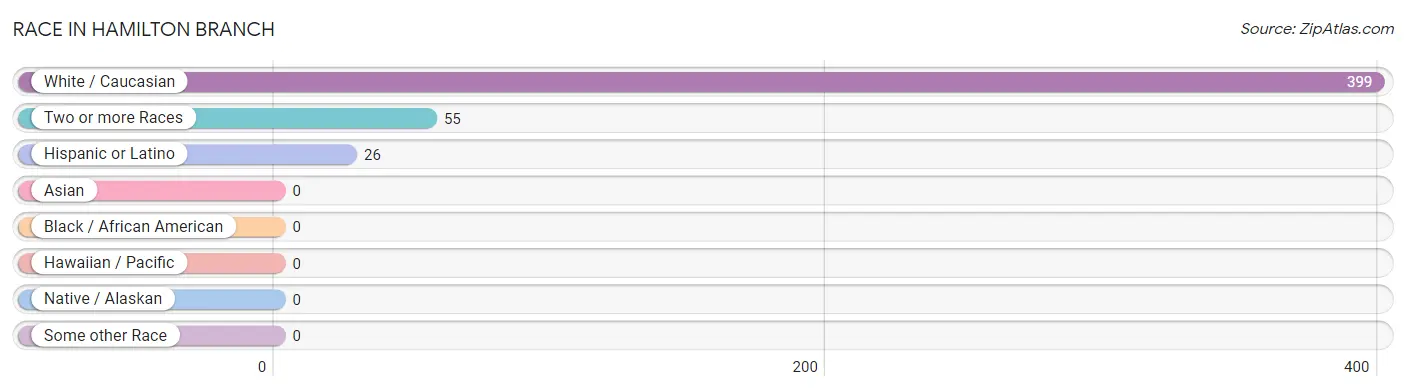
Race in Hamilton Branch
The most populous races in Hamilton Branch are White / Caucasian (399 | 87.9%), Two or more Races (55 | 12.1%), and Hispanic or Latino (26 | 5.7%).
| Race | # Population | % Population |
| Asian | 0 | 0.0% |
| Black / African American | 0 | 0.0% |
| Hawaiian / Pacific | 0 | 0.0% |
| Hispanic or Latino | 26 | 5.7% |
| Native / Alaskan | 0 | 0.0% |
| White / Caucasian | 399 | 87.9% |
| Two or more Races | 55 | 12.1% |
| Some other Race | 0 | 0.0% |
| Total | 454 | 100.0% |
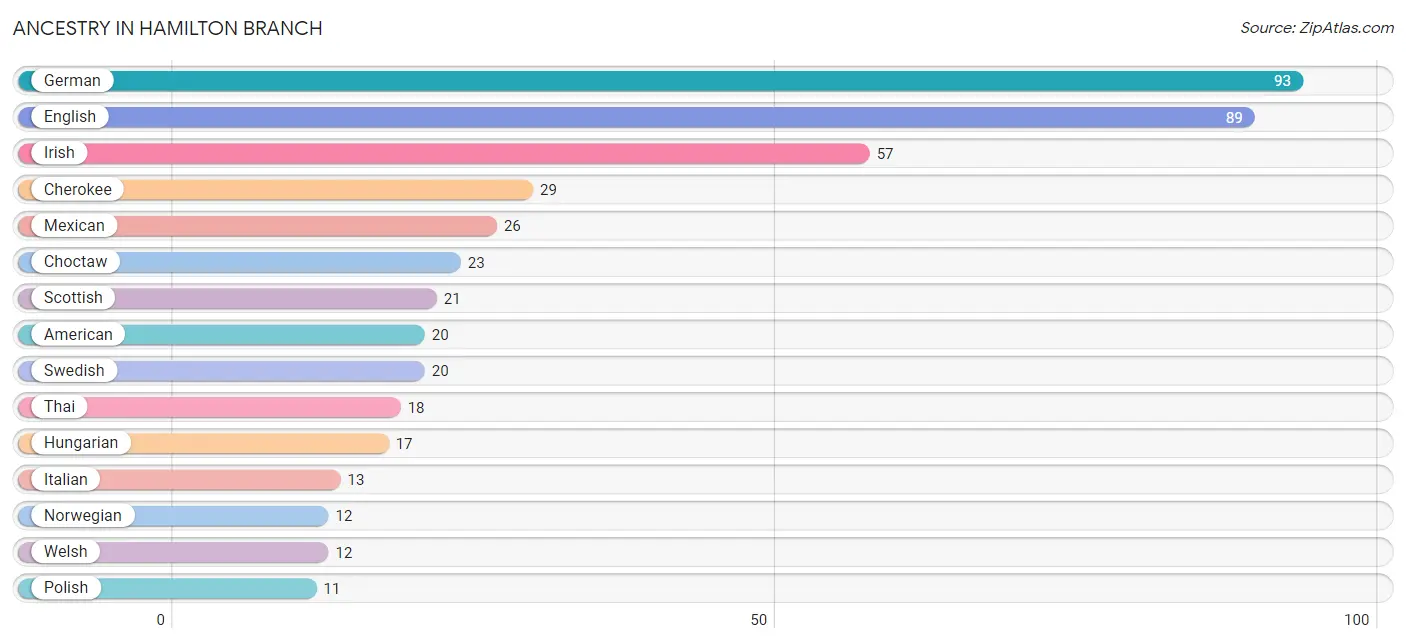
Ancestry in Hamilton Branch
The most populous ancestries reported in Hamilton Branch are German (93 | 20.5%), English (89 | 19.6%), Irish (57 | 12.6%), Cherokee (29 | 6.4%), and Mexican (26 | 5.7%), together accounting for 64.8% of all Hamilton Branch residents.
| Ancestry | # Population | % Population |
| American | 20 | 4.4% |
| Austrian | 7 | 1.5% |
| Cherokee | 29 | 6.4% |
| Choctaw | 23 | 5.1% |
| Dutch | 8 | 1.8% |
| Eastern European | 3 | 0.7% |
| English | 89 | 19.6% |
| French | 8 | 1.8% |
| French Canadian | 4 | 0.9% |
| German | 93 | 20.5% |
| Hungarian | 17 | 3.7% |
| Irish | 57 | 12.6% |
| Italian | 13 | 2.9% |
| Mexican | 26 | 5.7% |
| Norwegian | 12 | 2.6% |
| Polish | 11 | 2.4% |
| Portuguese | 4 | 0.9% |
| Russian | 4 | 0.9% |
| Scotch-Irish | 6 | 1.3% |
| Scottish | 21 | 4.6% |
| Swedish | 20 | 4.4% |
| Thai | 18 | 4.0% |
| Welsh | 12 | 2.6% | View All 23 Rows |
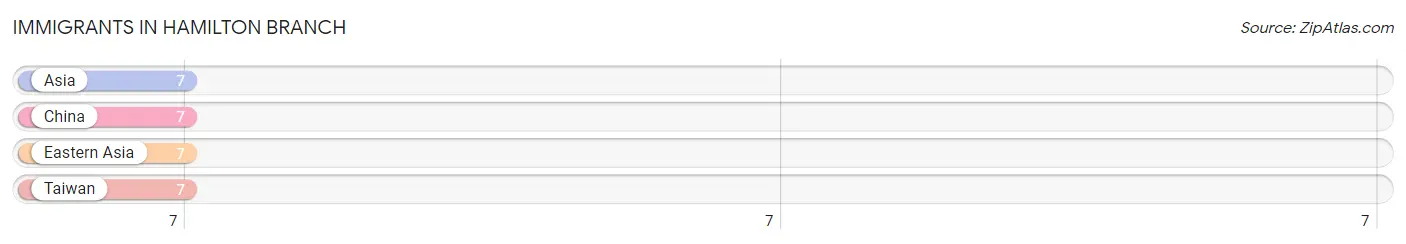
Immigrants in Hamilton Branch
The most numerous immigrant groups reported in Hamilton Branch came from Asia (7 | 1.5%), China (7 | 1.5%), Eastern Asia (7 | 1.5%), and Taiwan (7 | 1.5%), together accounting for 6.2% of all Hamilton Branch residents.
| Immigration Origin | # Population | % Population |
| Asia | 7 | 1.5% |
| China | 7 | 1.5% |
| Eastern Asia | 7 | 1.5% |
| Taiwan | 7 | 1.5% | View All 4 Rows |
Sex and Age in Hamilton Branch
Sex and Age in Hamilton Branch
The most populous age groups in Hamilton Branch are 65 to 69 Years (40 | 17.0%) for men and 60 to 64 Years (41 | 18.8%) for women.
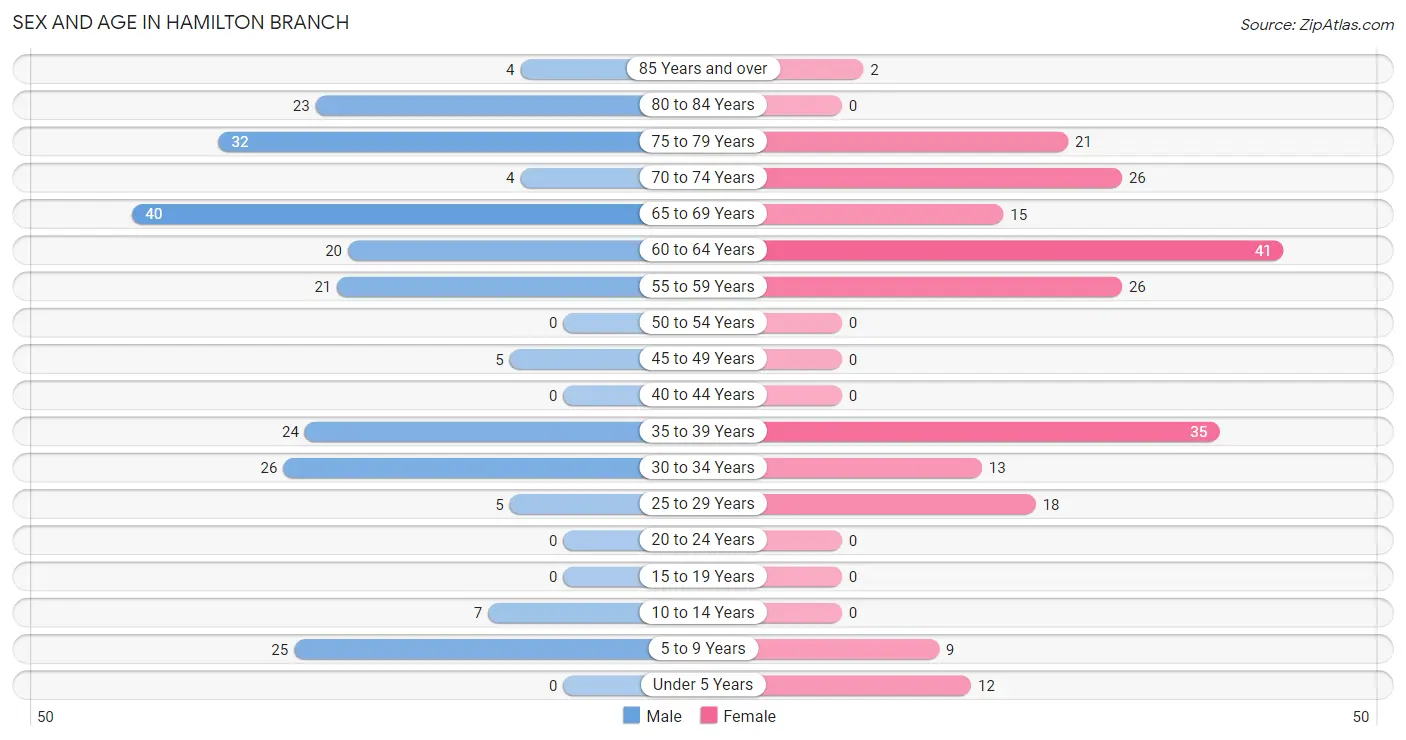
| Age Bracket | Male | Female |
| Under 5 Years | 0 (0.0%) | 12 (5.5%) |
| 5 to 9 Years | 25 (10.6%) | 9 (4.1%) |
| 10 to 14 Years | 7 (3.0%) | 0 (0.0%) |
| 15 to 19 Years | 0 (0.0%) | 0 (0.0%) |
| 20 to 24 Years | 0 (0.0%) | 0 (0.0%) |
| 25 to 29 Years | 5 (2.1%) | 18 (8.3%) |
| 30 to 34 Years | 26 (11.0%) | 13 (6.0%) |
| 35 to 39 Years | 24 (10.2%) | 35 (16.1%) |
| 40 to 44 Years | 0 (0.0%) | 0 (0.0%) |
| 45 to 49 Years | 5 (2.1%) | 0 (0.0%) |
| 50 to 54 Years | 0 (0.0%) | 0 (0.0%) |
| 55 to 59 Years | 21 (8.9%) | 26 (11.9%) |
| 60 to 64 Years | 20 (8.5%) | 41 (18.8%) |
| 65 to 69 Years | 40 (17.0%) | 15 (6.9%) |
| 70 to 74 Years | 4 (1.7%) | 26 (11.9%) |
| 75 to 79 Years | 32 (13.6%) | 21 (9.6%) |
| 80 to 84 Years | 23 (9.8%) | 0 (0.0%) |
| 85 Years and over | 4 (1.7%) | 2 (0.9%) |
| Total | 236 (100.0%) | 218 (100.0%) |
Families and Households in Hamilton Branch
Median Family Size in Hamilton Branch
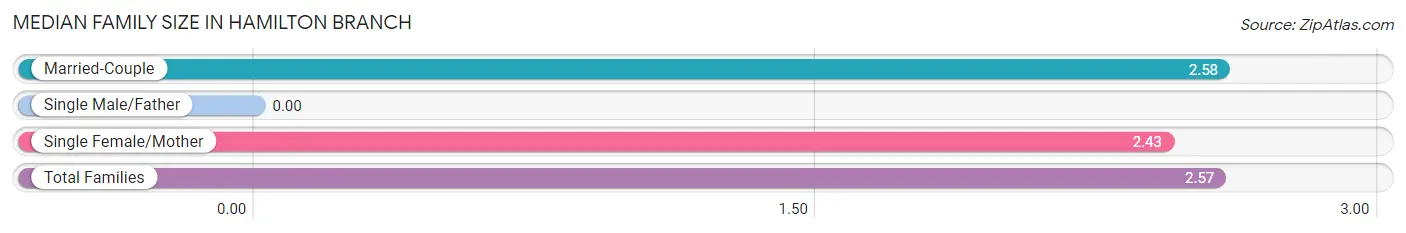
| Family Type | # Families | Family Size |
| Married-Couple | 145 (95.4%) | 2.58 |
| Single Male/Father | 0 (0.0%) | - |
| Single Female/Mother | 7 (4.6%) | 2.43 |
| Total Families | 152 (100.0%) | 2.57 |
Median Household Size in Hamilton Branch
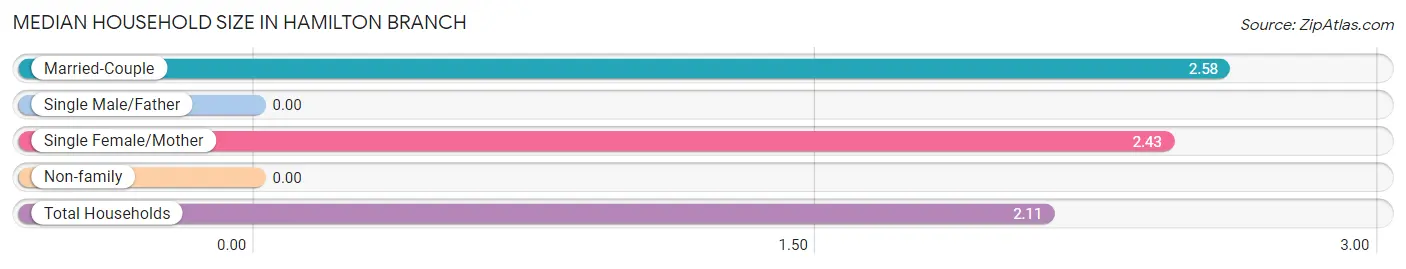
| Household Type | # Households | Household Size |
| Married-Couple | 145 (67.4%) | 2.58 |
| Single Male/Father | 0 (0.0%) | - |
| Single Female/Mother | 7 (3.3%) | 2.43 |
| Non-family | 63 (29.3%) | - |
| Total Households | 215 (100.0%) | 2.11 |
Household Size by Marriage Status in Hamilton Branch
Out of a total of 215 households in Hamilton Branch, 152 (70.7%) are family households, while 63 (29.3%) are nonfamily households. The most numerous type of family households are 2-person households, comprising 96, and the most common type of nonfamily households are 1-person households, comprising 63.
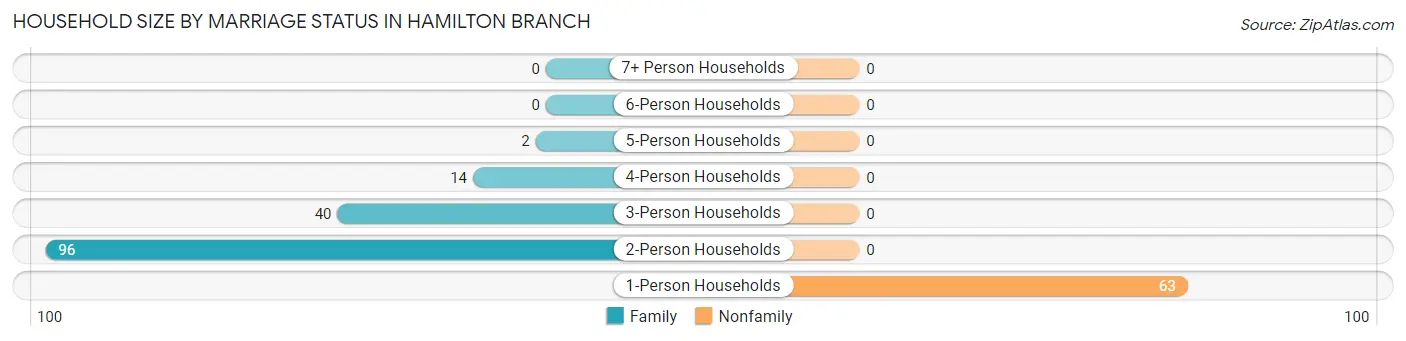
| Household Size | Family Households | Nonfamily Households |
| 1-Person Households | - | 63 (29.3%) |
| 2-Person Households | 96 (44.7%) | 0 (0.0%) |
| 3-Person Households | 40 (18.6%) | 0 (0.0%) |
| 4-Person Households | 14 (6.5%) | 0 (0.0%) |
| 5-Person Households | 2 (0.9%) | 0 (0.0%) |
| 6-Person Households | 0 (0.0%) | 0 (0.0%) |
| 7+ Person Households | 0 (0.0%) | 0 (0.0%) |
| Total | 152 (70.7%) | 63 (29.3%) |
Female Fertility in Hamilton Branch
Fertility by Age in Hamilton Branch
| Age Bracket | Women with Births | Births / 1,000 Women |
| 15 to 19 years | 0 (0.0%) | 0.0 |
| 20 to 34 years | 0 (0.0%) | 0.0 |
| 35 to 50 years | 0 (0.0%) | 0.0 |
| Total | 0 (0.0%) | 0.0 |
Fertility by Age by Marriage Status in Hamilton Branch
| Age Bracket | Married | Unmarried |
| 15 to 19 years | 0 (0.0%) | 0 (0.0%) |
| 20 to 34 years | 0 (0.0%) | 0 (0.0%) |
| 35 to 50 years | 0 (0.0%) | 0 (0.0%) |
| Total | 0 (0.0%) | 0 (0.0%) |
Fertility by Education in Hamilton Branch
| Educational Attainment | Women with Births | Births / 1,000 Women |
| Less than High School | 0 (0.0%) | 0.0 |
| High School Diploma | 0 (0.0%) | 0.0 |
| College or Associate's Degree | 0 (0.0%) | 0.0 |
| Bachelor's Degree | 0 (0.0%) | 0.0 |
| Graduate Degree | 0 (0.0%) | 0.0 |
| Total | 0 (0.0%) | 0.0 |
Fertility by Education by Marriage Status in Hamilton Branch
| Educational Attainment | Married | Unmarried |
| Less than High School | 0 (0.0%) | 0 (0.0%) |
| High School Diploma | 0 (0.0%) | 0 (0.0%) |
| College or Associate's Degree | 0 (0.0%) | 0 (0.0%) |
| Bachelor's Degree | 0 (0.0%) | 0 (0.0%) |
| Graduate Degree | 0 (0.0%) | 0 (0.0%) |
| Total | 0 (0.0%) | 0 (0.0%) |
Employment Characteristics in Hamilton Branch
Employment by Class of Employer in Hamilton Branch
Among the 161 employed individuals in Hamilton Branch, private company employees (55 | 34.2%), self-employed (not incorporated) (30 | 18.6%), and state government employees (28 | 17.4%) make up the most common classes of employment.
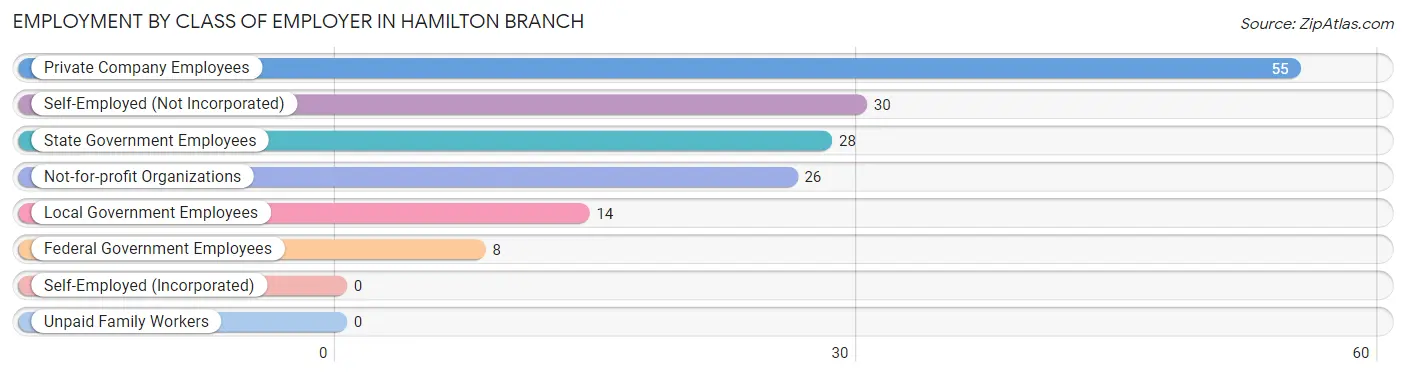
| Employer Class | # Employees | % Employees |
| Private Company Employees | 55 | 34.2% |
| Self-Employed (Incorporated) | 0 | 0.0% |
| Self-Employed (Not Incorporated) | 30 | 18.6% |
| Not-for-profit Organizations | 26 | 16.2% |
| Local Government Employees | 14 | 8.7% |
| State Government Employees | 28 | 17.4% |
| Federal Government Employees | 8 | 5.0% |
| Unpaid Family Workers | 0 | 0.0% |
| Total | 161 | 100.0% |
Employment Status by Age in Hamilton Branch
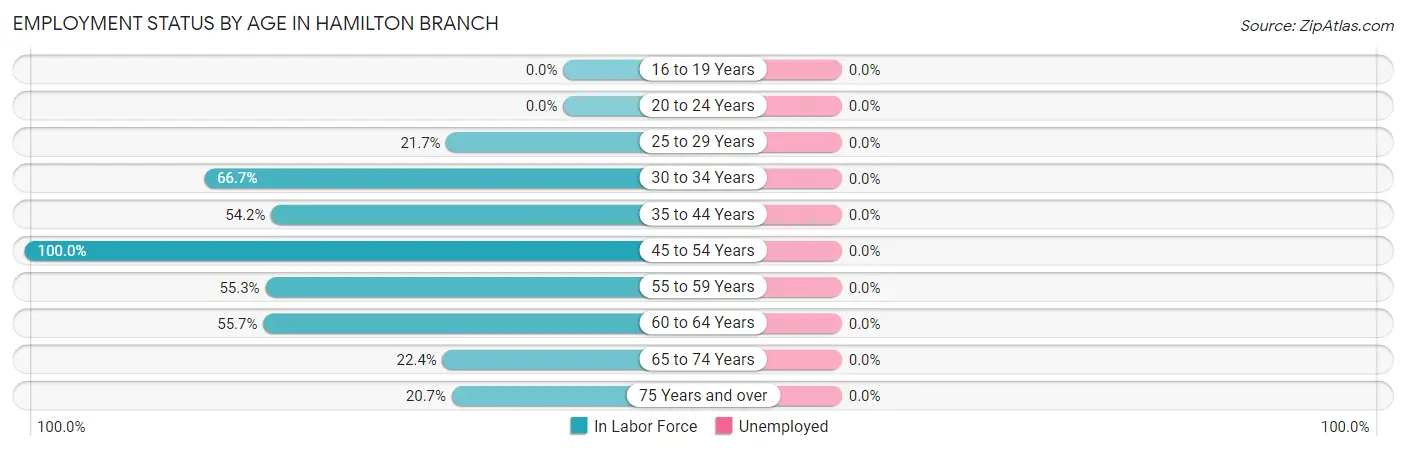
| Age Bracket | In Labor Force | Unemployed |
| 16 to 19 Years | 0 (0.0%) | 0 (0.0%) |
| 20 to 24 Years | 0 (0.0%) | 0 (0.0%) |
| 25 to 29 Years | 5 (21.7%) | 0 (0.0%) |
| 30 to 34 Years | 26 (66.7%) | 0 (0.0%) |
| 35 to 44 Years | 32 (54.2%) | 0 (0.0%) |
| 45 to 54 Years | 5 (100.0%) | 0 (0.0%) |
| 55 to 59 Years | 26 (55.3%) | 0 (0.0%) |
| 60 to 64 Years | 34 (55.7%) | 0 (0.0%) |
| 65 to 74 Years | 19 (22.4%) | 0 (0.0%) |
| 75 Years and over | 17 (20.7%) | 0 (0.0%) |
| Total | 164 (40.9%) | 0 (0.0%) |
Employment Status by Educational Attainment in Hamilton Branch
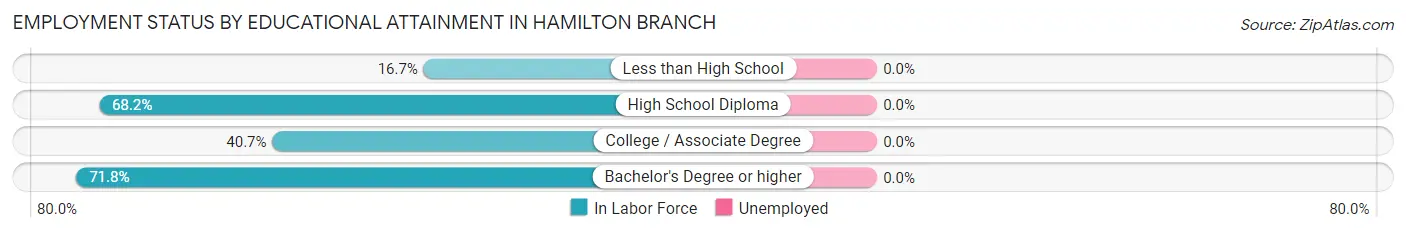
| Educational Attainment | In Labor Force | Unemployed |
| Less than High School | 4 (16.7%) | 0 (0.0%) |
| High School Diploma | 30 (68.2%) | 0 (0.0%) |
| College / Associate Degree | 33 (40.7%) | 0 (0.0%) |
| Bachelor's Degree or higher | 61 (71.8%) | 0 (0.0%) |
| Total | 128 (54.7%) | 0 (0.0%) |
Employment Occupations by Sex in Hamilton Branch
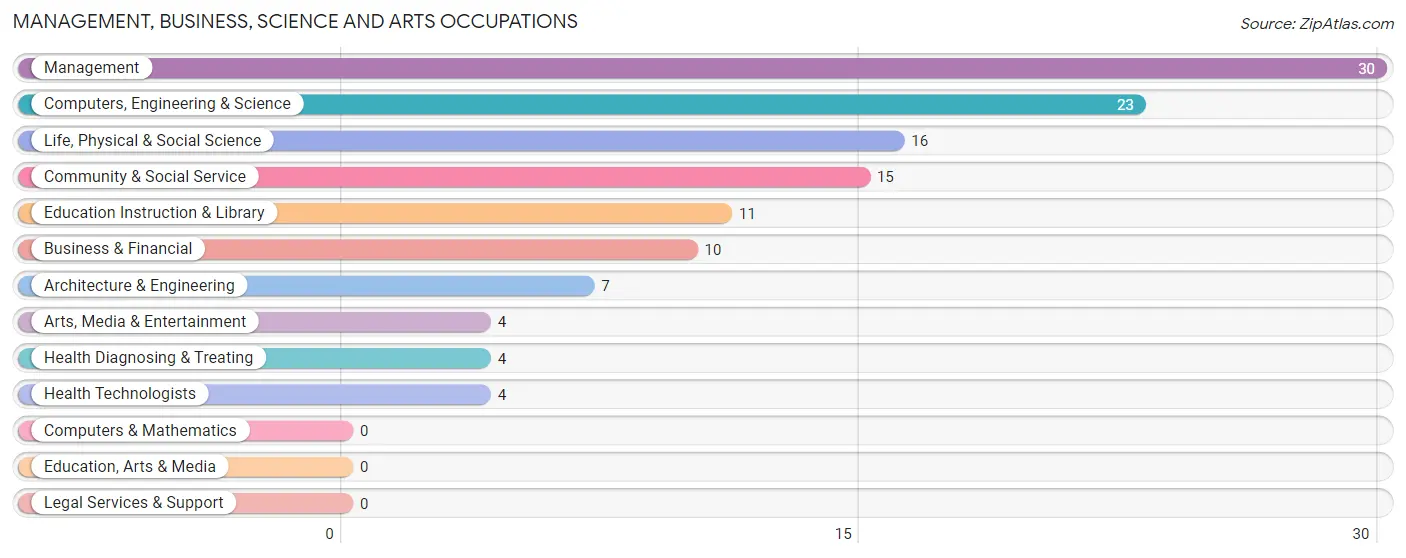
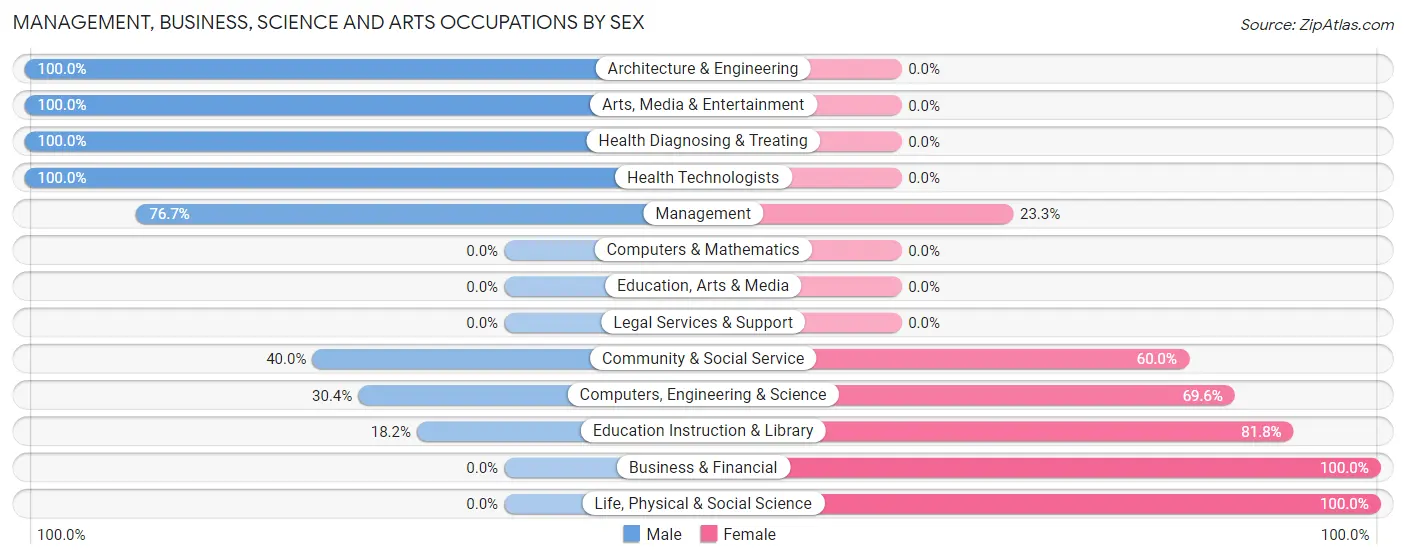
Management, Business, Science and Arts Occupations
The most common Management, Business, Science and Arts occupations in Hamilton Branch are Management (30 | 18.3%), Computers, Engineering & Science (23 | 14.0%), Life, Physical & Social Science (16 | 9.8%), Community & Social Service (15 | 9.1%), and Education Instruction & Library (11 | 6.7%).
Management, Business, Science and Arts Occupations by Sex
Within the Management, Business, Science and Arts occupations in Hamilton Branch, the most male-oriented occupations are Architecture & Engineering (100.0%), Arts, Media & Entertainment (100.0%), and Health Diagnosing & Treating (100.0%), while the most female-oriented occupations are Business & Financial (100.0%), Life, Physical & Social Science (100.0%), and Education Instruction & Library (81.8%).
| Occupation | Male | Female |
| Management | 23 (76.7%) | 7 (23.3%) |
| Business & Financial | 0 (0.0%) | 10 (100.0%) |
| Computers, Engineering & Science | 7 (30.4%) | 16 (69.6%) |
| Computers & Mathematics | 0 (0.0%) | 0 (0.0%) |
| Architecture & Engineering | 7 (100.0%) | 0 (0.0%) |
| Life, Physical & Social Science | 0 (0.0%) | 16 (100.0%) |
| Community & Social Service | 6 (40.0%) | 9 (60.0%) |
| Education, Arts & Media | 0 (0.0%) | 0 (0.0%) |
| Legal Services & Support | 0 (0.0%) | 0 (0.0%) |
| Education Instruction & Library | 2 (18.2%) | 9 (81.8%) |
| Arts, Media & Entertainment | 4 (100.0%) | 0 (0.0%) |
| Health Diagnosing & Treating | 4 (100.0%) | 0 (0.0%) |
| Health Technologists | 4 (100.0%) | 0 (0.0%) |
| Total (Category) | 40 (48.8%) | 42 (51.2%) |
| Total (Overall) | 104 (63.4%) | 60 (36.6%) |
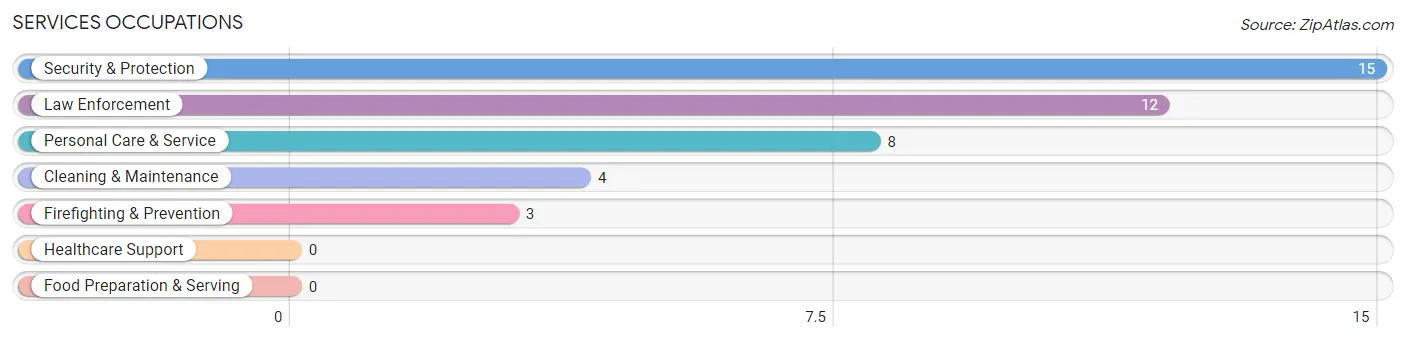
Services Occupations
The most common Services occupations in Hamilton Branch are Security & Protection (15 | 9.1%), Law Enforcement (12 | 7.3%), Personal Care & Service (8 | 4.9%), Cleaning & Maintenance (4 | 2.4%), and Firefighting & Prevention (3 | 1.8%).
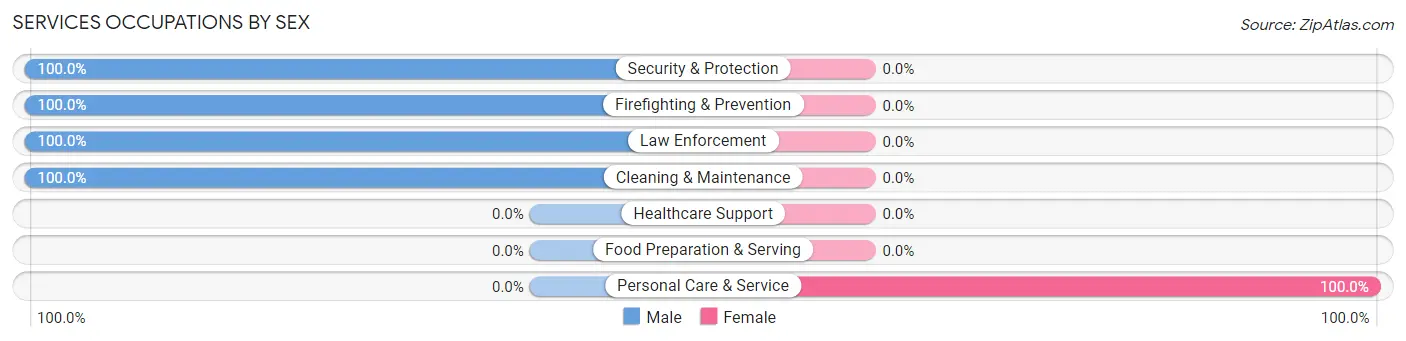
Services Occupations by Sex
| Occupation | Male | Female |
| Healthcare Support | 0 (0.0%) | 0 (0.0%) |
| Security & Protection | 15 (100.0%) | 0 (0.0%) |
| Firefighting & Prevention | 3 (100.0%) | 0 (0.0%) |
| Law Enforcement | 12 (100.0%) | 0 (0.0%) |
| Food Preparation & Serving | 0 (0.0%) | 0 (0.0%) |
| Cleaning & Maintenance | 4 (100.0%) | 0 (0.0%) |
| Personal Care & Service | 0 (0.0%) | 8 (100.0%) |
| Total (Category) | 19 (70.4%) | 8 (29.6%) |
| Total (Overall) | 104 (63.4%) | 60 (36.6%) |
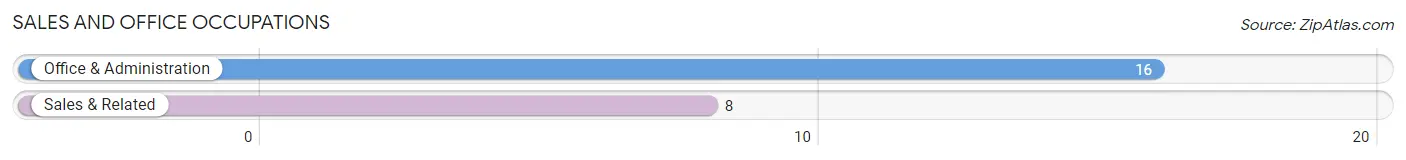
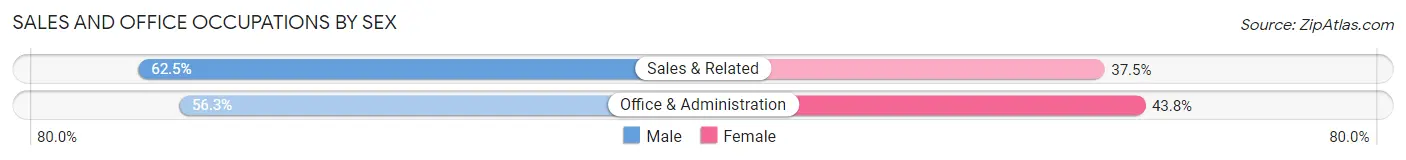
Sales and Office Occupations
The most common Sales and Office occupations in Hamilton Branch are Office & Administration (16 | 9.8%), and Sales & Related (8 | 4.9%).
Sales and Office Occupations by Sex
| Occupation | Male | Female |
| Sales & Related | 5 (62.5%) | 3 (37.5%) |
| Office & Administration | 9 (56.2%) | 7 (43.8%) |
| Total (Category) | 14 (58.3%) | 10 (41.7%) |
| Total (Overall) | 104 (63.4%) | 60 (36.6%) |
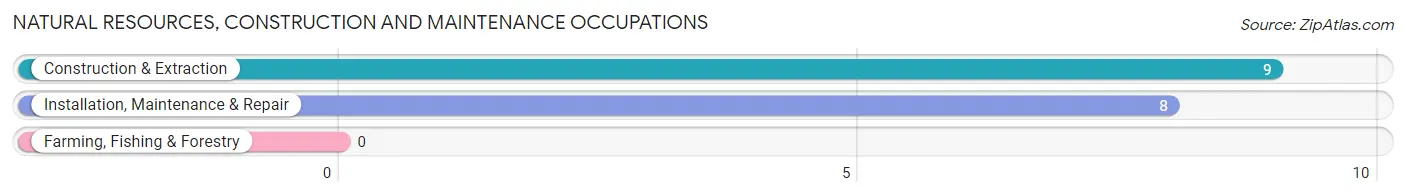
Natural Resources, Construction and Maintenance Occupations
The most common Natural Resources, Construction and Maintenance occupations in Hamilton Branch are Construction & Extraction (9 | 5.5%), and Installation, Maintenance & Repair (8 | 4.9%).
Natural Resources, Construction and Maintenance Occupations by Sex
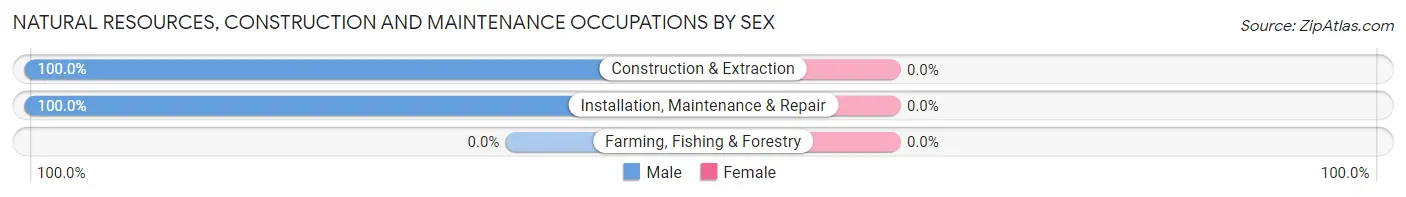
| Occupation | Male | Female |
| Farming, Fishing & Forestry | 0 (0.0%) | 0 (0.0%) |
| Construction & Extraction | 9 (100.0%) | 0 (0.0%) |
| Installation, Maintenance & Repair | 8 (100.0%) | 0 (0.0%) |
| Total (Category) | 17 (100.0%) | 0 (0.0%) |
| Total (Overall) | 104 (63.4%) | 60 (36.6%) |
Production, Transportation and Moving Occupations
The most common Production, Transportation and Moving occupations in Hamilton Branch are , and Material Moving (14 | 8.5%).
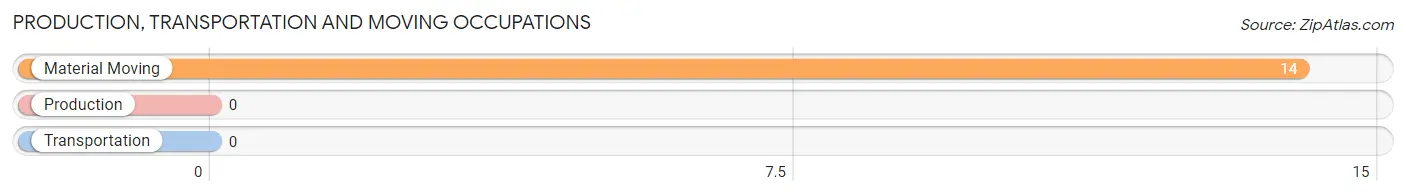
Production, Transportation and Moving Occupations by Sex
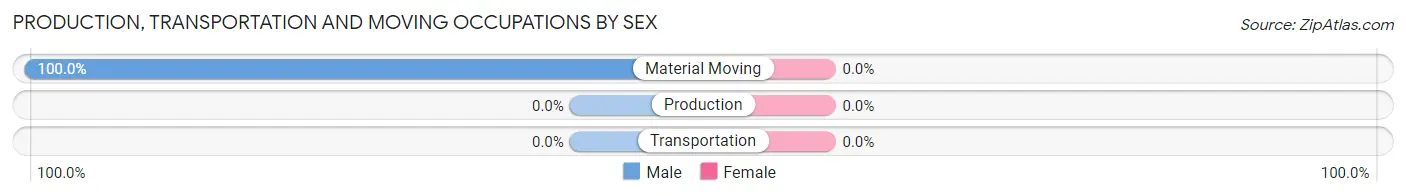
| Occupation | Male | Female |
| Production | 0 (0.0%) | 0 (0.0%) |
| Transportation | 0 (0.0%) | 0 (0.0%) |
| Material Moving | 14 (100.0%) | 0 (0.0%) |
| Total (Category) | 14 (100.0%) | 0 (0.0%) |
| Total (Overall) | 104 (63.4%) | 60 (36.6%) |
Employment Industries by Sex in Hamilton Branch
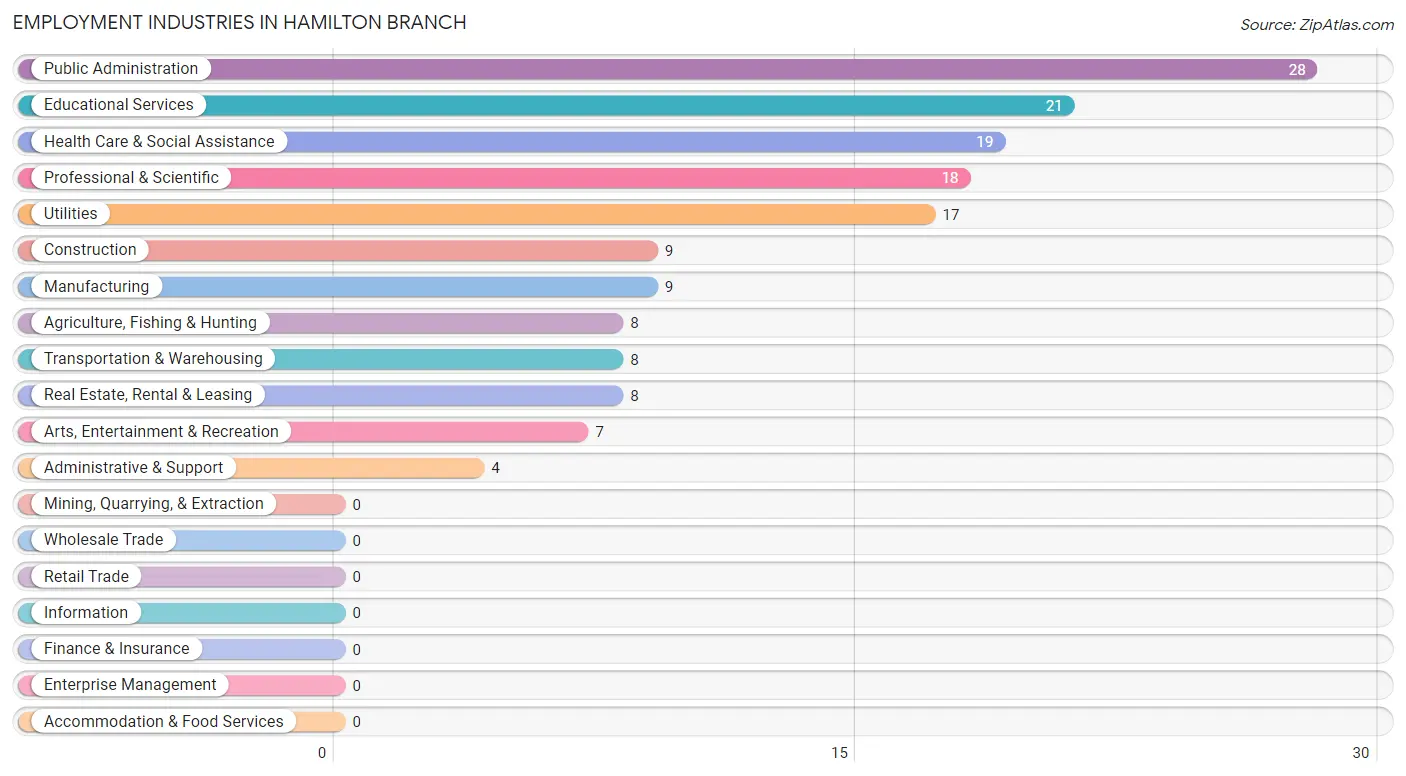
Employment Industries in Hamilton Branch
The major employment industries in Hamilton Branch include Public Administration (28 | 17.1%), Educational Services (21 | 12.8%), Health Care & Social Assistance (19 | 11.6%), Professional & Scientific (18 | 11.0%), and Utilities (17 | 10.4%).
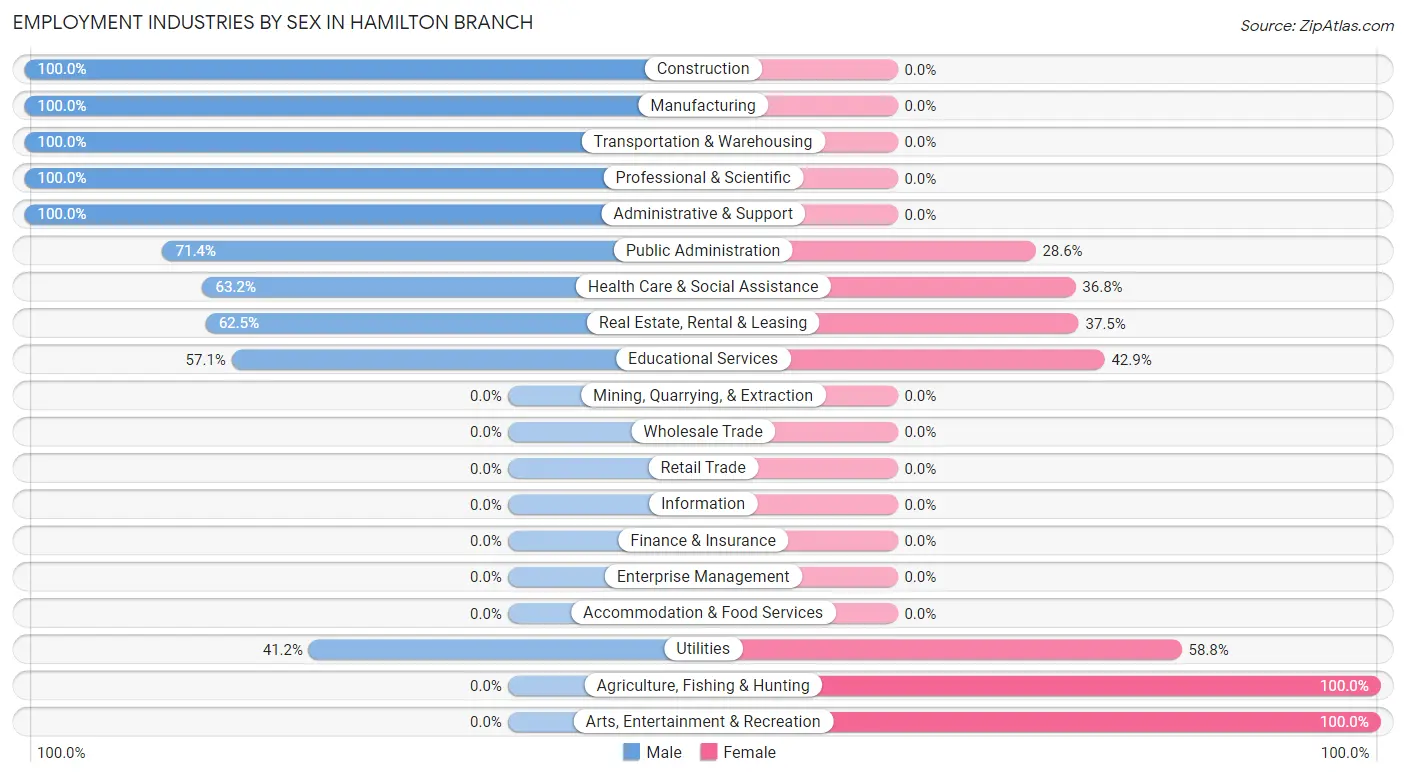
Employment Industries by Sex in Hamilton Branch
The Hamilton Branch industries that see more men than women are Construction (100.0%), Manufacturing (100.0%), and Transportation & Warehousing (100.0%), whereas the industries that tend to have a higher number of women are Agriculture, Fishing & Hunting (100.0%), Arts, Entertainment & Recreation (100.0%), and Utilities (58.8%).
| Industry | Male | Female |
| Agriculture, Fishing & Hunting | 0 (0.0%) | 8 (100.0%) |
| Mining, Quarrying, & Extraction | 0 (0.0%) | 0 (0.0%) |
| Construction | 9 (100.0%) | 0 (0.0%) |
| Manufacturing | 9 (100.0%) | 0 (0.0%) |
| Wholesale Trade | 0 (0.0%) | 0 (0.0%) |
| Retail Trade | 0 (0.0%) | 0 (0.0%) |
| Transportation & Warehousing | 8 (100.0%) | 0 (0.0%) |
| Utilities | 7 (41.2%) | 10 (58.8%) |
| Information | 0 (0.0%) | 0 (0.0%) |
| Finance & Insurance | 0 (0.0%) | 0 (0.0%) |
| Real Estate, Rental & Leasing | 5 (62.5%) | 3 (37.5%) |
| Professional & Scientific | 18 (100.0%) | 0 (0.0%) |
| Enterprise Management | 0 (0.0%) | 0 (0.0%) |
| Administrative & Support | 4 (100.0%) | 0 (0.0%) |
| Educational Services | 12 (57.1%) | 9 (42.9%) |
| Health Care & Social Assistance | 12 (63.2%) | 7 (36.8%) |
| Arts, Entertainment & Recreation | 0 (0.0%) | 7 (100.0%) |
| Accommodation & Food Services | 0 (0.0%) | 0 (0.0%) |
| Public Administration | 20 (71.4%) | 8 (28.6%) |
| Total | 104 (63.4%) | 60 (36.6%) |
Education in Hamilton Branch
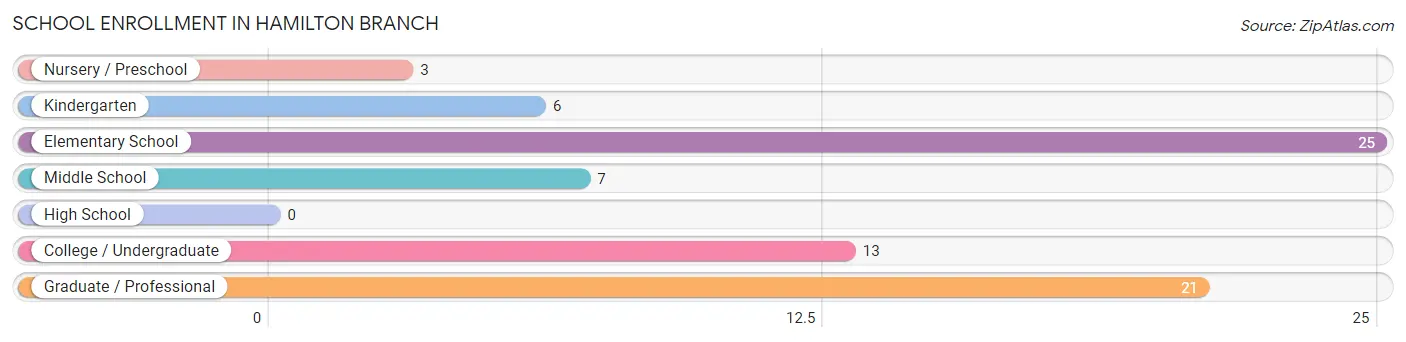
School Enrollment in Hamilton Branch
The most common levels of schooling among the 75 students in Hamilton Branch are elementary school (25 | 33.3%), graduate / professional (21 | 28.0%), and college / undergraduate (13 | 17.3%).
| School Level | # Students | % Students |
| Nursery / Preschool | 3 | 4.0% |
| Kindergarten | 6 | 8.0% |
| Elementary School | 25 | 33.3% |
| Middle School | 7 | 9.3% |
| High School | 0 | 0.0% |
| College / Undergraduate | 13 | 17.3% |
| Graduate / Professional | 21 | 28.0% |
| Total | 75 | 100.0% |
School Enrollment by Age by Funding Source in Hamilton Branch
Out of a total of 75 students who are enrolled in schools in Hamilton Branch, 21 (28.0%) attend a private institution, while the remaining 54 (72.0%) are enrolled in public schools. The age group of 25 to 34 year olds has the highest likelihood of being enrolled in private schools, with 21 (70.0% in the age bracket) enrolled. Conversely, the age group of 5 to 9 year old has the lowest likelihood of being enrolled in a private school, with 34 (100.0% in the age bracket) attending a public institution.
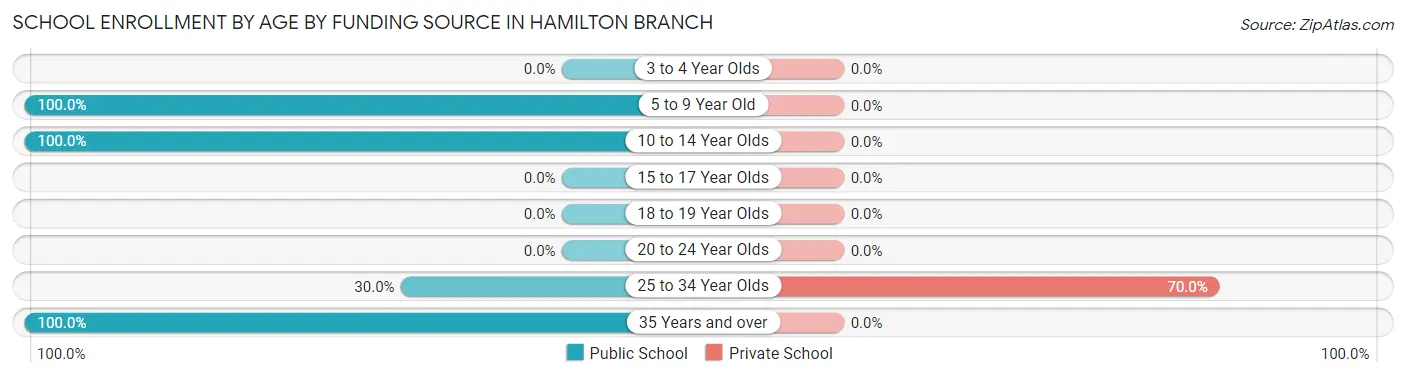
| Age Bracket | Public School | Private School |
| 3 to 4 Year Olds | 0 (0.0%) | 0 (0.0%) |
| 5 to 9 Year Old | 34 (100.0%) | 0 (0.0%) |
| 10 to 14 Year Olds | 7 (100.0%) | 0 (0.0%) |
| 15 to 17 Year Olds | 0 (0.0%) | 0 (0.0%) |
| 18 to 19 Year Olds | 0 (0.0%) | 0 (0.0%) |
| 20 to 24 Year Olds | 0 (0.0%) | 0 (0.0%) |
| 25 to 34 Year Olds | 9 (30.0%) | 21 (70.0%) |
| 35 Years and over | 4 (100.0%) | 0 (0.0%) |
| Total | 54 (72.0%) | 21 (28.0%) |
Educational Attainment by Field of Study in Hamilton Branch
Bio, nature & agricultural (43 | 25.6%), education (23 | 13.7%), engineering (21 | 12.5%), business (21 | 12.5%), and liberal arts & history (15 | 8.9%) are the most common fields of study among 168 individuals in Hamilton Branch who have obtained a bachelor's degree or higher.
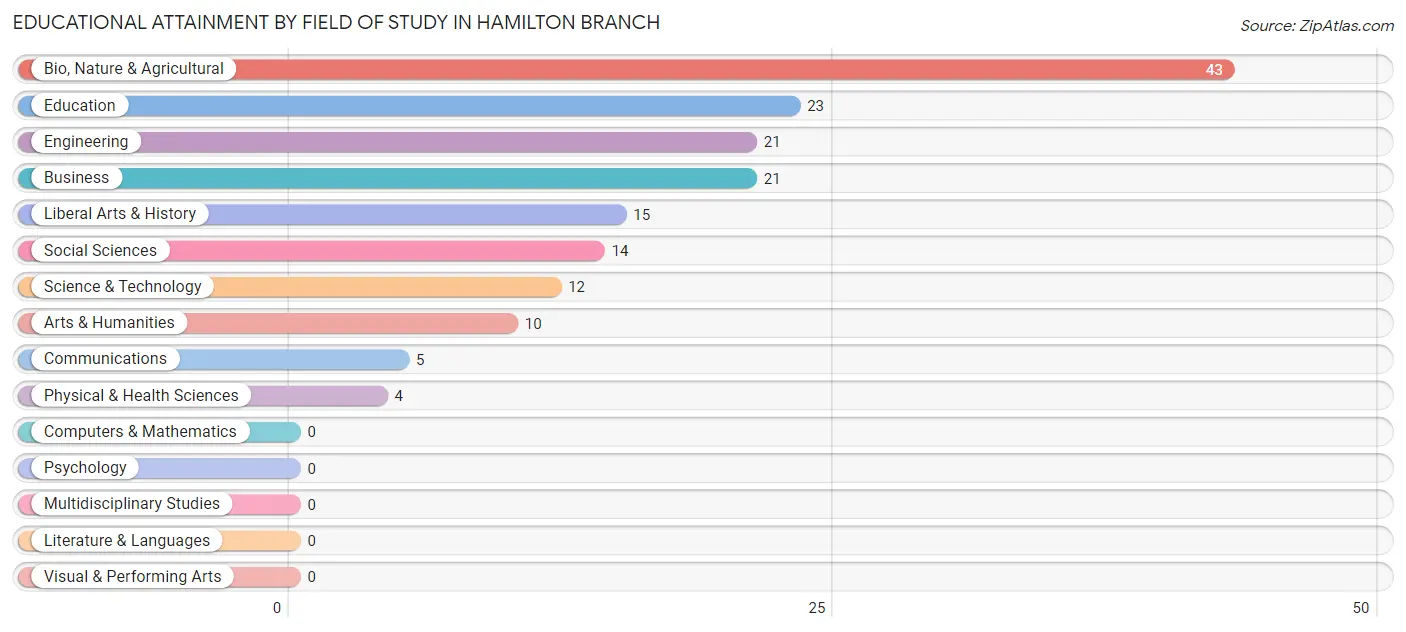
| Field of Study | # Graduates | % Graduates |
| Computers & Mathematics | 0 | 0.0% |
| Bio, Nature & Agricultural | 43 | 25.6% |
| Physical & Health Sciences | 4 | 2.4% |
| Psychology | 0 | 0.0% |
| Social Sciences | 14 | 8.3% |
| Engineering | 21 | 12.5% |
| Multidisciplinary Studies | 0 | 0.0% |
| Science & Technology | 12 | 7.1% |
| Business | 21 | 12.5% |
| Education | 23 | 13.7% |
| Literature & Languages | 0 | 0.0% |
| Liberal Arts & History | 15 | 8.9% |
| Visual & Performing Arts | 0 | 0.0% |
| Communications | 5 | 3.0% |
| Arts & Humanities | 10 | 5.9% |
| Total | 168 | 100.0% |
Transportation & Commute in Hamilton Branch
Vehicle Availability by Sex in Hamilton Branch
The most prevalent vehicle ownership categories in Hamilton Branch are males with 3 vehicles (49, accounting for 47.1%) and females with 3 vehicles (19, making up 86.0%).
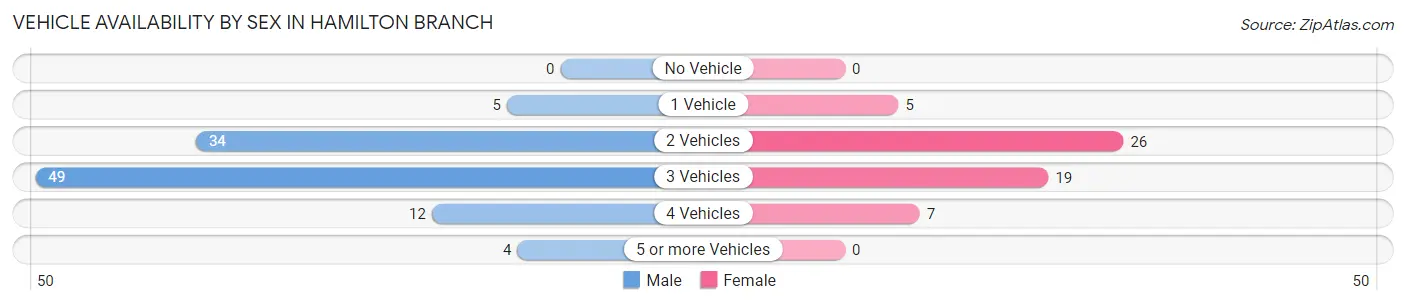
| Vehicles Available | Male | Female |
| No Vehicle | 0 (0.0%) | 0 (0.0%) |
| 1 Vehicle | 5 (4.8%) | 5 (8.8%) |
| 2 Vehicles | 34 (32.7%) | 26 (45.6%) |
| 3 Vehicles | 49 (47.1%) | 19 (33.3%) |
| 4 Vehicles | 12 (11.5%) | 7 (12.3%) |
| 5 or more Vehicles | 4 (3.8%) | 0 (0.0%) |
| Total | 104 (100.0%) | 57 (100.0%) |
Commute Time in Hamilton Branch
The most frequently occuring commute durations in Hamilton Branch are 10 to 14 minutes (53 commuters, 41.4%), 15 to 19 minutes (29 commuters, 22.7%), and 45 to 59 minutes (18 commuters, 14.1%).
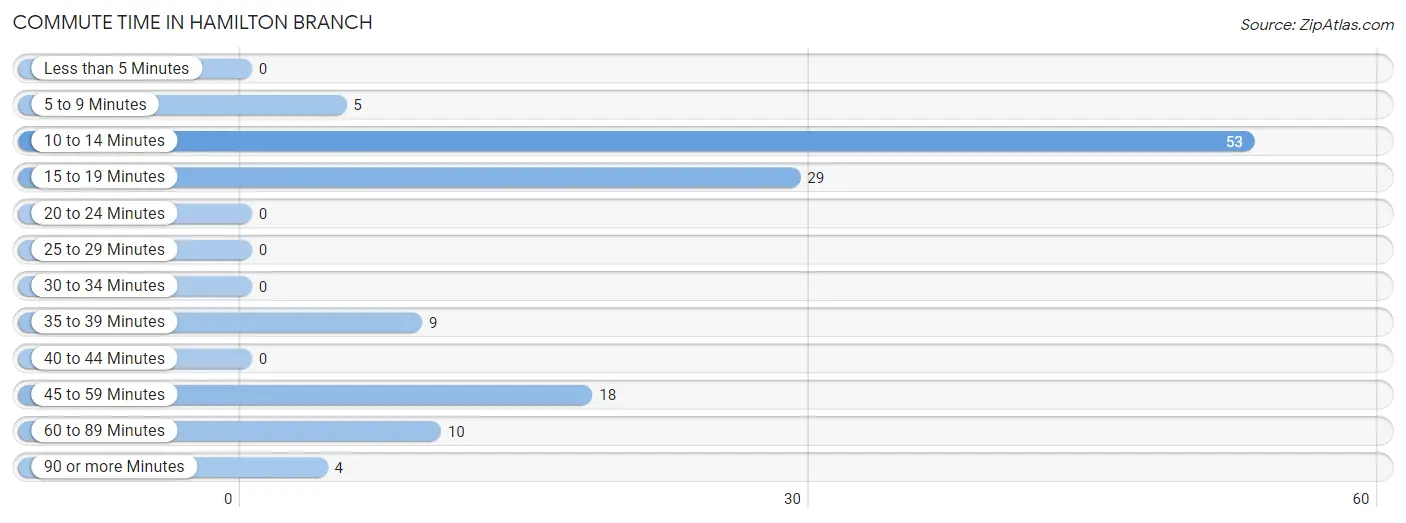
| Commute Time | # Commuters | % Commuters |
| Less than 5 Minutes | 0 | 0.0% |
| 5 to 9 Minutes | 5 | 3.9% |
| 10 to 14 Minutes | 53 | 41.4% |
| 15 to 19 Minutes | 29 | 22.7% |
| 20 to 24 Minutes | 0 | 0.0% |
| 25 to 29 Minutes | 0 | 0.0% |
| 30 to 34 Minutes | 0 | 0.0% |
| 35 to 39 Minutes | 9 | 7.0% |
| 40 to 44 Minutes | 0 | 0.0% |
| 45 to 59 Minutes | 18 | 14.1% |
| 60 to 89 Minutes | 10 | 7.8% |
| 90 or more Minutes | 4 | 3.1% |
Commute Time by Sex in Hamilton Branch
The most common commute times in Hamilton Branch are 10 to 14 minutes (27 commuters, 34.2%) for males and 10 to 14 minutes (26 commuters, 53.1%) for females.
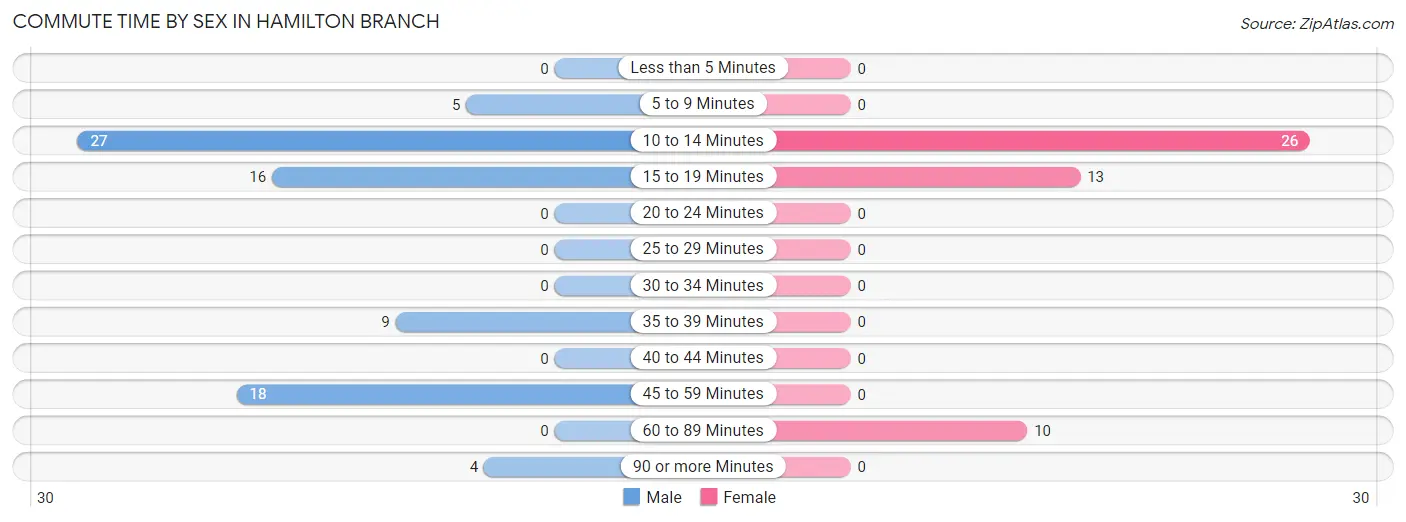
| Commute Time | Male | Female |
| Less than 5 Minutes | 0 (0.0%) | 0 (0.0%) |
| 5 to 9 Minutes | 5 (6.3%) | 0 (0.0%) |
| 10 to 14 Minutes | 27 (34.2%) | 26 (53.1%) |
| 15 to 19 Minutes | 16 (20.3%) | 13 (26.5%) |
| 20 to 24 Minutes | 0 (0.0%) | 0 (0.0%) |
| 25 to 29 Minutes | 0 (0.0%) | 0 (0.0%) |
| 30 to 34 Minutes | 0 (0.0%) | 0 (0.0%) |
| 35 to 39 Minutes | 9 (11.4%) | 0 (0.0%) |
| 40 to 44 Minutes | 0 (0.0%) | 0 (0.0%) |
| 45 to 59 Minutes | 18 (22.8%) | 0 (0.0%) |
| 60 to 89 Minutes | 0 (0.0%) | 10 (20.4%) |
| 90 or more Minutes | 4 (5.1%) | 0 (0.0%) |
Time of Departure to Work by Sex in Hamilton Branch
The most frequent times of departure to work in Hamilton Branch are 10:00 AM to 10:59 AM (16, 20.3%) for males and 8:30 AM to 8:59 AM (15, 30.6%) for females.
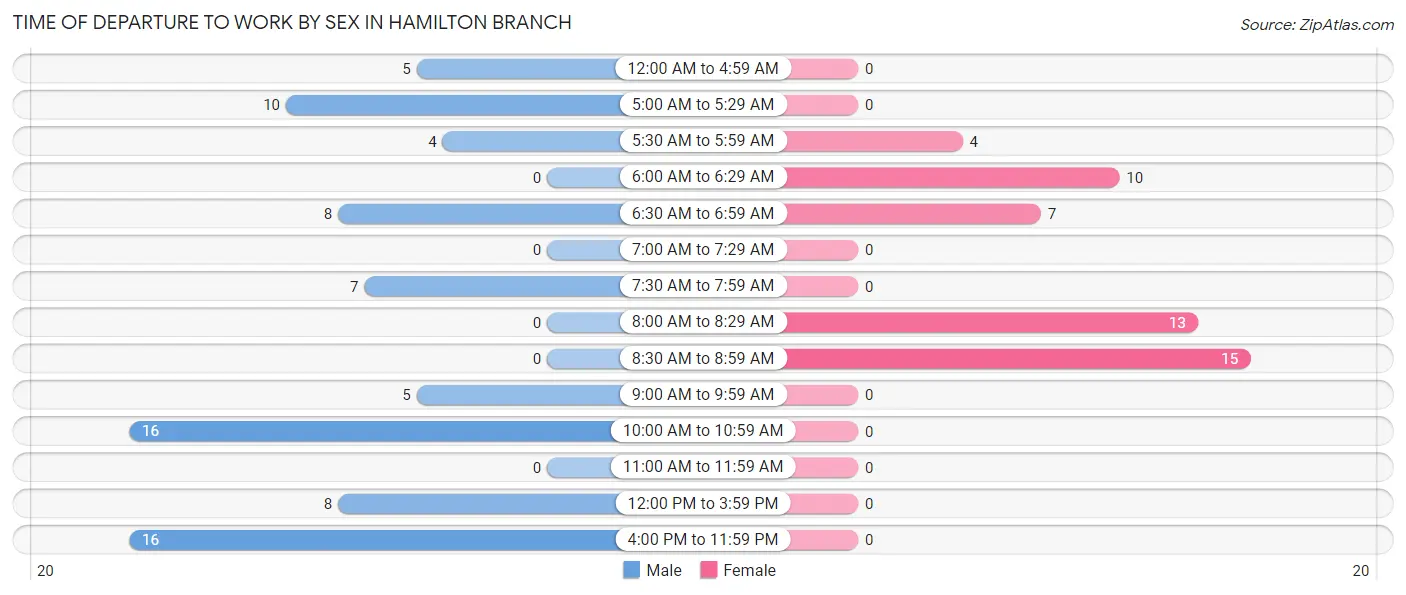
| Time of Departure | Male | Female |
| 12:00 AM to 4:59 AM | 5 (6.3%) | 0 (0.0%) |
| 5:00 AM to 5:29 AM | 10 (12.7%) | 0 (0.0%) |
| 5:30 AM to 5:59 AM | 4 (5.1%) | 4 (8.2%) |
| 6:00 AM to 6:29 AM | 0 (0.0%) | 10 (20.4%) |
| 6:30 AM to 6:59 AM | 8 (10.1%) | 7 (14.3%) |
| 7:00 AM to 7:29 AM | 0 (0.0%) | 0 (0.0%) |
| 7:30 AM to 7:59 AM | 7 (8.9%) | 0 (0.0%) |
| 8:00 AM to 8:29 AM | 0 (0.0%) | 13 (26.5%) |
| 8:30 AM to 8:59 AM | 0 (0.0%) | 15 (30.6%) |
| 9:00 AM to 9:59 AM | 5 (6.3%) | 0 (0.0%) |
| 10:00 AM to 10:59 AM | 16 (20.3%) | 0 (0.0%) |
| 11:00 AM to 11:59 AM | 0 (0.0%) | 0 (0.0%) |
| 12:00 PM to 3:59 PM | 8 (10.1%) | 0 (0.0%) |
| 4:00 PM to 11:59 PM | 16 (20.3%) | 0 (0.0%) |
| Total | 79 (100.0%) | 49 (100.0%) |
Housing Occupancy in Hamilton Branch
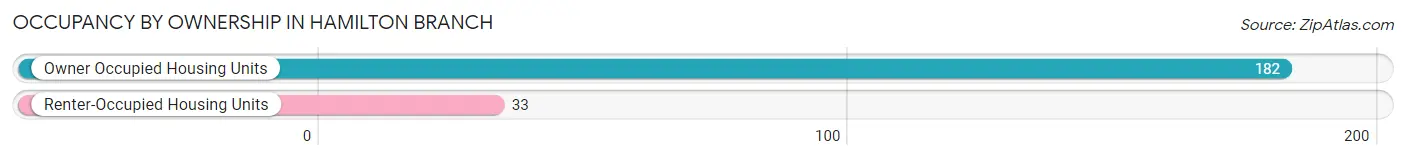
Occupancy by Ownership in Hamilton Branch
Of the total 215 dwellings in Hamilton Branch, owner-occupied units account for 182 (84.7%), while renter-occupied units make up 33 (15.3%).
| Occupancy | # Housing Units | % Housing Units |
| Owner Occupied Housing Units | 182 | 84.7% |
| Renter-Occupied Housing Units | 33 | 15.3% |
| Total Occupied Housing Units | 215 | 100.0% |
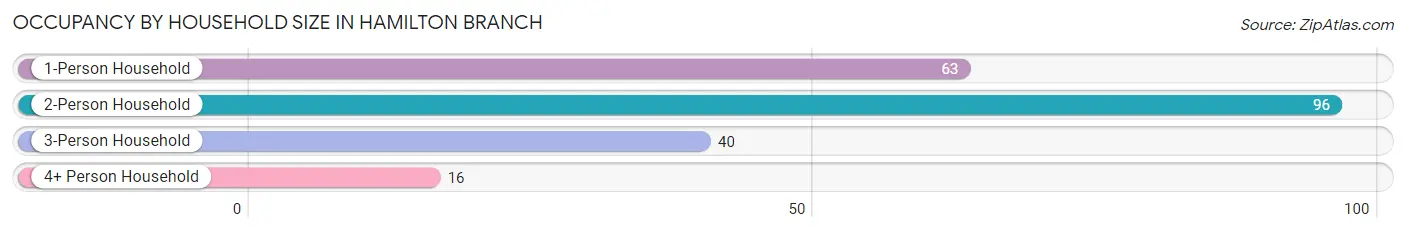
Occupancy by Household Size in Hamilton Branch
| Household Size | # Housing Units | % Housing Units |
| 1-Person Household | 63 | 29.3% |
| 2-Person Household | 96 | 44.7% |
| 3-Person Household | 40 | 18.6% |
| 4+ Person Household | 16 | 7.4% |
| Total Housing Units | 215 | 100.0% |
Occupancy by Ownership by Household Size in Hamilton Branch
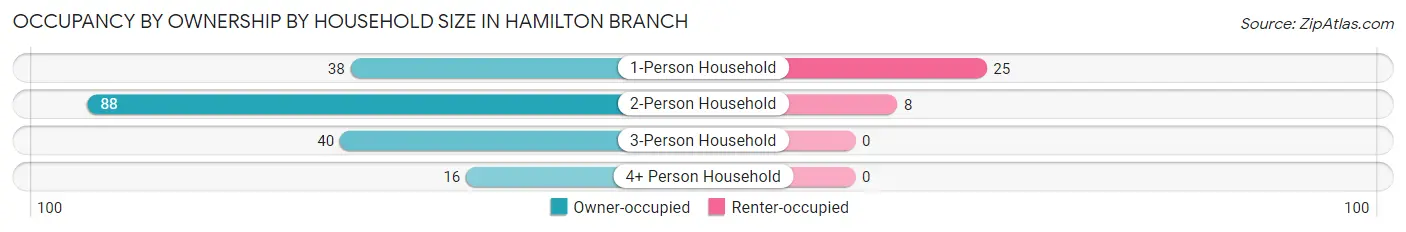
| Household Size | Owner-occupied | Renter-occupied |
| 1-Person Household | 38 (60.3%) | 25 (39.7%) |
| 2-Person Household | 88 (91.7%) | 8 (8.3%) |
| 3-Person Household | 40 (100.0%) | 0 (0.0%) |
| 4+ Person Household | 16 (100.0%) | 0 (0.0%) |
| Total Housing Units | 182 (84.7%) | 33 (15.3%) |
Occupancy by Educational Attainment in Hamilton Branch
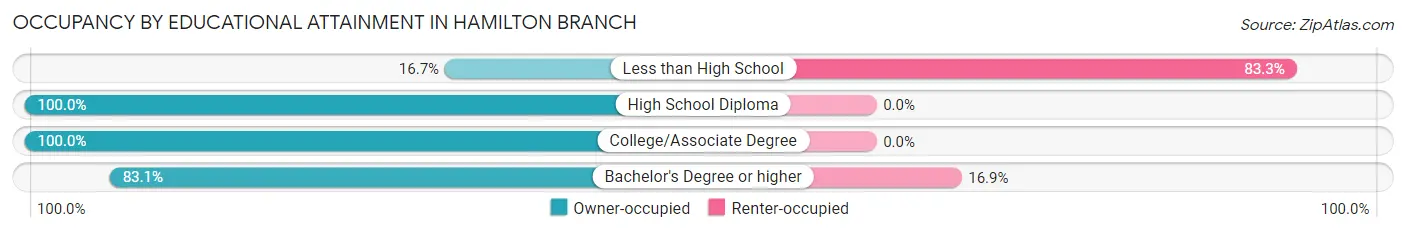
| Household Size | Owner-occupied | Renter-occupied |
| Less than High School | 4 (16.7%) | 20 (83.3%) |
| High School Diploma | 49 (100.0%) | 0 (0.0%) |
| College/Associate Degree | 65 (100.0%) | 0 (0.0%) |
| Bachelor's Degree or higher | 64 (83.1%) | 13 (16.9%) |
Occupancy by Age of Householder in Hamilton Branch
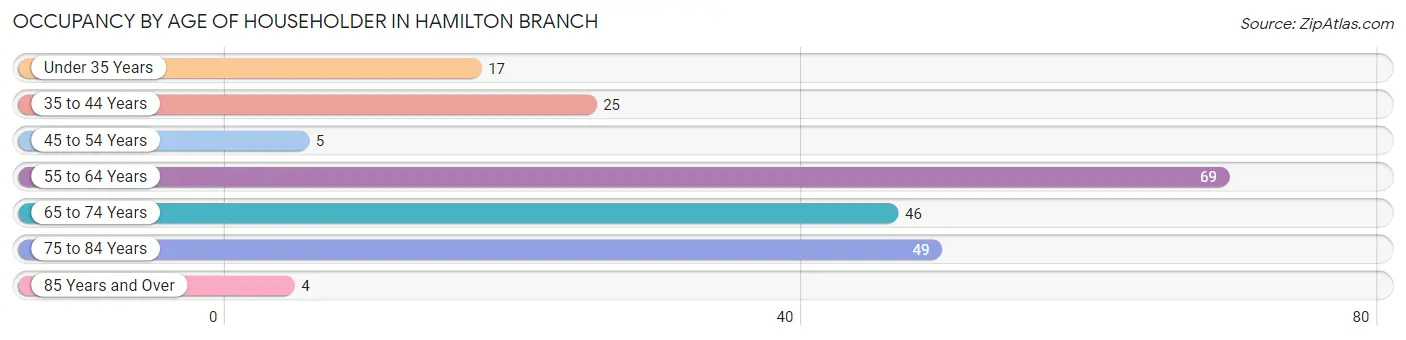
| Age Bracket | # Households | % Households |
| Under 35 Years | 17 | 7.9% |
| 35 to 44 Years | 25 | 11.6% |
| 45 to 54 Years | 5 | 2.3% |
| 55 to 64 Years | 69 | 32.1% |
| 65 to 74 Years | 46 | 21.4% |
| 75 to 84 Years | 49 | 22.8% |
| 85 Years and Over | 4 | 1.9% |
| Total | 215 | 100.0% |
Housing Finances in Hamilton Branch
Median Income by Occupancy in Hamilton Branch
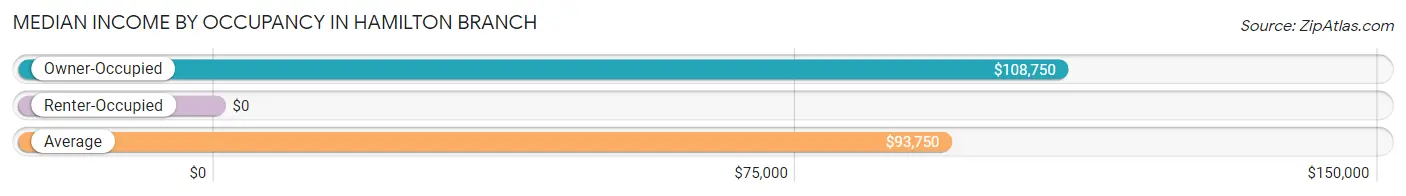
| Occupancy Type | # Households | Median Income |
| Owner-Occupied | 182 (84.7%) | $108,750 |
| Renter-Occupied | 33 (15.3%) | $0 |
| Average | 215 (100.0%) | $93,750 |
Occupancy by Householder Income Bracket in Hamilton Branch
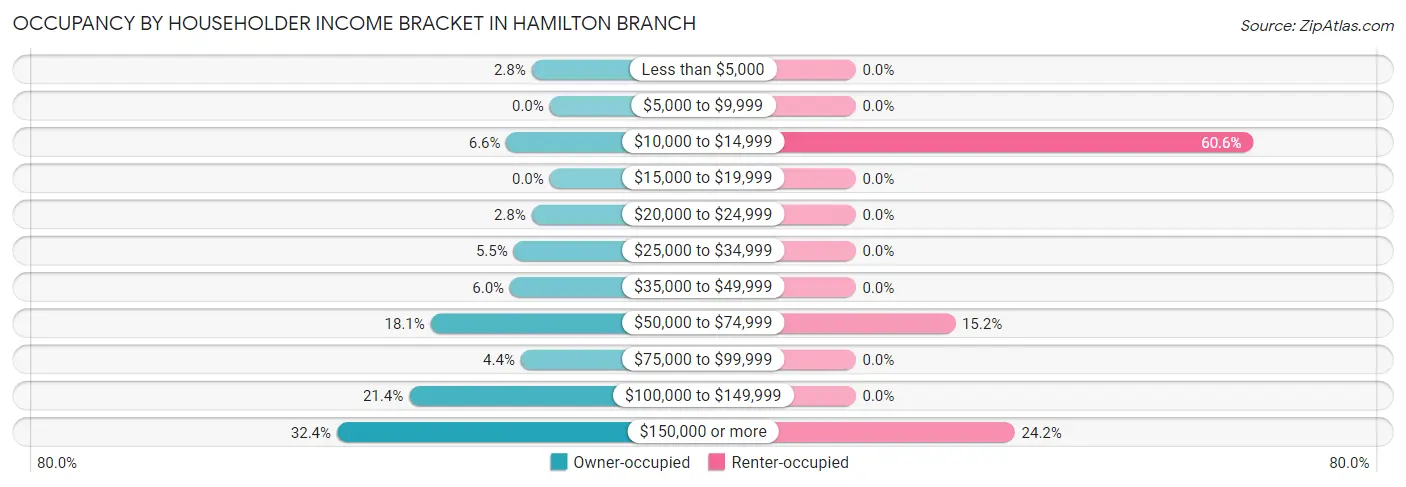
| Income Bracket | Owner-occupied | Renter-occupied |
| Less than $5,000 | 5 (2.8%) | 0 (0.0%) |
| $5,000 to $9,999 | 0 (0.0%) | 0 (0.0%) |
| $10,000 to $14,999 | 12 (6.6%) | 20 (60.6%) |
| $15,000 to $19,999 | 0 (0.0%) | 0 (0.0%) |
| $20,000 to $24,999 | 5 (2.8%) | 0 (0.0%) |
| $25,000 to $34,999 | 10 (5.5%) | 0 (0.0%) |
| $35,000 to $49,999 | 11 (6.0%) | 0 (0.0%) |
| $50,000 to $74,999 | 33 (18.1%) | 5 (15.1%) |
| $75,000 to $99,999 | 8 (4.4%) | 0 (0.0%) |
| $100,000 to $149,999 | 39 (21.4%) | 0 (0.0%) |
| $150,000 or more | 59 (32.4%) | 8 (24.2%) |
| Total | 182 (100.0%) | 33 (100.0%) |
Monthly Housing Cost Tiers in Hamilton Branch
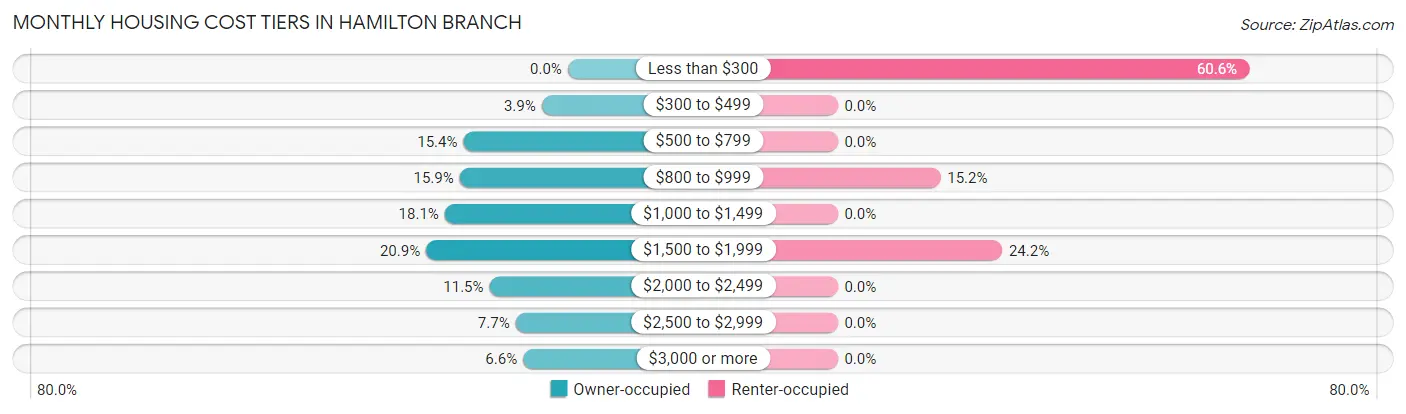
| Monthly Cost | Owner-occupied | Renter-occupied |
| Less than $300 | 0 (0.0%) | 20 (60.6%) |
| $300 to $499 | 7 (3.8%) | 0 (0.0%) |
| $500 to $799 | 28 (15.4%) | 0 (0.0%) |
| $800 to $999 | 29 (15.9%) | 5 (15.1%) |
| $1,000 to $1,499 | 33 (18.1%) | 0 (0.0%) |
| $1,500 to $1,999 | 38 (20.9%) | 8 (24.2%) |
| $2,000 to $2,499 | 21 (11.5%) | 0 (0.0%) |
| $2,500 to $2,999 | 14 (7.7%) | 0 (0.0%) |
| $3,000 or more | 12 (6.6%) | 0 (0.0%) |
| Total | 182 (100.0%) | 33 (100.0%) |
Physical Housing Characteristics in Hamilton Branch
Housing Structures in Hamilton Branch
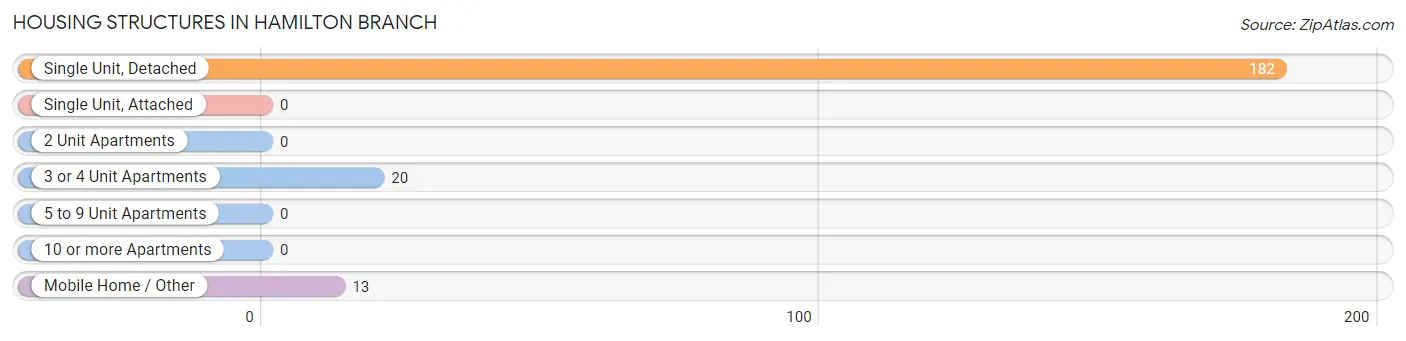
| Structure Type | # Housing Units | % Housing Units |
| Single Unit, Detached | 182 | 84.7% |
| Single Unit, Attached | 0 | 0.0% |
| 2 Unit Apartments | 0 | 0.0% |
| 3 or 4 Unit Apartments | 20 | 9.3% |
| 5 to 9 Unit Apartments | 0 | 0.0% |
| 10 or more Apartments | 0 | 0.0% |
| Mobile Home / Other | 13 | 6.0% |
| Total | 215 | 100.0% |
Housing Structures by Occupancy in Hamilton Branch
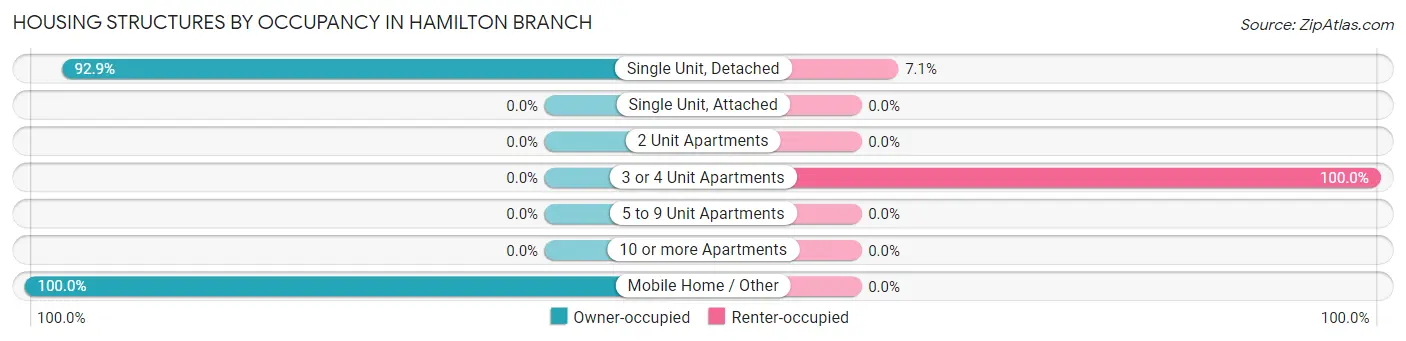
| Structure Type | Owner-occupied | Renter-occupied |
| Single Unit, Detached | 169 (92.9%) | 13 (7.1%) |
| Single Unit, Attached | 0 (0.0%) | 0 (0.0%) |
| 2 Unit Apartments | 0 (0.0%) | 0 (0.0%) |
| 3 or 4 Unit Apartments | 0 (0.0%) | 20 (100.0%) |
| 5 to 9 Unit Apartments | 0 (0.0%) | 0 (0.0%) |
| 10 or more Apartments | 0 (0.0%) | 0 (0.0%) |
| Mobile Home / Other | 13 (100.0%) | 0 (0.0%) |
| Total | 182 (84.7%) | 33 (15.3%) |
Housing Structures by Number of Rooms in Hamilton Branch
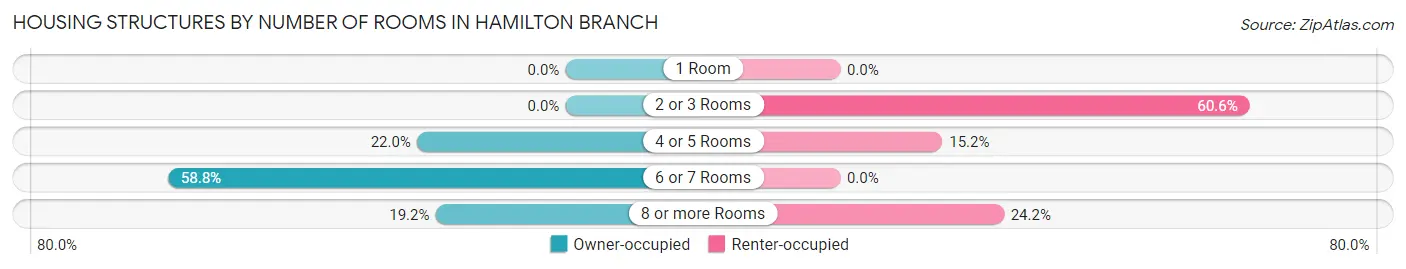
| Number of Rooms | Owner-occupied | Renter-occupied |
| 1 Room | 0 (0.0%) | 0 (0.0%) |
| 2 or 3 Rooms | 0 (0.0%) | 20 (60.6%) |
| 4 or 5 Rooms | 40 (22.0%) | 5 (15.1%) |
| 6 or 7 Rooms | 107 (58.8%) | 0 (0.0%) |
| 8 or more Rooms | 35 (19.2%) | 8 (24.2%) |
| Total | 182 (100.0%) | 33 (100.0%) |
Housing Structure by Heating Type in Hamilton Branch
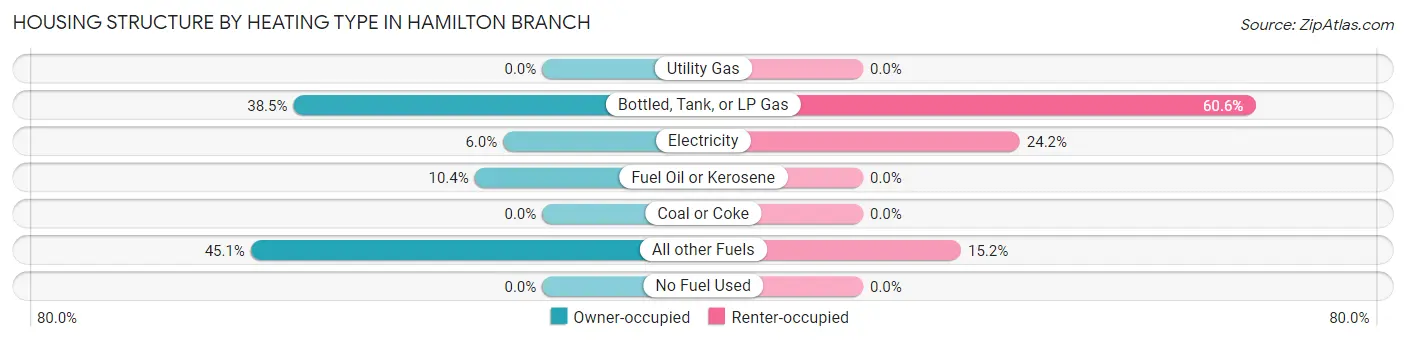
| Heating Type | Owner-occupied | Renter-occupied |
| Utility Gas | 0 (0.0%) | 0 (0.0%) |
| Bottled, Tank, or LP Gas | 70 (38.5%) | 20 (60.6%) |
| Electricity | 11 (6.0%) | 8 (24.2%) |
| Fuel Oil or Kerosene | 19 (10.4%) | 0 (0.0%) |
| Coal or Coke | 0 (0.0%) | 0 (0.0%) |
| All other Fuels | 82 (45.1%) | 5 (15.1%) |
| No Fuel Used | 0 (0.0%) | 0 (0.0%) |
| Total | 182 (100.0%) | 33 (100.0%) |
Household Vehicle Usage in Hamilton Branch
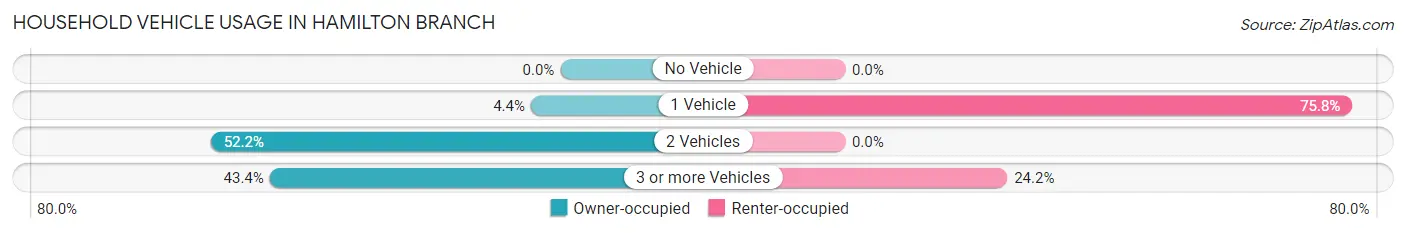
| Vehicles per Household | Owner-occupied | Renter-occupied |
| No Vehicle | 0 (0.0%) | 0 (0.0%) |
| 1 Vehicle | 8 (4.4%) | 25 (75.8%) |
| 2 Vehicles | 95 (52.2%) | 0 (0.0%) |
| 3 or more Vehicles | 79 (43.4%) | 8 (24.2%) |
| Total | 182 (100.0%) | 33 (100.0%) |
Real Estate & Mortgages in Hamilton Branch
Real Estate and Mortgage Overview in Hamilton Branch
| Characteristic | Without Mortgage | With Mortgage |
| Housing Units | 59 | 123 |
| Median Property Value | $385,000 | $350,000 |
| Median Household Income | $66,250 | $55 |
| Monthly Housing Costs | $745 | $12 |
| Real Estate Taxes | $2,521 | $0 |
Property Value by Mortgage Status in Hamilton Branch
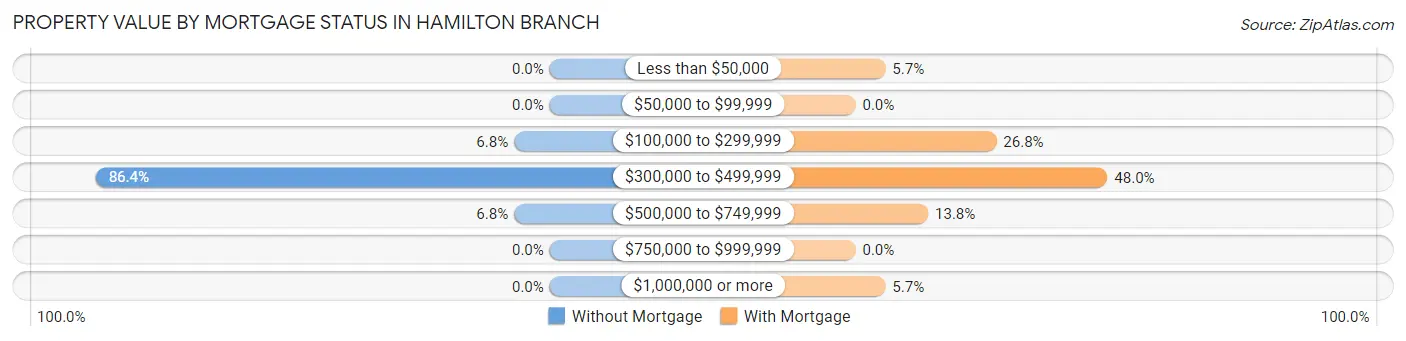
| Property Value | Without Mortgage | With Mortgage |
| Less than $50,000 | 0 (0.0%) | 7 (5.7%) |
| $50,000 to $99,999 | 0 (0.0%) | 0 (0.0%) |
| $100,000 to $299,999 | 4 (6.8%) | 33 (26.8%) |
| $300,000 to $499,999 | 51 (86.4%) | 59 (48.0%) |
| $500,000 to $749,999 | 4 (6.8%) | 17 (13.8%) |
| $750,000 to $999,999 | 0 (0.0%) | 0 (0.0%) |
| $1,000,000 or more | 0 (0.0%) | 7 (5.7%) |
| Total | 59 (100.0%) | 123 (100.0%) |
Household Income by Mortgage Status in Hamilton Branch
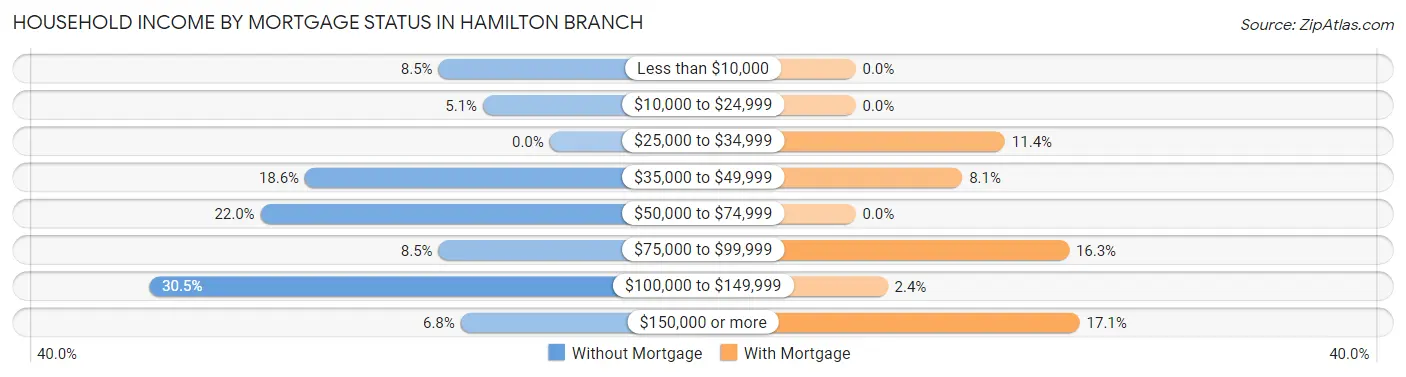
| Household Income | Without Mortgage | With Mortgage |
| Less than $10,000 | 5 (8.5%) | 0 (0.0%) |
| $10,000 to $24,999 | 3 (5.1%) | 0 (0.0%) |
| $25,000 to $34,999 | 0 (0.0%) | 14 (11.4%) |
| $35,000 to $49,999 | 11 (18.6%) | 10 (8.1%) |
| $50,000 to $74,999 | 13 (22.0%) | 0 (0.0%) |
| $75,000 to $99,999 | 5 (8.5%) | 20 (16.3%) |
| $100,000 to $149,999 | 18 (30.5%) | 3 (2.4%) |
| $150,000 or more | 4 (6.8%) | 21 (17.1%) |
| Total | 59 (100.0%) | 123 (100.0%) |
Property Value to Household Income Ratio in Hamilton Branch
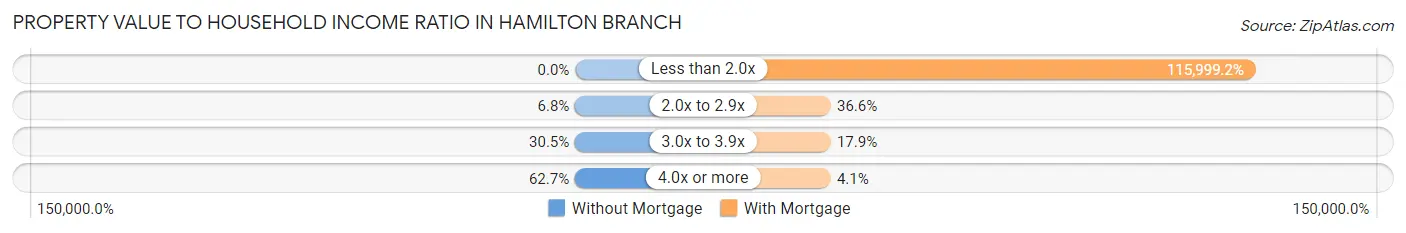
| Value-to-Income Ratio | Without Mortgage | With Mortgage |
| Less than 2.0x | 0 (0.0%) | 142,679 (115,999.2%) |
| 2.0x to 2.9x | 4 (6.8%) | 45 (36.6%) |
| 3.0x to 3.9x | 18 (30.5%) | 22 (17.9%) |
| 4.0x or more | 37 (62.7%) | 5 (4.1%) |
| Total | 59 (100.0%) | 123 (100.0%) |
Real Estate Taxes by Mortgage Status in Hamilton Branch
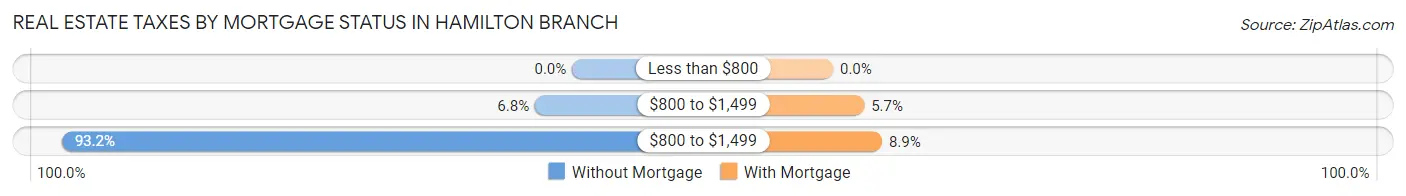
| Property Taxes | Without Mortgage | With Mortgage |
| Less than $800 | 0 (0.0%) | 0 (0.0%) |
| $800 to $1,499 | 4 (6.8%) | 7 (5.7%) |
| $800 to $1,499 | 55 (93.2%) | 11 (8.9%) |
| Total | 59 (100.0%) | 123 (100.0%) |
Health & Disability in Hamilton Branch
Health Insurance Coverage by Age in Hamilton Branch
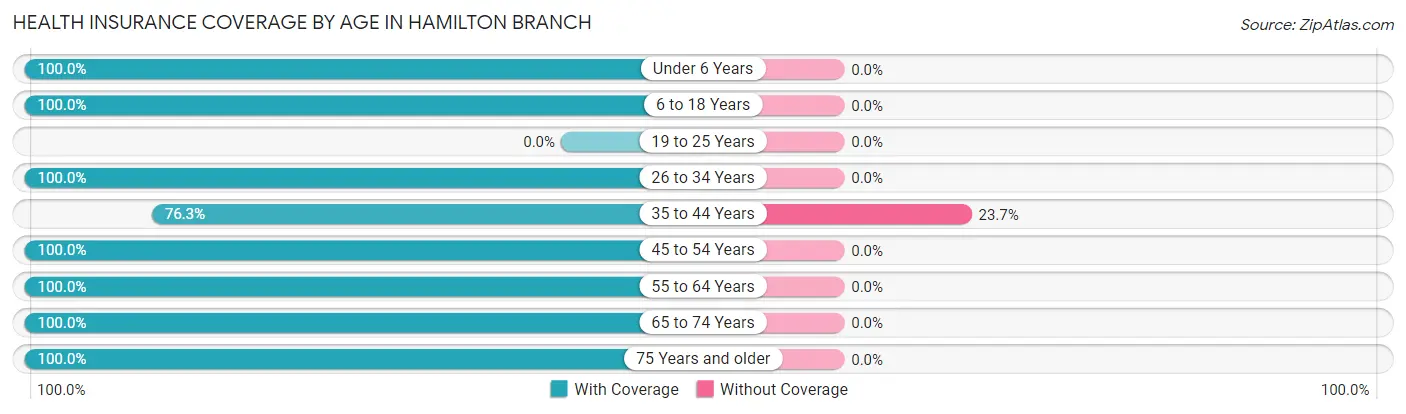
| Age Bracket | With Coverage | Without Coverage |
| Under 6 Years | 15 (100.0%) | 0 (0.0%) |
| 6 to 18 Years | 38 (100.0%) | 0 (0.0%) |
| 19 to 25 Years | 0 (0.0%) | 0 (0.0%) |
| 26 to 34 Years | 62 (100.0%) | 0 (0.0%) |
| 35 to 44 Years | 45 (76.3%) | 14 (23.7%) |
| 45 to 54 Years | 5 (100.0%) | 0 (0.0%) |
| 55 to 64 Years | 108 (100.0%) | 0 (0.0%) |
| 65 to 74 Years | 85 (100.0%) | 0 (0.0%) |
| 75 Years and older | 82 (100.0%) | 0 (0.0%) |
| Total | 440 (96.9%) | 14 (3.1%) |
Health Insurance Coverage by Citizenship Status in Hamilton Branch
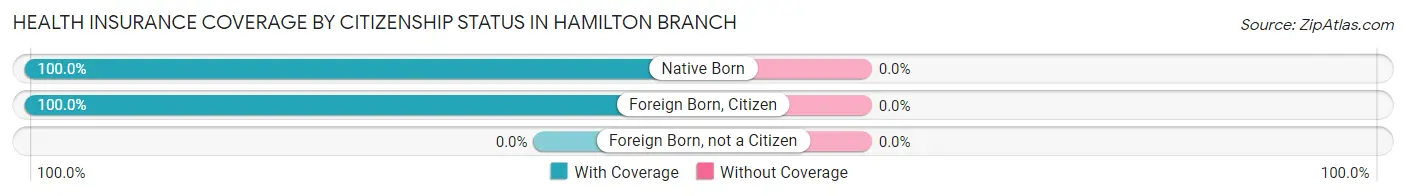
| Citizenship Status | With Coverage | Without Coverage |
| Native Born | 15 (100.0%) | 0 (0.0%) |
| Foreign Born, Citizen | 38 (100.0%) | 0 (0.0%) |
| Foreign Born, not a Citizen | 0 (0.0%) | 0 (0.0%) |
Health Insurance Coverage by Household Income in Hamilton Branch
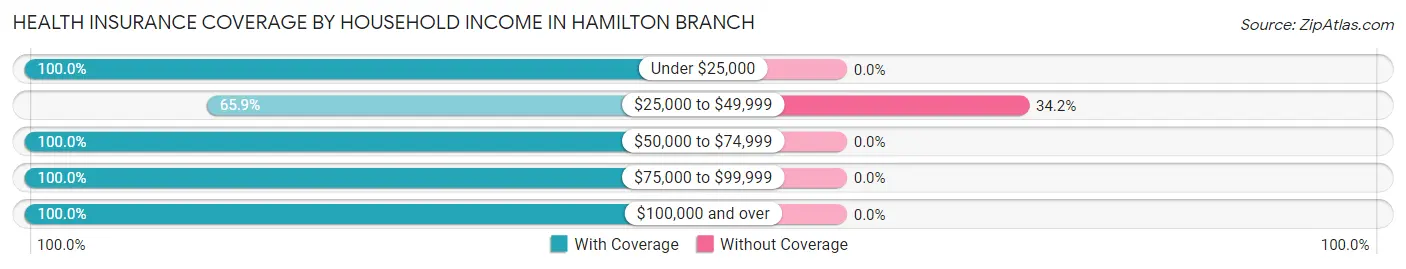
| Household Income | With Coverage | Without Coverage |
| Under $25,000 | 73 (100.0%) | 0 (0.0%) |
| $25,000 to $49,999 | 27 (65.8%) | 14 (34.2%) |
| $50,000 to $74,999 | 82 (100.0%) | 0 (0.0%) |
| $75,000 to $99,999 | 18 (100.0%) | 0 (0.0%) |
| $100,000 and over | 240 (100.0%) | 0 (0.0%) |
Public vs Private Health Insurance Coverage by Age in Hamilton Branch
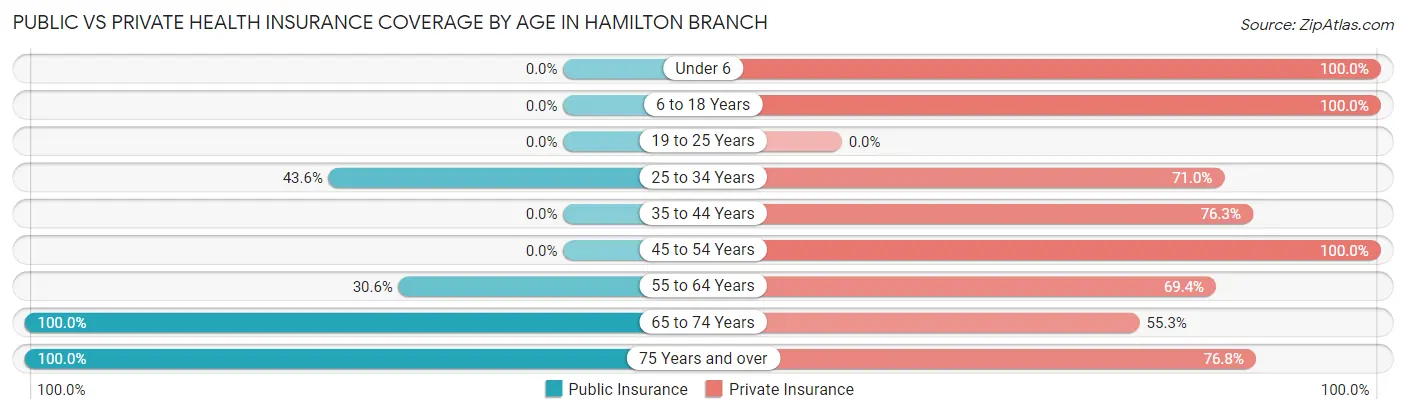
| Age Bracket | Public Insurance | Private Insurance |
| Under 6 | 0 (0.0%) | 15 (100.0%) |
| 6 to 18 Years | 0 (0.0%) | 38 (100.0%) |
| 19 to 25 Years | 0 (0.0%) | 0 (0.0%) |
| 25 to 34 Years | 27 (43.5%) | 44 (71.0%) |
| 35 to 44 Years | 0 (0.0%) | 45 (76.3%) |
| 45 to 54 Years | 0 (0.0%) | 5 (100.0%) |
| 55 to 64 Years | 33 (30.6%) | 75 (69.4%) |
| 65 to 74 Years | 85 (100.0%) | 47 (55.3%) |
| 75 Years and over | 82 (100.0%) | 63 (76.8%) |
| Total | 227 (50.0%) | 332 (73.1%) |
Disability Status by Sex by Age in Hamilton Branch
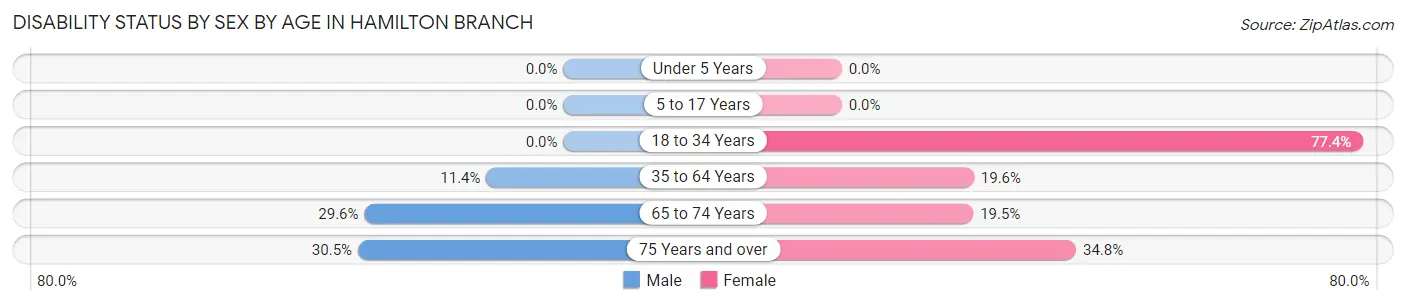
| Age Bracket | Male | Female |
| Under 5 Years | 0 (0.0%) | 0 (0.0%) |
| 5 to 17 Years | 0 (0.0%) | 0 (0.0%) |
| 18 to 34 Years | 0 (0.0%) | 24 (77.4%) |
| 35 to 64 Years | 8 (11.4%) | 20 (19.6%) |
| 65 to 74 Years | 13 (29.5%) | 8 (19.5%) |
| 75 Years and over | 18 (30.5%) | 8 (34.8%) |
Disability Class by Sex by Age in Hamilton Branch
Disability Class: Hearing Difficulty
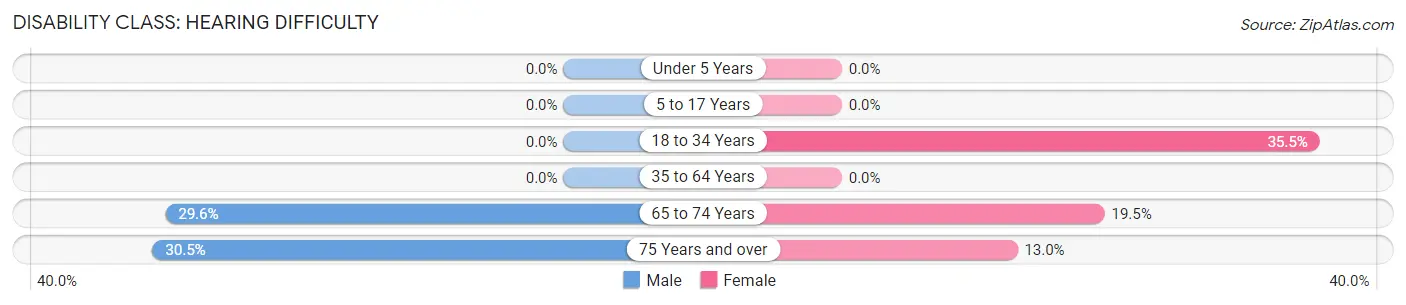
| Age Bracket | Male | Female |
| Under 5 Years | 0 (0.0%) | 0 (0.0%) |
| 5 to 17 Years | 0 (0.0%) | 0 (0.0%) |
| 18 to 34 Years | 0 (0.0%) | 11 (35.5%) |
| 35 to 64 Years | 0 (0.0%) | 0 (0.0%) |
| 65 to 74 Years | 13 (29.5%) | 8 (19.5%) |
| 75 Years and over | 18 (30.5%) | 3 (13.0%) |
Disability Class: Vision Difficulty
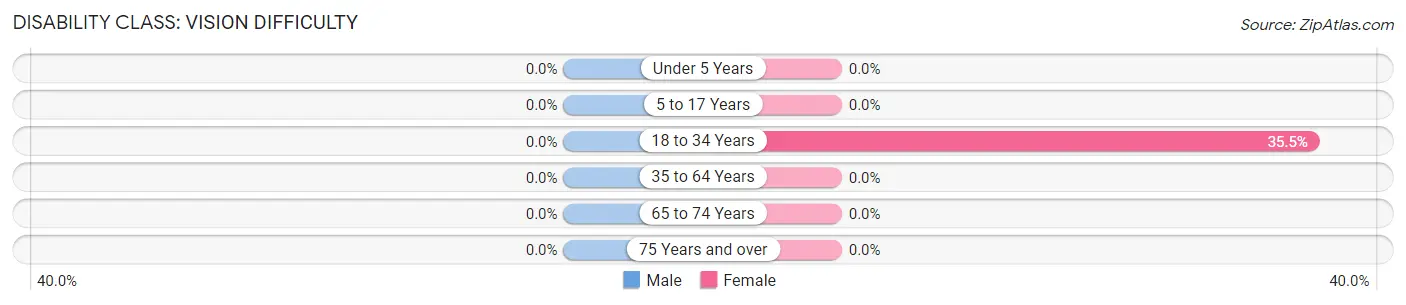
| Age Bracket | Male | Female |
| Under 5 Years | 0 (0.0%) | 0 (0.0%) |
| 5 to 17 Years | 0 (0.0%) | 0 (0.0%) |
| 18 to 34 Years | 0 (0.0%) | 11 (35.5%) |
| 35 to 64 Years | 0 (0.0%) | 0 (0.0%) |
| 65 to 74 Years | 0 (0.0%) | 0 (0.0%) |
| 75 Years and over | 0 (0.0%) | 0 (0.0%) |
Disability Class: Cognitive Difficulty
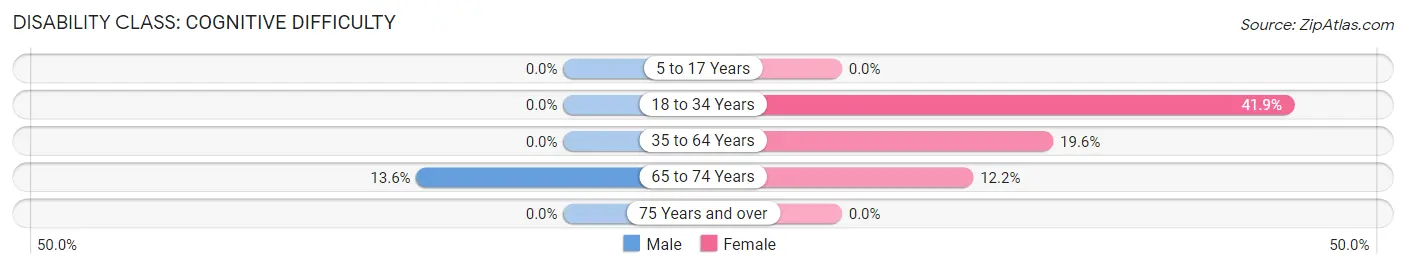
| Age Bracket | Male | Female |
| 5 to 17 Years | 0 (0.0%) | 0 (0.0%) |
| 18 to 34 Years | 0 (0.0%) | 13 (41.9%) |
| 35 to 64 Years | 0 (0.0%) | 20 (19.6%) |
| 65 to 74 Years | 6 (13.6%) | 5 (12.2%) |
| 75 Years and over | 0 (0.0%) | 0 (0.0%) |
Disability Class: Ambulatory Difficulty
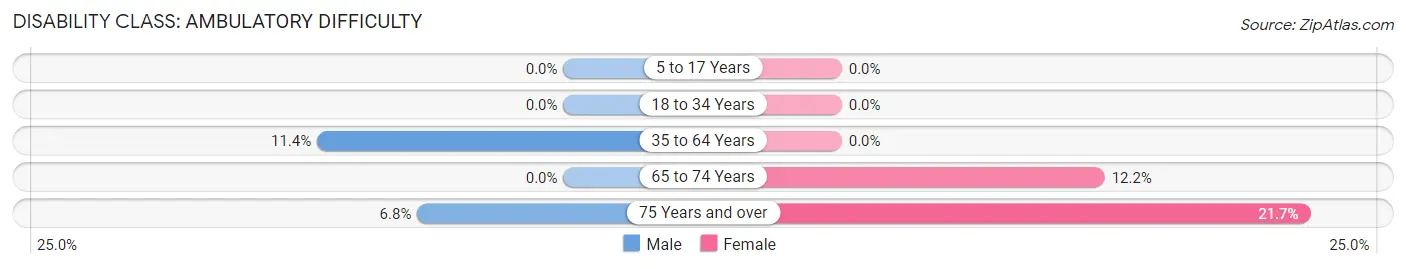
| Age Bracket | Male | Female |
| 5 to 17 Years | 0 (0.0%) | 0 (0.0%) |
| 18 to 34 Years | 0 (0.0%) | 0 (0.0%) |
| 35 to 64 Years | 8 (11.4%) | 0 (0.0%) |
| 65 to 74 Years | 0 (0.0%) | 5 (12.2%) |
| 75 Years and over | 4 (6.8%) | 5 (21.7%) |
Disability Class: Self-Care Difficulty
| Age Bracket | Male | Female |
| 5 to 17 Years | 0 (0.0%) | 0 (0.0%) |
| 18 to 34 Years | 0 (0.0%) | 0 (0.0%) |
| 35 to 64 Years | 0 (0.0%) | 0 (0.0%) |
| 65 to 74 Years | 0 (0.0%) | 0 (0.0%) |
| 75 Years and over | 0 (0.0%) | 0 (0.0%) |
Technology Access in Hamilton Branch
Computing Device Access in Hamilton Branch
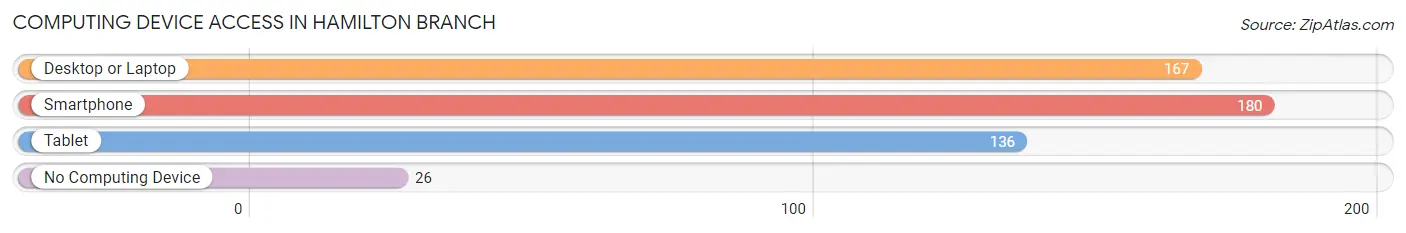
| Device Type | # Households | % Households |
| Desktop or Laptop | 167 | 77.7% |
| Smartphone | 180 | 83.7% |
| Tablet | 136 | 63.3% |
| No Computing Device | 26 | 12.1% |
| Total | 215 | 100.0% |
Internet Access in Hamilton Branch
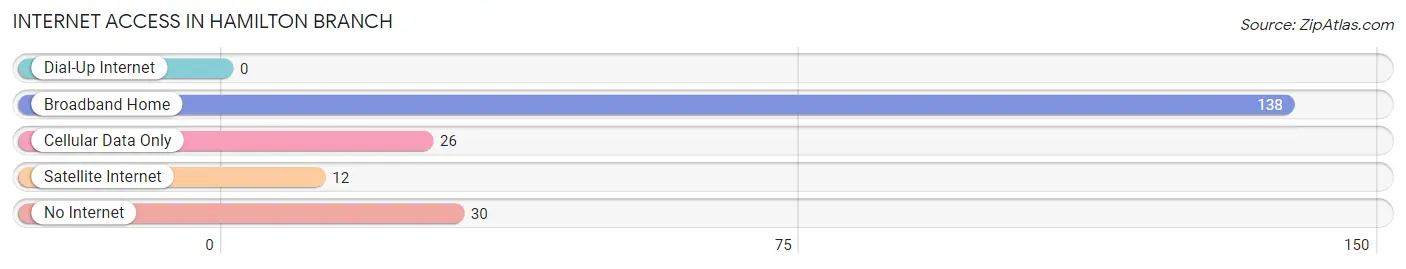
| Internet Type | # Households | % Households |
| Dial-Up Internet | 0 | 0.0% |
| Broadband Home | 138 | 64.2% |
| Cellular Data Only | 26 | 12.1% |
| Satellite Internet | 12 | 5.6% |
| No Internet | 30 | 14.0% |
| Total | 215 | 100.0% |
Hamilton Branch Summary
The Hamilton Branch is a small unincorporated community located in the Sierra Nevada foothills of El Dorado County, California. It is situated in the western part of the county, approximately 25 miles east of Placerville and 40 miles northeast of Sacramento. The community is located along the South Fork of the American River, and is surrounded by the Eldorado National Forest.
History
The Hamilton Branch area was first settled in the mid-1800s by miners and loggers who were attracted to the area by the abundance of natural resources. The area was named after the Hamilton family, who were among the first settlers in the area. The Hamilton family built a sawmill and a grist mill, which were used to process lumber and grain. The area was also home to several small gold mines, which were operated by the Hamilton family and other local miners.
In the early 1900s, the area began to attract more settlers, and the community of Hamilton Branch was established. The community was home to a post office, a general store, a school, and several churches. The area was also home to a number of small farms and ranches, which provided food and other goods to the local population.
Geography
The Hamilton Branch area is located in the western part of El Dorado County, approximately 25 miles east of Placerville and 40 miles northeast of Sacramento. The community is situated along the South Fork of the American River, and is surrounded by the Eldorado National Forest. The area is characterized by rolling hills, dense forests, and numerous creeks and streams. The climate is mild, with hot summers and cool winters.
Economy
The economy of the Hamilton Branch area is largely based on tourism and recreation. The area is home to several popular camping and fishing spots, as well as numerous hiking trails. The area is also home to several wineries, which produce a variety of wines. The area is also home to several small businesses, including restaurants, stores, and other services.
Demographics
The population of the Hamilton Branch area is estimated to be around 500 people. The population is largely white, with a small percentage of African Americans, Hispanics, and Native Americans. The median household income is around $50,000, and the median home value is around $250,000. The area is served by the El Dorado County School District, which provides public education to the local population.
Common Questions
What is Per Capita Income in Hamilton Branch?
Per Capita income in Hamilton Branch is $45,480.
What is the Median Family Income in Hamilton Branch?
Median Family Income in Hamilton Branch is $131,250.
What is the Median Household income in Hamilton Branch?
Median Household Income in Hamilton Branch is $93,750.
What is Income or Wage Gap in Hamilton Branch?
Income or Wage Gap in Hamilton Branch is 41.3%.
Women in Hamilton Branch earn 58.7 cents for every dollar earned by a man.
What is Inequality or Gini Index in Hamilton Branch?
Inequality or Gini Index in Hamilton Branch is 0.37.
What is the Total Population of Hamilton Branch?
Total Population of Hamilton Branch is 454.
What is the Total Male Population of Hamilton Branch?
Total Male Population of Hamilton Branch is 236.
What is the Total Female Population of Hamilton Branch?
Total Female Population of Hamilton Branch is 218.
What is the Ratio of Males per 100 Females in Hamilton Branch?
There are 108.26 Males per 100 Females in Hamilton Branch.
What is the Ratio of Females per 100 Males in Hamilton Branch?
There are 92.37 Females per 100 Males in Hamilton Branch.
What is the Median Population Age in Hamilton Branch?
Median Population Age in Hamilton Branch is 60.1 Years.
What is the Average Family Size in Hamilton Branch
Average Family Size in Hamilton Branch is 2.6 People.
What is the Average Household Size in Hamilton Branch
Average Household Size in Hamilton Branch is 2.1 People.
How Large is the Labor Force in Hamilton Branch?
There are 164 People in the Labor Forcein in Hamilton Branch.
What is the Percentage of People in the Labor Force in Hamilton Branch?
40.9% of People are in the Labor Force in Hamilton Branch.