Graeagle, CA Map & Demographics
Graeagle Map
Graeagle Overview
$50,241
PER CAPITA INCOME
$45,000
AVG HOUSEHOLD INCOME
0.58
INEQUALITY / GINI INDEX
401
TOTAL POPULATION
254
MALE POPULATION
147
FEMALE POPULATION
172.79
MALES / 100 FEMALES
57.87
FEMALES / 100 MALES
68.5
MEDIAN AGE
2.6
AVG FAMILY SIZE
2.0
AVG HOUSEHOLD SIZE
90
LABOR FORCE [ PEOPLE ]
24.4%
PERCENT IN LABOR FORCE
Graeagle Area Codes
Income in Graeagle
Income Overview in Graeagle
| Characteristic | Number | Measure |
| Per Capita Income | 401 | $50,241 |
| Median Family Income | 112 | $0 |
| Mean Family Income | 112 | $131,303 |
| Median Household Income | 204 | $45,000 |
| Mean Household Income | 204 | $90,112 |
| Income Deficit | 112 | $0 |
| Wage / Income Gap (%) | 401 | 0.00% |
| Wage / Income Gap ($) | 401 | 100.00¢ per $1 |
| Gini / Inequality Index | 401 | 0.58 |
Earnings by Sex in Graeagle
| Sex | Number | Average Earnings |
| Male | 56 (54.4%) | $0 |
| Female | 47 (45.6%) | $0 |
| Total | 103 (100.0%) | $0 |
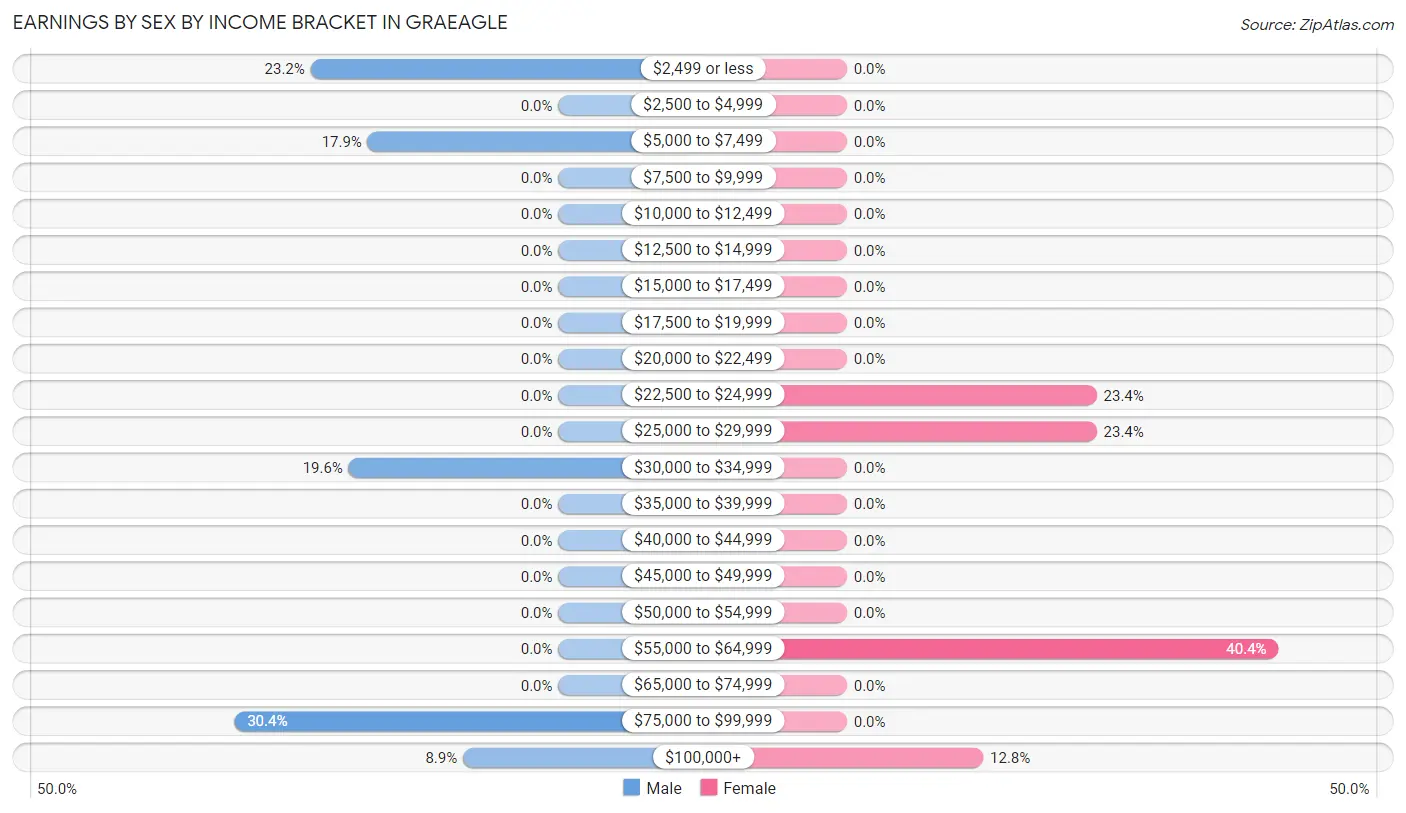
Earnings by Sex by Income Bracket in Graeagle
The most common earnings brackets in Graeagle are $75,000 to $99,999 for men (17 | 30.4%) and $55,000 to $64,999 for women (19 | 40.4%).
| Income | Male | Female |
| $2,499 or less | 13 (23.2%) | 0 (0.0%) |
| $2,500 to $4,999 | 0 (0.0%) | 0 (0.0%) |
| $5,000 to $7,499 | 10 (17.9%) | 0 (0.0%) |
| $7,500 to $9,999 | 0 (0.0%) | 0 (0.0%) |
| $10,000 to $12,499 | 0 (0.0%) | 0 (0.0%) |
| $12,500 to $14,999 | 0 (0.0%) | 0 (0.0%) |
| $15,000 to $17,499 | 0 (0.0%) | 0 (0.0%) |
| $17,500 to $19,999 | 0 (0.0%) | 0 (0.0%) |
| $20,000 to $22,499 | 0 (0.0%) | 0 (0.0%) |
| $22,500 to $24,999 | 0 (0.0%) | 11 (23.4%) |
| $25,000 to $29,999 | 0 (0.0%) | 11 (23.4%) |
| $30,000 to $34,999 | 11 (19.6%) | 0 (0.0%) |
| $35,000 to $39,999 | 0 (0.0%) | 0 (0.0%) |
| $40,000 to $44,999 | 0 (0.0%) | 0 (0.0%) |
| $45,000 to $49,999 | 0 (0.0%) | 0 (0.0%) |
| $50,000 to $54,999 | 0 (0.0%) | 0 (0.0%) |
| $55,000 to $64,999 | 0 (0.0%) | 19 (40.4%) |
| $65,000 to $74,999 | 0 (0.0%) | 0 (0.0%) |
| $75,000 to $99,999 | 17 (30.4%) | 0 (0.0%) |
| $100,000+ | 5 (8.9%) | 6 (12.8%) |
| Total | 56 (100.0%) | 47 (100.0%) |
Earnings by Sex by Educational Attainment in Graeagle
| Educational Attainment | Male Income | Female Income |
| Less than High School | - | - |
| High School Diploma | - | - |
| College or Associate's Degree | - | - |
| Bachelor's Degree | - | - |
| Graduate Degree | - | - |
| Total | - | - |
Family Income in Graeagle
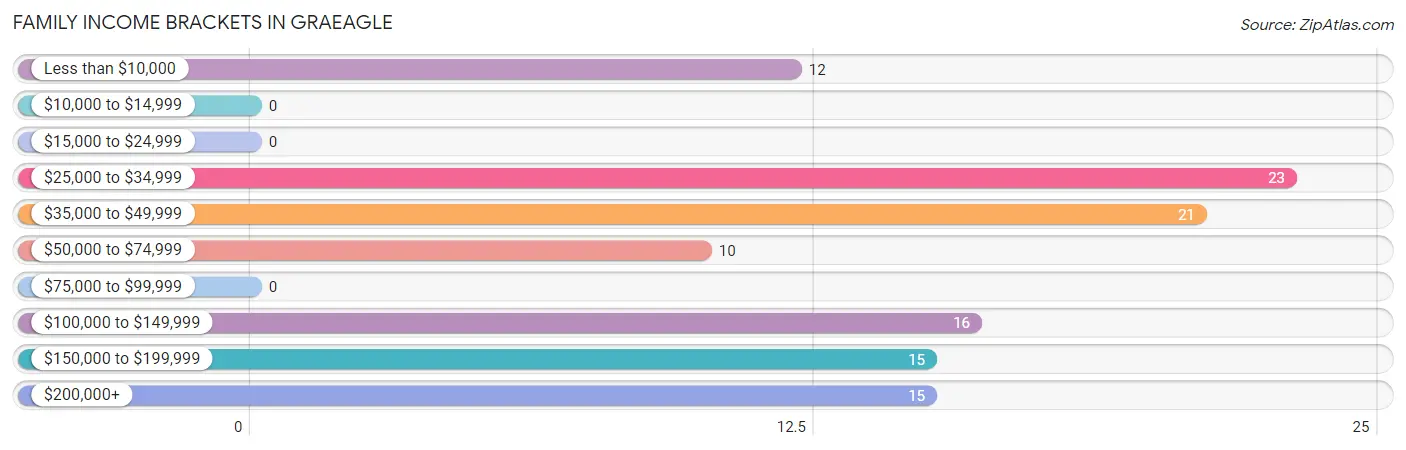
Family Income Brackets in Graeagle
According to the Graeagle family income data, there are 23 families falling into the $25,000 to $34,999 income range, which is the most common income bracket and makes up 20.5% of all families.
| Income Bracket | # Families | % Families |
| Less than $10,000 | 12 | 10.7% |
| $10,000 to $14,999 | 0 | 0.0% |
| $15,000 to $24,999 | 0 | 0.0% |
| $25,000 to $34,999 | 23 | 20.5% |
| $35,000 to $49,999 | 21 | 18.8% |
| $50,000 to $74,999 | 10 | 8.9% |
| $75,000 to $99,999 | 0 | 0.0% |
| $100,000 to $149,999 | 16 | 14.3% |
| $150,000 to $199,999 | 15 | 13.4% |
| $200,000+ | 15 | 13.4% |
Family Income by Famaliy Size in Graeagle
| Income Bracket | # Families | Median Income |
| 2-Person Families | 95 (84.8%) | $0 |
| 3-Person Families | 12 (10.7%) | $0 |
| 4-Person Families | 5 (4.5%) | $0 |
| 5-Person Families | 0 (0.0%) | $0 |
| 6-Person Families | 0 (0.0%) | $0 |
| 7+ Person Families | 0 (0.0%) | $0 |
| Total | 112 (100.0%) | $0 |
Family Income by Number of Earners in Graeagle
| Number of Earners | # Families | Median Income |
| No Earners | 86 (76.8%) | $0 |
| 1 Earner | 10 (8.9%) | $0 |
| 2 Earners | 11 (9.8%) | $0 |
| 3+ Earners | 5 (4.5%) | $0 |
| Total | 112 (100.0%) | $0 |
Household Income in Graeagle
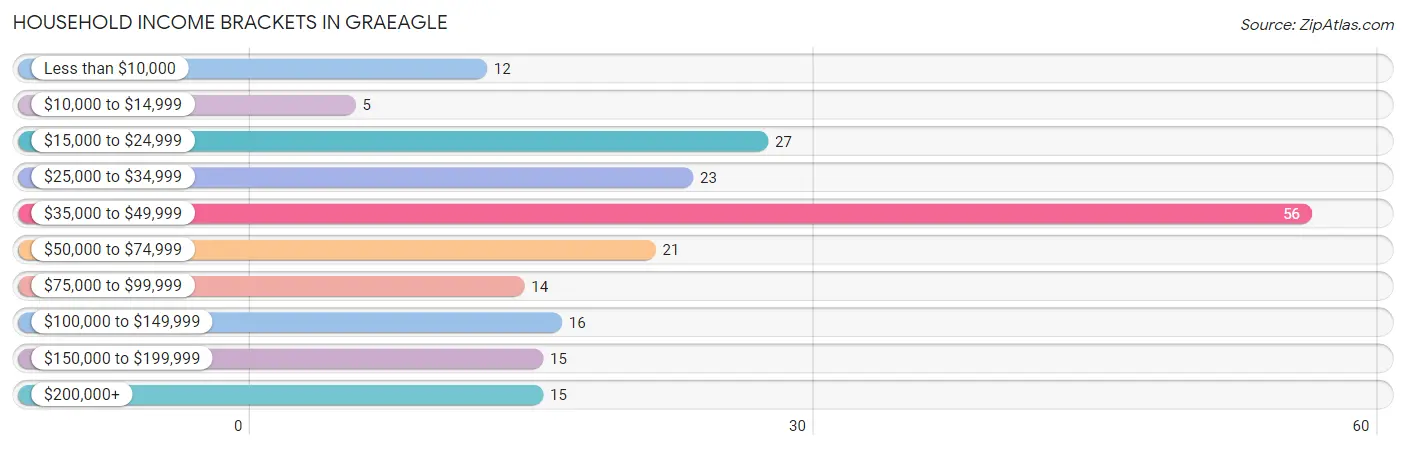
Household Income Brackets in Graeagle
With 56 households falling in the category, the $35,000 to $49,999 income range is the most frequent in Graeagle, accounting for 27.5% of all households. In contrast, only 5 households (2.5%) fall into the $10,000 to $14,999 income bracket, making it the least populous group.
| Income Bracket | # Households | % Households |
| Less than $10,000 | 12 | 5.9% |
| $10,000 to $14,999 | 5 | 2.5% |
| $15,000 to $24,999 | 27 | 13.2% |
| $25,000 to $34,999 | 23 | 11.3% |
| $35,000 to $49,999 | 56 | 27.5% |
| $50,000 to $74,999 | 21 | 10.3% |
| $75,000 to $99,999 | 14 | 6.9% |
| $100,000 to $149,999 | 16 | 7.8% |
| $150,000 to $199,999 | 15 | 7.4% |
| $200,000+ | 15 | 7.4% |
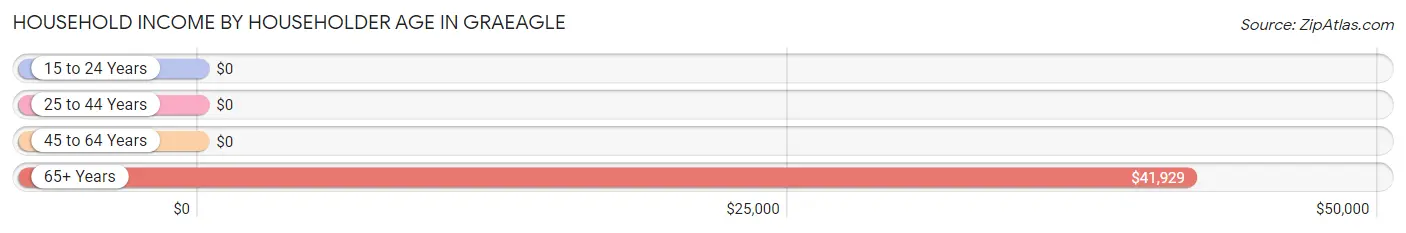
Household Income by Householder Age in Graeagle
The median household income in Graeagle is $45,000, with the highest median household income of $41,929 found in the 65+ years age bracket for the primary householder. A total of 188 households (92.2%) fall into this category.
| Income Bracket | # Households | Median Income |
| 15 to 24 Years | 0 (0.0%) | $0 |
| 25 to 44 Years | 11 (5.4%) | $0 |
| 45 to 64 Years | 5 (2.5%) | $0 |
| 65+ Years | 188 (92.2%) | $41,929 |
| Total | 204 (100.0%) | $45,000 |
Poverty in Graeagle
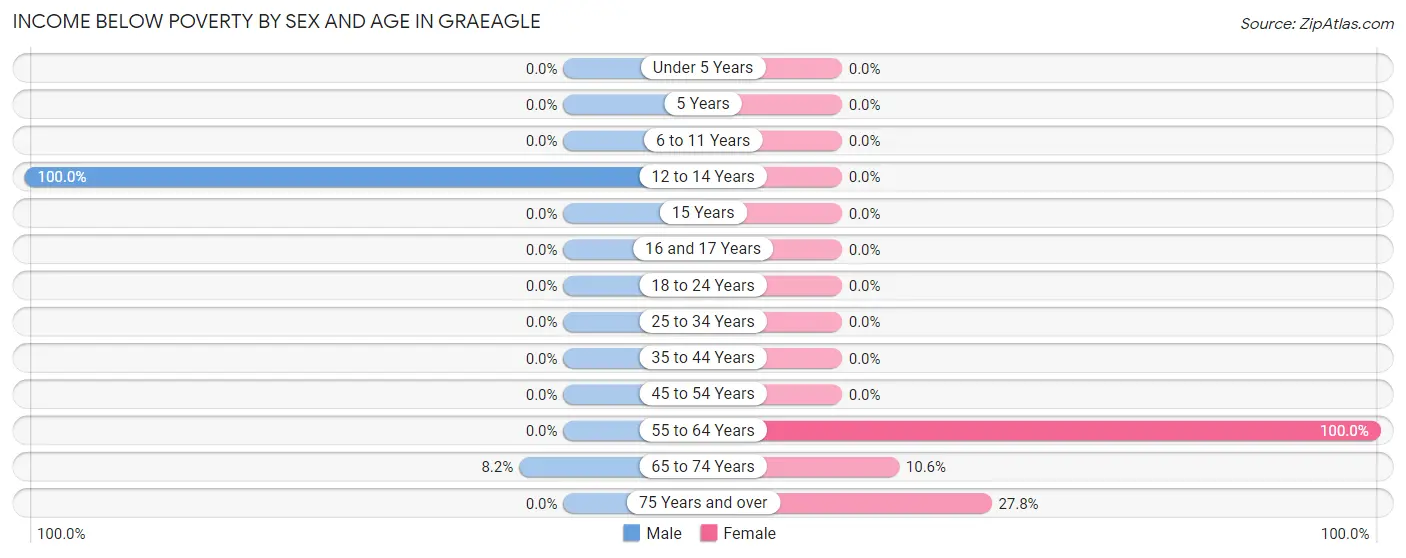
Income Below Poverty by Sex and Age in Graeagle
With 17.3% poverty level for males and 15.0% for females among the residents of Graeagle, 12 to 14 year old males and 55 to 64 year old females are the most vulnerable to poverty, with 32 males (100.0%) and 8 females (100.0%) in their respective age groups living below the poverty level.
| Age Bracket | Male | Female |
| Under 5 Years | 0 (0.0%) | 0 (0.0%) |
| 5 Years | 0 (0.0%) | 0 (0.0%) |
| 6 to 11 Years | 0 (0.0%) | 0 (0.0%) |
| 12 to 14 Years | 32 (100.0%) | 0 (0.0%) |
| 15 Years | 0 (0.0%) | 0 (0.0%) |
| 16 and 17 Years | 0 (0.0%) | 0 (0.0%) |
| 18 to 24 Years | 0 (0.0%) | 0 (0.0%) |
| 25 to 34 Years | 0 (0.0%) | 0 (0.0%) |
| 35 to 44 Years | 0 (0.0%) | 0 (0.0%) |
| 45 to 54 Years | 0 (0.0%) | 0 (0.0%) |
| 55 to 64 Years | 0 (0.0%) | 8 (100.0%) |
| 65 to 74 Years | 12 (8.2%) | 9 (10.6%) |
| 75 Years and over | 0 (0.0%) | 5 (27.8%) |
| Total | 44 (17.3%) | 22 (15.0%) |
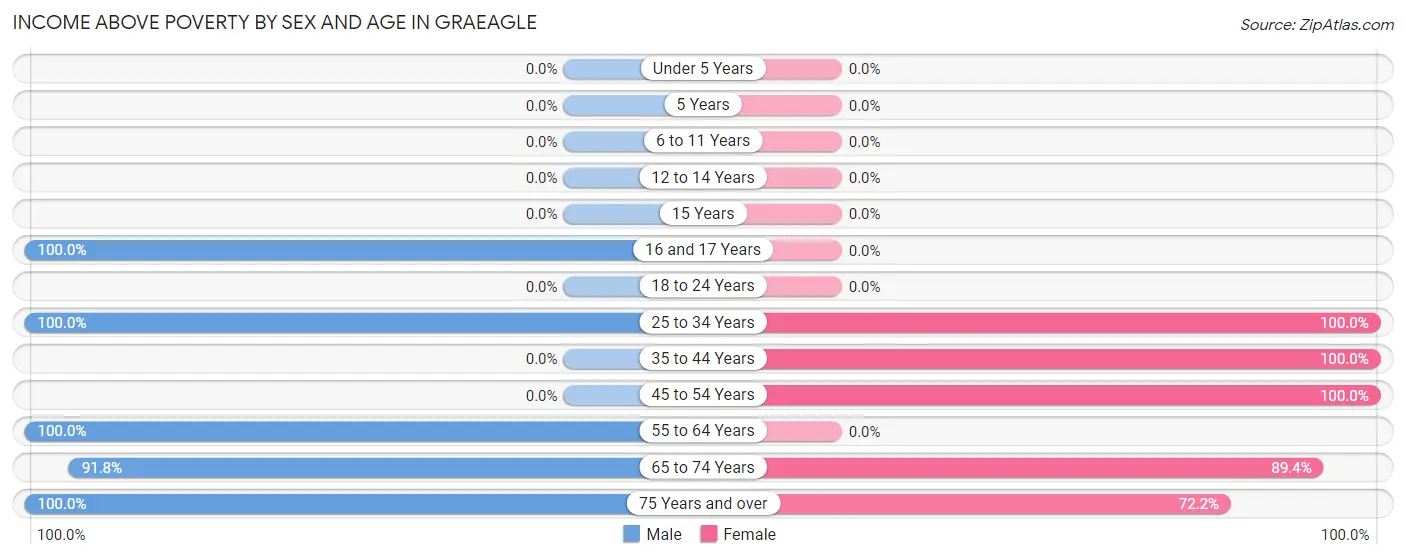
Income Above Poverty by Sex and Age in Graeagle
According to the poverty statistics in Graeagle, males aged 16 and 17 years and females aged 25 to 34 years are the age groups that are most secure financially, with 100.0% of males and 100.0% of females in these age groups living above the poverty line.
| Age Bracket | Male | Female |
| Under 5 Years | 0 (0.0%) | 0 (0.0%) |
| 5 Years | 0 (0.0%) | 0 (0.0%) |
| 6 to 11 Years | 0 (0.0%) | 0 (0.0%) |
| 12 to 14 Years | 0 (0.0%) | 0 (0.0%) |
| 15 Years | 0 (0.0%) | 0 (0.0%) |
| 16 and 17 Years | 13 (100.0%) | 0 (0.0%) |
| 18 to 24 Years | 0 (0.0%) | 0 (0.0%) |
| 25 to 34 Years | 28 (100.0%) | 11 (100.0%) |
| 35 to 44 Years | 0 (0.0%) | 19 (100.0%) |
| 45 to 54 Years | 0 (0.0%) | 6 (100.0%) |
| 55 to 64 Years | 5 (100.0%) | 0 (0.0%) |
| 65 to 74 Years | 134 (91.8%) | 76 (89.4%) |
| 75 Years and over | 30 (100.0%) | 13 (72.2%) |
| Total | 210 (82.7%) | 125 (85.0%) |
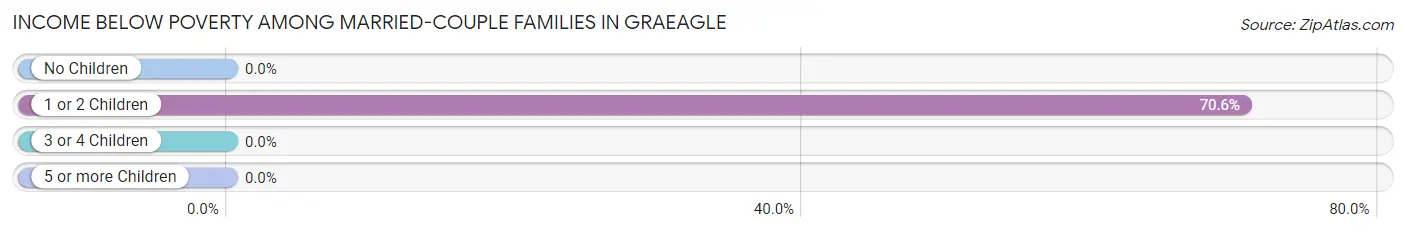
Income Below Poverty Among Married-Couple Families in Graeagle
The poverty statistics for married-couple families in Graeagle show that 11.9% or 12 of the total 101 families live below the poverty line. Families with 1 or 2 children have the highest poverty rate of 70.6%, comprising of 12 families. On the other hand, families with no children have the lowest poverty rate of 0.0%, which includes 0 families.
| Children | Above Poverty | Below Poverty |
| No Children | 84 (100.0%) | 0 (0.0%) |
| 1 or 2 Children | 5 (29.4%) | 12 (70.6%) |
| 3 or 4 Children | 0 (0.0%) | 0 (0.0%) |
| 5 or more Children | 0 (0.0%) | 0 (0.0%) |
| Total | 89 (88.1%) | 12 (11.9%) |
Income Below Poverty Among Single-Parent Households in Graeagle
| Children | Single Father | Single Mother |
| No Children | 0 (0.0%) | 0 (0.0%) |
| 1 or 2 Children | 0 (0.0%) | 0 (0.0%) |
| 3 or 4 Children | 0 (0.0%) | 0 (0.0%) |
| 5 or more Children | 0 (0.0%) | 0 (0.0%) |
| Total | 0 (0.0%) | 0 (0.0%) |
Income Below Poverty Among Married-Couple vs Single-Parent Households in Graeagle
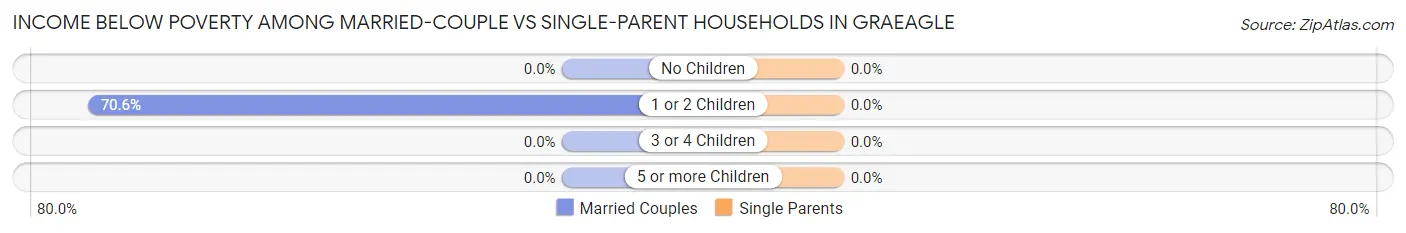
| Children | Married-Couple Families | Single-Parent Households |
| No Children | 0 (0.0%) | 0 (0.0%) |
| 1 or 2 Children | 12 (70.6%) | 0 (0.0%) |
| 3 or 4 Children | 0 (0.0%) | 0 (0.0%) |
| 5 or more Children | 0 (0.0%) | 0 (0.0%) |
| Total | 12 (11.9%) | 0 (0.0%) |
Race in Graeagle
The most populous races in Graeagle are White / Caucasian (393 | 98.0%), Hispanic or Latino (8 | 2.0%), and Some other Race (8 | 2.0%).
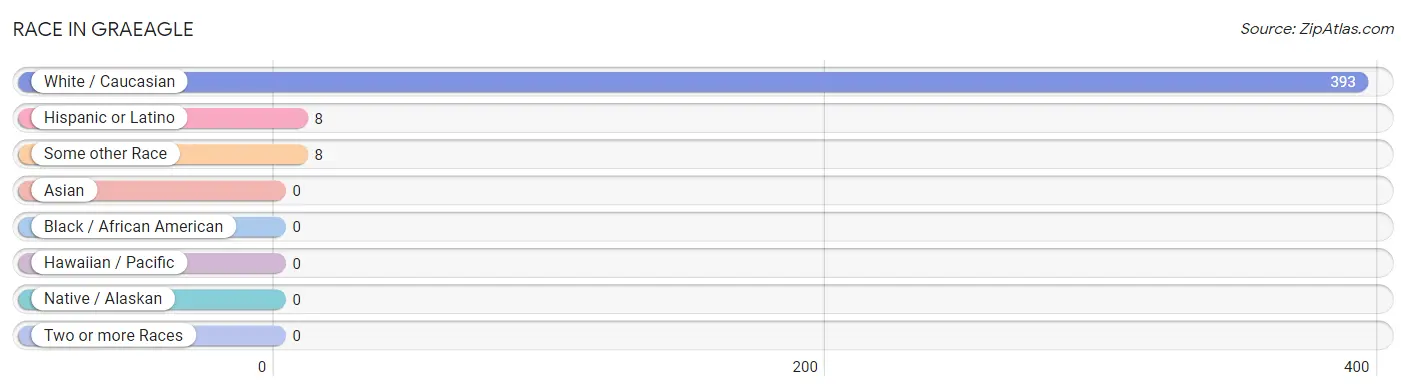
| Race | # Population | % Population |
| Asian | 0 | 0.0% |
| Black / African American | 0 | 0.0% |
| Hawaiian / Pacific | 0 | 0.0% |
| Hispanic or Latino | 8 | 2.0% |
| Native / Alaskan | 0 | 0.0% |
| White / Caucasian | 393 | 98.0% |
| Two or more Races | 0 | 0.0% |
| Some other Race | 8 | 2.0% |
| Total | 401 | 100.0% |
Ancestry in Graeagle
The most populous ancestries reported in Graeagle are English (114 | 28.4%), Irish (42 | 10.5%), German (36 | 9.0%), Scottish (25 | 6.2%), and Russian (22 | 5.5%), together accounting for 59.6% of all Graeagle residents.
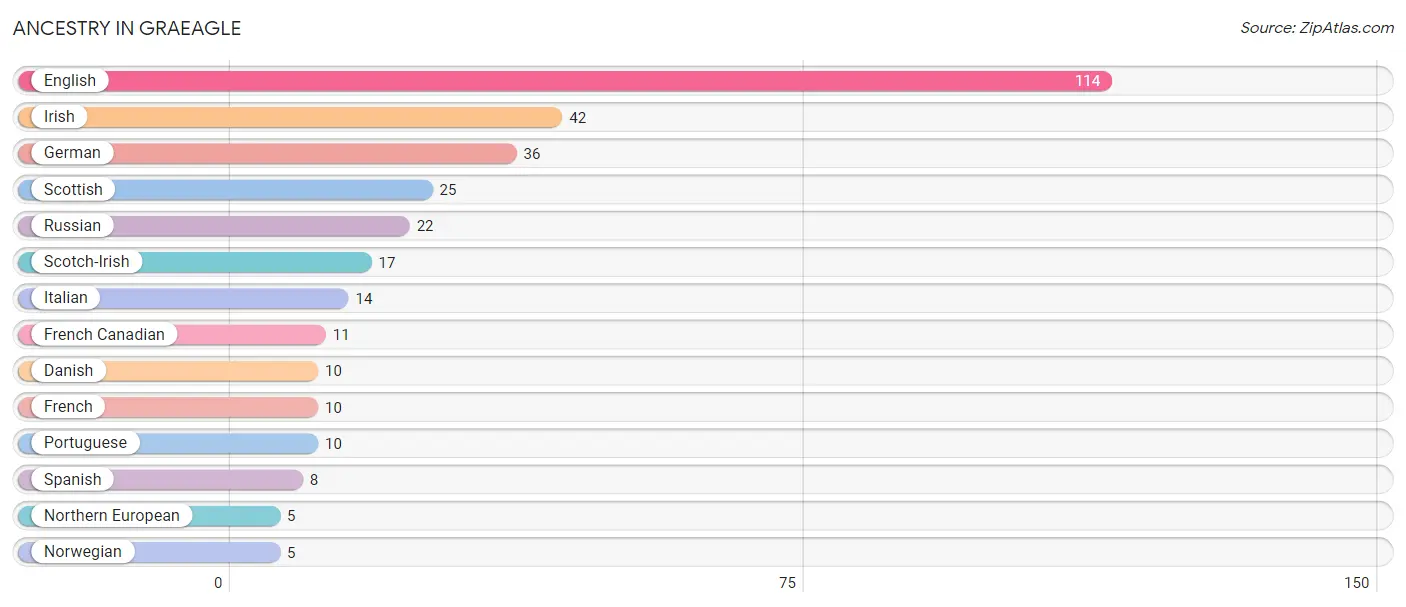
| Ancestry | # Population | % Population |
| Danish | 10 | 2.5% |
| English | 114 | 28.4% |
| French | 10 | 2.5% |
| French Canadian | 11 | 2.7% |
| German | 36 | 9.0% |
| Irish | 42 | 10.5% |
| Italian | 14 | 3.5% |
| Northern European | 5 | 1.3% |
| Norwegian | 5 | 1.3% |
| Portuguese | 10 | 2.5% |
| Russian | 22 | 5.5% |
| Scotch-Irish | 17 | 4.2% |
| Scottish | 25 | 6.2% |
| Spanish | 8 | 2.0% | View All 14 Rows |
Immigrants in Graeagle

| Immigration Origin | # Population | % Population | View All 0 Rows |
Sex and Age in Graeagle
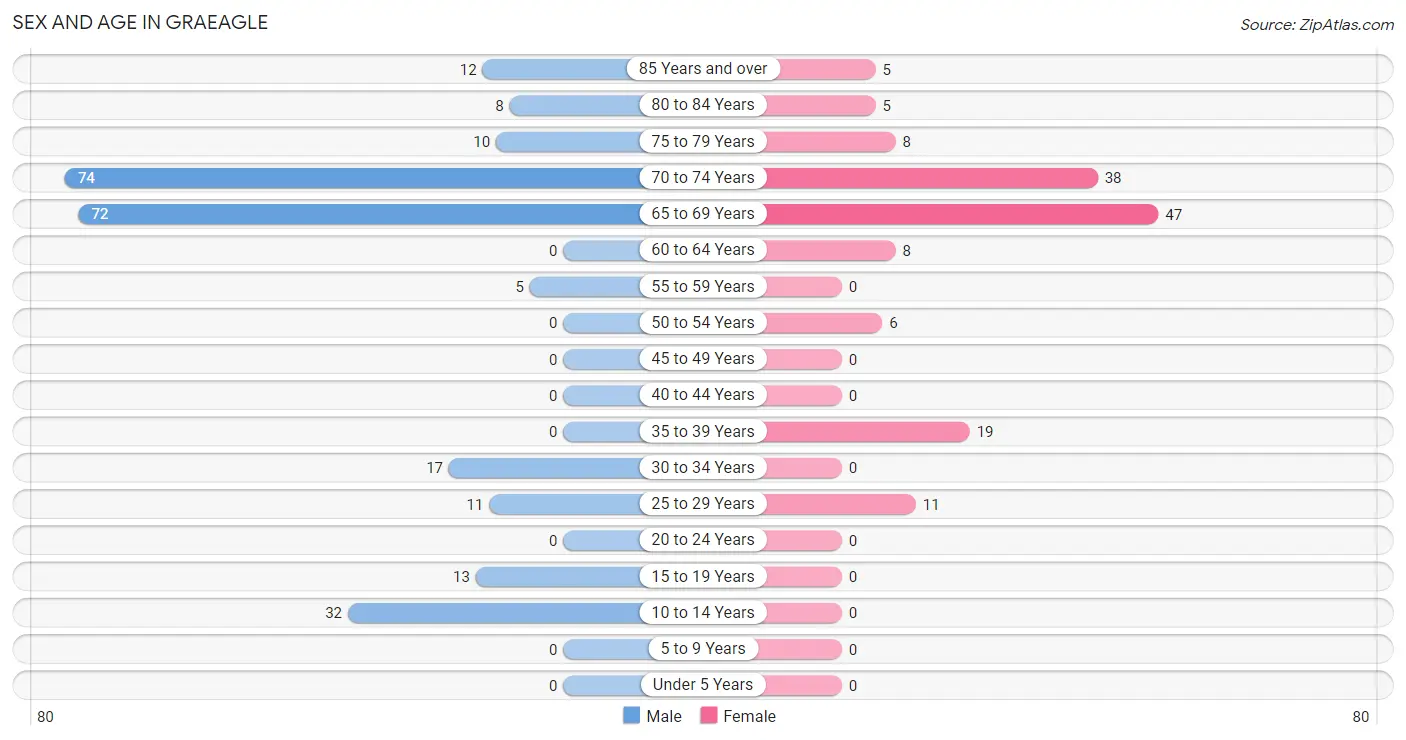
Sex and Age in Graeagle
The most populous age groups in Graeagle are 70 to 74 Years (74 | 29.1%) for men and 65 to 69 Years (47 | 32.0%) for women.
| Age Bracket | Male | Female |
| Under 5 Years | 0 (0.0%) | 0 (0.0%) |
| 5 to 9 Years | 0 (0.0%) | 0 (0.0%) |
| 10 to 14 Years | 32 (12.6%) | 0 (0.0%) |
| 15 to 19 Years | 13 (5.1%) | 0 (0.0%) |
| 20 to 24 Years | 0 (0.0%) | 0 (0.0%) |
| 25 to 29 Years | 11 (4.3%) | 11 (7.5%) |
| 30 to 34 Years | 17 (6.7%) | 0 (0.0%) |
| 35 to 39 Years | 0 (0.0%) | 19 (12.9%) |
| 40 to 44 Years | 0 (0.0%) | 0 (0.0%) |
| 45 to 49 Years | 0 (0.0%) | 0 (0.0%) |
| 50 to 54 Years | 0 (0.0%) | 6 (4.1%) |
| 55 to 59 Years | 5 (2.0%) | 0 (0.0%) |
| 60 to 64 Years | 0 (0.0%) | 8 (5.4%) |
| 65 to 69 Years | 72 (28.3%) | 47 (32.0%) |
| 70 to 74 Years | 74 (29.1%) | 38 (25.9%) |
| 75 to 79 Years | 10 (3.9%) | 8 (5.4%) |
| 80 to 84 Years | 8 (3.2%) | 5 (3.4%) |
| 85 Years and over | 12 (4.7%) | 5 (3.4%) |
| Total | 254 (100.0%) | 147 (100.0%) |
Families and Households in Graeagle
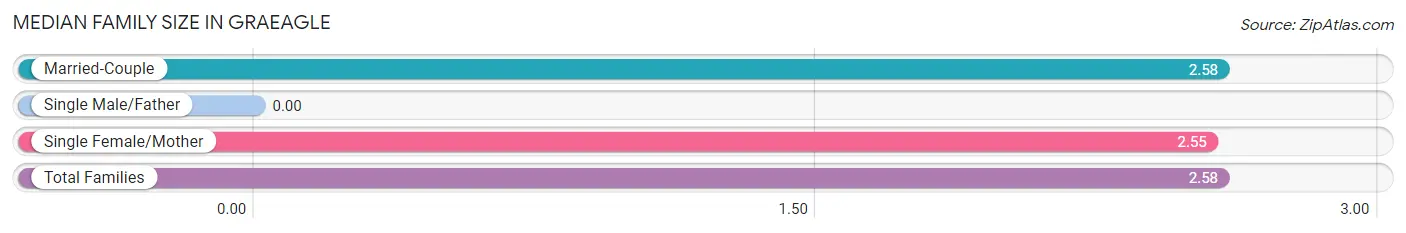
Median Family Size in Graeagle
| Family Type | # Families | Family Size |
| Married-Couple | 101 (90.2%) | 2.58 |
| Single Male/Father | 0 (0.0%) | - |
| Single Female/Mother | 11 (9.8%) | 2.55 |
| Total Families | 112 (100.0%) | 2.58 |
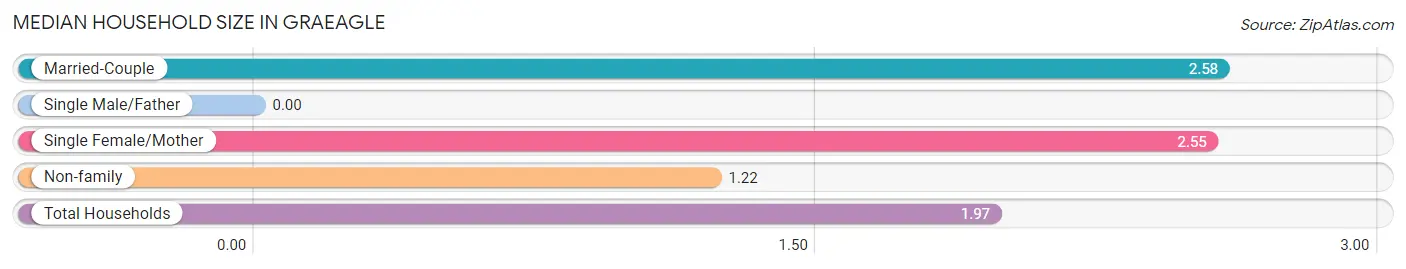
Median Household Size in Graeagle
| Household Type | # Households | Household Size |
| Married-Couple | 101 (49.5%) | 2.58 |
| Single Male/Father | 0 (0.0%) | - |
| Single Female/Mother | 11 (5.4%) | 2.55 |
| Non-family | 92 (45.1%) | 1.22 |
| Total Households | 204 (100.0%) | 1.97 |
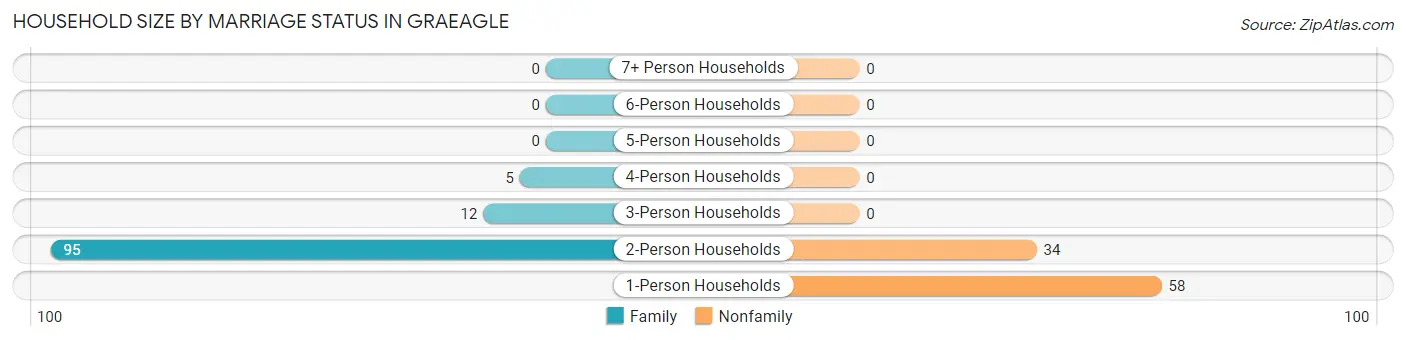
Household Size by Marriage Status in Graeagle
Out of a total of 204 households in Graeagle, 112 (54.9%) are family households, while 92 (45.1%) are nonfamily households. The most numerous type of family households are 2-person households, comprising 95, and the most common type of nonfamily households are 1-person households, comprising 58.
| Household Size | Family Households | Nonfamily Households |
| 1-Person Households | - | 58 (28.4%) |
| 2-Person Households | 95 (46.6%) | 34 (16.7%) |
| 3-Person Households | 12 (5.9%) | 0 (0.0%) |
| 4-Person Households | 5 (2.5%) | 0 (0.0%) |
| 5-Person Households | 0 (0.0%) | 0 (0.0%) |
| 6-Person Households | 0 (0.0%) | 0 (0.0%) |
| 7+ Person Households | 0 (0.0%) | 0 (0.0%) |
| Total | 112 (54.9%) | 92 (45.1%) |
Female Fertility in Graeagle
Fertility by Age in Graeagle
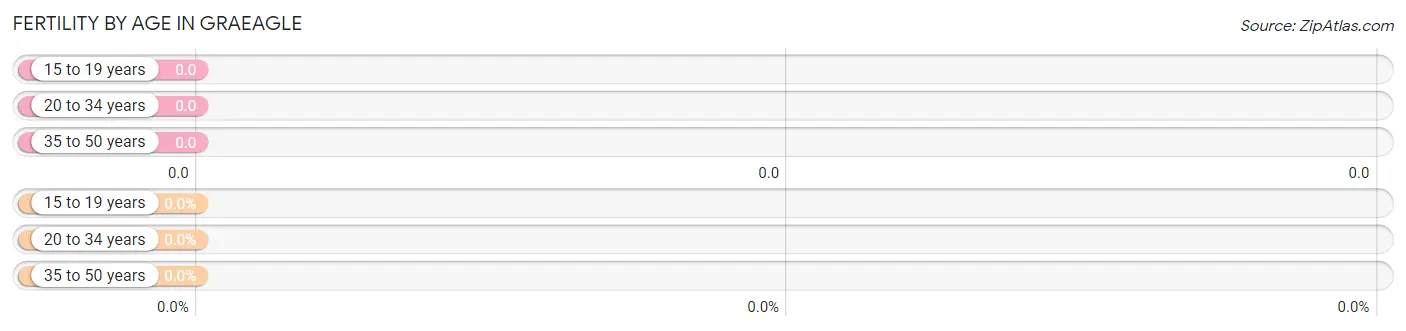
| Age Bracket | Women with Births | Births / 1,000 Women |
| 15 to 19 years | 0 (0.0%) | 0.0 |
| 20 to 34 years | 0 (0.0%) | 0.0 |
| 35 to 50 years | 0 (0.0%) | 0.0 |
| Total | 0 (0.0%) | 0.0 |
Fertility by Age by Marriage Status in Graeagle
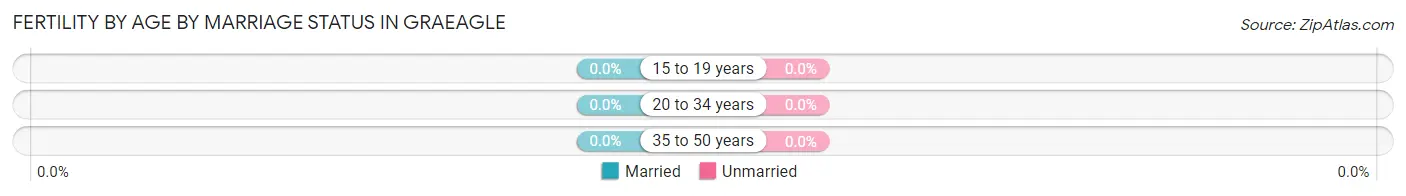
| Age Bracket | Married | Unmarried |
| 15 to 19 years | 0 (0.0%) | 0 (0.0%) |
| 20 to 34 years | 0 (0.0%) | 0 (0.0%) |
| 35 to 50 years | 0 (0.0%) | 0 (0.0%) |
| Total | 0 (0.0%) | 0 (0.0%) |
Fertility by Education in Graeagle
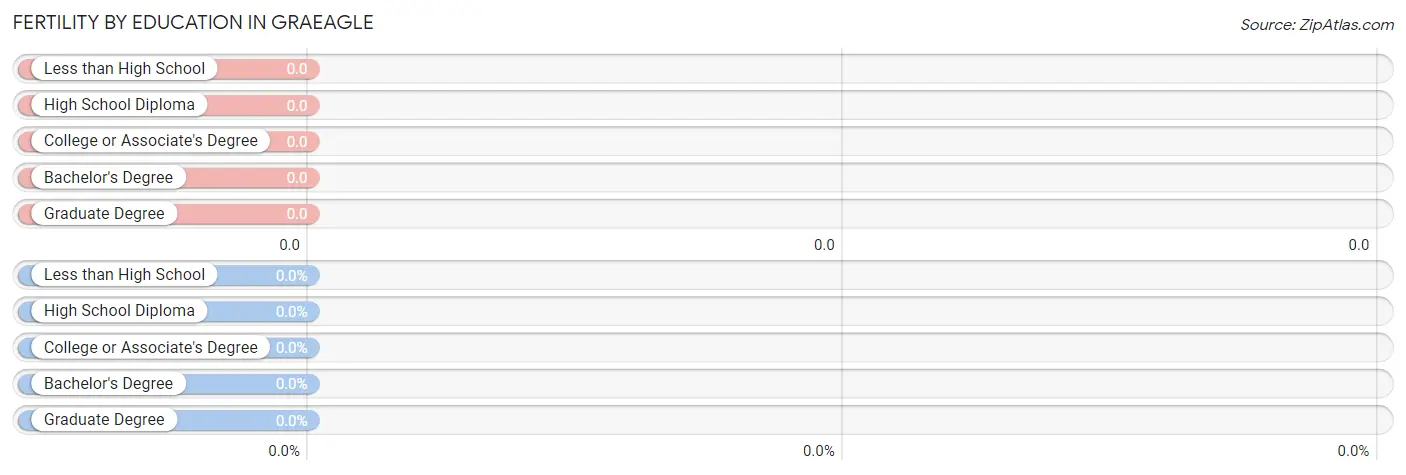
| Educational Attainment | Women with Births | Births / 1,000 Women |
| Less than High School | 0 (0.0%) | 0.0 |
| High School Diploma | 0 (0.0%) | 0.0 |
| College or Associate's Degree | 0 (0.0%) | 0.0 |
| Bachelor's Degree | 0 (0.0%) | 0.0 |
| Graduate Degree | 0 (0.0%) | 0.0 |
| Total | 0 (0.0%) | 0.0 |
Fertility by Education by Marriage Status in Graeagle
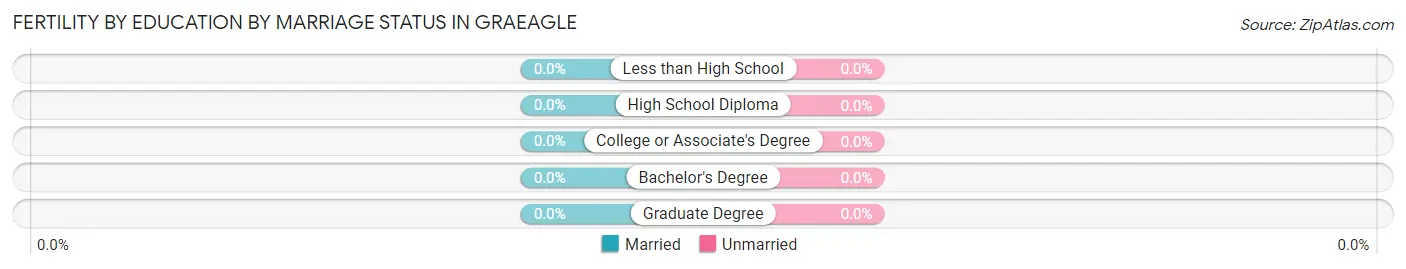
| Educational Attainment | Married | Unmarried |
| Less than High School | 0 (0.0%) | 0 (0.0%) |
| High School Diploma | 0 (0.0%) | 0 (0.0%) |
| College or Associate's Degree | 0 (0.0%) | 0 (0.0%) |
| Bachelor's Degree | 0 (0.0%) | 0 (0.0%) |
| Graduate Degree | 0 (0.0%) | 0 (0.0%) |
| Total | 0 (0.0%) | 0 (0.0%) |
Employment Characteristics in Graeagle
Employment by Class of Employer in Graeagle
Among the 73 employed individuals in Graeagle, federal government employees (51 | 69.9%), and private company employees (22 | 30.1%) make up the most common classes of employment.
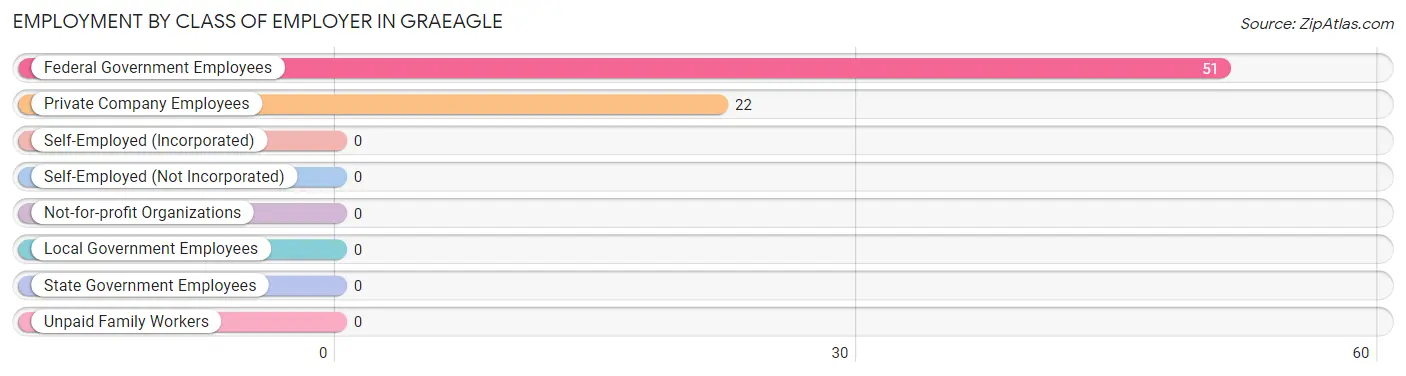
| Employer Class | # Employees | % Employees |
| Private Company Employees | 22 | 30.1% |
| Self-Employed (Incorporated) | 0 | 0.0% |
| Self-Employed (Not Incorporated) | 0 | 0.0% |
| Not-for-profit Organizations | 0 | 0.0% |
| Local Government Employees | 0 | 0.0% |
| State Government Employees | 0 | 0.0% |
| Federal Government Employees | 51 | 69.9% |
| Unpaid Family Workers | 0 | 0.0% |
| Total | 73 | 100.0% |
Employment Status by Age in Graeagle
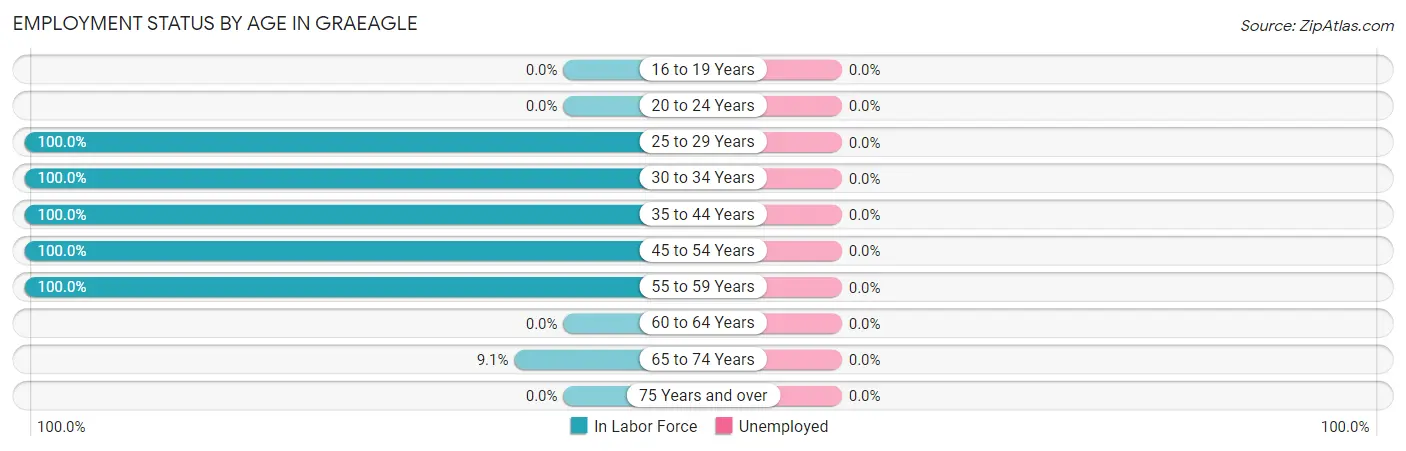
| Age Bracket | In Labor Force | Unemployed |
| 16 to 19 Years | 0 (0.0%) | 0 (0.0%) |
| 20 to 24 Years | 0 (0.0%) | 0 (0.0%) |
| 25 to 29 Years | 22 (100.0%) | 0 (0.0%) |
| 30 to 34 Years | 17 (100.0%) | 0 (0.0%) |
| 35 to 44 Years | 19 (100.0%) | 0 (0.0%) |
| 45 to 54 Years | 6 (100.0%) | 0 (0.0%) |
| 55 to 59 Years | 5 (100.0%) | 0 (0.0%) |
| 60 to 64 Years | 0 (0.0%) | 0 (0.0%) |
| 65 to 74 Years | 21 (9.1%) | 0 (0.0%) |
| 75 Years and over | 0 (0.0%) | 0 (0.0%) |
| Total | 90 (24.4%) | 0 (0.0%) |
Employment Status by Educational Attainment in Graeagle
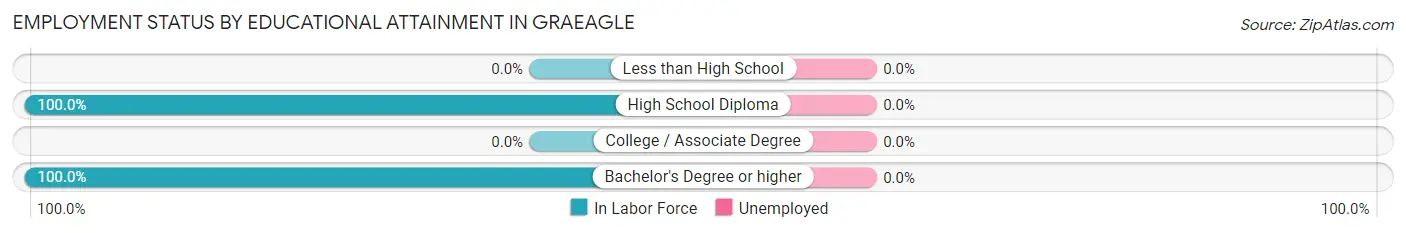
| Educational Attainment | In Labor Force | Unemployed |
| Less than High School | 0 (0.0%) | 0 (0.0%) |
| High School Diploma | 17 (100.0%) | 0 (0.0%) |
| College / Associate Degree | 0 (0.0%) | 0 (0.0%) |
| Bachelor's Degree or higher | 52 (100.0%) | 0 (0.0%) |
| Total | 69 (89.6%) | 0 (0.0%) |
Employment Occupations by Sex in Graeagle
Management, Business, Science and Arts Occupations
The most common Management, Business, Science and Arts occupations in Graeagle are Management (22 | 24.4%), Computers, Engineering & Science (11 | 12.2%), Life, Physical & Social Science (11 | 12.2%), and Business & Financial (6 | 6.7%).
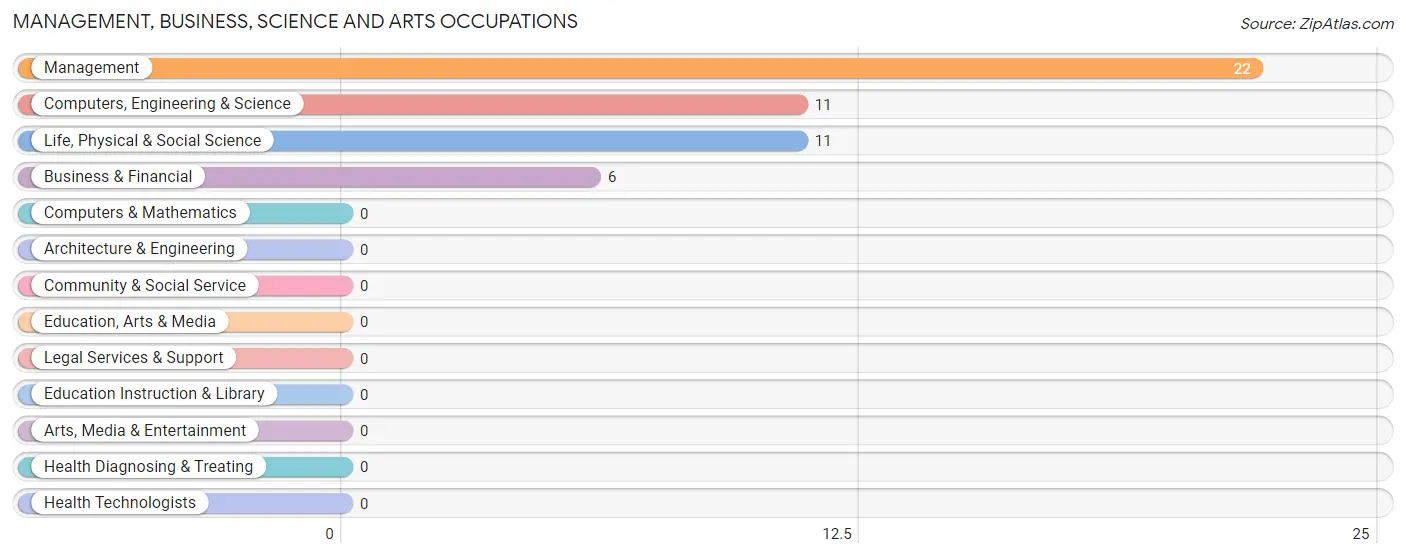
Management, Business, Science and Arts Occupations by Sex
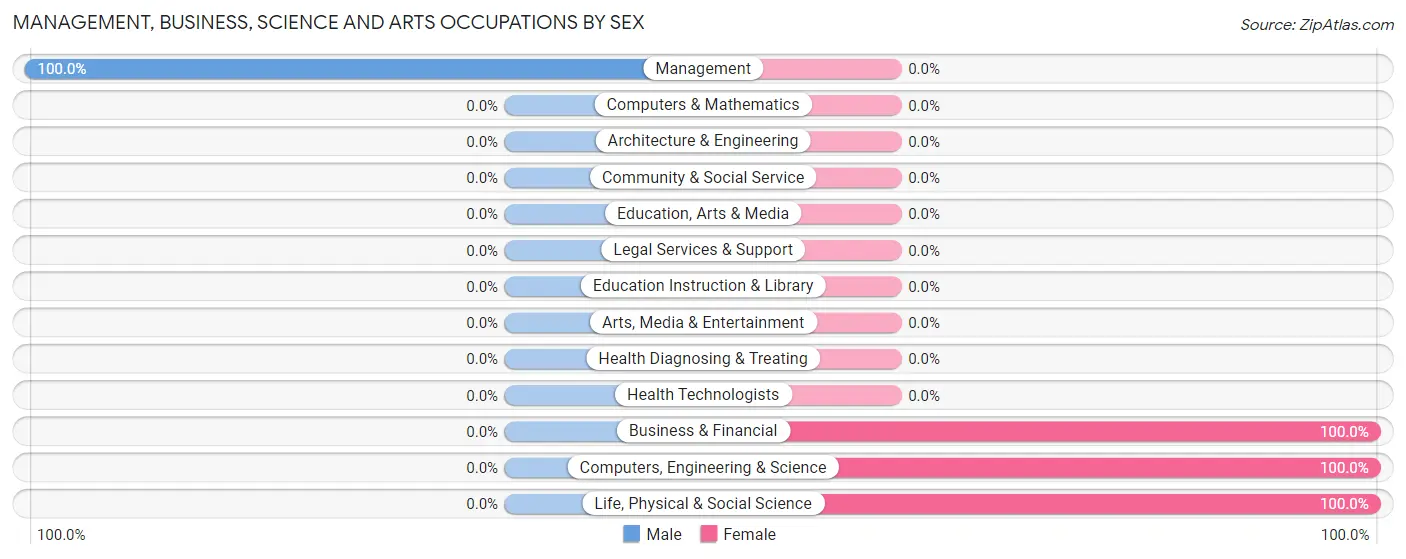
| Occupation | Male | Female |
| Management | 22 (100.0%) | 0 (0.0%) |
| Business & Financial | 0 (0.0%) | 6 (100.0%) |
| Computers, Engineering & Science | 0 (0.0%) | 11 (100.0%) |
| Computers & Mathematics | 0 (0.0%) | 0 (0.0%) |
| Architecture & Engineering | 0 (0.0%) | 0 (0.0%) |
| Life, Physical & Social Science | 0 (0.0%) | 11 (100.0%) |
| Community & Social Service | 0 (0.0%) | 0 (0.0%) |
| Education, Arts & Media | 0 (0.0%) | 0 (0.0%) |
| Legal Services & Support | 0 (0.0%) | 0 (0.0%) |
| Education Instruction & Library | 0 (0.0%) | 0 (0.0%) |
| Arts, Media & Entertainment | 0 (0.0%) | 0 (0.0%) |
| Health Diagnosing & Treating | 0 (0.0%) | 0 (0.0%) |
| Health Technologists | 0 (0.0%) | 0 (0.0%) |
| Total (Category) | 22 (56.4%) | 17 (43.6%) |
| Total (Overall) | 43 (47.8%) | 47 (52.2%) |
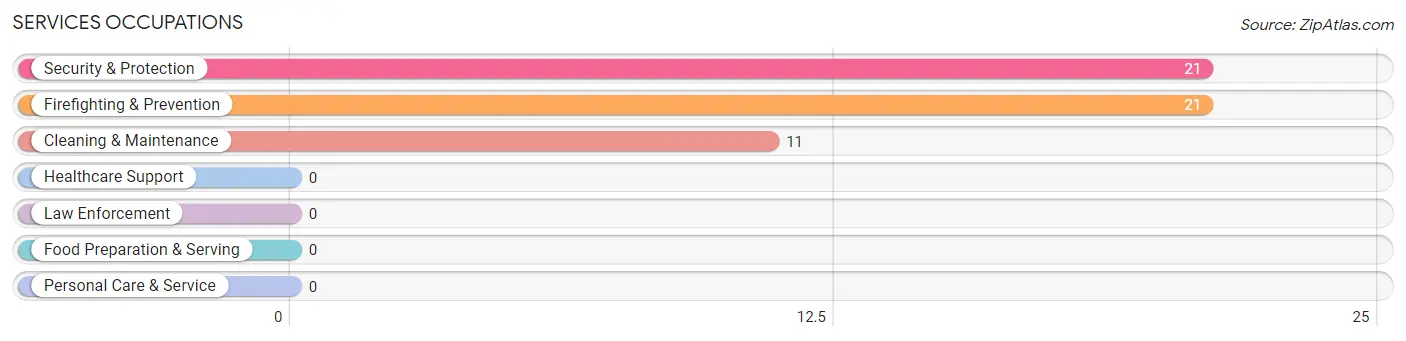
Services Occupations
The most common Services occupations in Graeagle are Security & Protection (21 | 23.3%), Firefighting & Prevention (21 | 23.3%), and Cleaning & Maintenance (11 | 12.2%).
Services Occupations by Sex
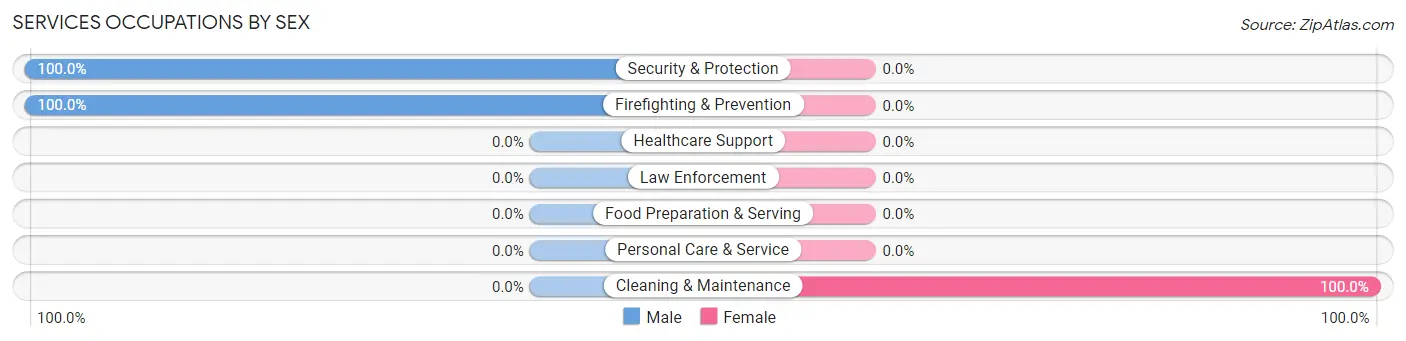
| Occupation | Male | Female |
| Healthcare Support | 0 (0.0%) | 0 (0.0%) |
| Security & Protection | 21 (100.0%) | 0 (0.0%) |
| Firefighting & Prevention | 21 (100.0%) | 0 (0.0%) |
| Law Enforcement | 0 (0.0%) | 0 (0.0%) |
| Food Preparation & Serving | 0 (0.0%) | 0 (0.0%) |
| Cleaning & Maintenance | 0 (0.0%) | 11 (100.0%) |
| Personal Care & Service | 0 (0.0%) | 0 (0.0%) |
| Total (Category) | 21 (65.6%) | 11 (34.4%) |
| Total (Overall) | 43 (47.8%) | 47 (52.2%) |
Sales and Office Occupations
The most common Sales and Office occupations in Graeagle are , and Office & Administration (19 | 21.1%).
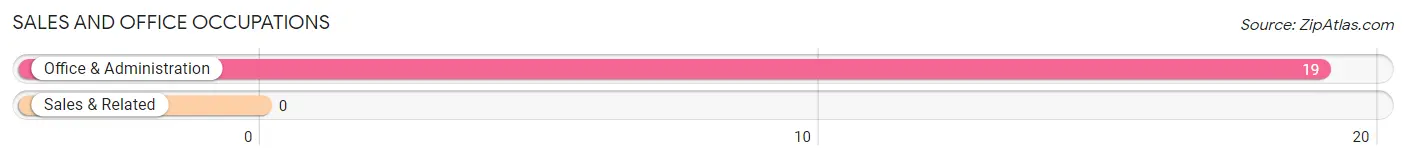
Sales and Office Occupations by Sex
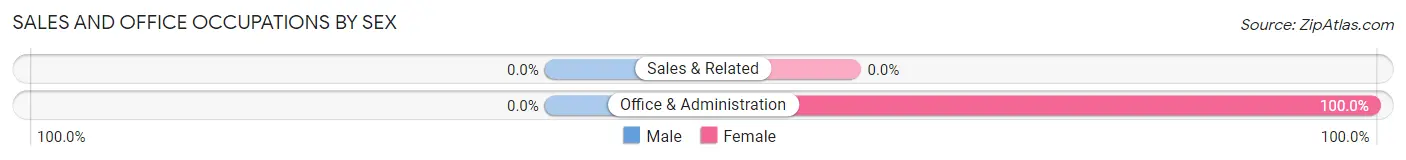
| Occupation | Male | Female |
| Sales & Related | 0 (0.0%) | 0 (0.0%) |
| Office & Administration | 0 (0.0%) | 19 (100.0%) |
| Total (Category) | 0 (0.0%) | 19 (100.0%) |
| Total (Overall) | 43 (47.8%) | 47 (52.2%) |
Natural Resources, Construction and Maintenance Occupations
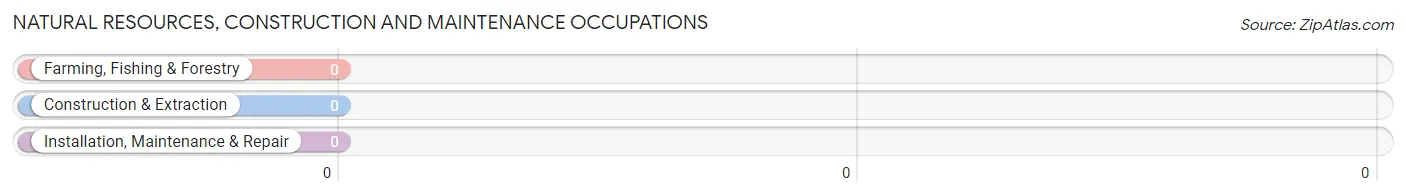
Natural Resources, Construction and Maintenance Occupations by Sex
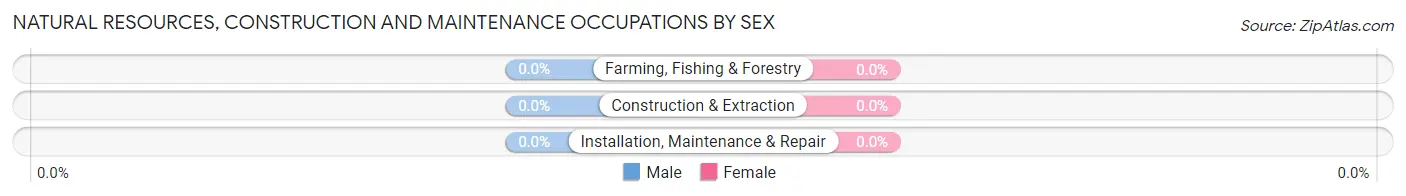
| Occupation | Male | Female |
| Farming, Fishing & Forestry | 0 (0.0%) | 0 (0.0%) |
| Construction & Extraction | 0 (0.0%) | 0 (0.0%) |
| Installation, Maintenance & Repair | 0 (0.0%) | 0 (0.0%) |
| Total (Category) | 0 (0.0%) | 0 (0.0%) |
| Total (Overall) | 43 (47.8%) | 47 (52.2%) |
Production, Transportation and Moving Occupations
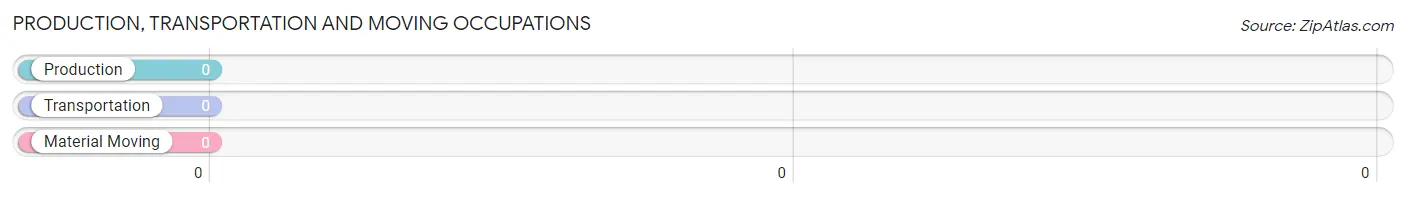
Production, Transportation and Moving Occupations by Sex
| Occupation | Male | Female |
| Production | 0 (0.0%) | 0 (0.0%) |
| Transportation | 0 (0.0%) | 0 (0.0%) |
| Material Moving | 0 (0.0%) | 0 (0.0%) |
| Total (Category) | 0 (0.0%) | 0 (0.0%) |
| Total (Overall) | 43 (47.8%) | 47 (52.2%) |
Employment Industries by Sex in Graeagle
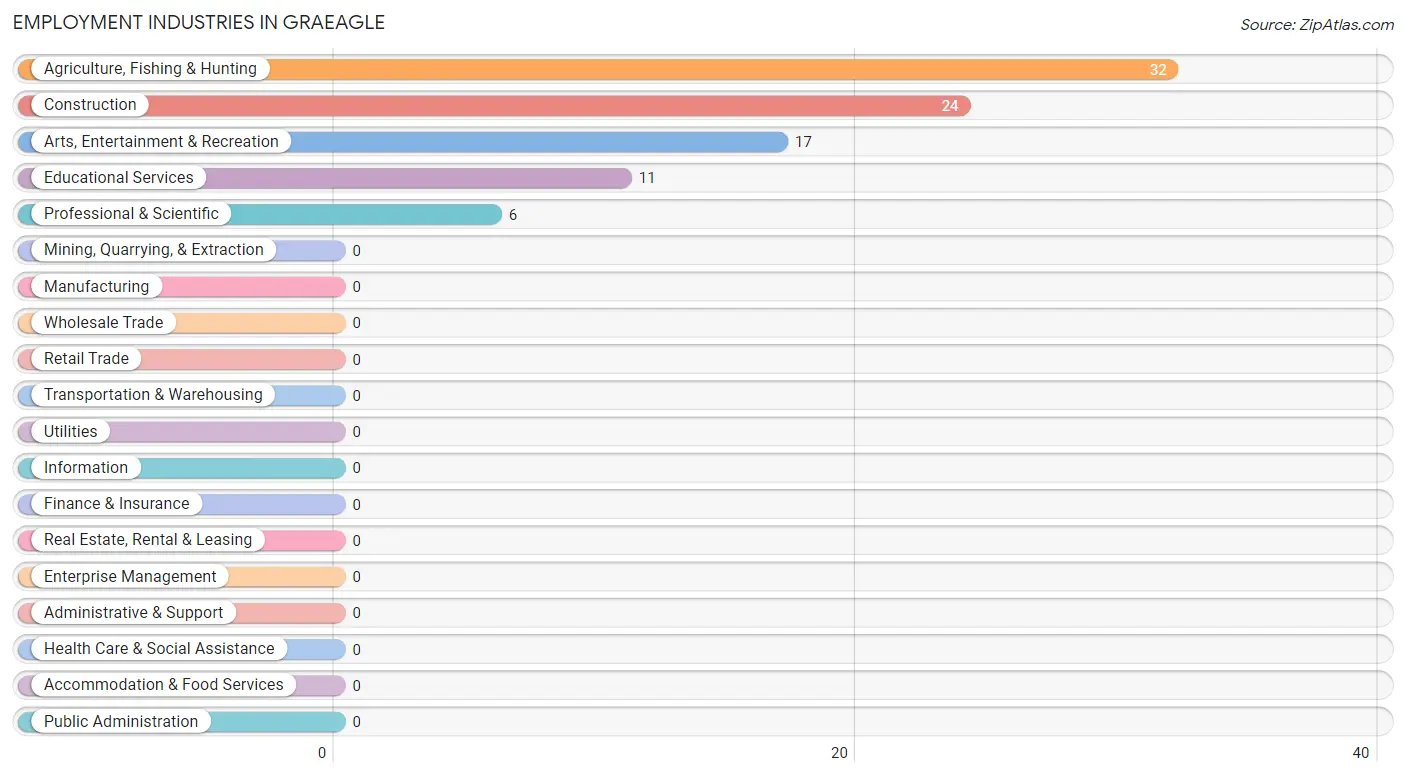
Employment Industries in Graeagle
The major employment industries in Graeagle include Agriculture, Fishing & Hunting (32 | 35.6%), Construction (24 | 26.7%), Arts, Entertainment & Recreation (17 | 18.9%), Educational Services (11 | 12.2%), and Professional & Scientific (6 | 6.7%).
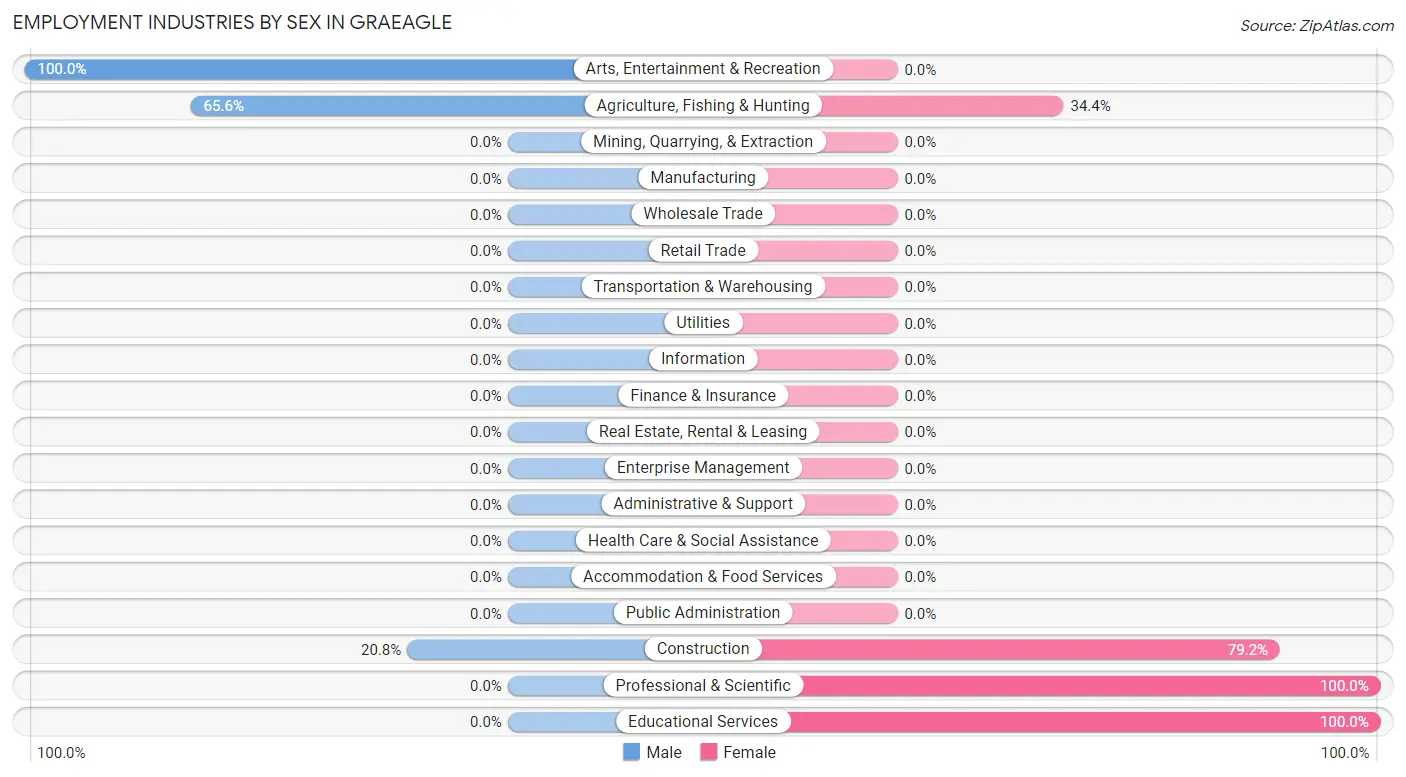
Employment Industries by Sex in Graeagle
The Graeagle industries that see more men than women are Arts, Entertainment & Recreation (100.0%), Agriculture, Fishing & Hunting (65.6%), and Construction (20.8%), whereas the industries that tend to have a higher number of women are Professional & Scientific (100.0%), Educational Services (100.0%), and Construction (79.2%).
| Industry | Male | Female |
| Agriculture, Fishing & Hunting | 21 (65.6%) | 11 (34.4%) |
| Mining, Quarrying, & Extraction | 0 (0.0%) | 0 (0.0%) |
| Construction | 5 (20.8%) | 19 (79.2%) |
| Manufacturing | 0 (0.0%) | 0 (0.0%) |
| Wholesale Trade | 0 (0.0%) | 0 (0.0%) |
| Retail Trade | 0 (0.0%) | 0 (0.0%) |
| Transportation & Warehousing | 0 (0.0%) | 0 (0.0%) |
| Utilities | 0 (0.0%) | 0 (0.0%) |
| Information | 0 (0.0%) | 0 (0.0%) |
| Finance & Insurance | 0 (0.0%) | 0 (0.0%) |
| Real Estate, Rental & Leasing | 0 (0.0%) | 0 (0.0%) |
| Professional & Scientific | 0 (0.0%) | 6 (100.0%) |
| Enterprise Management | 0 (0.0%) | 0 (0.0%) |
| Administrative & Support | 0 (0.0%) | 0 (0.0%) |
| Educational Services | 0 (0.0%) | 11 (100.0%) |
| Health Care & Social Assistance | 0 (0.0%) | 0 (0.0%) |
| Arts, Entertainment & Recreation | 17 (100.0%) | 0 (0.0%) |
| Accommodation & Food Services | 0 (0.0%) | 0 (0.0%) |
| Public Administration | 0 (0.0%) | 0 (0.0%) |
| Total | 43 (47.8%) | 47 (52.2%) |
Education in Graeagle
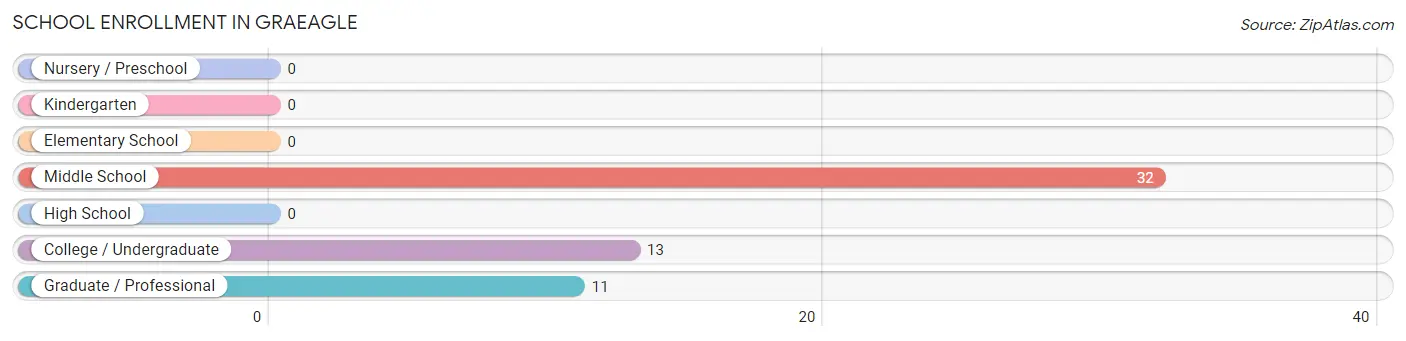
School Enrollment in Graeagle
The most common levels of schooling among the 56 students in Graeagle are middle school (32 | 57.1%), college / undergraduate (13 | 23.2%), and graduate / professional (11 | 19.6%).
| School Level | # Students | % Students |
| Nursery / Preschool | 0 | 0.0% |
| Kindergarten | 0 | 0.0% |
| Elementary School | 0 | 0.0% |
| Middle School | 32 | 57.1% |
| High School | 0 | 0.0% |
| College / Undergraduate | 13 | 23.2% |
| Graduate / Professional | 11 | 19.6% |
| Total | 56 | 100.0% |
School Enrollment by Age by Funding Source in Graeagle
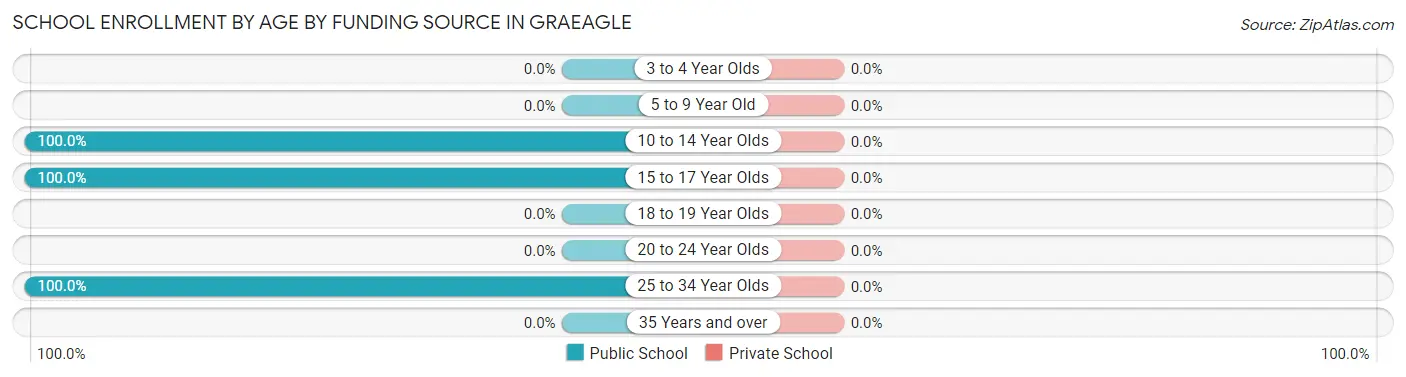
| Age Bracket | Public School | Private School |
| 3 to 4 Year Olds | 0 (0.0%) | 0 (0.0%) |
| 5 to 9 Year Old | 0 (0.0%) | 0 (0.0%) |
| 10 to 14 Year Olds | 32 (100.0%) | 0 (0.0%) |
| 15 to 17 Year Olds | 13 (100.0%) | 0 (0.0%) |
| 18 to 19 Year Olds | 0 (0.0%) | 0 (0.0%) |
| 20 to 24 Year Olds | 0 (0.0%) | 0 (0.0%) |
| 25 to 34 Year Olds | 11 (100.0%) | 0 (0.0%) |
| 35 Years and over | 0 (0.0%) | 0 (0.0%) |
| Total | 56 (100.0%) | 0 (0.0%) |
Educational Attainment by Field of Study in Graeagle
Bio, nature & agricultural (45 | 39.5%), arts & humanities (34 | 29.8%), science & technology (19 | 16.7%), engineering (10 | 8.8%), and communications (6 | 5.3%) are the most common fields of study among 114 individuals in Graeagle who have obtained a bachelor's degree or higher.
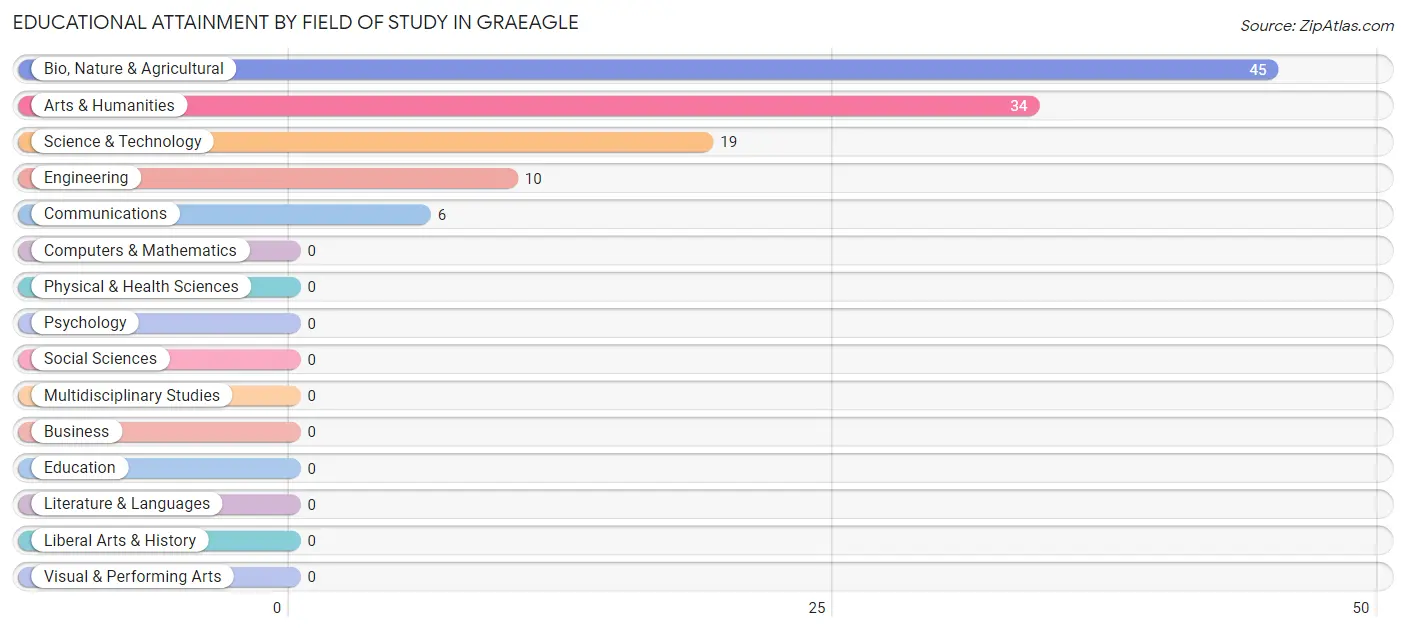
| Field of Study | # Graduates | % Graduates |
| Computers & Mathematics | 0 | 0.0% |
| Bio, Nature & Agricultural | 45 | 39.5% |
| Physical & Health Sciences | 0 | 0.0% |
| Psychology | 0 | 0.0% |
| Social Sciences | 0 | 0.0% |
| Engineering | 10 | 8.8% |
| Multidisciplinary Studies | 0 | 0.0% |
| Science & Technology | 19 | 16.7% |
| Business | 0 | 0.0% |
| Education | 0 | 0.0% |
| Literature & Languages | 0 | 0.0% |
| Liberal Arts & History | 0 | 0.0% |
| Visual & Performing Arts | 0 | 0.0% |
| Communications | 6 | 5.3% |
| Arts & Humanities | 34 | 29.8% |
| Total | 114 | 100.0% |
Transportation & Commute in Graeagle
Vehicle Availability by Sex in Graeagle
The most prevalent vehicle ownership categories in Graeagle are males with 2 vehicles (33, accounting for 76.7%) and females with 2 vehicles (30, making up 110.0%).
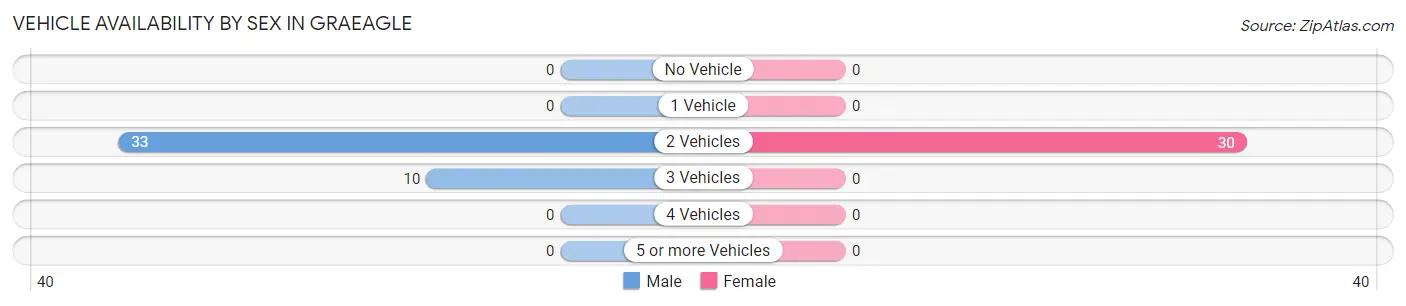
| Vehicles Available | Male | Female |
| No Vehicle | 0 (0.0%) | 0 (0.0%) |
| 1 Vehicle | 0 (0.0%) | 0 (0.0%) |
| 2 Vehicles | 33 (76.7%) | 30 (100.0%) |
| 3 Vehicles | 10 (23.3%) | 0 (0.0%) |
| 4 Vehicles | 0 (0.0%) | 0 (0.0%) |
| 5 or more Vehicles | 0 (0.0%) | 0 (0.0%) |
| Total | 43 (100.0%) | 30 (100.0%) |
Commute Time in Graeagle
The most frequently occuring commute durations in Graeagle are 60 to 89 minutes (27 commuters, 39.7%), 15 to 19 minutes (19 commuters, 27.9%), and 5 to 9 minutes (11 commuters, 16.2%).
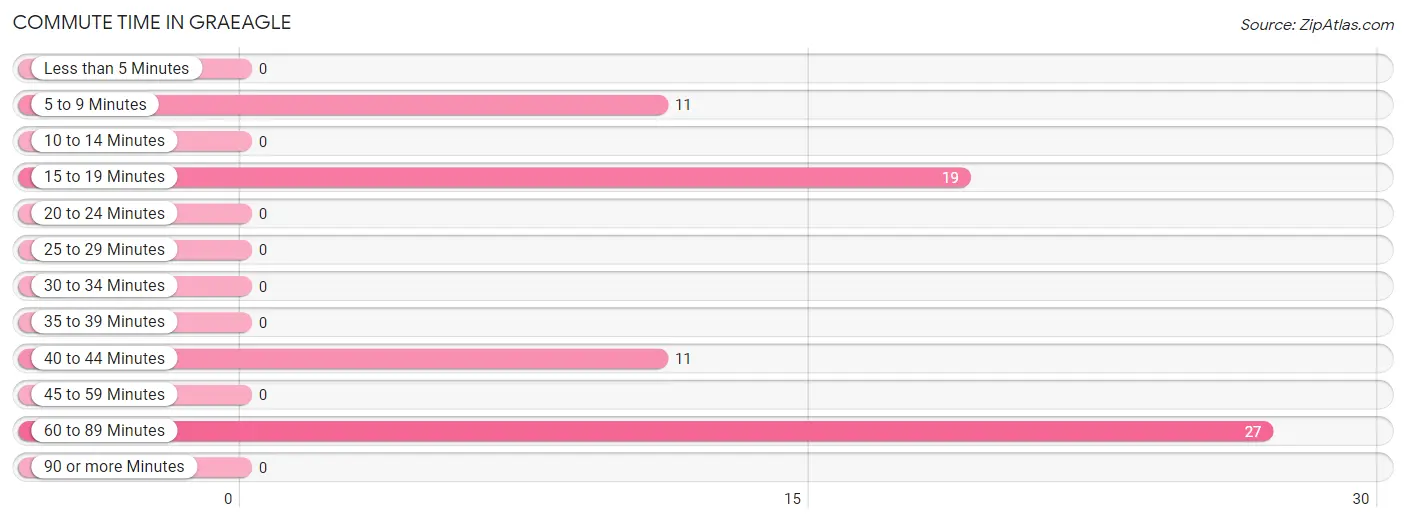
| Commute Time | # Commuters | % Commuters |
| Less than 5 Minutes | 0 | 0.0% |
| 5 to 9 Minutes | 11 | 16.2% |
| 10 to 14 Minutes | 0 | 0.0% |
| 15 to 19 Minutes | 19 | 27.9% |
| 20 to 24 Minutes | 0 | 0.0% |
| 25 to 29 Minutes | 0 | 0.0% |
| 30 to 34 Minutes | 0 | 0.0% |
| 35 to 39 Minutes | 0 | 0.0% |
| 40 to 44 Minutes | 11 | 16.2% |
| 45 to 59 Minutes | 0 | 0.0% |
| 60 to 89 Minutes | 27 | 39.7% |
| 90 or more Minutes | 0 | 0.0% |
Commute Time by Sex in Graeagle
The most common commute times in Graeagle are 60 to 89 minutes (27 commuters, 71.1%) for males and 15 to 19 minutes (19 commuters, 63.3%) for females.
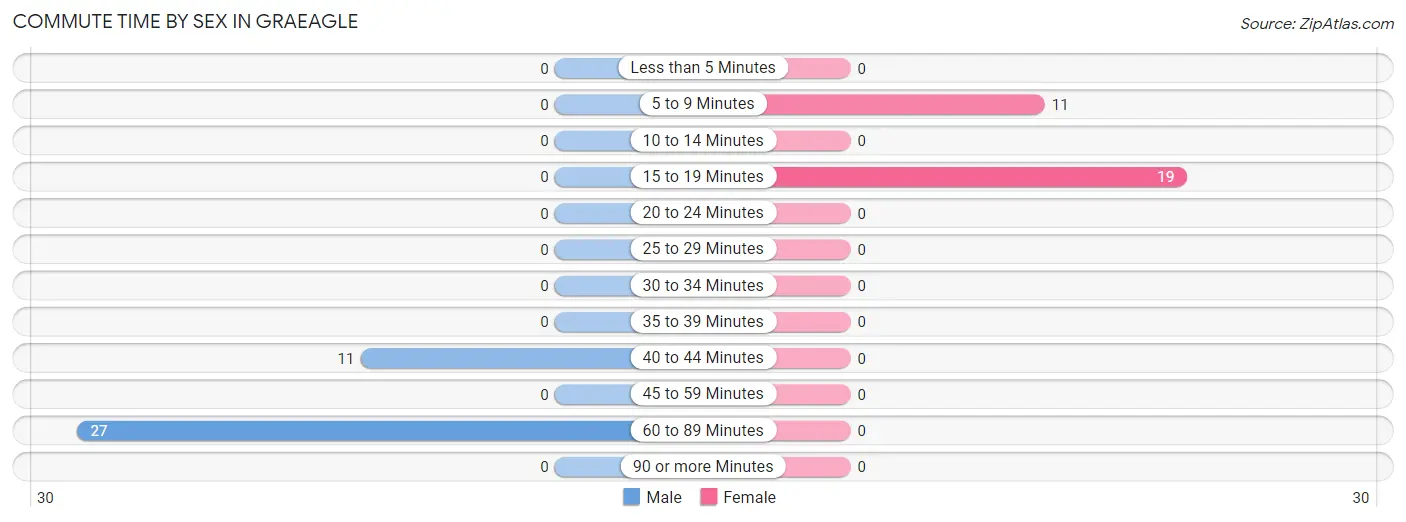
| Commute Time | Male | Female |
| Less than 5 Minutes | 0 (0.0%) | 0 (0.0%) |
| 5 to 9 Minutes | 0 (0.0%) | 11 (36.7%) |
| 10 to 14 Minutes | 0 (0.0%) | 0 (0.0%) |
| 15 to 19 Minutes | 0 (0.0%) | 19 (63.3%) |
| 20 to 24 Minutes | 0 (0.0%) | 0 (0.0%) |
| 25 to 29 Minutes | 0 (0.0%) | 0 (0.0%) |
| 30 to 34 Minutes | 0 (0.0%) | 0 (0.0%) |
| 35 to 39 Minutes | 0 (0.0%) | 0 (0.0%) |
| 40 to 44 Minutes | 11 (28.9%) | 0 (0.0%) |
| 45 to 59 Minutes | 0 (0.0%) | 0 (0.0%) |
| 60 to 89 Minutes | 27 (71.1%) | 0 (0.0%) |
| 90 or more Minutes | 0 (0.0%) | 0 (0.0%) |
Time of Departure to Work by Sex in Graeagle
The most frequent times of departure to work in Graeagle are 12:00 PM to 3:59 PM (17, 44.7%) for males and 7:30 AM to 7:59 AM (19, 63.3%) for females.
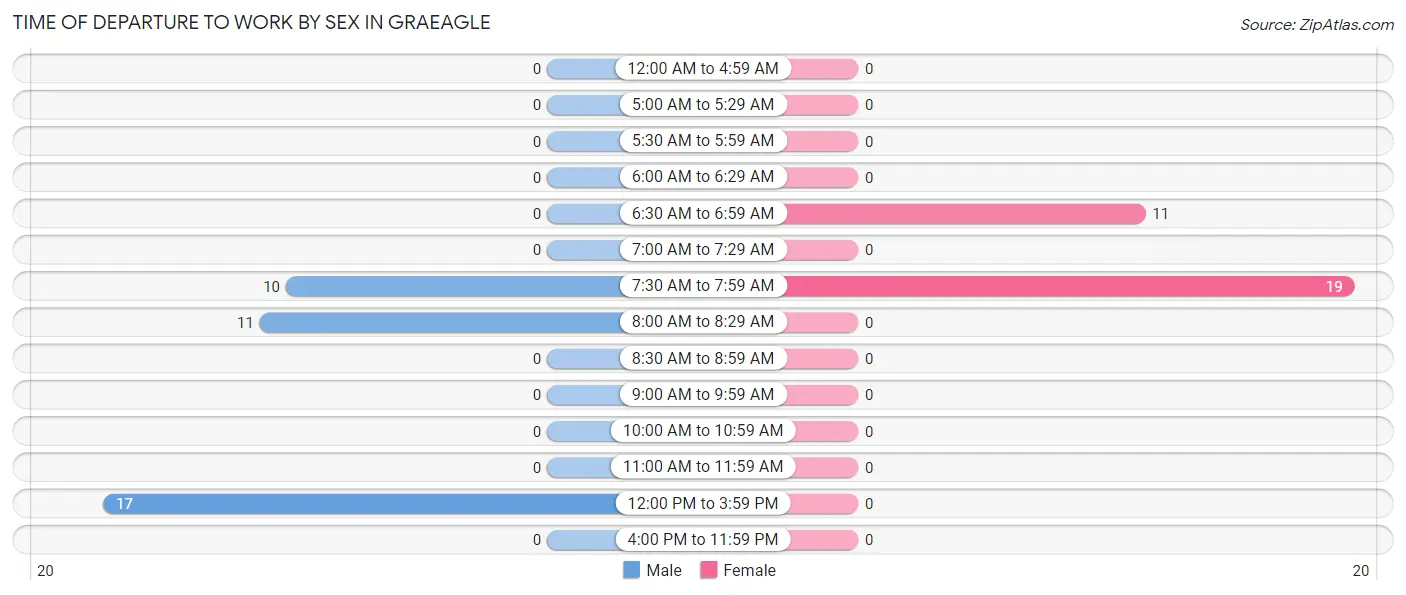
| Time of Departure | Male | Female |
| 12:00 AM to 4:59 AM | 0 (0.0%) | 0 (0.0%) |
| 5:00 AM to 5:29 AM | 0 (0.0%) | 0 (0.0%) |
| 5:30 AM to 5:59 AM | 0 (0.0%) | 0 (0.0%) |
| 6:00 AM to 6:29 AM | 0 (0.0%) | 0 (0.0%) |
| 6:30 AM to 6:59 AM | 0 (0.0%) | 11 (36.7%) |
| 7:00 AM to 7:29 AM | 0 (0.0%) | 0 (0.0%) |
| 7:30 AM to 7:59 AM | 10 (26.3%) | 19 (63.3%) |
| 8:00 AM to 8:29 AM | 11 (28.9%) | 0 (0.0%) |
| 8:30 AM to 8:59 AM | 0 (0.0%) | 0 (0.0%) |
| 9:00 AM to 9:59 AM | 0 (0.0%) | 0 (0.0%) |
| 10:00 AM to 10:59 AM | 0 (0.0%) | 0 (0.0%) |
| 11:00 AM to 11:59 AM | 0 (0.0%) | 0 (0.0%) |
| 12:00 PM to 3:59 PM | 17 (44.7%) | 0 (0.0%) |
| 4:00 PM to 11:59 PM | 0 (0.0%) | 0 (0.0%) |
| Total | 38 (100.0%) | 30 (100.0%) |
Housing Occupancy in Graeagle
Occupancy by Ownership in Graeagle
Of the total 204 dwellings in Graeagle, owner-occupied units account for 199 (97.6%), while renter-occupied units make up 5 (2.5%).
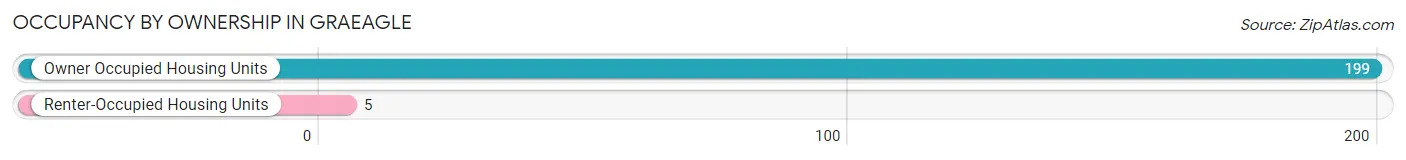
| Occupancy | # Housing Units | % Housing Units |
| Owner Occupied Housing Units | 199 | 97.6% |
| Renter-Occupied Housing Units | 5 | 2.5% |
| Total Occupied Housing Units | 204 | 100.0% |
Occupancy by Household Size in Graeagle
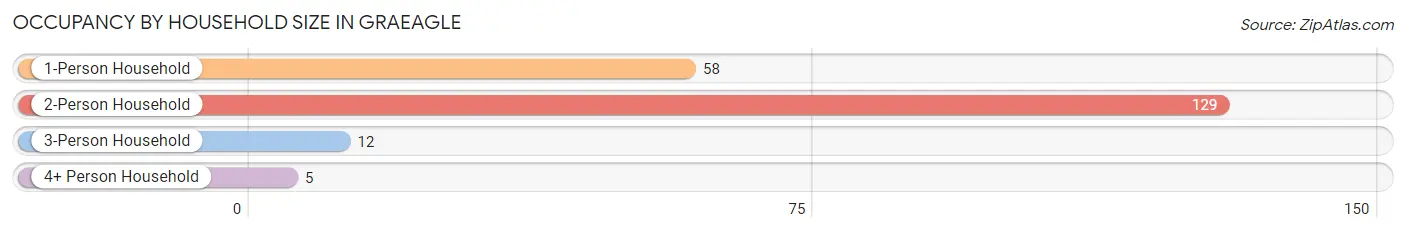
| Household Size | # Housing Units | % Housing Units |
| 1-Person Household | 58 | 28.4% |
| 2-Person Household | 129 | 63.2% |
| 3-Person Household | 12 | 5.9% |
| 4+ Person Household | 5 | 2.5% |
| Total Housing Units | 204 | 100.0% |
Occupancy by Ownership by Household Size in Graeagle
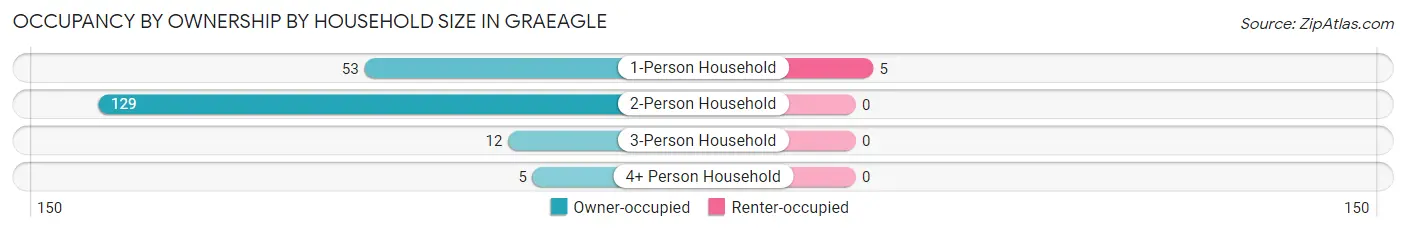
| Household Size | Owner-occupied | Renter-occupied |
| 1-Person Household | 53 (91.4%) | 5 (8.6%) |
| 2-Person Household | 129 (100.0%) | 0 (0.0%) |
| 3-Person Household | 12 (100.0%) | 0 (0.0%) |
| 4+ Person Household | 5 (100.0%) | 0 (0.0%) |
| Total Housing Units | 199 (97.6%) | 5 (2.5%) |
Occupancy by Educational Attainment in Graeagle
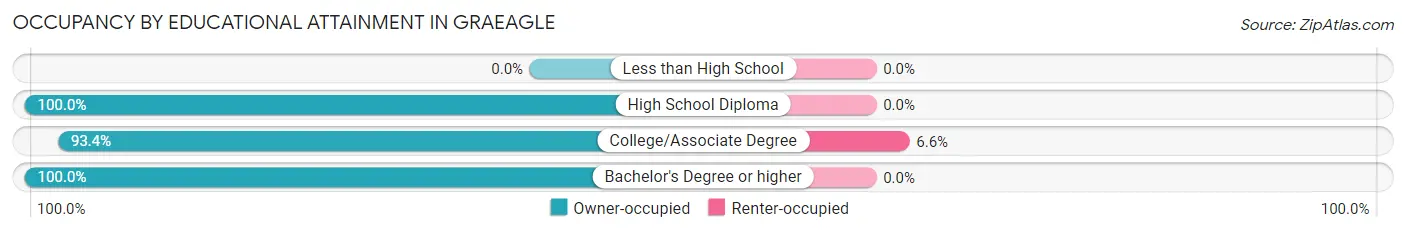
| Household Size | Owner-occupied | Renter-occupied |
| Less than High School | 0 (0.0%) | 0 (0.0%) |
| High School Diploma | 68 (100.0%) | 0 (0.0%) |
| College/Associate Degree | 71 (93.4%) | 5 (6.6%) |
| Bachelor's Degree or higher | 60 (100.0%) | 0 (0.0%) |
Occupancy by Age of Householder in Graeagle
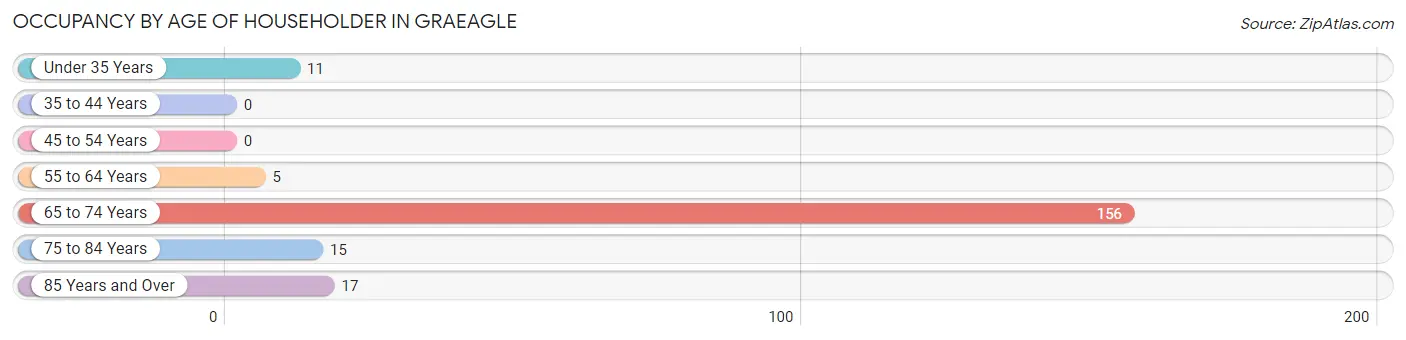
| Age Bracket | # Households | % Households |
| Under 35 Years | 11 | 5.4% |
| 35 to 44 Years | 0 | 0.0% |
| 45 to 54 Years | 0 | 0.0% |
| 55 to 64 Years | 5 | 2.5% |
| 65 to 74 Years | 156 | 76.5% |
| 75 to 84 Years | 15 | 7.3% |
| 85 Years and Over | 17 | 8.3% |
| Total | 204 | 100.0% |
Housing Finances in Graeagle
Median Income by Occupancy in Graeagle
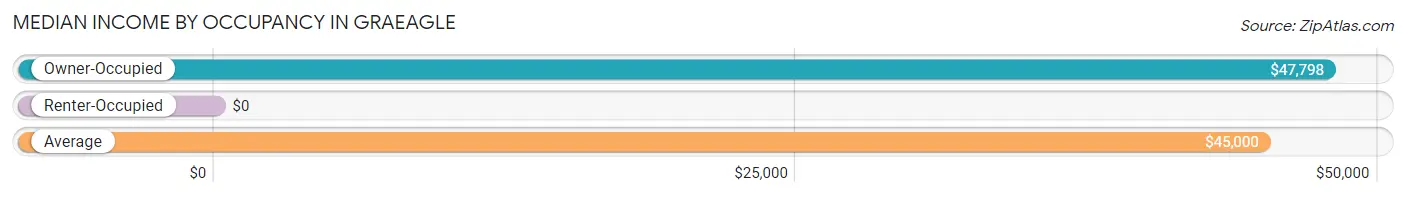
| Occupancy Type | # Households | Median Income |
| Owner-Occupied | 199 (97.6%) | $47,798 |
| Renter-Occupied | 5 (2.5%) | $0 |
| Average | 204 (100.0%) | $45,000 |
Occupancy by Householder Income Bracket in Graeagle
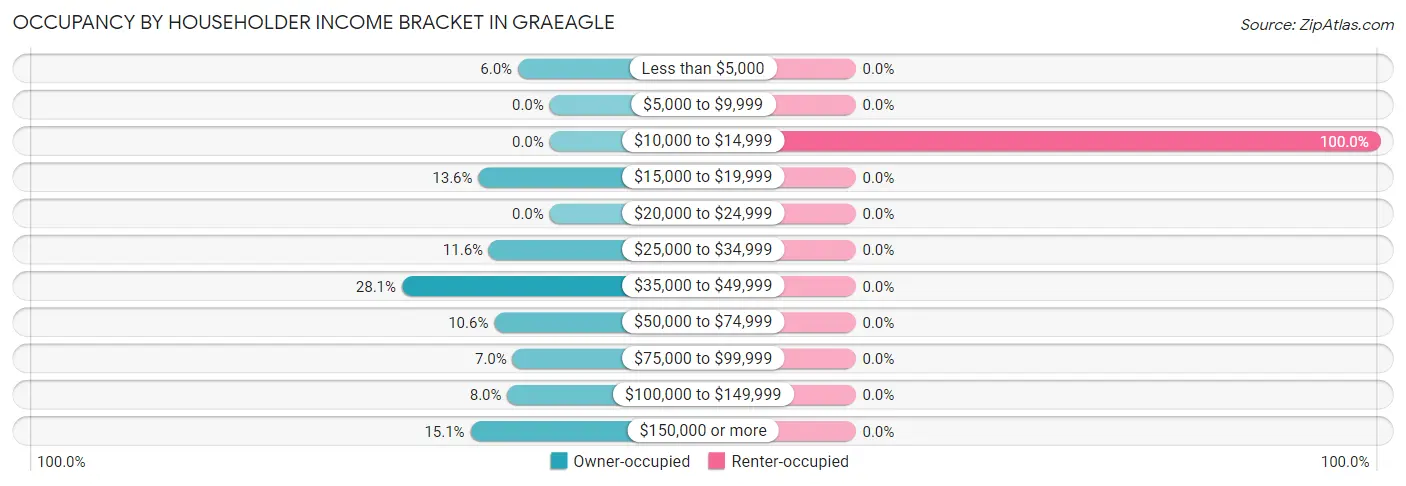
| Income Bracket | Owner-occupied | Renter-occupied |
| Less than $5,000 | 12 (6.0%) | 0 (0.0%) |
| $5,000 to $9,999 | 0 (0.0%) | 0 (0.0%) |
| $10,000 to $14,999 | 0 (0.0%) | 5 (100.0%) |
| $15,000 to $19,999 | 27 (13.6%) | 0 (0.0%) |
| $20,000 to $24,999 | 0 (0.0%) | 0 (0.0%) |
| $25,000 to $34,999 | 23 (11.6%) | 0 (0.0%) |
| $35,000 to $49,999 | 56 (28.1%) | 0 (0.0%) |
| $50,000 to $74,999 | 21 (10.5%) | 0 (0.0%) |
| $75,000 to $99,999 | 14 (7.0%) | 0 (0.0%) |
| $100,000 to $149,999 | 16 (8.0%) | 0 (0.0%) |
| $150,000 or more | 30 (15.1%) | 0 (0.0%) |
| Total | 199 (100.0%) | 5 (100.0%) |
Monthly Housing Cost Tiers in Graeagle
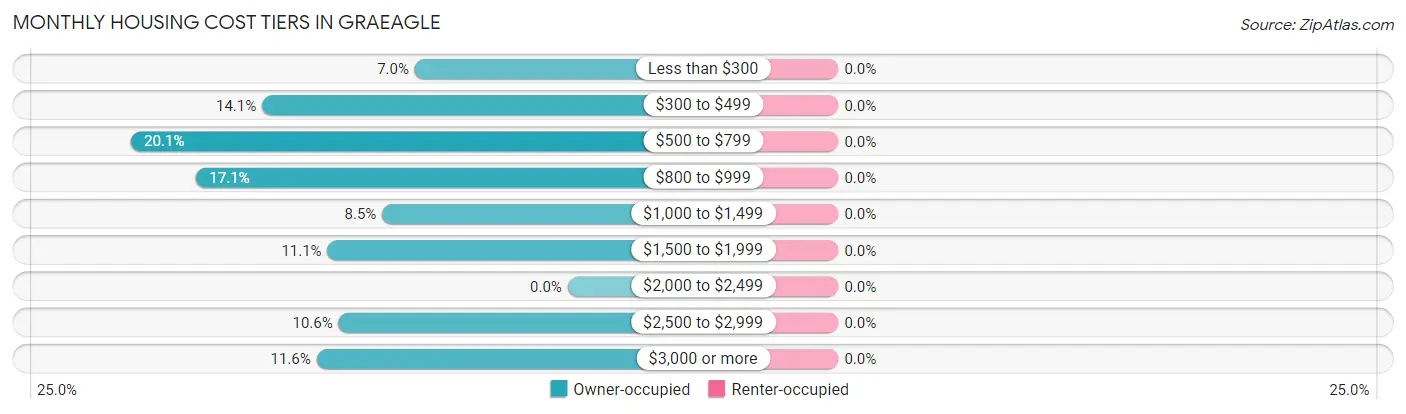
| Monthly Cost | Owner-occupied | Renter-occupied |
| Less than $300 | 14 (7.0%) | 0 (0.0%) |
| $300 to $499 | 28 (14.1%) | 0 (0.0%) |
| $500 to $799 | 40 (20.1%) | 0 (0.0%) |
| $800 to $999 | 34 (17.1%) | 0 (0.0%) |
| $1,000 to $1,499 | 17 (8.5%) | 0 (0.0%) |
| $1,500 to $1,999 | 22 (11.1%) | 0 (0.0%) |
| $2,000 to $2,499 | 0 (0.0%) | 0 (0.0%) |
| $2,500 to $2,999 | 21 (10.5%) | 0 (0.0%) |
| $3,000 or more | 23 (11.6%) | 0 (0.0%) |
| Total | 199 (100.0%) | 5 (100.0%) |
Physical Housing Characteristics in Graeagle
Housing Structures in Graeagle
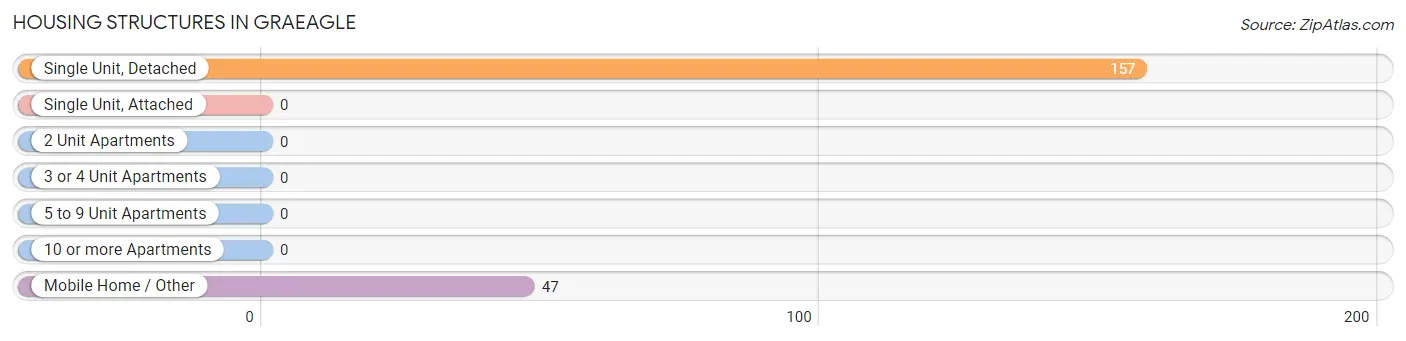
| Structure Type | # Housing Units | % Housing Units |
| Single Unit, Detached | 157 | 77.0% |
| Single Unit, Attached | 0 | 0.0% |
| 2 Unit Apartments | 0 | 0.0% |
| 3 or 4 Unit Apartments | 0 | 0.0% |
| 5 to 9 Unit Apartments | 0 | 0.0% |
| 10 or more Apartments | 0 | 0.0% |
| Mobile Home / Other | 47 | 23.0% |
| Total | 204 | 100.0% |
Housing Structures by Occupancy in Graeagle
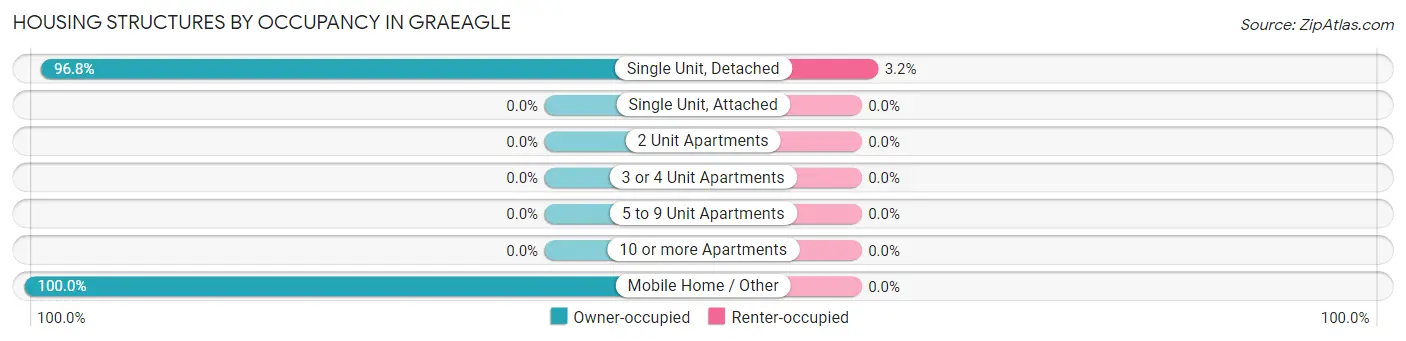
| Structure Type | Owner-occupied | Renter-occupied |
| Single Unit, Detached | 152 (96.8%) | 5 (3.2%) |
| Single Unit, Attached | 0 (0.0%) | 0 (0.0%) |
| 2 Unit Apartments | 0 (0.0%) | 0 (0.0%) |
| 3 or 4 Unit Apartments | 0 (0.0%) | 0 (0.0%) |
| 5 to 9 Unit Apartments | 0 (0.0%) | 0 (0.0%) |
| 10 or more Apartments | 0 (0.0%) | 0 (0.0%) |
| Mobile Home / Other | 47 (100.0%) | 0 (0.0%) |
| Total | 199 (97.6%) | 5 (2.5%) |
Housing Structures by Number of Rooms in Graeagle
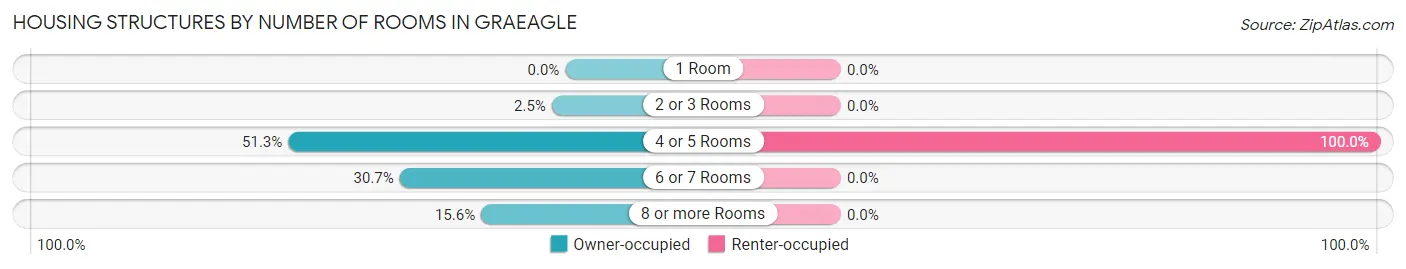
| Number of Rooms | Owner-occupied | Renter-occupied |
| 1 Room | 0 (0.0%) | 0 (0.0%) |
| 2 or 3 Rooms | 5 (2.5%) | 0 (0.0%) |
| 4 or 5 Rooms | 102 (51.3%) | 5 (100.0%) |
| 6 or 7 Rooms | 61 (30.6%) | 0 (0.0%) |
| 8 or more Rooms | 31 (15.6%) | 0 (0.0%) |
| Total | 199 (100.0%) | 5 (100.0%) |
Housing Structure by Heating Type in Graeagle
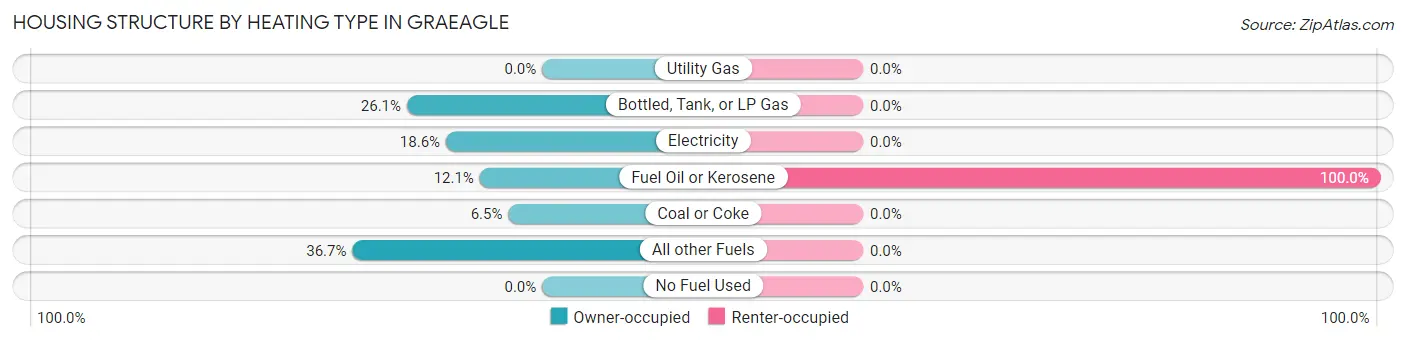
| Heating Type | Owner-occupied | Renter-occupied |
| Utility Gas | 0 (0.0%) | 0 (0.0%) |
| Bottled, Tank, or LP Gas | 52 (26.1%) | 0 (0.0%) |
| Electricity | 37 (18.6%) | 0 (0.0%) |
| Fuel Oil or Kerosene | 24 (12.1%) | 5 (100.0%) |
| Coal or Coke | 13 (6.5%) | 0 (0.0%) |
| All other Fuels | 73 (36.7%) | 0 (0.0%) |
| No Fuel Used | 0 (0.0%) | 0 (0.0%) |
| Total | 199 (100.0%) | 5 (100.0%) |
Household Vehicle Usage in Graeagle
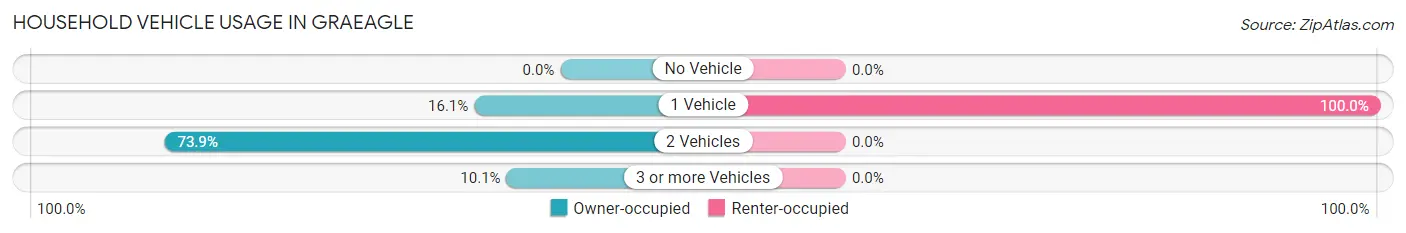
| Vehicles per Household | Owner-occupied | Renter-occupied |
| No Vehicle | 0 (0.0%) | 0 (0.0%) |
| 1 Vehicle | 32 (16.1%) | 5 (100.0%) |
| 2 Vehicles | 147 (73.9%) | 0 (0.0%) |
| 3 or more Vehicles | 20 (10.1%) | 0 (0.0%) |
| Total | 199 (100.0%) | 5 (100.0%) |
Real Estate & Mortgages in Graeagle
Real Estate and Mortgage Overview in Graeagle
| Characteristic | Without Mortgage | With Mortgage |
| Housing Units | 111 | 88 |
| Median Property Value | $321,200 | $450,000 |
| Median Household Income | $42,036 | $10 |
| Monthly Housing Costs | $554 | $23 |
| Real Estate Taxes | $2,134 | $0 |
Property Value by Mortgage Status in Graeagle
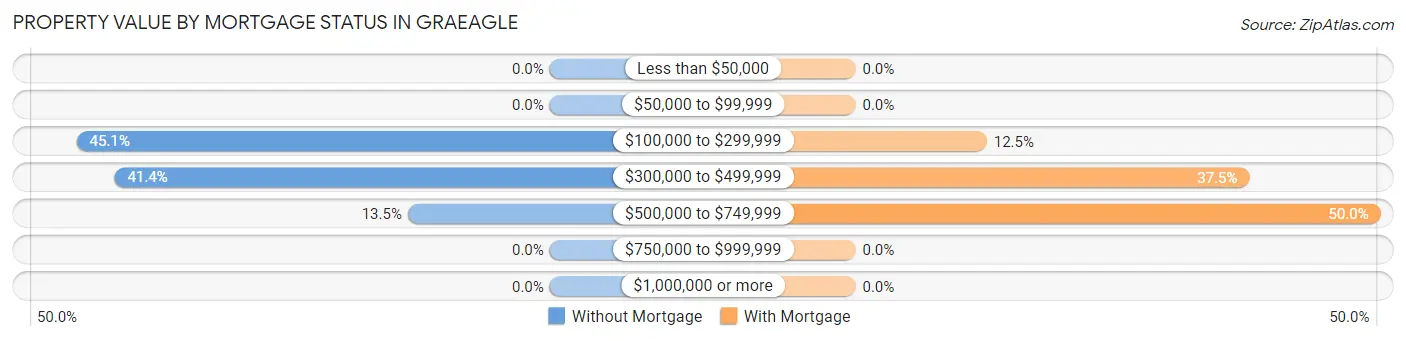
| Property Value | Without Mortgage | With Mortgage |
| Less than $50,000 | 0 (0.0%) | 0 (0.0%) |
| $50,000 to $99,999 | 0 (0.0%) | 0 (0.0%) |
| $100,000 to $299,999 | 50 (45.1%) | 11 (12.5%) |
| $300,000 to $499,999 | 46 (41.4%) | 33 (37.5%) |
| $500,000 to $749,999 | 15 (13.5%) | 44 (50.0%) |
| $750,000 to $999,999 | 0 (0.0%) | 0 (0.0%) |
| $1,000,000 or more | 0 (0.0%) | 0 (0.0%) |
| Total | 111 (100.0%) | 88 (100.0%) |
Household Income by Mortgage Status in Graeagle
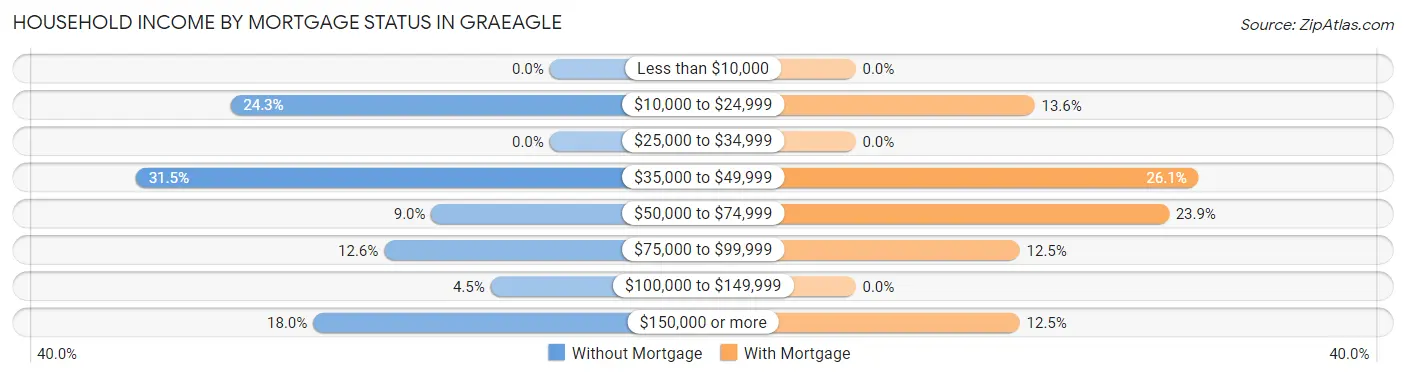
| Household Income | Without Mortgage | With Mortgage |
| Less than $10,000 | 0 (0.0%) | 0 (0.0%) |
| $10,000 to $24,999 | 27 (24.3%) | 12 (13.6%) |
| $25,000 to $34,999 | 0 (0.0%) | 0 (0.0%) |
| $35,000 to $49,999 | 35 (31.5%) | 23 (26.1%) |
| $50,000 to $74,999 | 10 (9.0%) | 21 (23.9%) |
| $75,000 to $99,999 | 14 (12.6%) | 11 (12.5%) |
| $100,000 to $149,999 | 5 (4.5%) | 0 (0.0%) |
| $150,000 or more | 20 (18.0%) | 11 (12.5%) |
| Total | 111 (100.0%) | 88 (100.0%) |
Property Value to Household Income Ratio in Graeagle
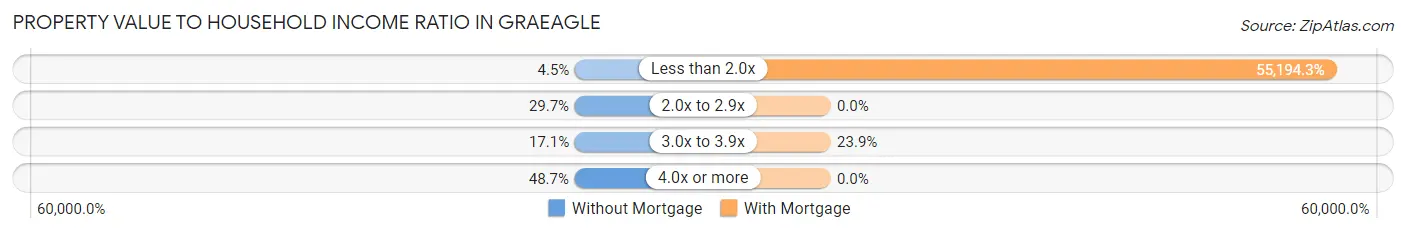
| Value-to-Income Ratio | Without Mortgage | With Mortgage |
| Less than 2.0x | 5 (4.5%) | 48,571 (55,194.3%) |
| 2.0x to 2.9x | 33 (29.7%) | 0 (0.0%) |
| 3.0x to 3.9x | 19 (17.1%) | 21 (23.9%) |
| 4.0x or more | 54 (48.6%) | 0 (0.0%) |
| Total | 111 (100.0%) | 88 (100.0%) |
Real Estate Taxes by Mortgage Status in Graeagle
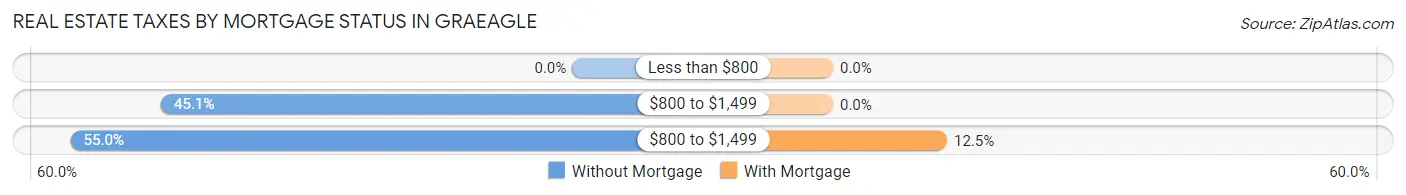
| Property Taxes | Without Mortgage | With Mortgage |
| Less than $800 | 0 (0.0%) | 0 (0.0%) |
| $800 to $1,499 | 50 (45.1%) | 0 (0.0%) |
| $800 to $1,499 | 61 (54.9%) | 11 (12.5%) |
| Total | 111 (100.0%) | 88 (100.0%) |
Health & Disability in Graeagle
Health Insurance Coverage by Age in Graeagle
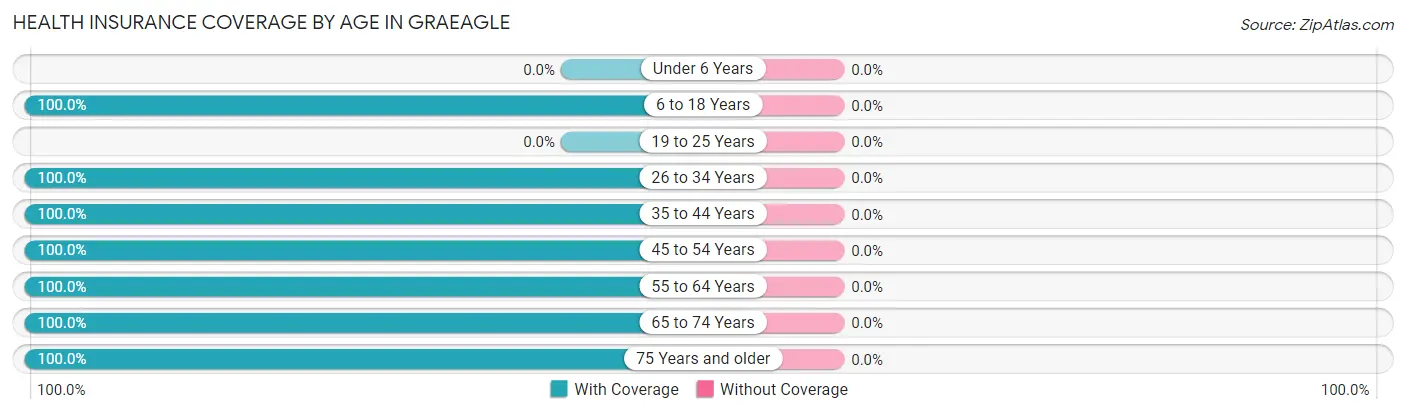
| Age Bracket | With Coverage | Without Coverage |
| Under 6 Years | 0 (0.0%) | 0 (0.0%) |
| 6 to 18 Years | 45 (100.0%) | 0 (0.0%) |
| 19 to 25 Years | 0 (0.0%) | 0 (0.0%) |
| 26 to 34 Years | 39 (100.0%) | 0 (0.0%) |
| 35 to 44 Years | 19 (100.0%) | 0 (0.0%) |
| 45 to 54 Years | 6 (100.0%) | 0 (0.0%) |
| 55 to 64 Years | 13 (100.0%) | 0 (0.0%) |
| 65 to 74 Years | 231 (100.0%) | 0 (0.0%) |
| 75 Years and older | 48 (100.0%) | 0 (0.0%) |
| Total | 401 (100.0%) | 0 (0.0%) |
Health Insurance Coverage by Citizenship Status in Graeagle
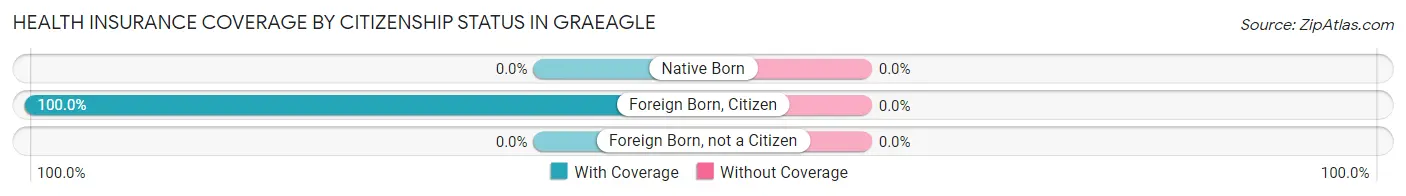
| Citizenship Status | With Coverage | Without Coverage |
| Native Born | 0 (0.0%) | 0 (0.0%) |
| Foreign Born, Citizen | 45 (100.0%) | 0 (0.0%) |
| Foreign Born, not a Citizen | 0 (0.0%) | 0 (0.0%) |
Health Insurance Coverage by Household Income in Graeagle
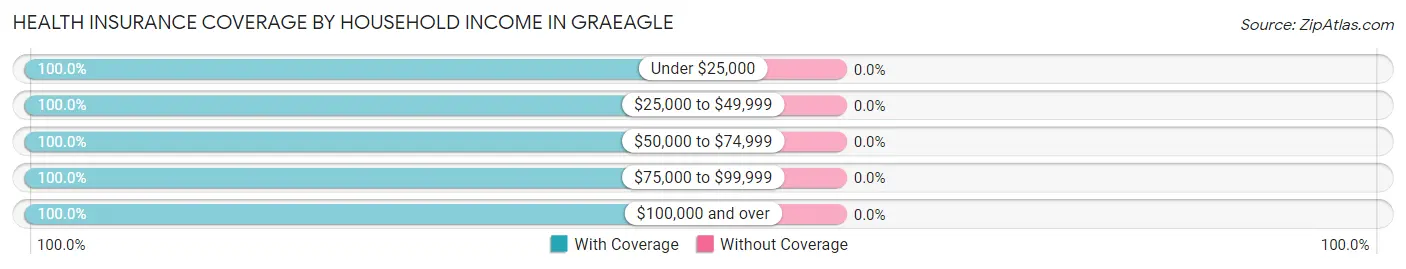
| Household Income | With Coverage | Without Coverage |
| Under $25,000 | 84 (100.0%) | 0 (0.0%) |
| $25,000 to $49,999 | 131 (100.0%) | 0 (0.0%) |
| $50,000 to $74,999 | 40 (100.0%) | 0 (0.0%) |
| $75,000 to $99,999 | 14 (100.0%) | 0 (0.0%) |
| $100,000 and over | 132 (100.0%) | 0 (0.0%) |
Public vs Private Health Insurance Coverage by Age in Graeagle
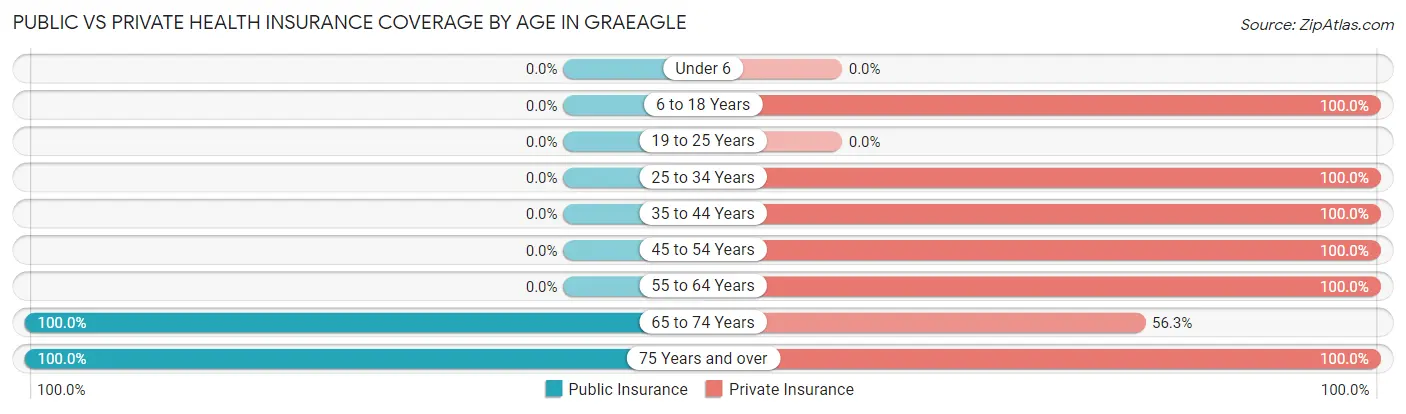
| Age Bracket | Public Insurance | Private Insurance |
| Under 6 | 0 (0.0%) | 0 (0.0%) |
| 6 to 18 Years | 0 (0.0%) | 45 (100.0%) |
| 19 to 25 Years | 0 (0.0%) | 0 (0.0%) |
| 25 to 34 Years | 0 (0.0%) | 39 (100.0%) |
| 35 to 44 Years | 0 (0.0%) | 19 (100.0%) |
| 45 to 54 Years | 0 (0.0%) | 6 (100.0%) |
| 55 to 64 Years | 0 (0.0%) | 13 (100.0%) |
| 65 to 74 Years | 231 (100.0%) | 130 (56.3%) |
| 75 Years and over | 48 (100.0%) | 48 (100.0%) |
| Total | 279 (69.6%) | 300 (74.8%) |
Disability Status by Sex by Age in Graeagle
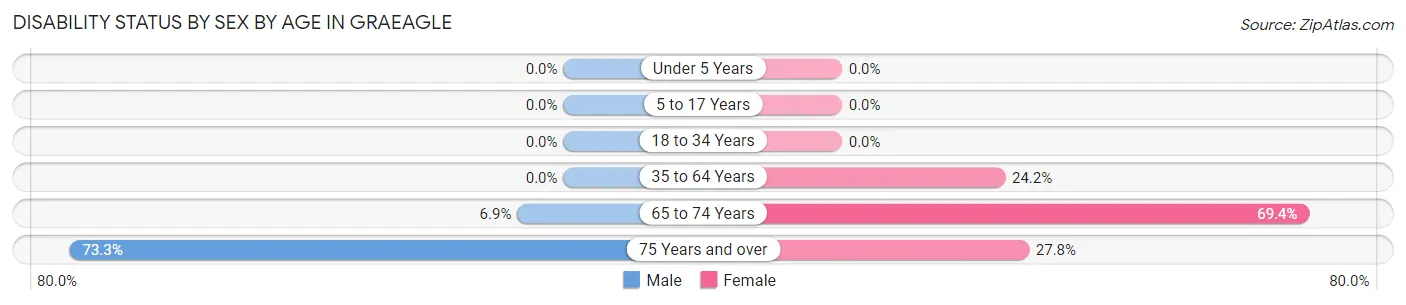
| Age Bracket | Male | Female |
| Under 5 Years | 0 (0.0%) | 0 (0.0%) |
| 5 to 17 Years | 0 (0.0%) | 0 (0.0%) |
| 18 to 34 Years | 0 (0.0%) | 0 (0.0%) |
| 35 to 64 Years | 0 (0.0%) | 8 (24.2%) |
| 65 to 74 Years | 10 (6.9%) | 59 (69.4%) |
| 75 Years and over | 22 (73.3%) | 5 (27.8%) |
Disability Class by Sex by Age in Graeagle
Disability Class: Hearing Difficulty
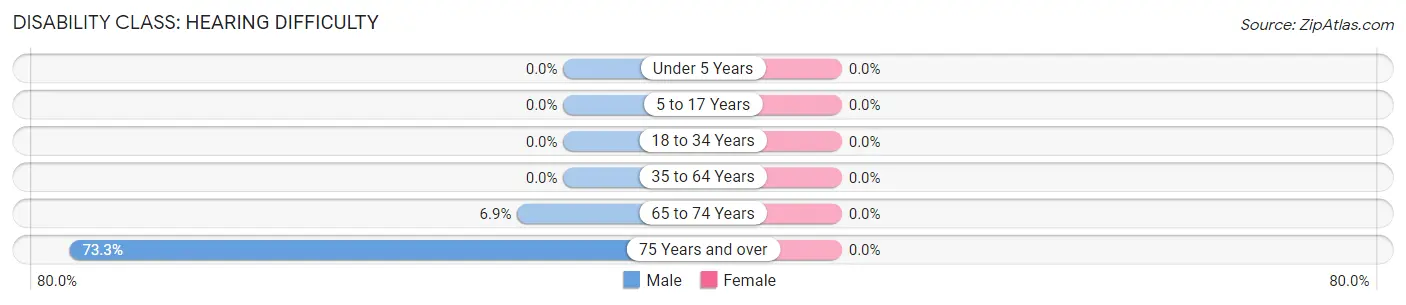
| Age Bracket | Male | Female |
| Under 5 Years | 0 (0.0%) | 0 (0.0%) |
| 5 to 17 Years | 0 (0.0%) | 0 (0.0%) |
| 18 to 34 Years | 0 (0.0%) | 0 (0.0%) |
| 35 to 64 Years | 0 (0.0%) | 0 (0.0%) |
| 65 to 74 Years | 10 (6.9%) | 0 (0.0%) |
| 75 Years and over | 22 (73.3%) | 0 (0.0%) |
Disability Class: Vision Difficulty
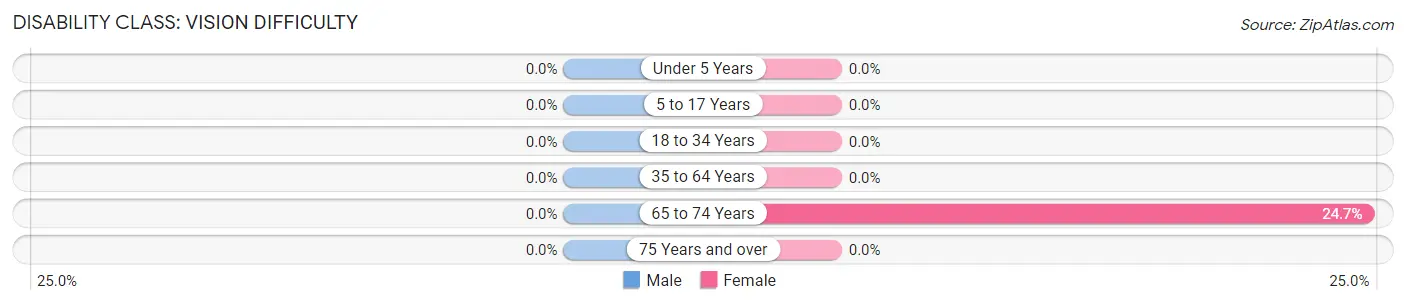
| Age Bracket | Male | Female |
| Under 5 Years | 0 (0.0%) | 0 (0.0%) |
| 5 to 17 Years | 0 (0.0%) | 0 (0.0%) |
| 18 to 34 Years | 0 (0.0%) | 0 (0.0%) |
| 35 to 64 Years | 0 (0.0%) | 0 (0.0%) |
| 65 to 74 Years | 0 (0.0%) | 21 (24.7%) |
| 75 Years and over | 0 (0.0%) | 0 (0.0%) |
Disability Class: Cognitive Difficulty
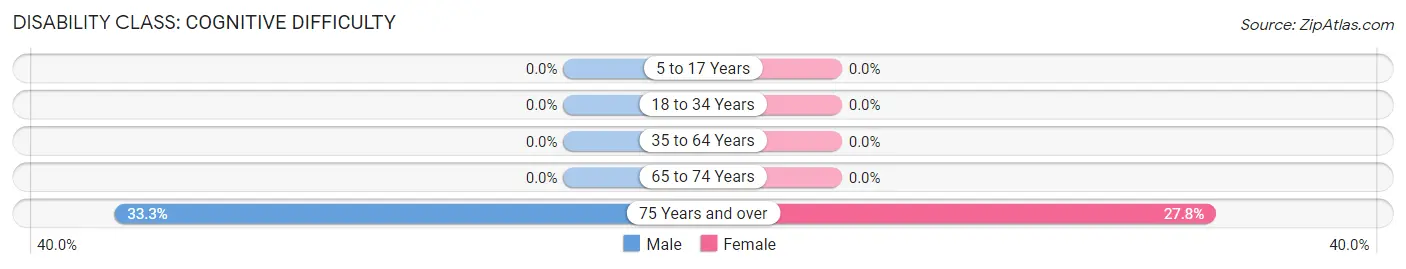
| Age Bracket | Male | Female |
| 5 to 17 Years | 0 (0.0%) | 0 (0.0%) |
| 18 to 34 Years | 0 (0.0%) | 0 (0.0%) |
| 35 to 64 Years | 0 (0.0%) | 0 (0.0%) |
| 65 to 74 Years | 0 (0.0%) | 0 (0.0%) |
| 75 Years and over | 10 (33.3%) | 5 (27.8%) |
Disability Class: Ambulatory Difficulty
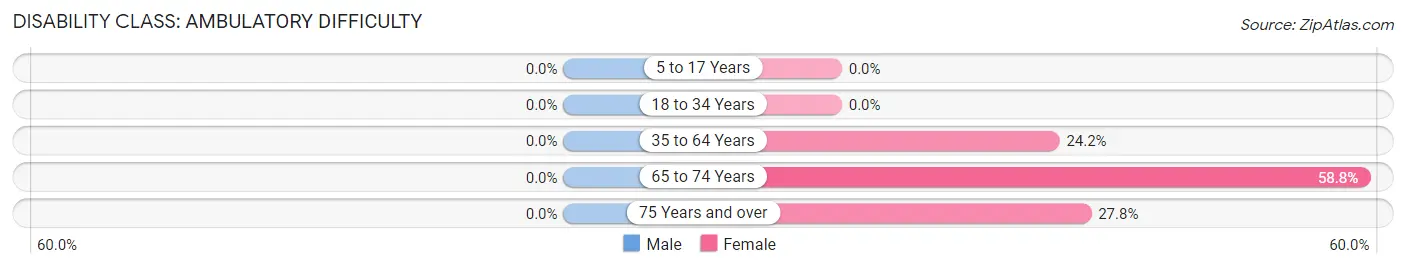
| Age Bracket | Male | Female |
| 5 to 17 Years | 0 (0.0%) | 0 (0.0%) |
| 18 to 34 Years | 0 (0.0%) | 0 (0.0%) |
| 35 to 64 Years | 0 (0.0%) | 8 (24.2%) |
| 65 to 74 Years | 0 (0.0%) | 50 (58.8%) |
| 75 Years and over | 0 (0.0%) | 5 (27.8%) |
Disability Class: Self-Care Difficulty
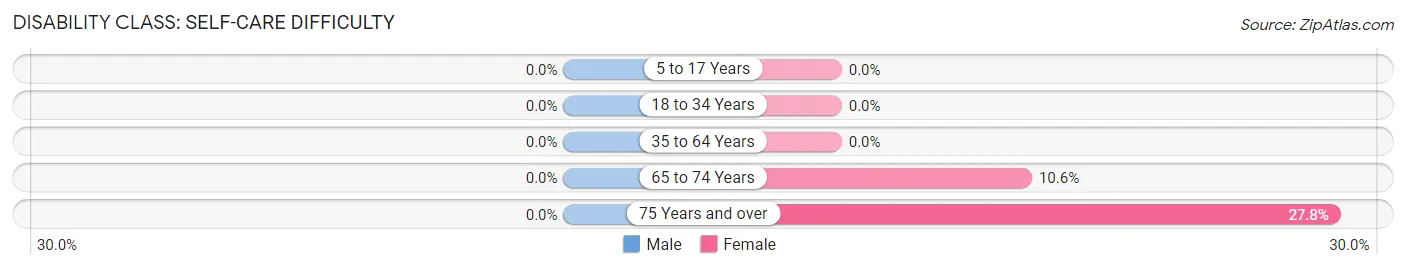
| Age Bracket | Male | Female |
| 5 to 17 Years | 0 (0.0%) | 0 (0.0%) |
| 18 to 34 Years | 0 (0.0%) | 0 (0.0%) |
| 35 to 64 Years | 0 (0.0%) | 0 (0.0%) |
| 65 to 74 Years | 0 (0.0%) | 9 (10.6%) |
| 75 Years and over | 0 (0.0%) | 5 (27.8%) |
Technology Access in Graeagle
Computing Device Access in Graeagle
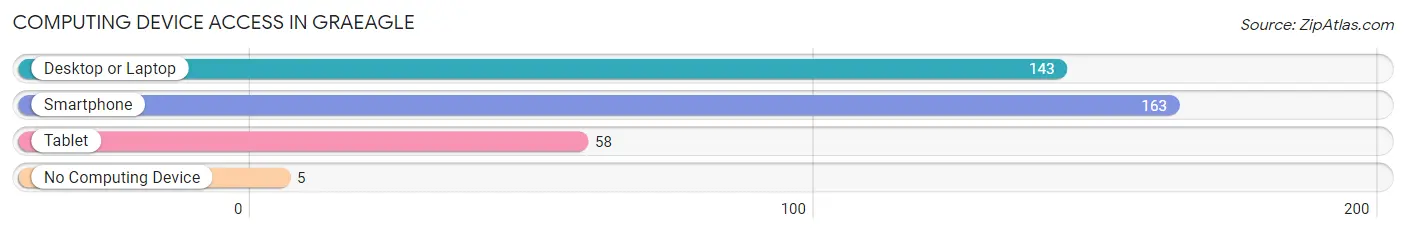
| Device Type | # Households | % Households |
| Desktop or Laptop | 143 | 70.1% |
| Smartphone | 163 | 79.9% |
| Tablet | 58 | 28.4% |
| No Computing Device | 5 | 2.5% |
| Total | 204 | 100.0% |
Internet Access in Graeagle
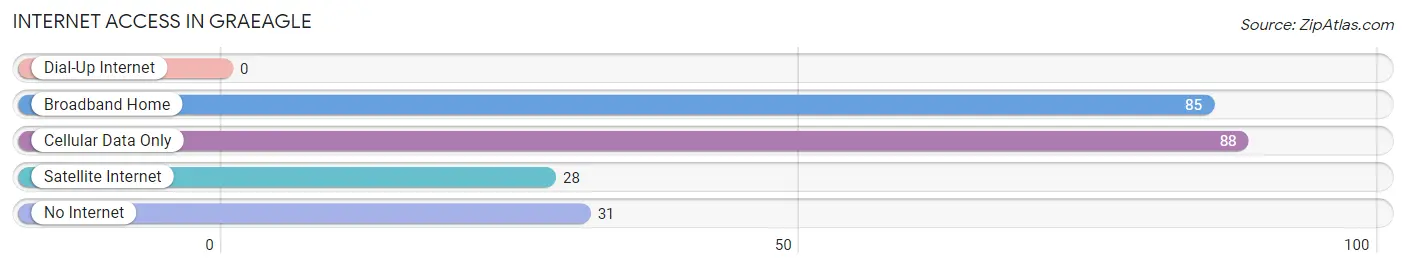
| Internet Type | # Households | % Households |
| Dial-Up Internet | 0 | 0.0% |
| Broadband Home | 85 | 41.7% |
| Cellular Data Only | 88 | 43.1% |
| Satellite Internet | 28 | 13.7% |
| No Internet | 31 | 15.2% |
| Total | 204 | 100.0% |
Graeagle Summary
Graeagle is a small unincorporated community located in Plumas County, California. It is situated in the Sierra Nevada mountain range, approximately 20 miles east of the city of Quincy. The town is known for its outdoor recreation opportunities, including golf, fishing, camping, and hiking.
History
The area that is now Graeagle was originally inhabited by the Maidu and Washoe Native American tribes. The first European settlers arrived in the area in the late 1800s, and the town was officially founded in 1881. The town was named after the nearby Graeagle Creek, which was named after a local Native American chief.
In the early 1900s, the town began to grow as a logging and mining community. The town was home to several sawmills, and the surrounding area was heavily logged. The town also had a thriving gold mining industry, and several gold mines were located in the area.
In the 1950s, the town began to transition from a logging and mining community to a tourist destination. The town was home to several resorts, and the area became popular for its outdoor recreation opportunities. The town was also home to several golf courses, and the area became known as a golf destination.
Geography
Graeagle is located in the Sierra Nevada mountain range, approximately 20 miles east of the city of Quincy. The town is situated at an elevation of 4,500 feet, and the surrounding area is heavily forested. The town is located in a valley, and the surrounding mountains provide a picturesque backdrop.
The town is located near several lakes, including Graeagle Lake, Gold Lake, and Frenchman Lake. The area is also home to several rivers, including the Feather River and the Yuba River. The area is also home to several ski resorts, including the Graeagle Ski Resort and the Plumas Ski Resort.
Economy
The economy of Graeagle is largely based on tourism. The town is home to several resorts, and the area is popular for its outdoor recreation opportunities. The town is also home to several golf courses, and the area is known as a golf destination.
The town is also home to several businesses, including restaurants, shops, and lodging. The town is also home to several art galleries, and the area is known for its art scene.
Demographics
As of the 2010 census, the population of Graeagle was 1,037. The town has a total area of 1.3 square miles, and the population density was 809.3 people per square mile. The median age of the population was 57.2 years, and the median household income was $45,000.
The racial makeup of the town was 95.3% White, 0.7% Native American, 0.3% Asian, 0.2% Pacific Islander, 0.2% from other races, and 3.5% from two or more races. The town had a population of 1,037 people, and the median age was 57.2 years. The median household income was $45,000, and the median family income was $50,000.
Conclusion
Graeagle is a small unincorporated community located in Plumas County, California. The town is situated in the Sierra Nevada mountain range, and it is known for its outdoor recreation opportunities, including golf, fishing, camping, and hiking. The town has a population of 1,037 people, and the median age is 57.2 years. The economy of Graeagle is largely based on tourism, and the town is home to several resorts, restaurants, shops, and lodging. The town is also home to several art galleries, and the area is known for its art scene.
Common Questions
What is Per Capita Income in Graeagle?
Per Capita income in Graeagle is $50,241.
What is the Median Household income in Graeagle?
Median Household Income in Graeagle is $45,000.
What is Inequality or Gini Index in Graeagle?
Inequality or Gini Index in Graeagle is 0.58.
What is the Total Population of Graeagle?
Total Population of Graeagle is 401.
What is the Total Male Population of Graeagle?
Total Male Population of Graeagle is 254.
What is the Total Female Population of Graeagle?
Total Female Population of Graeagle is 147.
What is the Ratio of Males per 100 Females in Graeagle?
There are 172.79 Males per 100 Females in Graeagle.
What is the Ratio of Females per 100 Males in Graeagle?
There are 57.87 Females per 100 Males in Graeagle.
What is the Median Population Age in Graeagle?
Median Population Age in Graeagle is 68.5 Years.
What is the Average Family Size in Graeagle
Average Family Size in Graeagle is 2.6 People.
What is the Average Household Size in Graeagle
Average Household Size in Graeagle is 2.0 People.
How Large is the Labor Force in Graeagle?
There are 90 People in the Labor Forcein in Graeagle.
What is the Percentage of People in the Labor Force in Graeagle?
24.4% of People are in the Labor Force in Graeagle.