Zip Codes with the Highest Percentage of Population Employed in Security & Protection in Brea, CA
RELATED REPORTS & OPTIONS
Security & Protection
Brea
Compare Zip Codes
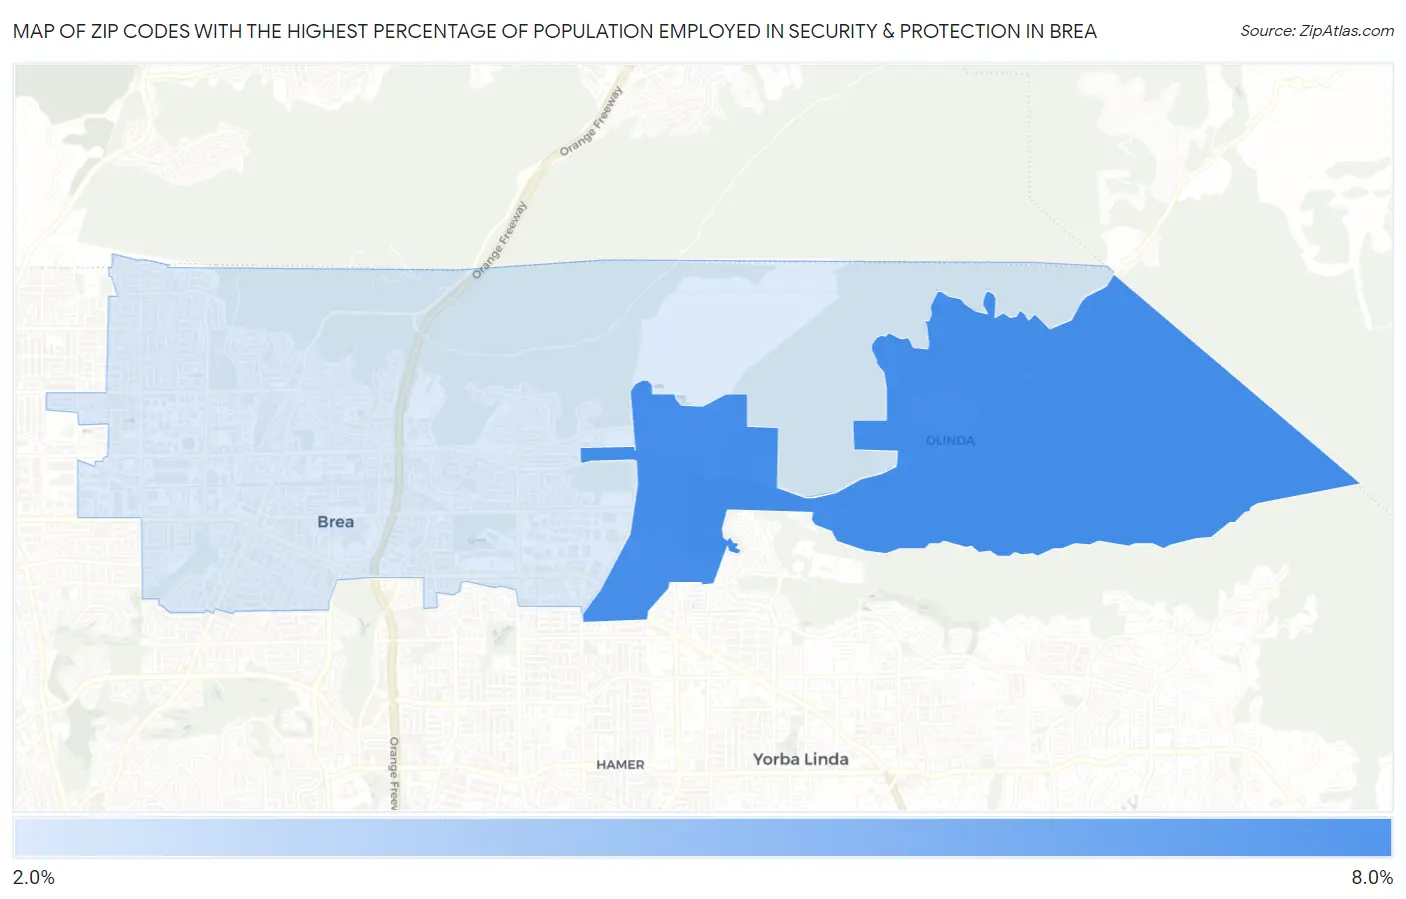
Map of Zip Codes with the Highest Percentage of Population Employed in Security & Protection in Brea
2.0%
6.2%
Zip Codes with the Highest Percentage of Population Employed in Security & Protection in Brea, CA
| Zip Code | % Employed | vs State | vs National | |
| 1. | 92823 | 6.2% | 2.1%(+4.08)#94 | 2.1%(+4.01)#1,979 |
| 2. | 92821 | 2.0% | 2.1%(-0.041)#697 | 2.1%(-0.109)#12,318 |
1
Common Questions
What are the Top Zip Codes with the Highest Percentage of Population Employed in Security & Protection in Brea, CA?
Top Zip Codes with the Highest Percentage of Population Employed in Security & Protection in Brea, CA are:
What zip code has the Highest Percentage of Population Employed in Security & Protection in Brea, CA?
92823 has the Highest Percentage of Population Employed in Security & Protection in Brea, CA with 6.2%.
What is the Percentage of Population Employed in Security & Protection in Brea, CA?
Percentage of Population Employed in Security & Protection in Brea is 2.5%.
What is the Percentage of Population Employed in Security & Protection in California?
Percentage of Population Employed in Security & Protection in California is 2.1%.
What is the Percentage of Population Employed in Security & Protection in the United States?
Percentage of Population Employed in Security & Protection in the United States is 2.1%.