States with the Highest Percentage of Population Employed in Security & Protection
RELATED REPORTS & OPTIONS
Security & Protection
United States
Compare States
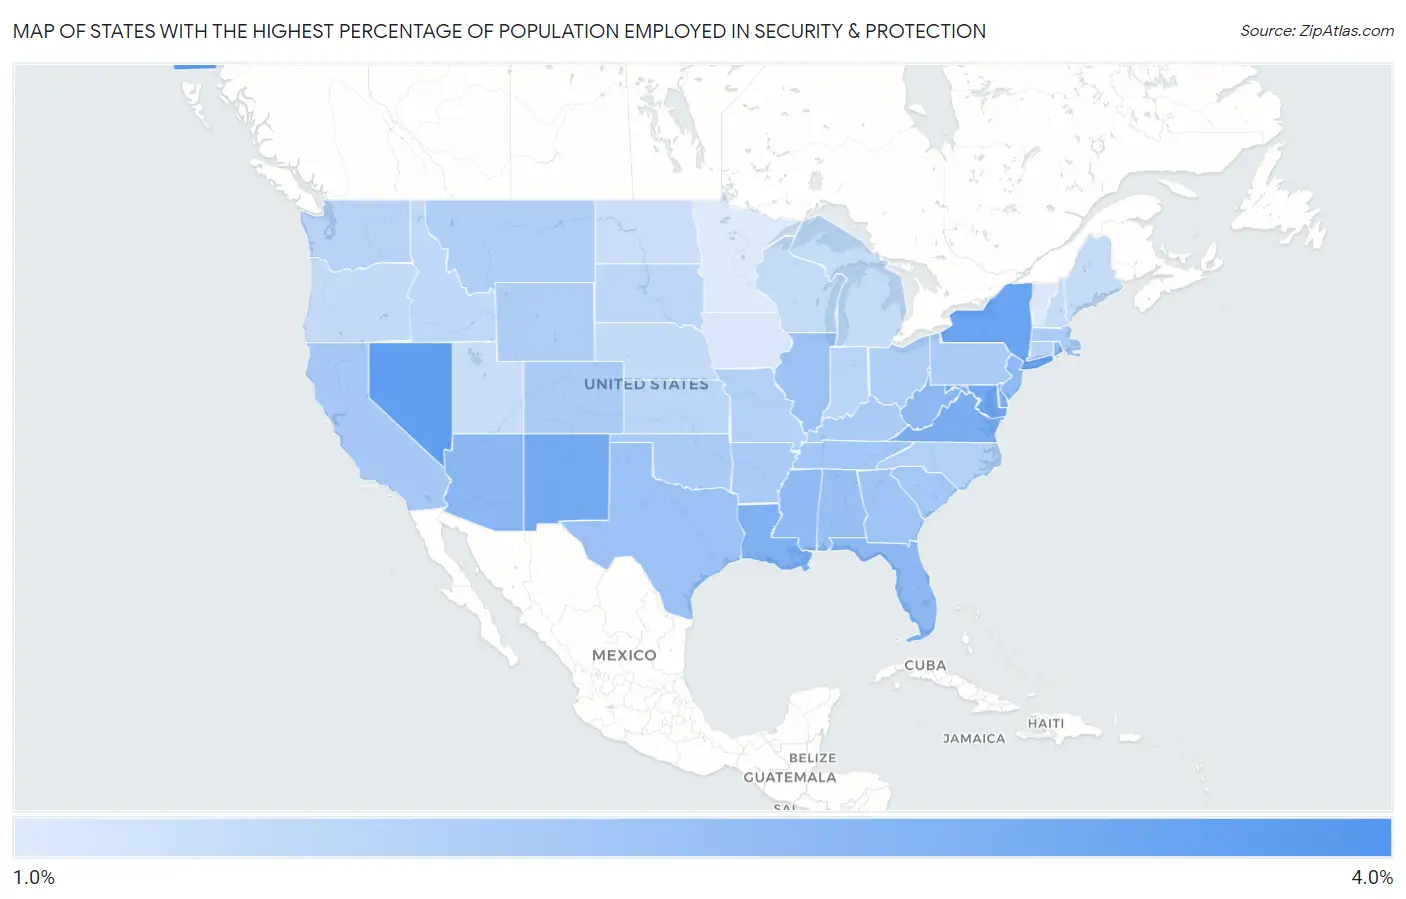
Map of States with the Highest Percentage of Population Employed in Security & Protection
1.0%
4.0%
States with the Highest Percentage of Population Employed in Security & Protection in the United States
| State | % Employed | vs State Median | vs National | |
| 1. | Hawaii | 3.4% | 2.0% (+1.36) | 2.1%(+1.23) |
| 2. | Nevada | 3.0% | 2.0% (+1.02) | 2.1%(+0.883) |
| 3. | Alaska | 2.9% | 2.0% (+0.935) | 2.1%(+0.797) |
| 4. | New York | 2.9% | 2.0% (+0.901) | 2.1%(+0.763) |
| 5. | Maryland | 2.8% | 2.0% (+0.787) | 2.1%(+0.649) |
| 6. | New Mexico | 2.8% | 2.0% (+0.751) | 2.1%(+0.613) |
| 7. | Virginia | 2.7% | 2.0% (+0.672) | 2.1%(+0.534) |
| 8. | Louisiana | 2.6% | 2.0% (+0.597) | 2.1%(+0.459) |
| 9. | Delaware | 2.6% | 2.0% (+0.587) | 2.1%(+0.449) |
| 10. | Arizona | 2.5% | 2.0% (+0.442) | 2.1%(+0.304) |
| 11. | Rhode Island | 2.4% | 2.0% (+0.425) | 2.1%(+0.287) |
| 12. | West Virginia | 2.4% | 2.0% (+0.416) | 2.1%(+0.278) |
| 13. | Florida | 2.4% | 2.0% (+0.409) | 2.1%(+0.271) |
| 14. | New Jersey | 2.4% | 2.0% (+0.392) | 2.1%(+0.254) |
| 15. | Mississippi | 2.4% | 2.0% (+0.367) | 2.1%(+0.229) |
| 16. | Alabama | 2.3% | 2.0% (+0.259) | 2.1%(+0.121) |
| 17. | Texas | 2.2% | 2.0% (+0.213) | 2.1%(+0.075) |
| 18. | Illinois | 2.2% | 2.0% (+0.181) | 2.1%(+0.043) |
| 19. | Georgia | 2.2% | 2.0% (+0.161) | 2.1%(+0.023) |
| 20. | South Carolina | 2.1% | 2.0% (+0.090) | 2.1%(-0.048) |
| 21. | Tennessee | 2.1% | 2.0% (+0.083) | 2.1%(-0.055) |
| 22. | California | 2.1% | 2.0% (+0.070) | 2.1%(-0.068) |
| 23. | Pennsylvania | 2.0% | 2.0% (+0.009) | 2.1%(-0.129) |
| 24. | Massachusetts | 2.0% | 2.0% (+0.004) | 2.1%(-0.134) |
| 25. | Kentucky | 2.0% | 2.0% (+0.002) | 2.1%(-0.136) |
| 26. | Oklahoma | 2.0% | 2.0% (-0.002) | 2.1%(-0.139) |
| 27. | Colorado | 2.0% | 2.0% (-0.006) | 2.1%(-0.144) |
| 28. | Arkansas | 2.0% | 2.0% (-0.007) | 2.1%(-0.145) |
| 29. | Wyoming | 1.9% | 2.0% (-0.063) | 2.1%(-0.201) |
| 30. | Ohio | 1.9% | 2.0% (-0.100) | 2.1%(-0.238) |
| 31. | Montana | 1.9% | 2.0% (-0.101) | 2.1%(-0.239) |
| 32. | North Carolina | 1.9% | 2.0% (-0.117) | 2.1%(-0.255) |
| 33. | Missouri | 1.9% | 2.0% (-0.119) | 2.1%(-0.257) |
| 34. | Washington | 1.8% | 2.0% (-0.197) | 2.1%(-0.335) |
| 35. | Connecticut | 1.8% | 2.0% (-0.198) | 2.1%(-0.336) |
| 36. | Kansas | 1.8% | 2.0% (-0.235) | 2.1%(-0.373) |
| 37. | Indiana | 1.8% | 2.0% (-0.236) | 2.1%(-0.374) |
| 38. | South Dakota | 1.8% | 2.0% (-0.253) | 2.1%(-0.391) |
| 39. | Idaho | 1.7% | 2.0% (-0.295) | 2.1%(-0.433) |
| 40. | Nebraska | 1.7% | 2.0% (-0.333) | 2.1%(-0.471) |
| 41. | Oregon | 1.7% | 2.0% (-0.356) | 2.1%(-0.494) |
| 42. | Michigan | 1.6% | 2.0% (-0.369) | 2.1%(-0.507) |
| 43. | Maine | 1.6% | 2.0% (-0.375) | 2.1%(-0.513) |
| 44. | Wisconsin | 1.6% | 2.0% (-0.376) | 2.1%(-0.514) |
| 45. | New Hampshire | 1.6% | 2.0% (-0.388) | 2.1%(-0.526) |
| 46. | Utah | 1.6% | 2.0% (-0.397) | 2.1%(-0.535) |
| 47. | North Dakota | 1.6% | 2.0% (-0.450) | 2.1%(-0.588) |
| 48. | Iowa | 1.4% | 2.0% (-0.638) | 2.1%(-0.776) |
| 49. | Vermont | 1.4% | 2.0% (-0.660) | 2.1%(-0.798) |
| 50. | Minnesota | 1.3% | 2.0% (-0.691) | 2.1%(-0.829) |
1
Common Questions
What are the Top 10 States with the Highest Percentage of Population Employed in Security & Protection in the United States?
Top 10 States with the Highest Percentage of Population Employed in Security & Protection in the United States are:
What state has the Highest Percentage of Population Employed in Security & Protection in the United States?
Hawaii has the Highest Percentage of Population Employed in Security & Protection in the United States with 3.4%.
What is the Percentage of Population Employed in Security & Protection in the United States?
Percentage of Population Employed in Security & Protection in the United States is 2.1%.