Cities with the Highest Percentage of Population with a Degree in Visual and Performing Arts in Oklahoma
RELATED REPORTS & OPTIONS
Visual and Performing Arts
Oklahoma
Compare Cities
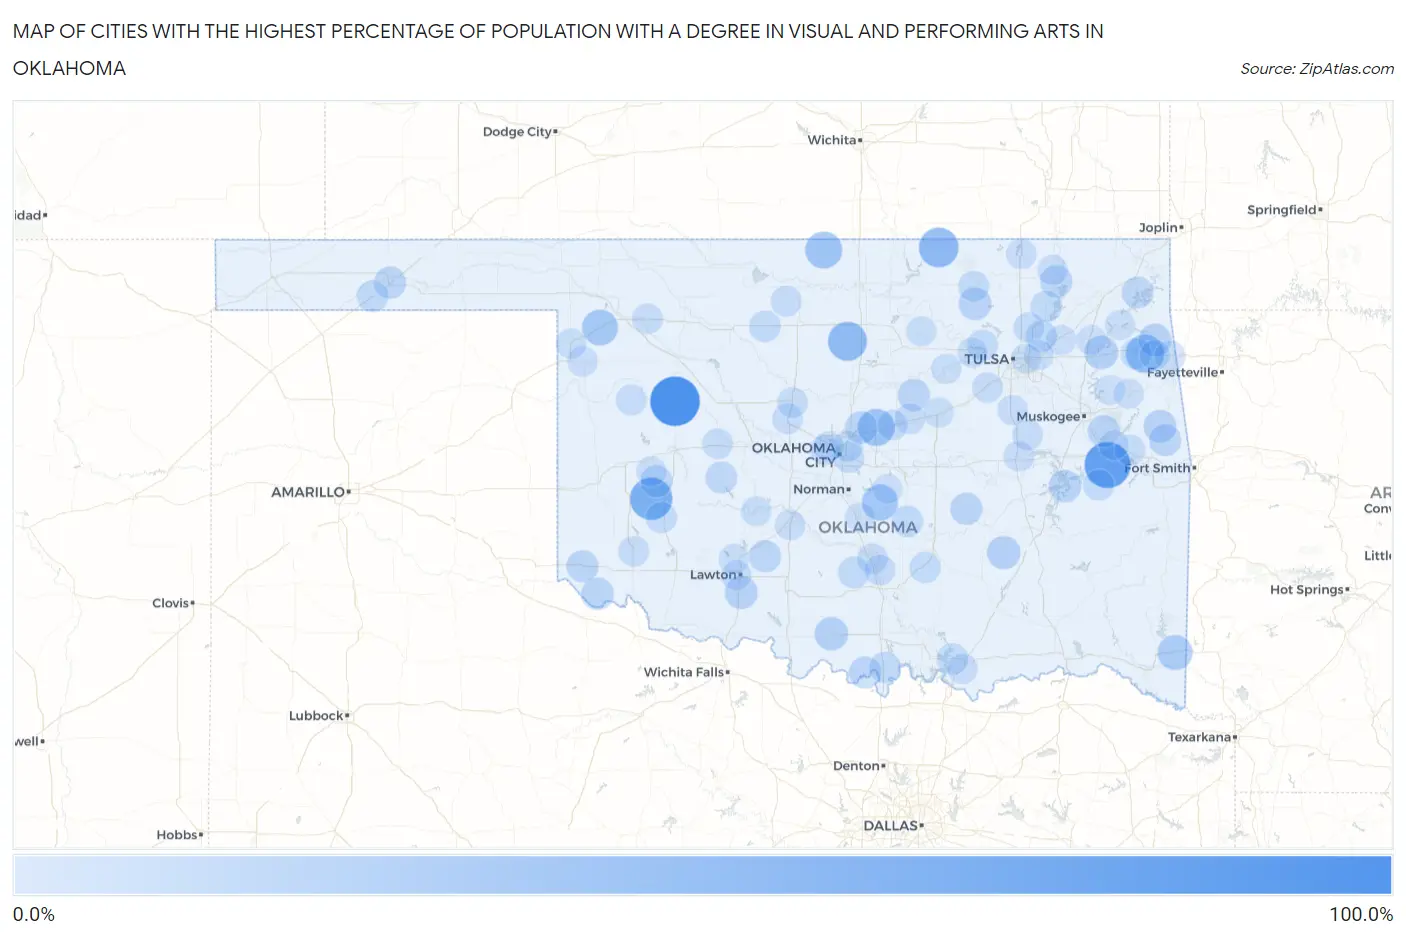
Map of Cities with the Highest Percentage of Population with a Degree in Visual and Performing Arts in Oklahoma
0.0%
100.0%
Cities with the Highest Percentage of Population with a Degree in Visual and Performing Arts in Oklahoma
| City | % Graduates | vs State | vs National | |
| 1. | Putnam | 100.0% | 2.9%(+97.1)#1 | 4.3%(+95.7)#39 |
| 2. | Simms | 81.9% | 2.9%(+79.0)#2 | 4.3%(+77.7)#52 |
| 3. | Sentinel | 63.7% | 2.9%(+60.8)#3 | 4.3%(+59.5)#69 |
| 4. | Grainola | 50.0% | 2.9%(+47.1)#4 | 4.3%(+45.7)#126 |
| 5. | Baron | 48.6% | 2.9%(+45.8)#5 | 4.3%(+44.4)#134 |
| 6. | Lucien | 47.1% | 2.9%(+44.2)#6 | 4.3%(+42.8)#140 |
| 7. | Twin Oaks | 44.0% | 2.9%(+41.1)#7 | 4.3%(+39.7)#156 |
| 8. | Luther | 37.4% | 2.9%(+34.5)#8 | 4.3%(+33.1)#201 |
| 9. | Renfrow | 37.0% | 2.9%(+34.1)#9 | 4.3%(+32.7)#205 |
| 10. | Etowah | 33.3% | 2.9%(+30.4)#10 | 4.3%(+29.1)#261 |
| 11. | Fargo | 31.2% | 2.9%(+28.4)#11 | 4.3%(+27.0)#293 |
| 12. | Eagletown | 27.3% | 2.9%(+24.4)#12 | 4.3%(+23.0)#369 |
| 13. | Sams Corner | 20.5% | 2.9%(+17.6)#13 | 4.3%(+16.2)#603 |
| 14. | Ashland | 20.0% | 2.9%(+17.1)#14 | 4.3%(+15.7)#642 |
| 15. | Ringling | 19.6% | 2.9%(+16.7)#15 | 4.3%(+15.3)#663 |
| 16. | Geronimo | 18.1% | 2.9%(+15.2)#16 | 4.3%(+13.8)#775 |
| 17. | Cloud Creek | 17.0% | 2.9%(+14.1)#17 | 4.3%(+12.7)#852 |
| 18. | Wynona | 16.7% | 2.9%(+13.8)#18 | 4.3%(+12.4)#886 |
| 19. | Greasy | 16.7% | 2.9%(+13.8)#19 | 4.3%(+12.4)#890 |
| 20. | Briartown | 16.7% | 2.9%(+13.8)#20 | 4.3%(+12.4)#902 |
| 21. | Longtown | 15.7% | 2.9%(+12.8)#21 | 4.3%(+11.5)#978 |
| 22. | Eldorado | 15.4% | 2.9%(+12.5)#22 | 4.3%(+11.1)#1,024 |
| 23. | Arcadia | 15.4% | 2.9%(+12.5)#23 | 4.3%(+11.1)#1,029 |
| 24. | Holdenville | 14.6% | 2.9%(+11.7)#24 | 4.3%(+10.4)#1,106 |
| 25. | Guymon | 14.5% | 2.9%(+11.6)#25 | 4.3%(+10.2)#1,120 |
| 26. | Agra | 14.3% | 2.9%(+11.4)#26 | 4.3%(+10.0)#1,147 |
| 27. | Sand Hill | 14.3% | 2.9%(+11.4)#27 | 4.3%(+10.0)#1,156 |
| 28. | Dill City | 14.3% | 2.9%(+11.4)#28 | 4.3%(+10.0)#1,157 |
| 29. | Stoney Point | 14.3% | 2.9%(+11.4)#29 | 4.3%(+10.0)#1,158 |
| 30. | Burneyville | 14.0% | 2.9%(+11.1)#30 | 4.3%(+9.78)#1,193 |
| 31. | Nowata | 13.8% | 2.9%(+10.9)#31 | 4.3%(+9.58)#1,219 |
| 32. | Sterling | 13.7% | 2.9%(+10.8)#32 | 4.3%(+9.47)#1,235 |
| 33. | Gould | 13.3% | 2.9%(+10.4)#33 | 4.3%(+9.08)#1,304 |
| 34. | Eakly | 12.5% | 2.9%(+9.61)#34 | 4.3%(+8.25)#1,417 |
| 35. | Bernice | 12.2% | 2.9%(+9.30)#35 | 4.3%(+7.94)#1,485 |
| 36. | Goodwell | 11.3% | 2.9%(+8.42)#36 | 4.3%(+7.06)#1,655 |
| 37. | Elmore City | 11.1% | 2.9%(+8.22)#37 | 4.3%(+6.86)#1,694 |
| 38. | Meno | 11.1% | 2.9%(+8.22)#38 | 4.3%(+6.86)#1,717 |
| 39. | Limestone | 10.8% | 2.9%(+7.92)#39 | 4.3%(+6.56)#1,794 |
| 40. | Asher | 10.5% | 2.9%(+7.63)#40 | 4.3%(+6.27)#1,892 |
| 41. | Preston | 10.3% | 2.9%(+7.45)#41 | 4.3%(+6.09)#1,953 |
| 42. | Marietta | 10.0% | 2.9%(+7.11)#42 | 4.3%(+5.75)#2,048 |
| 43. | Talala | 10.0% | 2.9%(+7.11)#43 | 4.3%(+5.75)#2,071 |
| 44. | Hobart | 9.8% | 2.9%(+6.89)#44 | 4.3%(+5.53)#2,140 |
| 45. | Fitzhugh | 9.5% | 2.9%(+6.63)#45 | 4.3%(+5.27)#2,239 |
| 46. | Leach | 9.4% | 2.9%(+6.54)#46 | 4.3%(+5.18)#2,276 |
| 47. | Whitefield | 9.4% | 2.9%(+6.48)#47 | 4.3%(+5.12)#2,298 |
| 48. | Mead | 9.4% | 2.9%(+6.48)#48 | 4.3%(+5.12)#2,299 |
| 49. | Del City | 8.5% | 2.9%(+5.56)#49 | 4.3%(+4.20)#2,722 |
| 50. | Pawhuska | 8.4% | 2.9%(+5.49)#50 | 4.3%(+4.13)#2,747 |
| 51. | Prue | 8.3% | 2.9%(+5.44)#51 | 4.3%(+4.08)#2,783 |
| 52. | Pauls Valley | 8.1% | 2.9%(+5.17)#52 | 4.3%(+3.81)#2,930 |
| 53. | Whitehorn Cove | 8.1% | 2.9%(+5.17)#53 | 4.3%(+3.81)#2,931 |
| 54. | West Siloam Springs | 8.0% | 2.9%(+5.07)#54 | 4.3%(+3.71)#2,995 |
| 55. | Leedey | 7.9% | 2.9%(+5.00)#55 | 4.3%(+3.64)#3,029 |
| 56. | Chandler | 7.9% | 2.9%(+4.96)#56 | 4.3%(+3.60)#3,055 |
| 57. | Blair | 7.7% | 2.9%(+4.80)#57 | 4.3%(+3.44)#3,152 |
| 58. | Hillsdale | 7.7% | 2.9%(+4.80)#58 | 4.3%(+3.44)#3,175 |
| 59. | Cave Spring | 7.7% | 2.9%(+4.80)#59 | 4.3%(+3.44)#3,176 |
| 60. | Wynnewood | 7.5% | 2.9%(+4.58)#60 | 4.3%(+3.22)#3,306 |
| 61. | Kellyville | 7.4% | 2.9%(+4.51)#61 | 4.3%(+3.16)#3,351 |
| 62. | Lake Aluma | 7.1% | 2.9%(+4.25)#62 | 4.3%(+2.89)#3,606 |
| 63. | Collinsville | 7.1% | 2.9%(+4.20)#63 | 4.3%(+2.84)#3,634 |
| 64. | Mooreland | 7.0% | 2.9%(+4.11)#64 | 4.3%(+2.75)#3,698 |
| 65. | Okarche | 7.0% | 2.9%(+4.08)#65 | 4.3%(+2.72)#3,722 |
| 66. | Hydro | 7.0% | 2.9%(+4.06)#66 | 4.3%(+2.70)#3,745 |
| 67. | Vian | 6.8% | 2.9%(+3.92)#67 | 4.3%(+2.57)#3,871 |
| 68. | Kingfisher | 6.7% | 2.9%(+3.84)#68 | 4.3%(+2.48)#3,971 |
| 69. | Morris | 6.7% | 2.9%(+3.81)#69 | 4.3%(+2.46)#3,991 |
| 70. | Dewar | 6.7% | 2.9%(+3.77)#70 | 4.3%(+2.41)#4,027 |
| 71. | Copan | 6.2% | 2.9%(+3.36)#71 | 4.3%(+2.00)#4,432 |
| 72. | Calera | 6.1% | 2.9%(+3.22)#72 | 4.3%(+1.86)#4,578 |
| 73. | Arnett | 6.0% | 2.9%(+3.12)#73 | 4.3%(+1.76)#4,707 |
| 74. | Wellston | 6.0% | 2.9%(+3.11)#74 | 4.3%(+1.75)#4,726 |
| 75. | Ninnekah | 5.7% | 2.9%(+2.77)#75 | 4.3%(+1.41)#5,109 |
| 76. | Delaware | 5.6% | 2.9%(+2.66)#76 | 4.3%(+1.30)#5,248 |
| 77. | Pawnee | 5.5% | 2.9%(+2.56)#77 | 4.3%(+1.20)#5,363 |
| 78. | Oilton | 5.5% | 2.9%(+2.56)#78 | 4.3%(+1.20)#5,367 |
| 79. | Woodlawn Park | 5.4% | 2.9%(+2.51)#79 | 4.3%(+1.15)#5,443 |
| 80. | Shattuck | 5.3% | 2.9%(+2.45)#80 | 4.3%(+1.09)#5,522 |
| 81. | Anadarko | 5.3% | 2.9%(+2.45)#81 | 4.3%(+1.09)#5,525 |
| 82. | Stroud | 5.2% | 2.9%(+2.30)#82 | 4.3%(+0.943)#5,710 |
| 83. | Medicine Park | 5.2% | 2.9%(+2.30)#83 | 4.3%(+0.943)#5,715 |
| 84. | Winchester | 5.1% | 2.9%(+2.23)#84 | 4.3%(+0.876)#5,813 |
| 85. | Lawton | 5.1% | 2.9%(+2.21)#85 | 4.3%(+0.854)#5,836 |
| 86. | Flint Creek | 4.9% | 2.9%(+2.05)#86 | 4.3%(+0.693)#6,089 |
| 87. | Hulbert | 4.8% | 2.9%(+1.87)#87 | 4.3%(+0.510)#6,420 |
| 88. | Spavinaw | 4.8% | 2.9%(+1.87)#88 | 4.3%(+0.510)#6,422 |
| 89. | Taylor Ferry | 4.7% | 2.9%(+1.84)#89 | 4.3%(+0.485)#6,472 |
| 90. | Justice | 4.7% | 2.9%(+1.83)#90 | 4.3%(+0.475)#6,491 |
| 91. | Burns Flat | 4.7% | 2.9%(+1.80)#91 | 4.3%(+0.446)#6,534 |
| 92. | Warr Acres | 4.7% | 2.9%(+1.79)#92 | 4.3%(+0.432)#6,568 |
| 93. | Gore | 4.5% | 2.9%(+1.61)#93 | 4.3%(+0.248)#6,910 |
| 94. | Westport | 4.5% | 2.9%(+1.60)#94 | 4.3%(+0.242)#6,921 |
| 95. | Tahlequah | 4.5% | 2.9%(+1.57)#95 | 4.3%(+0.213)#6,977 |
| 96. | Catoosa | 4.3% | 2.9%(+1.45)#96 | 4.3%(+0.096)#7,179 |
| 97. | Lexington | 4.3% | 2.9%(+1.45)#97 | 4.3%(+0.096)#7,182 |
| 98. | Pink | 4.3% | 2.9%(+1.43)#98 | 4.3%(+0.075)#7,241 |
| 99. | Pryor Creek | 4.3% | 2.9%(+1.41)#99 | 4.3%(+0.056)#7,286 |
| 100. | Tulsa | 4.3% | 2.9%(+1.40)#100 | 4.3%(+0.040)#7,312 |
Common Questions
What are the Top 10 Cities with the Highest Percentage of Population with a Degree in Visual and Performing Arts in Oklahoma?
Top 10 Cities with the Highest Percentage of Population with a Degree in Visual and Performing Arts in Oklahoma are:
What city has the Highest Percentage of Population with a Degree in Visual and Performing Arts in Oklahoma?
Putnam has the Highest Percentage of Population with a Degree in Visual and Performing Arts in Oklahoma with 100.0%.
What is the Percentage of Population with a Degree in Visual and Performing Arts in the State of Oklahoma?
Percentage of Population with a Degree in Visual and Performing Arts in Oklahoma is 2.9%.
What is the Percentage of Population with a Degree in Visual and Performing Arts in the United States?
Percentage of Population with a Degree in Visual and Performing Arts in the United States is 4.3%.