Three Rivers, CA Map & Demographics
Three Rivers Map
Three Rivers Overview
$53,090
PER CAPITA INCOME
$93,708
AVG FAMILY INCOME
$78,590
AVG HOUSEHOLD INCOME
53.5%
WAGE / INCOME GAP [ % ]
46.5¢/ $1
WAGE / INCOME GAP [ $ ]
0.44
INEQUALITY / GINI INDEX
2,496
TOTAL POPULATION
1,365
MALE POPULATION
1,131
FEMALE POPULATION
120.69
MALES / 100 FEMALES
82.86
FEMALES / 100 MALES
52.5
MEDIAN AGE
2.5
AVG FAMILY SIZE
2.0
AVG HOUSEHOLD SIZE
1,287
LABOR FORCE [ PEOPLE ]
60.4%
PERCENT IN LABOR FORCE
4.2%
UNEMPLOYMENT RATE
Three Rivers Zip Codes
Three Rivers Area Codes
Income in Three Rivers
Income Overview in Three Rivers
Per Capita Income in Three Rivers is $53,090, while median incomes of families and households are $93,708 and $78,590 respectively.
| Characteristic | Number | Measure |
| Per Capita Income | 2,496 | $53,090 |
| Median Family Income | 743 | $93,708 |
| Mean Family Income | 743 | $134,155 |
| Median Household Income | 1,267 | $78,590 |
| Mean Household Income | 1,267 | $102,367 |
| Income Deficit | 743 | $0 |
| Wage / Income Gap (%) | 2,496 | 53.47% |
| Wage / Income Gap ($) | 2,496 | 46.53¢ per $1 |
| Gini / Inequality Index | 2,496 | 0.44 |
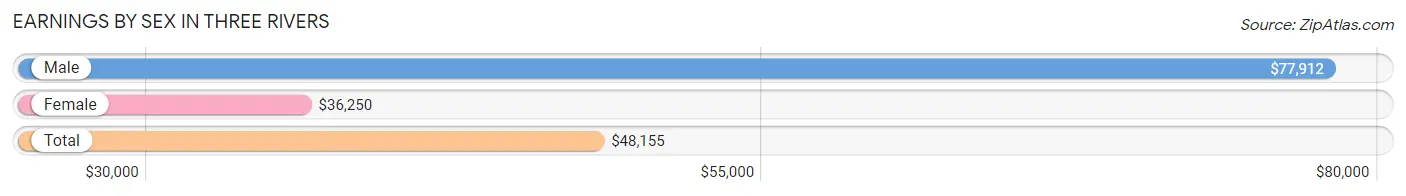
Earnings by Sex in Three Rivers
Average Earnings in Three Rivers are $48,155, $77,912 for men and $36,250 for women, a difference of 53.5%.
| Sex | Number | Average Earnings |
| Male | 782 (56.2%) | $77,912 |
| Female | 609 (43.8%) | $36,250 |
| Total | 1,391 (100.0%) | $48,155 |
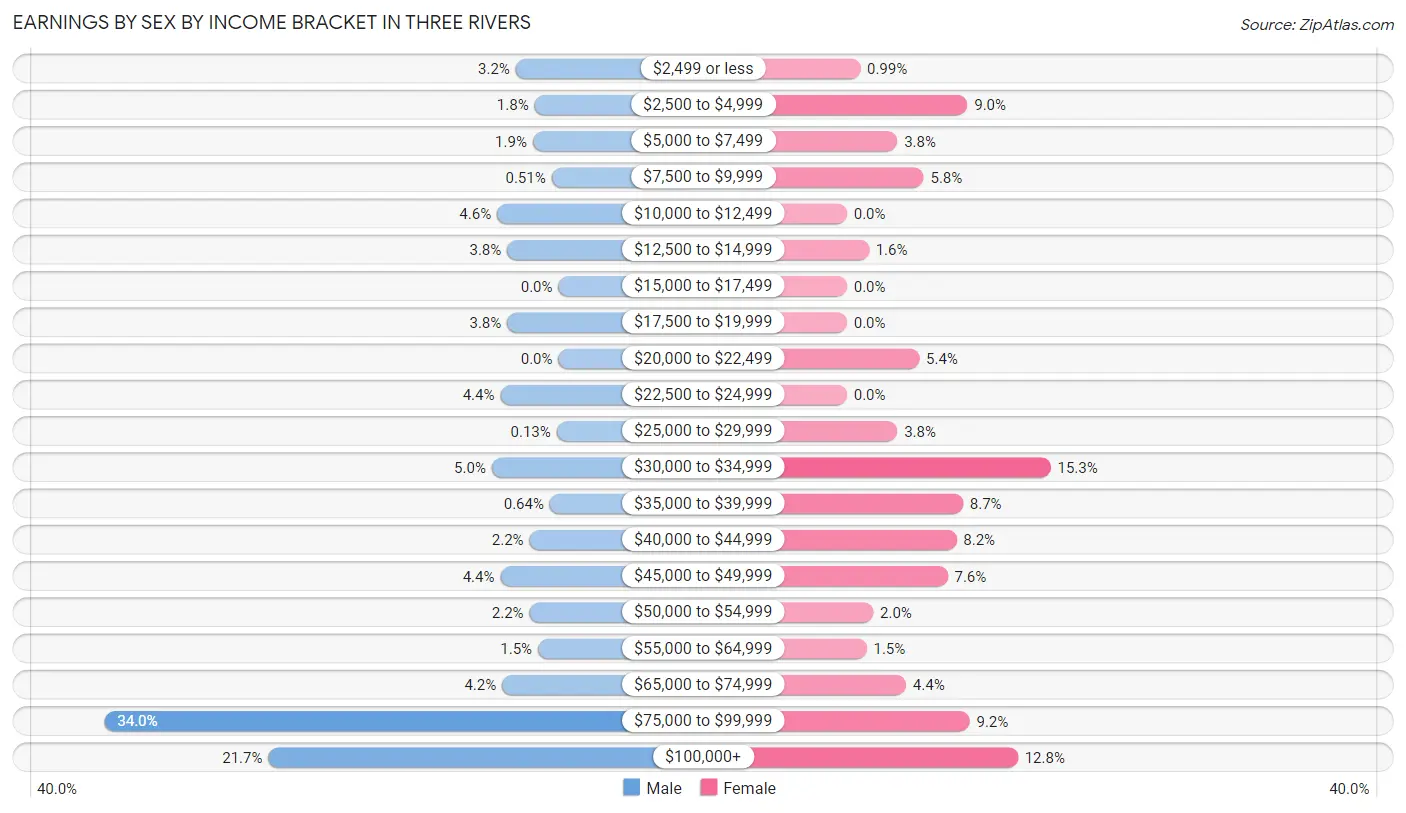
Earnings by Sex by Income Bracket in Three Rivers
The most common earnings brackets in Three Rivers are $75,000 to $99,999 for men (266 | 34.0%) and $30,000 to $34,999 for women (93 | 15.3%).
| Income | Male | Female |
| $2,499 or less | 25 (3.2%) | 6 (1.0%) |
| $2,500 to $4,999 | 14 (1.8%) | 55 (9.0%) |
| $5,000 to $7,499 | 15 (1.9%) | 23 (3.8%) |
| $7,500 to $9,999 | 4 (0.5%) | 35 (5.8%) |
| $10,000 to $12,499 | 36 (4.6%) | 0 (0.0%) |
| $12,500 to $14,999 | 30 (3.8%) | 10 (1.6%) |
| $15,000 to $17,499 | 0 (0.0%) | 0 (0.0%) |
| $17,500 to $19,999 | 30 (3.8%) | 0 (0.0%) |
| $20,000 to $22,499 | 0 (0.0%) | 33 (5.4%) |
| $22,500 to $24,999 | 34 (4.3%) | 0 (0.0%) |
| $25,000 to $29,999 | 1 (0.1%) | 23 (3.8%) |
| $30,000 to $34,999 | 39 (5.0%) | 93 (15.3%) |
| $35,000 to $39,999 | 5 (0.6%) | 53 (8.7%) |
| $40,000 to $44,999 | 17 (2.2%) | 50 (8.2%) |
| $45,000 to $49,999 | 34 (4.3%) | 46 (7.5%) |
| $50,000 to $54,999 | 17 (2.2%) | 12 (2.0%) |
| $55,000 to $64,999 | 12 (1.5%) | 9 (1.5%) |
| $65,000 to $74,999 | 33 (4.2%) | 27 (4.4%) |
| $75,000 to $99,999 | 266 (34.0%) | 56 (9.2%) |
| $100,000+ | 170 (21.7%) | 78 (12.8%) |
| Total | 782 (100.0%) | 609 (100.0%) |
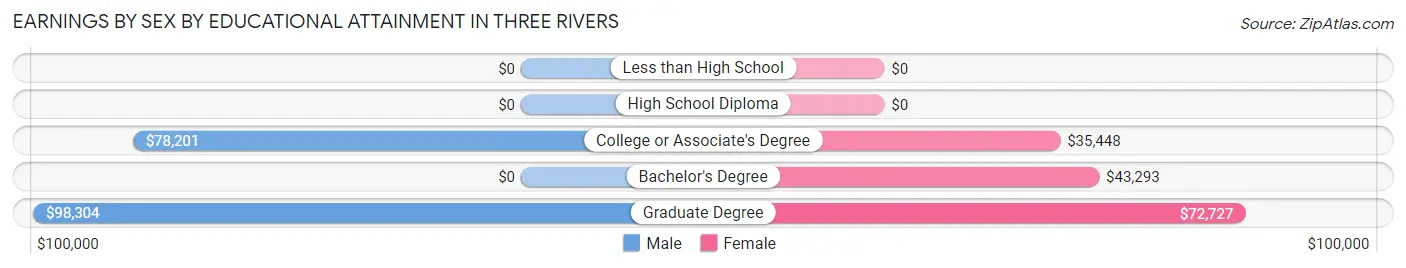
Earnings by Sex by Educational Attainment in Three Rivers
Average earnings in Three Rivers are $78,270 for men and $36,274 for women, a difference of 53.7%. Men with an educational attainment of graduate degree enjoy the highest average annual earnings of $98,304, while those with college or associate's degree education earn the least with $78,201. Women with an educational attainment of graduate degree earn the most with the average annual earnings of $72,727, while those with college or associate's degree education have the smallest earnings of $35,448.
| Educational Attainment | Male Income | Female Income |
| Less than High School | - | - |
| High School Diploma | - | - |
| College or Associate's Degree | $78,201 | $35,448 |
| Bachelor's Degree | - | - |
| Graduate Degree | $98,304 | $72,727 |
| Total | $78,270 | $36,274 |
Family Income in Three Rivers
Family Income Brackets in Three Rivers
According to the Three Rivers family income data, there are 239 families falling into the $75,000 to $99,999 income range, which is the most common income bracket and makes up 32.2% of all families.
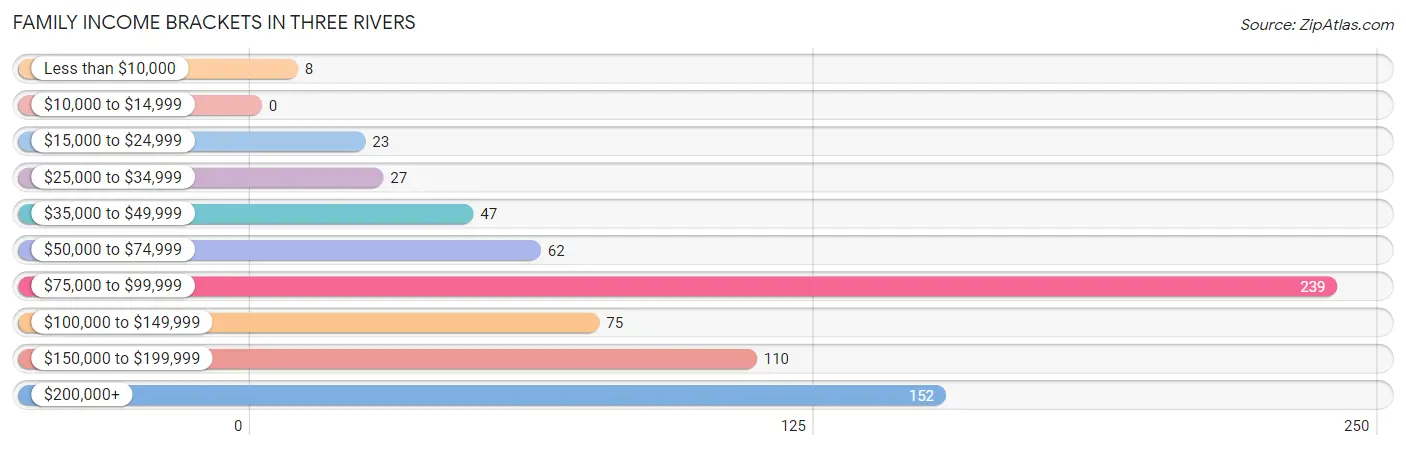
| Income Bracket | # Families | % Families |
| Less than $10,000 | 8 | 1.1% |
| $10,000 to $14,999 | 0 | 0.0% |
| $15,000 to $24,999 | 23 | 3.1% |
| $25,000 to $34,999 | 27 | 3.6% |
| $35,000 to $49,999 | 47 | 6.3% |
| $50,000 to $74,999 | 62 | 8.3% |
| $75,000 to $99,999 | 239 | 32.2% |
| $100,000 to $149,999 | 75 | 10.1% |
| $150,000 to $199,999 | 110 | 14.8% |
| $200,000+ | 152 | 20.5% |
Family Income by Famaliy Size in Three Rivers
4-person families (72 | 9.7%) account for the highest median family income in Three Rivers with $162,857 per family, while 2-person families (368 | 49.5%) have the highest median income of $54,375 per family member.
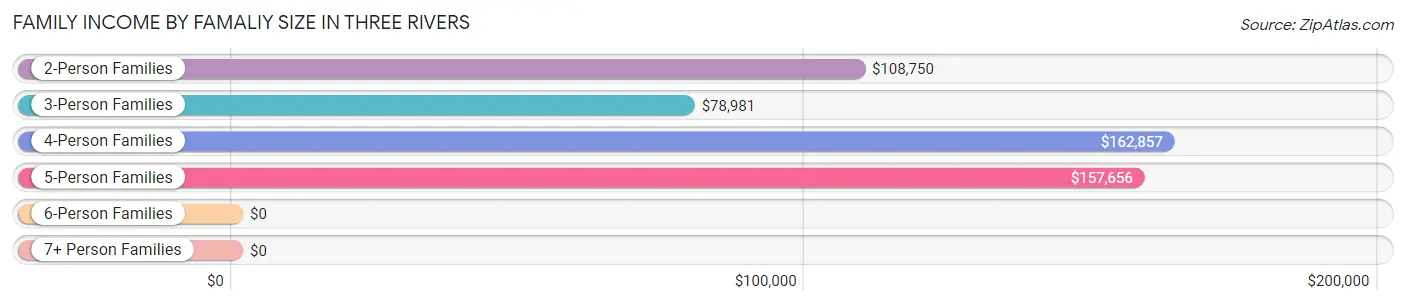
| Income Bracket | # Families | Median Income |
| 2-Person Families | 368 (49.5%) | $108,750 |
| 3-Person Families | 276 (37.1%) | $78,981 |
| 4-Person Families | 72 (9.7%) | $162,857 |
| 5-Person Families | 27 (3.6%) | $157,656 |
| 6-Person Families | 0 (0.0%) | $0 |
| 7+ Person Families | 0 (0.0%) | $0 |
| Total | 743 (100.0%) | $93,708 |
Family Income by Number of Earners in Three Rivers

| Number of Earners | # Families | Median Income |
| No Earners | 93 (12.5%) | $0 |
| 1 Earner | 308 (41.4%) | $79,268 |
| 2 Earners | 319 (42.9%) | $151,875 |
| 3+ Earners | 23 (3.1%) | $0 |
| Total | 743 (100.0%) | $93,708 |
Household Income in Three Rivers
Household Income Brackets in Three Rivers
With 286 households falling in the category, the $75,000 to $99,999 income range is the most frequent in Three Rivers, accounting for 22.6% of all households. In contrast, only 60 households (4.7%) fall into the less than $10,000 income bracket, making it the least populous group.
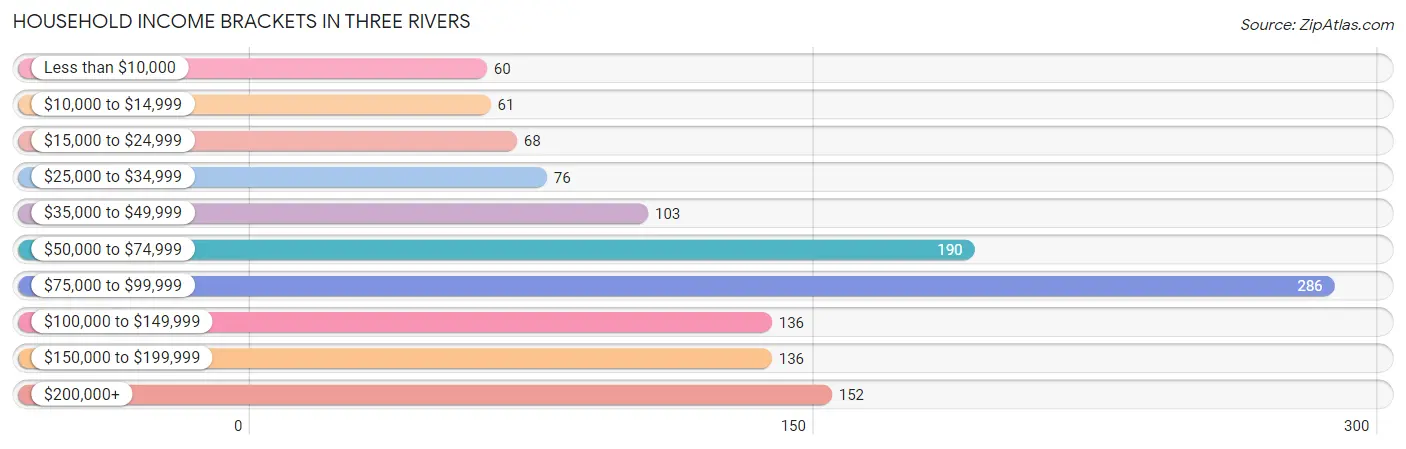
| Income Bracket | # Households | % Households |
| Less than $10,000 | 60 | 4.7% |
| $10,000 to $14,999 | 61 | 4.8% |
| $15,000 to $24,999 | 68 | 5.4% |
| $25,000 to $34,999 | 76 | 6.0% |
| $35,000 to $49,999 | 103 | 8.1% |
| $50,000 to $74,999 | 190 | 15.0% |
| $75,000 to $99,999 | 286 | 22.6% |
| $100,000 to $149,999 | 136 | 10.7% |
| $150,000 to $199,999 | 136 | 10.7% |
| $200,000+ | 152 | 12.0% |
Household Income by Householder Age in Three Rivers
The median household income in Three Rivers is $78,590, with the highest median household income of $79,132 found in the 45 to 64 years age bracket for the primary householder. A total of 653 households (51.5%) fall into this category. Meanwhile, the 15 to 24 years age bracket for the primary householder has the lowest median household income of $0, with 13 households (1.0%) in this group.
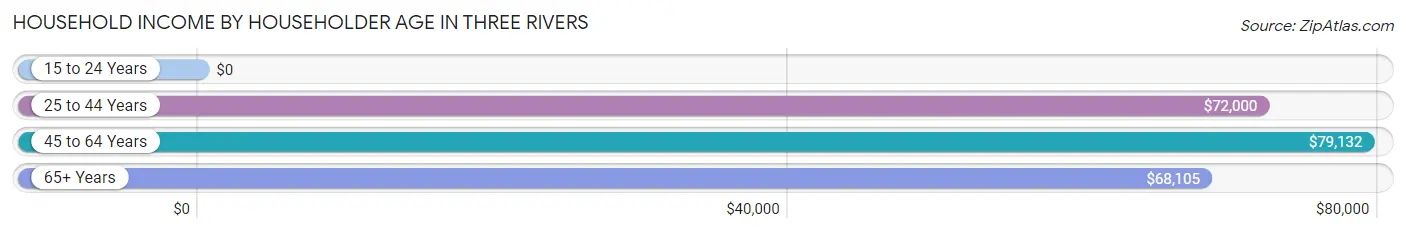
| Income Bracket | # Households | Median Income |
| 15 to 24 Years | 13 (1.0%) | $0 |
| 25 to 44 Years | 188 (14.8%) | $72,000 |
| 45 to 64 Years | 653 (51.5%) | $79,132 |
| 65+ Years | 413 (32.6%) | $68,105 |
| Total | 1,267 (100.0%) | $78,590 |
Poverty in Three Rivers
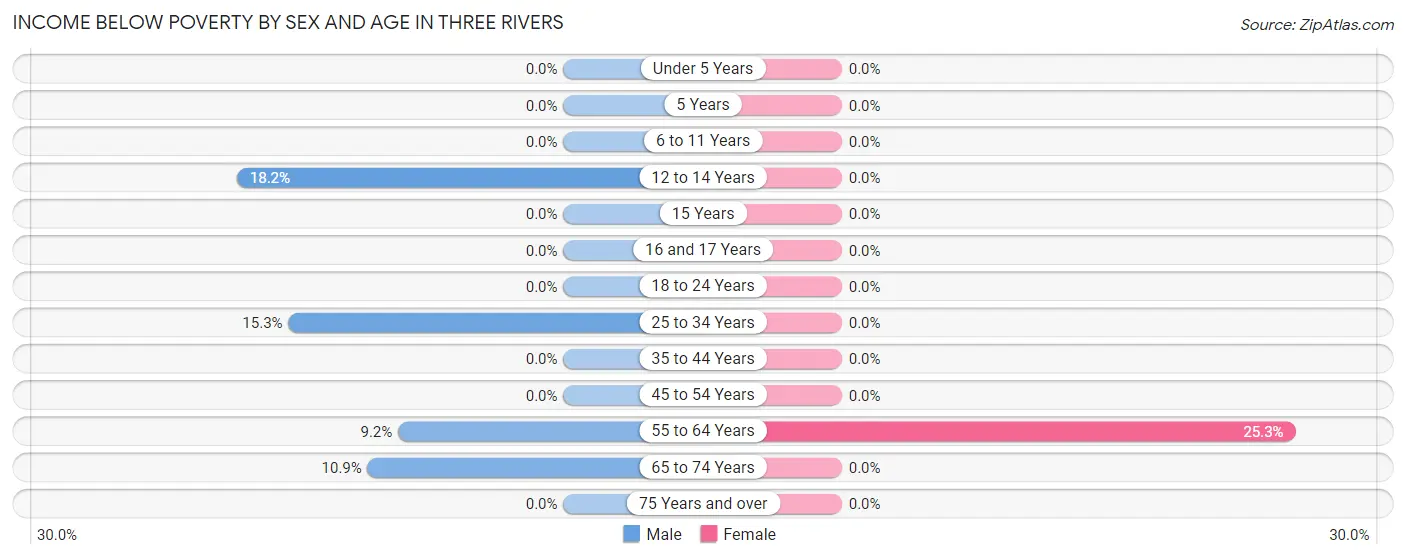
Income Below Poverty by Sex and Age in Three Rivers
With 5.6% poverty level for males and 6.5% for females among the residents of Three Rivers, 12 to 14 year old males and 55 to 64 year old females are the most vulnerable to poverty, with 10 males (18.2%) and 73 females (25.3%) in their respective age groups living below the poverty level.
| Age Bracket | Male | Female |
| Under 5 Years | 0 (0.0%) | 0 (0.0%) |
| 5 Years | 0 (0.0%) | 0 (0.0%) |
| 6 to 11 Years | 0 (0.0%) | 0 (0.0%) |
| 12 to 14 Years | 10 (18.2%) | 0 (0.0%) |
| 15 Years | 0 (0.0%) | 0 (0.0%) |
| 16 and 17 Years | 0 (0.0%) | 0 (0.0%) |
| 18 to 24 Years | 0 (0.0%) | 0 (0.0%) |
| 25 to 34 Years | 15 (15.3%) | 0 (0.0%) |
| 35 to 44 Years | 0 (0.0%) | 0 (0.0%) |
| 45 to 54 Years | 0 (0.0%) | 0 (0.0%) |
| 55 to 64 Years | 23 (9.2%) | 73 (25.3%) |
| 65 to 74 Years | 29 (10.9%) | 0 (0.0%) |
| 75 Years and over | 0 (0.0%) | 0 (0.0%) |
| Total | 77 (5.6%) | 73 (6.5%) |
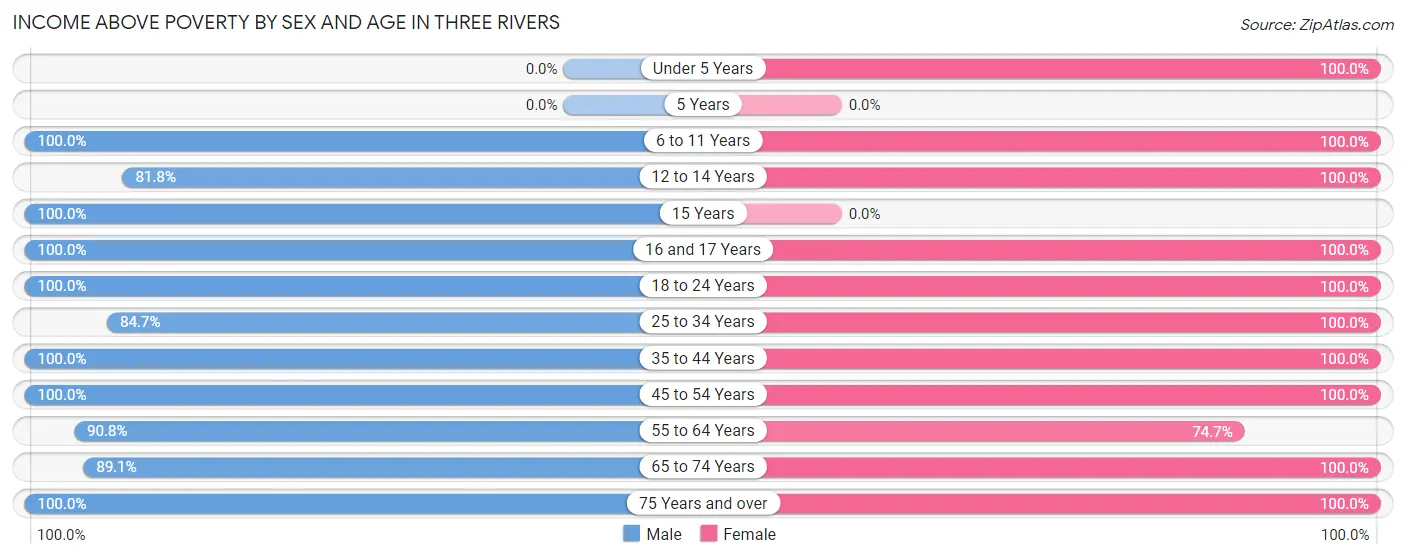
Income Above Poverty by Sex and Age in Three Rivers
According to the poverty statistics in Three Rivers, males aged 6 to 11 years and females aged under 5 years are the age groups that are most secure financially, with 100.0% of males and 100.0% of females in these age groups living above the poverty line.
| Age Bracket | Male | Female |
| Under 5 Years | 0 (0.0%) | 21 (100.0%) |
| 5 Years | 0 (0.0%) | 0 (0.0%) |
| 6 to 11 Years | 103 (100.0%) | 85 (100.0%) |
| 12 to 14 Years | 45 (81.8%) | 63 (100.0%) |
| 15 Years | 38 (100.0%) | 0 (0.0%) |
| 16 and 17 Years | 38 (100.0%) | 1 (100.0%) |
| 18 to 24 Years | 49 (100.0%) | 14 (100.0%) |
| 25 to 34 Years | 83 (84.7%) | 106 (100.0%) |
| 35 to 44 Years | 72 (100.0%) | 97 (100.0%) |
| 45 to 54 Years | 336 (100.0%) | 143 (100.0%) |
| 55 to 64 Years | 227 (90.8%) | 216 (74.7%) |
| 65 to 74 Years | 237 (89.1%) | 207 (100.0%) |
| 75 Years and over | 60 (100.0%) | 105 (100.0%) |
| Total | 1,288 (94.4%) | 1,058 (93.5%) |
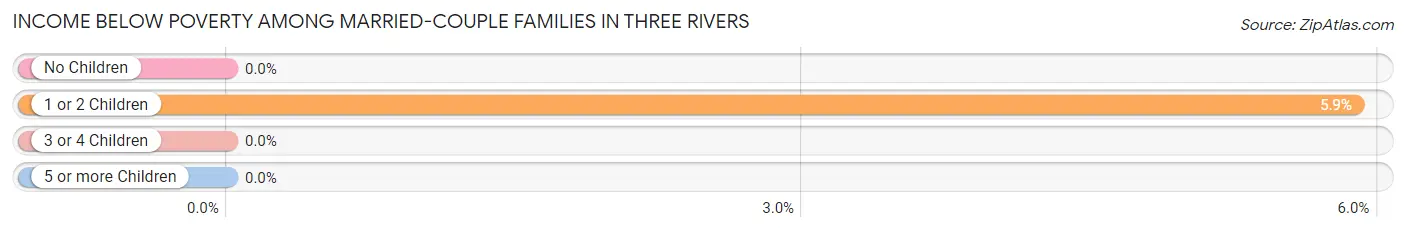
Income Below Poverty Among Married-Couple Families in Three Rivers
The poverty statistics for married-couple families in Three Rivers show that 1.5% or 8 of the total 530 families live below the poverty line. Families with 1 or 2 children have the highest poverty rate of 5.9%, comprising of 8 families. On the other hand, families with no children have the lowest poverty rate of 0.0%, which includes 0 families.
| Children | Above Poverty | Below Poverty |
| No Children | 373 (100.0%) | 0 (0.0%) |
| 1 or 2 Children | 128 (94.1%) | 8 (5.9%) |
| 3 or 4 Children | 21 (100.0%) | 0 (0.0%) |
| 5 or more Children | 0 (0.0%) | 0 (0.0%) |
| Total | 522 (98.5%) | 8 (1.5%) |
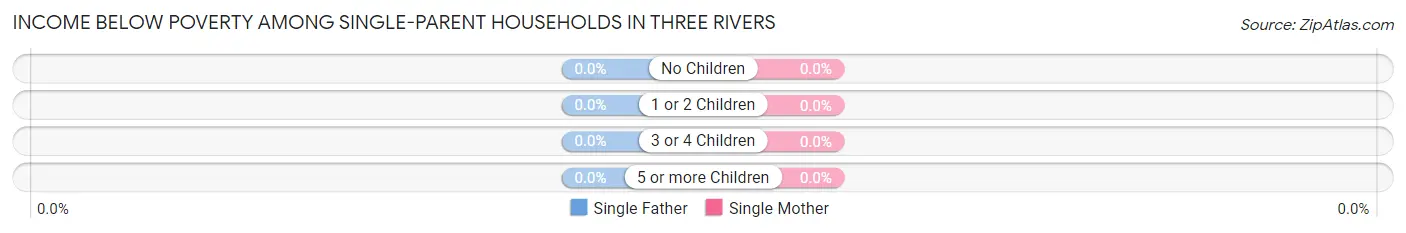
Income Below Poverty Among Single-Parent Households in Three Rivers
| Children | Single Father | Single Mother |
| No Children | 0 (0.0%) | 0 (0.0%) |
| 1 or 2 Children | 0 (0.0%) | 0 (0.0%) |
| 3 or 4 Children | 0 (0.0%) | 0 (0.0%) |
| 5 or more Children | 0 (0.0%) | 0 (0.0%) |
| Total | 0 (0.0%) | 0 (0.0%) |
Income Below Poverty Among Married-Couple vs Single-Parent Households in Three Rivers
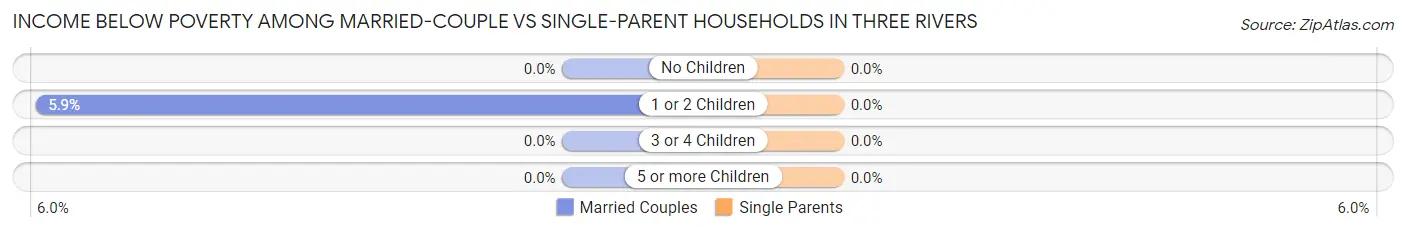
| Children | Married-Couple Families | Single-Parent Households |
| No Children | 0 (0.0%) | 0 (0.0%) |
| 1 or 2 Children | 8 (5.9%) | 0 (0.0%) |
| 3 or 4 Children | 0 (0.0%) | 0 (0.0%) |
| 5 or more Children | 0 (0.0%) | 0 (0.0%) |
| Total | 8 (1.5%) | 0 (0.0%) |
Race in Three Rivers
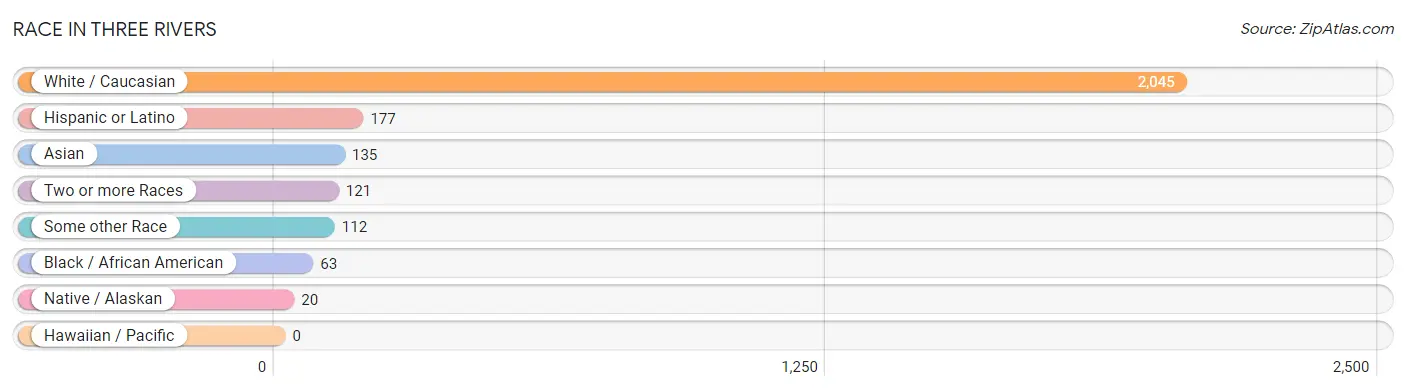
The most populous races in Three Rivers are White / Caucasian (2,045 | 81.9%), Hispanic or Latino (177 | 7.1%), and Asian (135 | 5.4%).
| Race | # Population | % Population |
| Asian | 135 | 5.4% |
| Black / African American | 63 | 2.5% |
| Hawaiian / Pacific | 0 | 0.0% |
| Hispanic or Latino | 177 | 7.1% |
| Native / Alaskan | 20 | 0.8% |
| White / Caucasian | 2,045 | 81.9% |
| Two or more Races | 121 | 4.9% |
| Some other Race | 112 | 4.5% |
| Total | 2,496 | 100.0% |
Ancestry in Three Rivers
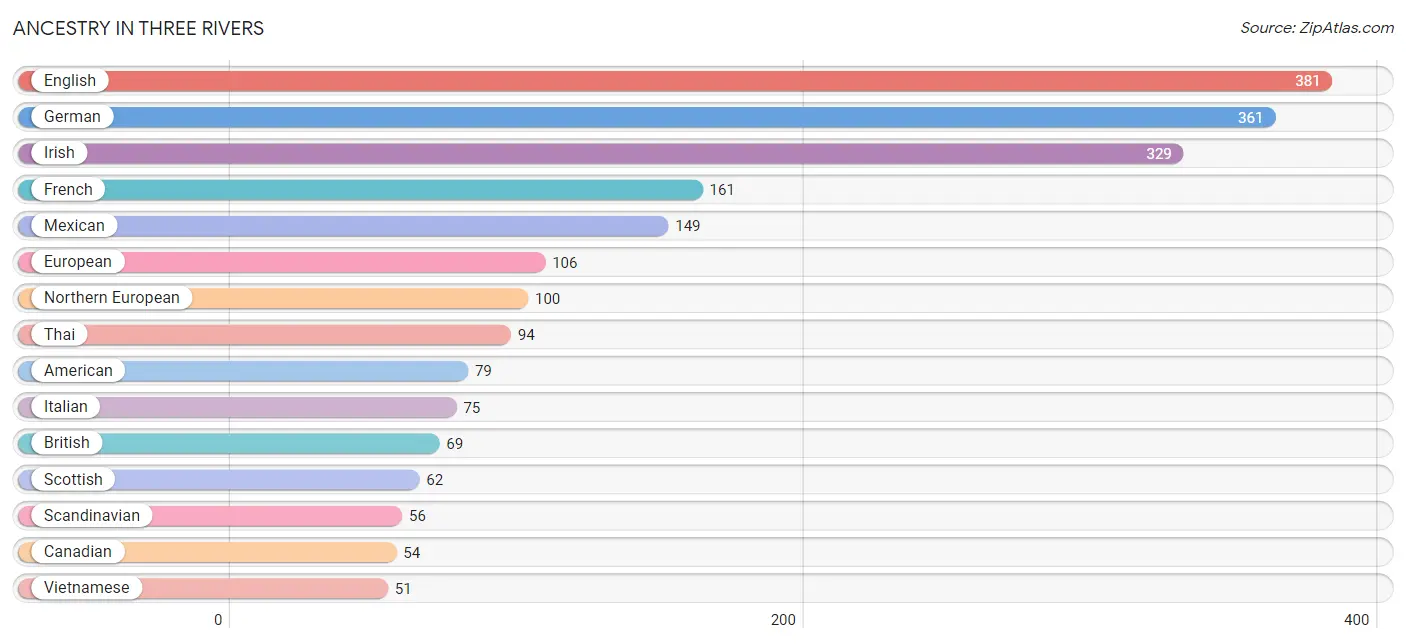
The most populous ancestries reported in Three Rivers are English (381 | 15.3%), German (361 | 14.5%), Irish (329 | 13.2%), French (161 | 6.5%), and Mexican (149 | 6.0%), together accounting for 55.3% of all Three Rivers residents.
| Ancestry | # Population | % Population |
| American | 79 | 3.2% |
| Austrian | 13 | 0.5% |
| British | 69 | 2.8% |
| Burmese | 6 | 0.2% |
| Canadian | 54 | 2.2% |
| Cherokee | 35 | 1.4% |
| Croatian | 8 | 0.3% |
| Czech | 23 | 0.9% |
| Danish | 12 | 0.5% |
| Dutch | 20 | 0.8% |
| English | 381 | 15.3% |
| Estonian | 7 | 0.3% |
| European | 106 | 4.3% |
| Finnish | 19 | 0.8% |
| French | 161 | 6.5% |
| German | 361 | 14.5% |
| Greek | 14 | 0.6% |
| Hungarian | 9 | 0.4% |
| Indian (Asian) | 18 | 0.7% |
| Irish | 329 | 13.2% |
| Italian | 75 | 3.0% |
| Korean | 4 | 0.2% |
| Lithuanian | 26 | 1.0% |
| Mexican | 149 | 6.0% |
| Navajo | 7 | 0.3% |
| Northern European | 100 | 4.0% |
| Norwegian | 40 | 1.6% |
| Pakistani | 3 | 0.1% |
| Peruvian | 16 | 0.6% |
| Polish | 6 | 0.2% |
| Portuguese | 15 | 0.6% |
| Russian | 18 | 0.7% |
| Scandinavian | 56 | 2.2% |
| Scottish | 62 | 2.5% |
| Slovak | 9 | 0.4% |
| South American | 16 | 0.6% |
| Swedish | 31 | 1.2% |
| Swiss | 27 | 1.1% |
| Thai | 94 | 3.8% |
| Ukrainian | 24 | 1.0% |
| Vietnamese | 51 | 2.0% |
| Welsh | 6 | 0.2% | View All 42 Rows |
Immigrants in Three Rivers
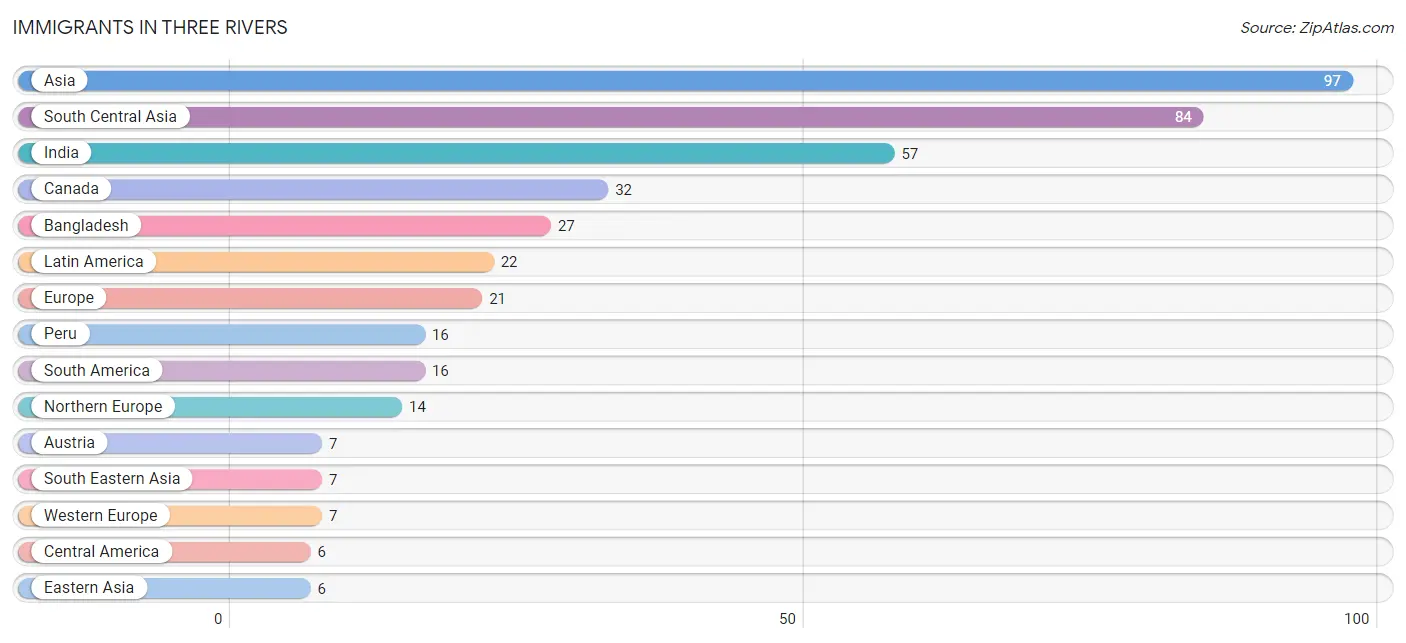
The most numerous immigrant groups reported in Three Rivers came from Asia (97 | 3.9%), South Central Asia (84 | 3.4%), India (57 | 2.3%), Canada (32 | 1.3%), and Bangladesh (27 | 1.1%), together accounting for 11.9% of all Three Rivers residents.
| Immigration Origin | # Population | % Population |
| Asia | 97 | 3.9% |
| Austria | 7 | 0.3% |
| Bangladesh | 27 | 1.1% |
| Canada | 32 | 1.3% |
| Central America | 6 | 0.2% |
| Eastern Asia | 6 | 0.2% |
| Europe | 21 | 0.8% |
| India | 57 | 2.3% |
| Korea | 6 | 0.2% |
| Latin America | 22 | 0.9% |
| Mexico | 6 | 0.2% |
| Northern Europe | 14 | 0.6% |
| Peru | 16 | 0.6% |
| Philippines | 4 | 0.2% |
| South America | 16 | 0.6% |
| South Central Asia | 84 | 3.4% |
| South Eastern Asia | 7 | 0.3% |
| Thailand | 3 | 0.1% |
| Western Europe | 7 | 0.3% | View All 19 Rows |
Sex and Age in Three Rivers
Sex and Age in Three Rivers
The most populous age groups in Three Rivers are 45 to 49 Years (221 | 16.2%) for men and 55 to 59 Years (181 | 16.0%) for women.
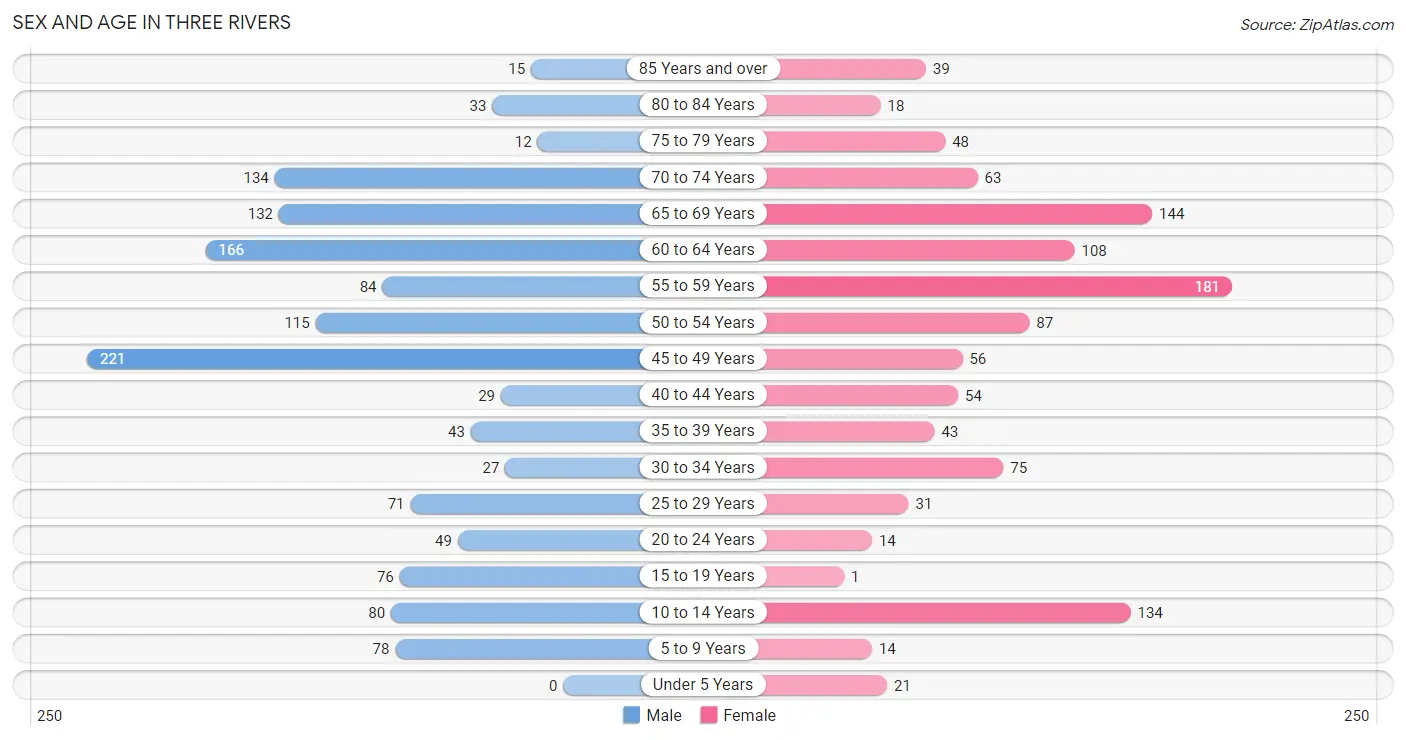
| Age Bracket | Male | Female |
| Under 5 Years | 0 (0.0%) | 21 (1.9%) |
| 5 to 9 Years | 78 (5.7%) | 14 (1.2%) |
| 10 to 14 Years | 80 (5.9%) | 134 (11.8%) |
| 15 to 19 Years | 76 (5.6%) | 1 (0.1%) |
| 20 to 24 Years | 49 (3.6%) | 14 (1.2%) |
| 25 to 29 Years | 71 (5.2%) | 31 (2.7%) |
| 30 to 34 Years | 27 (2.0%) | 75 (6.6%) |
| 35 to 39 Years | 43 (3.2%) | 43 (3.8%) |
| 40 to 44 Years | 29 (2.1%) | 54 (4.8%) |
| 45 to 49 Years | 221 (16.2%) | 56 (5.0%) |
| 50 to 54 Years | 115 (8.4%) | 87 (7.7%) |
| 55 to 59 Years | 84 (6.1%) | 181 (16.0%) |
| 60 to 64 Years | 166 (12.2%) | 108 (9.6%) |
| 65 to 69 Years | 132 (9.7%) | 144 (12.7%) |
| 70 to 74 Years | 134 (9.8%) | 63 (5.6%) |
| 75 to 79 Years | 12 (0.9%) | 48 (4.2%) |
| 80 to 84 Years | 33 (2.4%) | 18 (1.6%) |
| 85 Years and over | 15 (1.1%) | 39 (3.5%) |
| Total | 1,365 (100.0%) | 1,131 (100.0%) |
Families and Households in Three Rivers
Median Family Size in Three Rivers
The median family size in Three Rivers is 2.52 persons per family, with married-couple families (530 | 71.3%) accounting for the largest median family size of 2.76 persons per family. On the other hand, single male/father families (185 | 24.9%) represent the smallest median family size with 1.86 persons per family.
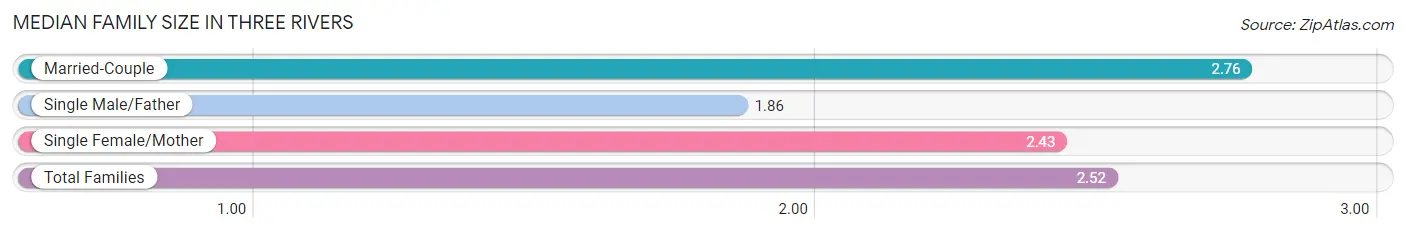
| Family Type | # Families | Family Size |
| Married-Couple | 530 (71.3%) | 2.76 |
| Single Male/Father | 185 (24.9%) | 1.86 |
| Single Female/Mother | 28 (3.8%) | 2.43 |
| Total Families | 743 (100.0%) | 2.52 |
Median Household Size in Three Rivers
The median household size in Three Rivers is 1.97 persons per household, with married-couple households (530 | 41.8%) accounting for the largest median household size of 2.79 persons per household. non-family households (524 | 41.4%) represent the smallest median household size with 1.15 persons per household.
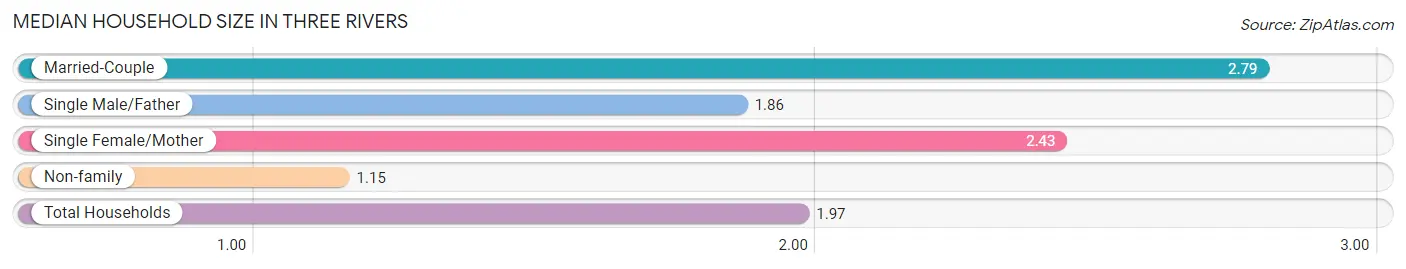
| Household Type | # Households | Household Size |
| Married-Couple | 530 (41.8%) | 2.79 |
| Single Male/Father | 185 (14.6%) | 1.86 |
| Single Female/Mother | 28 (2.2%) | 2.43 |
| Non-family | 524 (41.4%) | 1.15 |
| Total Households | 1,267 (100.0%) | 1.97 |
Household Size by Marriage Status in Three Rivers
Out of a total of 1,267 households in Three Rivers, 743 (58.6%) are family households, while 524 (41.4%) are nonfamily households. The most numerous type of family households are 2-person households, comprising 360, and the most common type of nonfamily households are 1-person households, comprising 461.
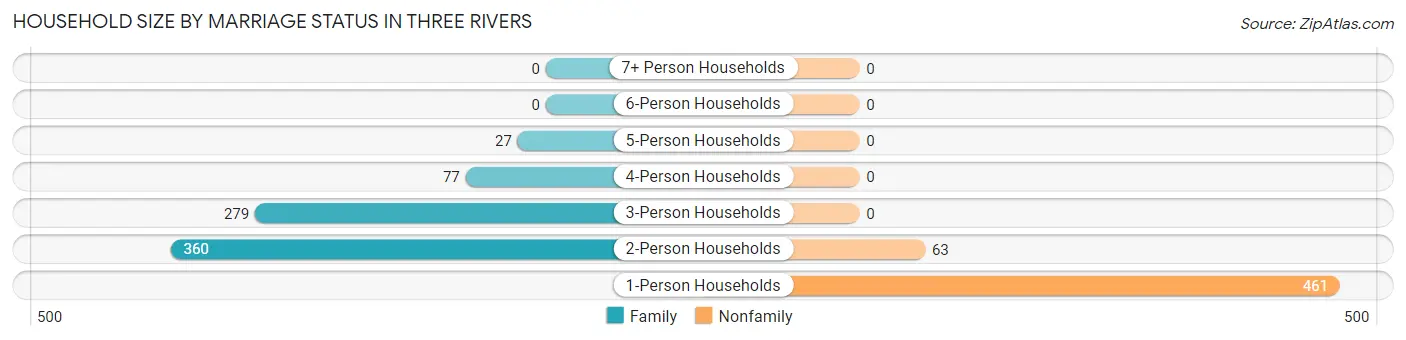
| Household Size | Family Households | Nonfamily Households |
| 1-Person Households | - | 461 (36.4%) |
| 2-Person Households | 360 (28.4%) | 63 (5.0%) |
| 3-Person Households | 279 (22.0%) | 0 (0.0%) |
| 4-Person Households | 77 (6.1%) | 0 (0.0%) |
| 5-Person Households | 27 (2.1%) | 0 (0.0%) |
| 6-Person Households | 0 (0.0%) | 0 (0.0%) |
| 7+ Person Households | 0 (0.0%) | 0 (0.0%) |
| Total | 743 (58.6%) | 524 (41.4%) |
Female Fertility in Three Rivers
Fertility by Age in Three Rivers
Average fertility rate in Three Rivers is 78.0 births per 1,000 women. Women in the age bracket of 35 to 50 years have the highest fertility rate with 132.0 births per 1,000 women. Women in the age bracket of 35 to 50 years acount for 100.0% of all women with births.
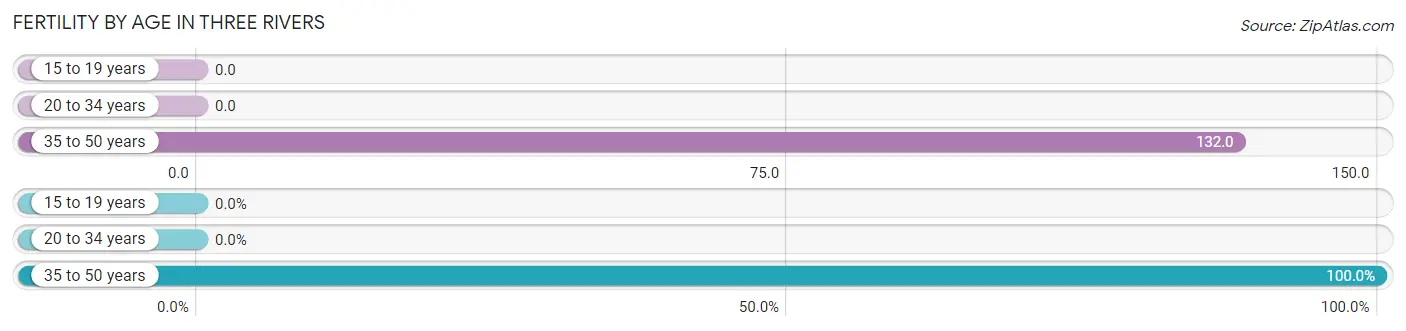
| Age Bracket | Women with Births | Births / 1,000 Women |
| 15 to 19 years | 0 (0.0%) | 0.0 |
| 20 to 34 years | 0 (0.0%) | 0.0 |
| 35 to 50 years | 23 (100.0%) | 132.0 |
| Total | 23 (100.0%) | 78.0 |
Fertility by Age by Marriage Status in Three Rivers
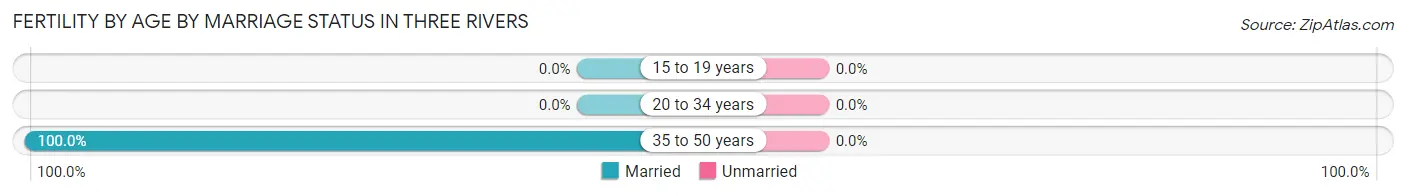
| Age Bracket | Married | Unmarried |
| 15 to 19 years | 0 (0.0%) | 0 (0.0%) |
| 20 to 34 years | 0 (0.0%) | 0 (0.0%) |
| 35 to 50 years | 23 (100.0%) | 0 (0.0%) |
| Total | 23 (100.0%) | 0 (0.0%) |
Fertility by Education in Three Rivers
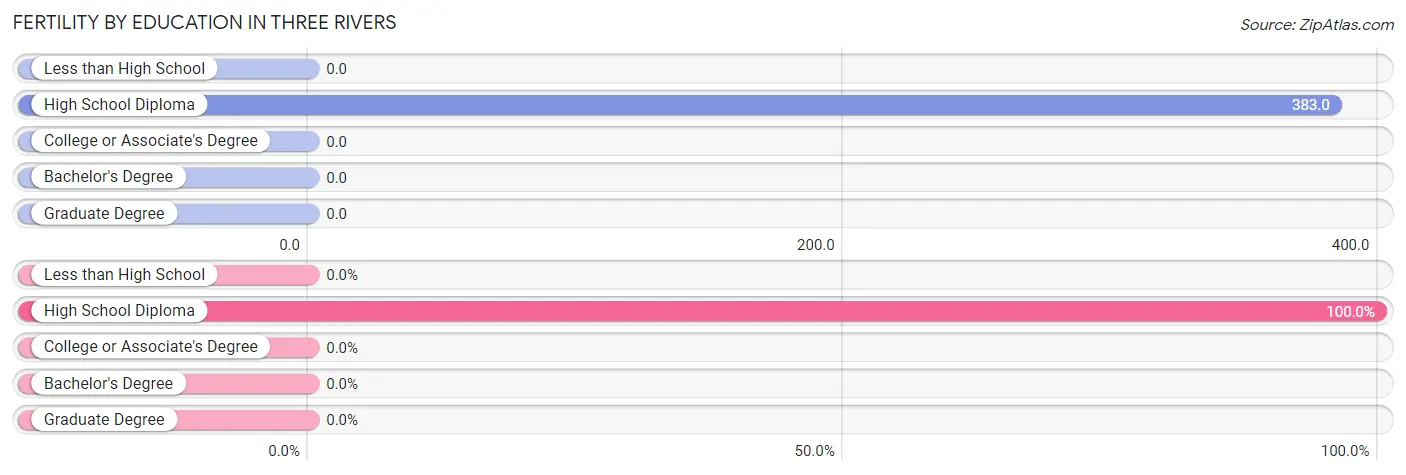
| Educational Attainment | Women with Births | Births / 1,000 Women |
| Less than High School | 0 (0.0%) | 0.0 |
| High School Diploma | 23 (100.0%) | 383.0 |
| College or Associate's Degree | 0 (0.0%) | 0.0 |
| Bachelor's Degree | 0 (0.0%) | 0.0 |
| Graduate Degree | 0 (0.0%) | 0.0 |
| Total | 23 (100.0%) | 78.0 |
Fertility by Education by Marriage Status in Three Rivers
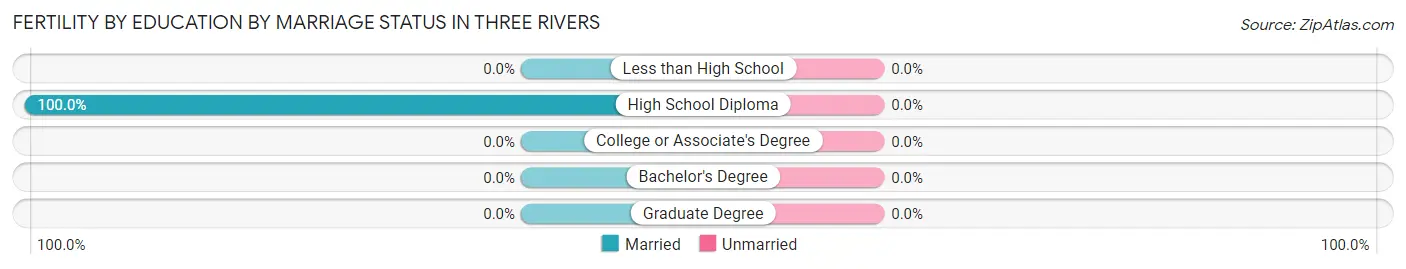
| Educational Attainment | Married | Unmarried |
| Less than High School | 0 (0.0%) | 0 (0.0%) |
| High School Diploma | 23 (100.0%) | 0 (0.0%) |
| College or Associate's Degree | 0 (0.0%) | 0 (0.0%) |
| Bachelor's Degree | 0 (0.0%) | 0 (0.0%) |
| Graduate Degree | 0 (0.0%) | 0 (0.0%) |
| Total | 23 (100.0%) | 0 (0.0%) |
Employment Characteristics in Three Rivers
Employment by Class of Employer in Three Rivers
Among the 1,223 employed individuals in Three Rivers, self-employed (not incorporated) (278 | 22.7%), not-for-profit organizations (272 | 22.2%), and private company employees (233 | 19.1%) make up the most common classes of employment.
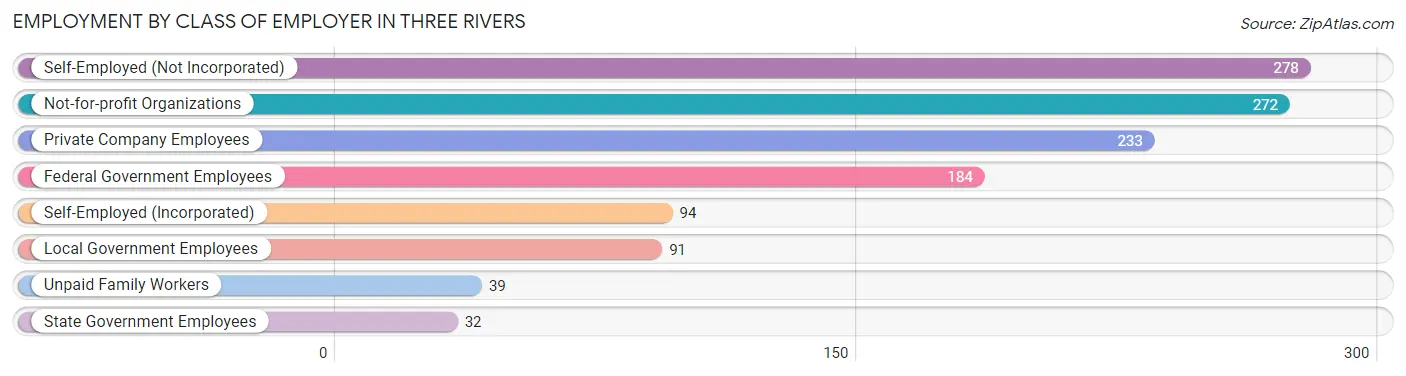
| Employer Class | # Employees | % Employees |
| Private Company Employees | 233 | 19.1% |
| Self-Employed (Incorporated) | 94 | 7.7% |
| Self-Employed (Not Incorporated) | 278 | 22.7% |
| Not-for-profit Organizations | 272 | 22.2% |
| Local Government Employees | 91 | 7.4% |
| State Government Employees | 32 | 2.6% |
| Federal Government Employees | 184 | 15.0% |
| Unpaid Family Workers | 39 | 3.2% |
| Total | 1,223 | 100.0% |
Employment Status by Age in Three Rivers
According to the labor force statistics for Three Rivers, out of the total population over 16 years of age (2,131), 60.4% or 1,287 individuals are in the labor force, with 4.2% or 54 of them unemployed. The age group with the highest labor force participation rate is 30 to 34 years, with 100.0% or 102 individuals in the labor force. Within the labor force, the 20 to 24 years age range has the highest percentage of unemployed individuals, with 12.2% or 6 of them being unemployed.
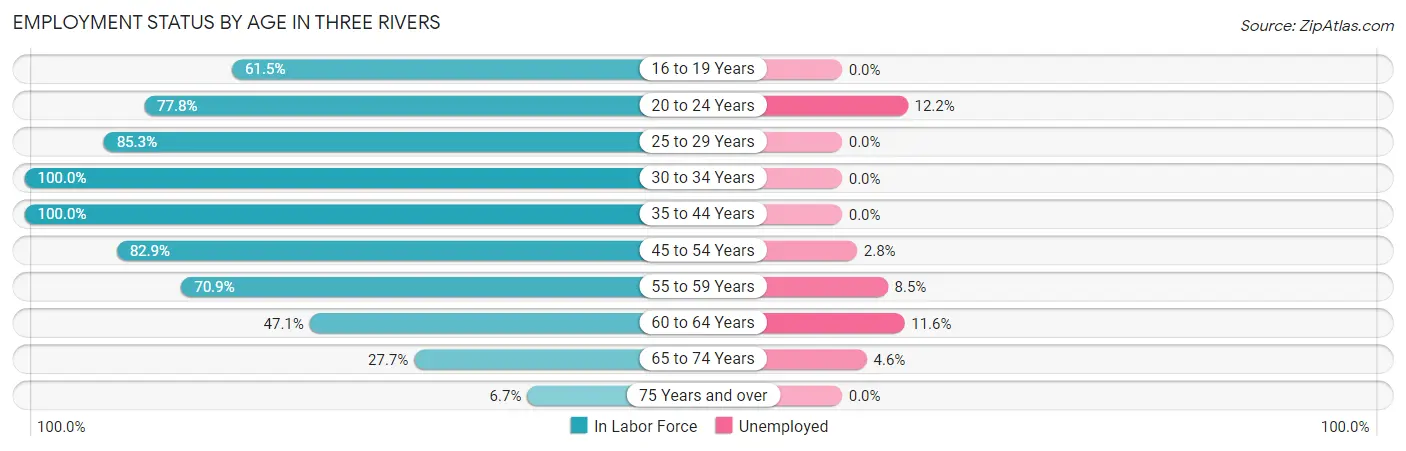
| Age Bracket | In Labor Force | Unemployed |
| 16 to 19 Years | 24 (61.5%) | 0 (0.0%) |
| 20 to 24 Years | 49 (77.8%) | 6 (12.2%) |
| 25 to 29 Years | 87 (85.3%) | 0 (0.0%) |
| 30 to 34 Years | 102 (100.0%) | 0 (0.0%) |
| 35 to 44 Years | 169 (100.0%) | 0 (0.0%) |
| 45 to 54 Years | 397 (82.9%) | 11 (2.8%) |
| 55 to 59 Years | 188 (70.9%) | 16 (8.5%) |
| 60 to 64 Years | 129 (47.1%) | 15 (11.6%) |
| 65 to 74 Years | 131 (27.7%) | 6 (4.6%) |
| 75 Years and over | 11 (6.7%) | 0 (0.0%) |
| Total | 1,287 (60.4%) | 54 (4.2%) |
Employment Status by Educational Attainment in Three Rivers
According to labor force statistics for Three Rivers, 77.1% of individuals (1,072) out of the total population between 25 and 64 years of age (1,391) are in the labor force, with 3.9% or 42 of them being unemployed. The group with the highest labor force participation rate are those with the educational attainment of less than high school, with 100.0% or 7 individuals in the labor force. Within the labor force, individuals with college / associate degree education have the highest percentage of unemployment, with 4.6% or 19 of them being unemployed.
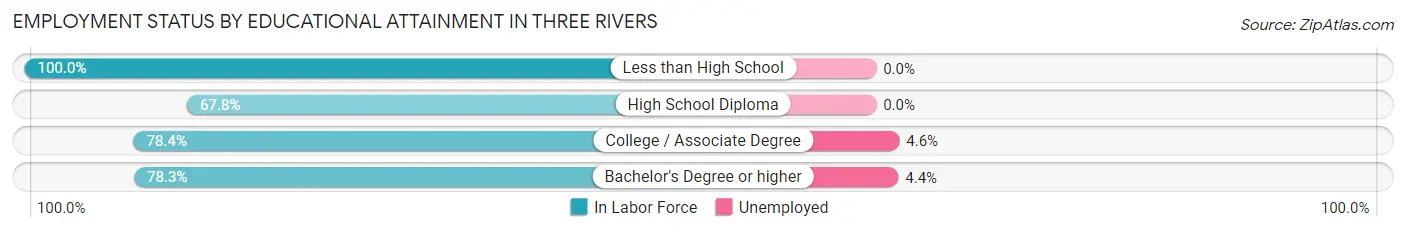
| Educational Attainment | In Labor Force | Unemployed |
| Less than High School | 7 (100.0%) | 0 (0.0%) |
| High School Diploma | 124 (67.8%) | 0 (0.0%) |
| College / Associate Degree | 413 (78.4%) | 24 (4.6%) |
| Bachelor's Degree or higher | 528 (78.3%) | 30 (4.4%) |
| Total | 1,072 (77.1%) | 54 (3.9%) |
Employment Occupations by Sex in Three Rivers
Management, Business, Science and Arts Occupations
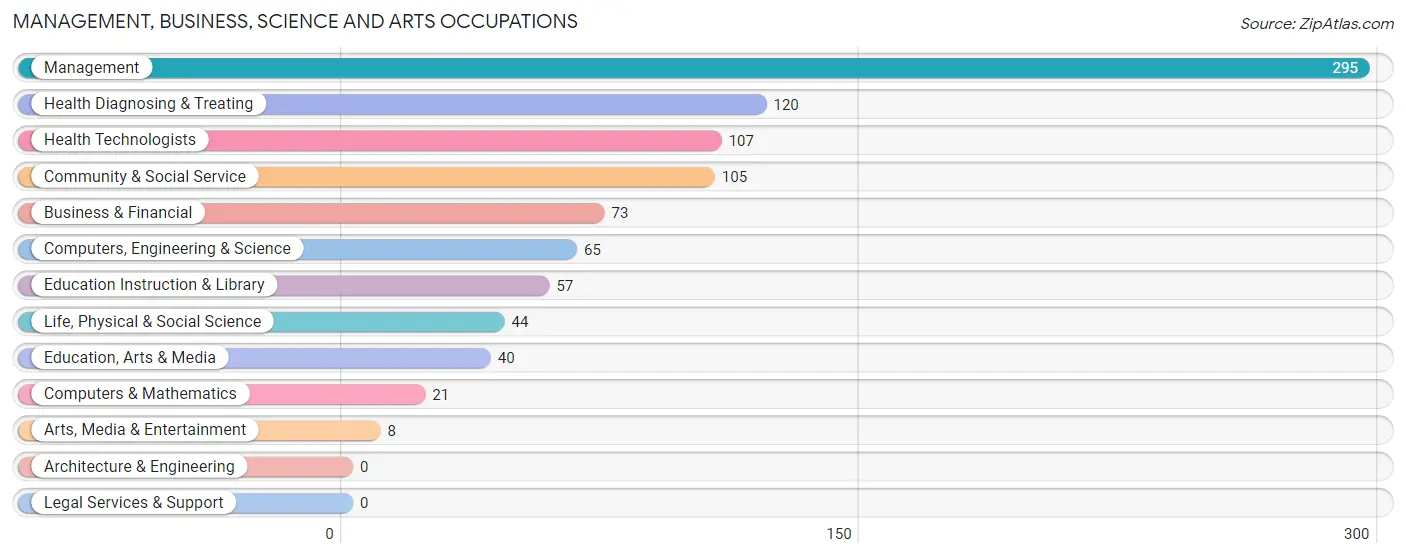
The most common Management, Business, Science and Arts occupations in Three Rivers are Management (295 | 23.9%), Health Diagnosing & Treating (120 | 9.7%), Health Technologists (107 | 8.7%), Community & Social Service (105 | 8.5%), and Business & Financial (73 | 5.9%).
Management, Business, Science and Arts Occupations by Sex
Within the Management, Business, Science and Arts occupations in Three Rivers, the most male-oriented occupations are Management (79.7%), Computers & Mathematics (66.7%), and Health Technologists (63.5%), while the most female-oriented occupations are Education, Arts & Media (95.0%), Education Instruction & Library (86.0%), and Community & Social Service (85.7%).
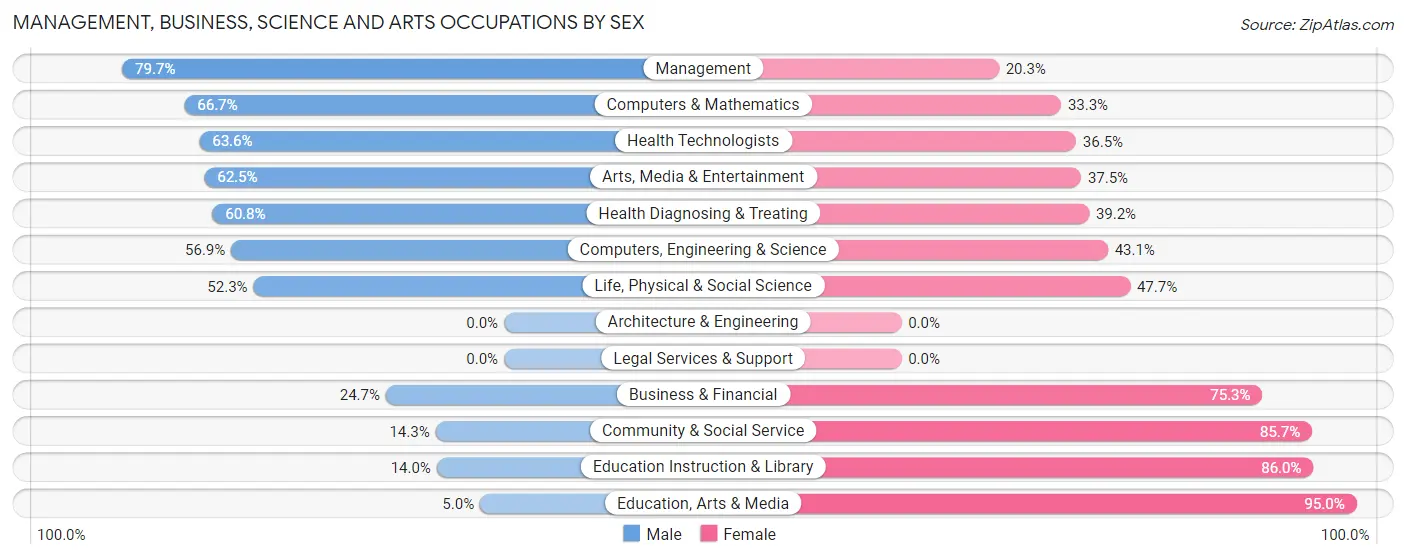
| Occupation | Male | Female |
| Management | 235 (79.7%) | 60 (20.3%) |
| Business & Financial | 18 (24.7%) | 55 (75.3%) |
| Computers, Engineering & Science | 37 (56.9%) | 28 (43.1%) |
| Computers & Mathematics | 14 (66.7%) | 7 (33.3%) |
| Architecture & Engineering | 0 (0.0%) | 0 (0.0%) |
| Life, Physical & Social Science | 23 (52.3%) | 21 (47.7%) |
| Community & Social Service | 15 (14.3%) | 90 (85.7%) |
| Education, Arts & Media | 2 (5.0%) | 38 (95.0%) |
| Legal Services & Support | 0 (0.0%) | 0 (0.0%) |
| Education Instruction & Library | 8 (14.0%) | 49 (86.0%) |
| Arts, Media & Entertainment | 5 (62.5%) | 3 (37.5%) |
| Health Diagnosing & Treating | 73 (60.8%) | 47 (39.2%) |
| Health Technologists | 68 (63.5%) | 39 (36.4%) |
| Total (Category) | 378 (57.5%) | 280 (42.5%) |
| Total (Overall) | 699 (56.7%) | 534 (43.3%) |
Services Occupations
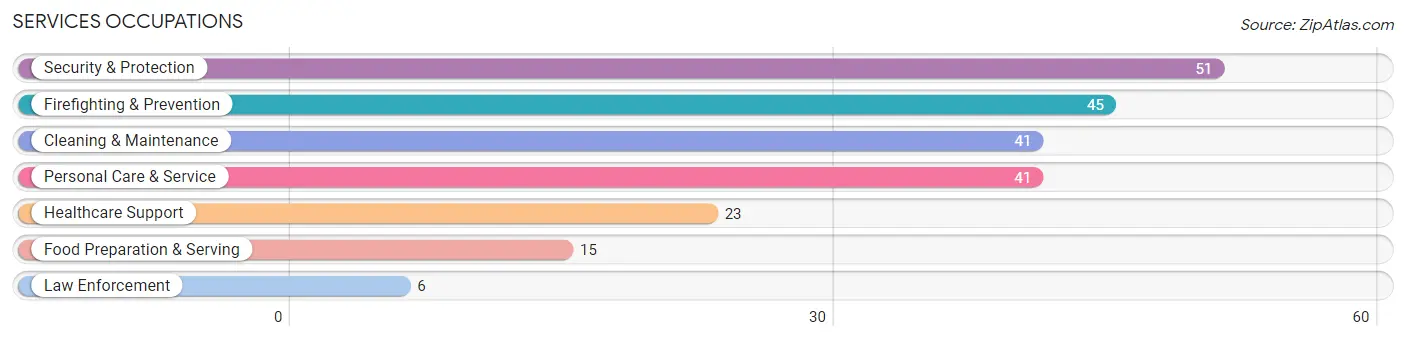
The most common Services occupations in Three Rivers are Security & Protection (51 | 4.1%), Firefighting & Prevention (45 | 3.6%), Cleaning & Maintenance (41 | 3.3%), Personal Care & Service (41 | 3.3%), and Healthcare Support (23 | 1.9%).
Services Occupations by Sex
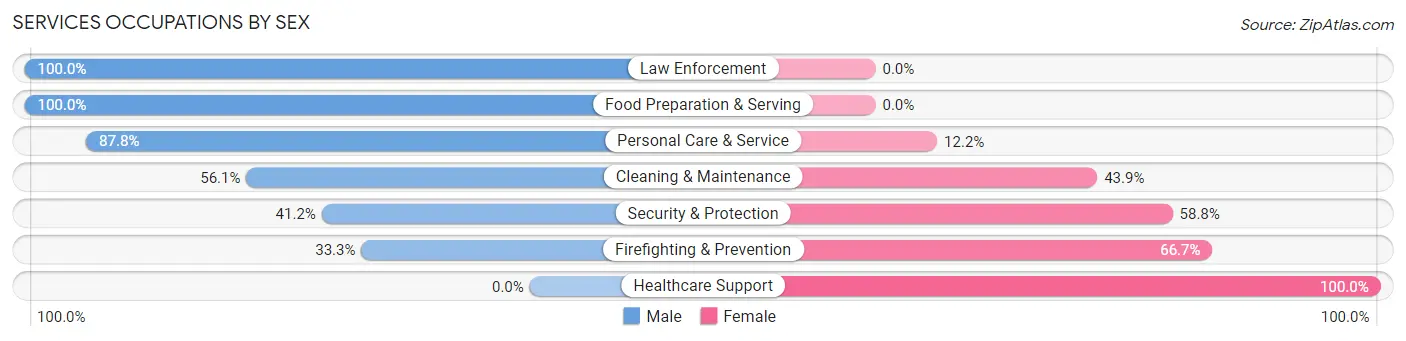
Within the Services occupations in Three Rivers, the most male-oriented occupations are Law Enforcement (100.0%), Food Preparation & Serving (100.0%), and Personal Care & Service (87.8%), while the most female-oriented occupations are Healthcare Support (100.0%), Firefighting & Prevention (66.7%), and Security & Protection (58.8%).
| Occupation | Male | Female |
| Healthcare Support | 0 (0.0%) | 23 (100.0%) |
| Security & Protection | 21 (41.2%) | 30 (58.8%) |
| Firefighting & Prevention | 15 (33.3%) | 30 (66.7%) |
| Law Enforcement | 6 (100.0%) | 0 (0.0%) |
| Food Preparation & Serving | 15 (100.0%) | 0 (0.0%) |
| Cleaning & Maintenance | 23 (56.1%) | 18 (43.9%) |
| Personal Care & Service | 36 (87.8%) | 5 (12.2%) |
| Total (Category) | 95 (55.6%) | 76 (44.4%) |
| Total (Overall) | 699 (56.7%) | 534 (43.3%) |
Sales and Office Occupations
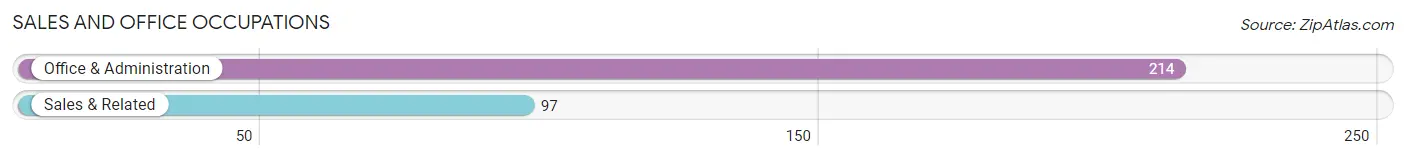
The most common Sales and Office occupations in Three Rivers are Office & Administration (214 | 17.4%), and Sales & Related (97 | 7.9%).
Sales and Office Occupations by Sex
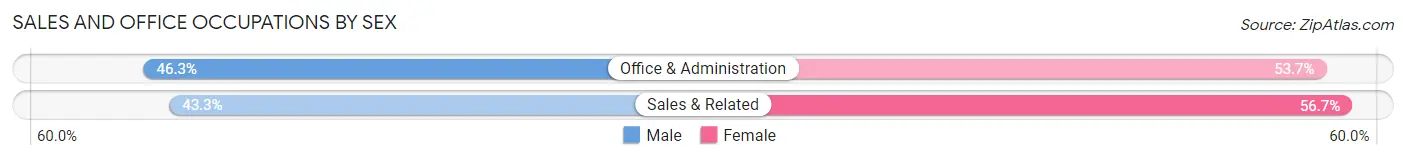
| Occupation | Male | Female |
| Sales & Related | 42 (43.3%) | 55 (56.7%) |
| Office & Administration | 99 (46.3%) | 115 (53.7%) |
| Total (Category) | 141 (45.3%) | 170 (54.7%) |
| Total (Overall) | 699 (56.7%) | 534 (43.3%) |
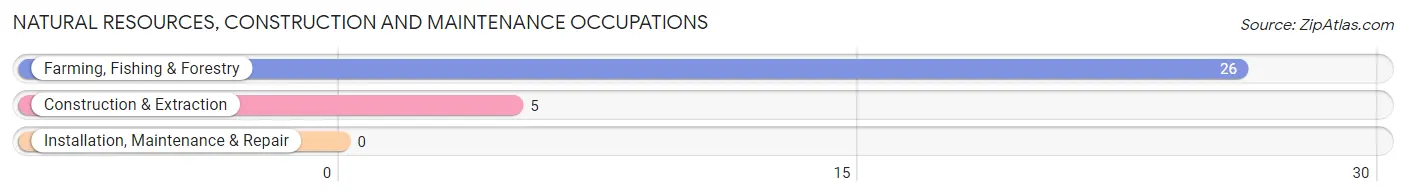
Natural Resources, Construction and Maintenance Occupations
The most common Natural Resources, Construction and Maintenance occupations in Three Rivers are Farming, Fishing & Forestry (26 | 2.1%), and Construction & Extraction (5 | 0.4%).
Natural Resources, Construction and Maintenance Occupations by Sex
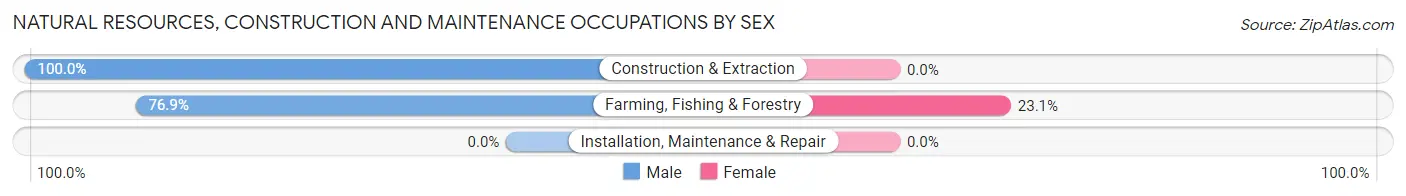
| Occupation | Male | Female |
| Farming, Fishing & Forestry | 20 (76.9%) | 6 (23.1%) |
| Construction & Extraction | 5 (100.0%) | 0 (0.0%) |
| Installation, Maintenance & Repair | 0 (0.0%) | 0 (0.0%) |
| Total (Category) | 25 (80.6%) | 6 (19.4%) |
| Total (Overall) | 699 (56.7%) | 534 (43.3%) |
Production, Transportation and Moving Occupations
The most common Production, Transportation and Moving occupations in Three Rivers are Production (34 | 2.8%), Transportation (16 | 1.3%), and Material Moving (12 | 1.0%).
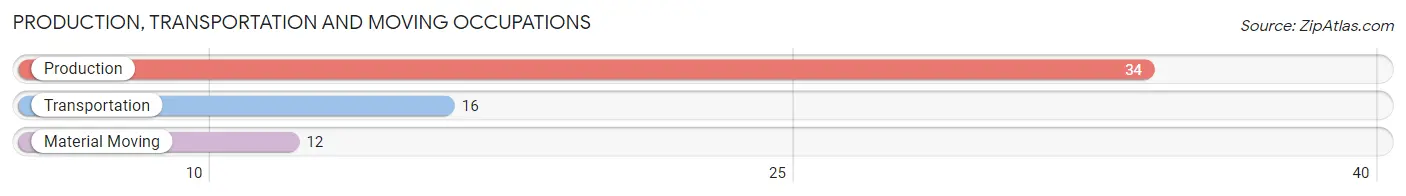
Production, Transportation and Moving Occupations by Sex
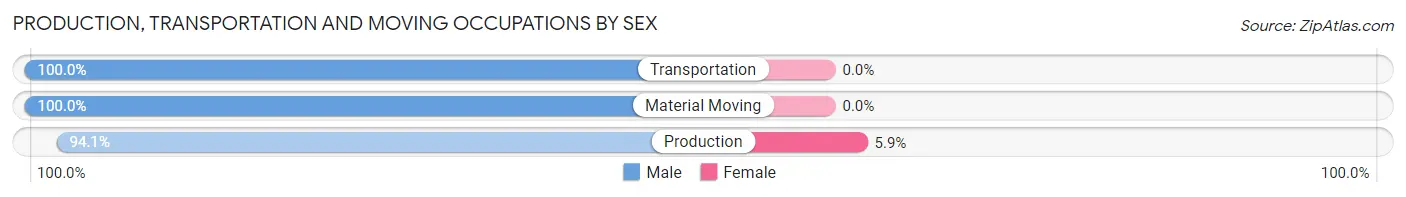
| Occupation | Male | Female |
| Production | 32 (94.1%) | 2 (5.9%) |
| Transportation | 16 (100.0%) | 0 (0.0%) |
| Material Moving | 12 (100.0%) | 0 (0.0%) |
| Total (Category) | 60 (96.8%) | 2 (3.2%) |
| Total (Overall) | 699 (56.7%) | 534 (43.3%) |
Employment Industries by Sex in Three Rivers
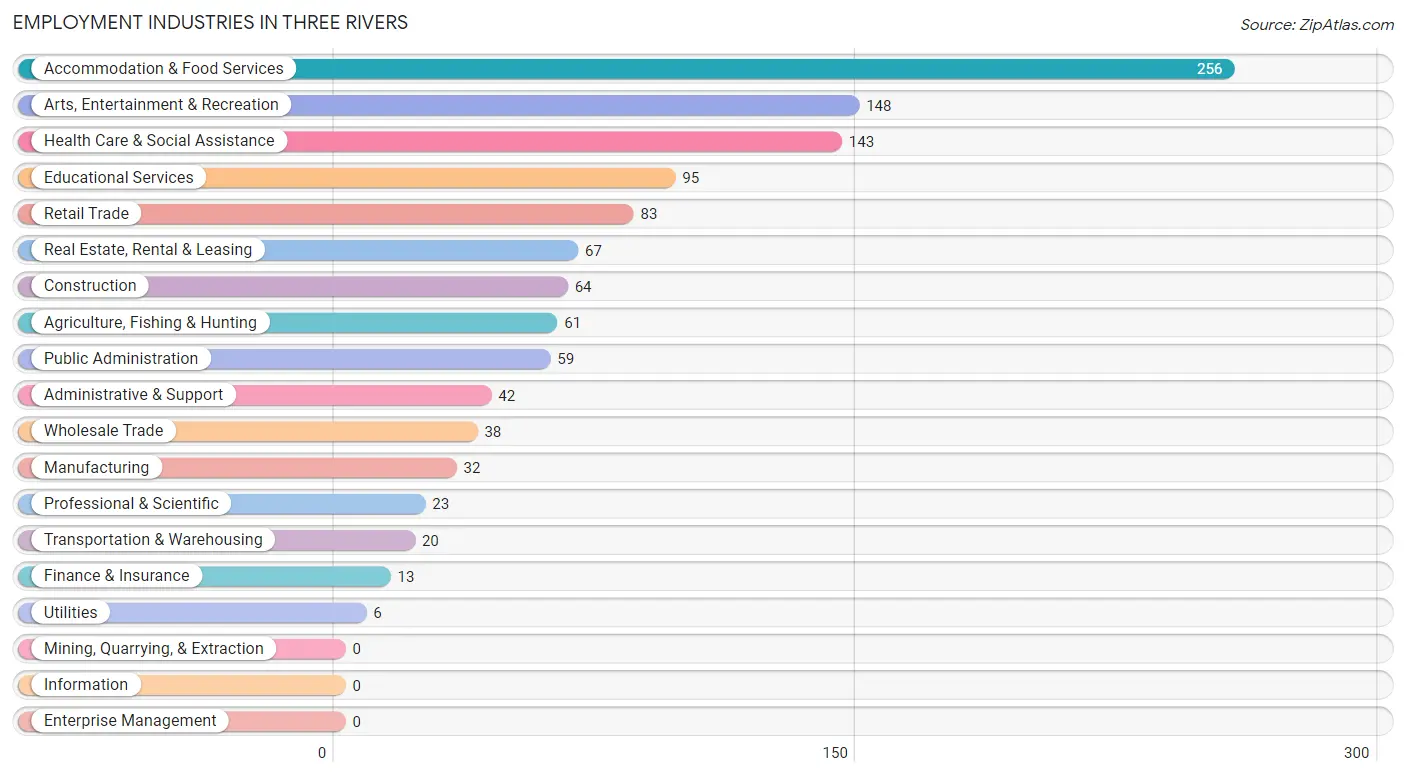
Employment Industries in Three Rivers
The major employment industries in Three Rivers include Accommodation & Food Services (256 | 20.8%), Arts, Entertainment & Recreation (148 | 12.0%), Health Care & Social Assistance (143 | 11.6%), Educational Services (95 | 7.7%), and Retail Trade (83 | 6.7%).
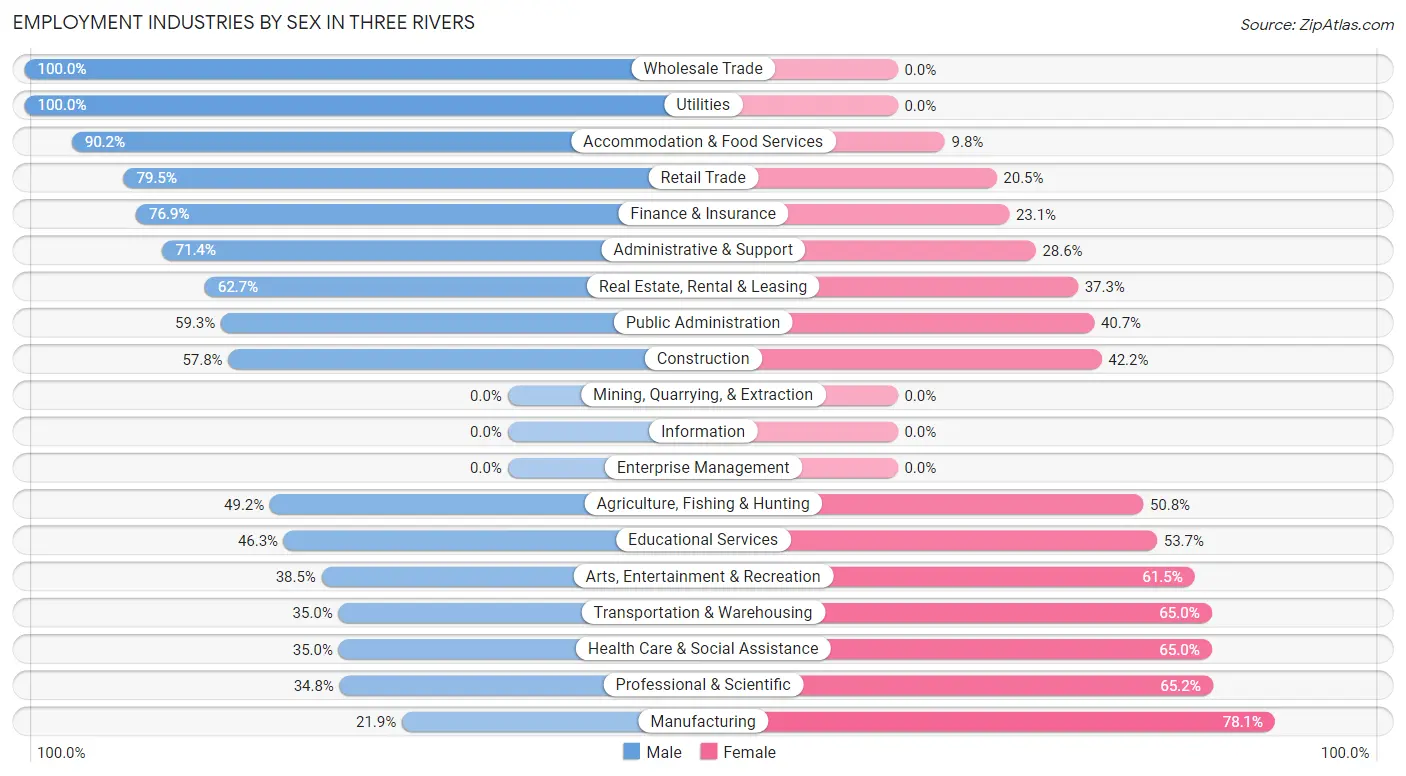
Employment Industries by Sex in Three Rivers
The Three Rivers industries that see more men than women are Wholesale Trade (100.0%), Utilities (100.0%), and Accommodation & Food Services (90.2%), whereas the industries that tend to have a higher number of women are Manufacturing (78.1%), Professional & Scientific (65.2%), and Health Care & Social Assistance (65.0%).
| Industry | Male | Female |
| Agriculture, Fishing & Hunting | 30 (49.2%) | 31 (50.8%) |
| Mining, Quarrying, & Extraction | 0 (0.0%) | 0 (0.0%) |
| Construction | 37 (57.8%) | 27 (42.2%) |
| Manufacturing | 7 (21.9%) | 25 (78.1%) |
| Wholesale Trade | 38 (100.0%) | 0 (0.0%) |
| Retail Trade | 66 (79.5%) | 17 (20.5%) |
| Transportation & Warehousing | 7 (35.0%) | 13 (65.0%) |
| Utilities | 6 (100.0%) | 0 (0.0%) |
| Information | 0 (0.0%) | 0 (0.0%) |
| Finance & Insurance | 10 (76.9%) | 3 (23.1%) |
| Real Estate, Rental & Leasing | 42 (62.7%) | 25 (37.3%) |
| Professional & Scientific | 8 (34.8%) | 15 (65.2%) |
| Enterprise Management | 0 (0.0%) | 0 (0.0%) |
| Administrative & Support | 30 (71.4%) | 12 (28.6%) |
| Educational Services | 44 (46.3%) | 51 (53.7%) |
| Health Care & Social Assistance | 50 (35.0%) | 93 (65.0%) |
| Arts, Entertainment & Recreation | 57 (38.5%) | 91 (61.5%) |
| Accommodation & Food Services | 231 (90.2%) | 25 (9.8%) |
| Public Administration | 35 (59.3%) | 24 (40.7%) |
| Total | 699 (56.7%) | 534 (43.3%) |
Education in Three Rivers
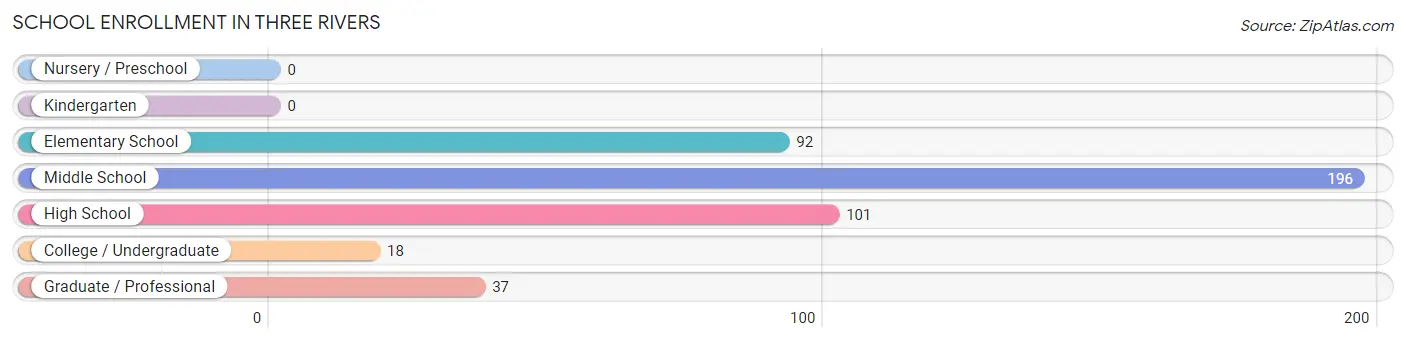
School Enrollment in Three Rivers
The most common levels of schooling among the 444 students in Three Rivers are middle school (196 | 44.1%), high school (101 | 22.8%), and elementary school (92 | 20.7%).
| School Level | # Students | % Students |
| Nursery / Preschool | 0 | 0.0% |
| Kindergarten | 0 | 0.0% |
| Elementary School | 92 | 20.7% |
| Middle School | 196 | 44.1% |
| High School | 101 | 22.8% |
| College / Undergraduate | 18 | 4.1% |
| Graduate / Professional | 37 | 8.3% |
| Total | 444 | 100.0% |
School Enrollment by Age by Funding Source in Three Rivers
Out of a total of 444 students who are enrolled in schools in Three Rivers, 110 (24.8%) attend a private institution, while the remaining 334 (75.2%) are enrolled in public schools. The age group of 25 to 34 year olds has the highest likelihood of being enrolled in private schools, with 32 (100.0% in the age bracket) enrolled. Conversely, the age group of 20 to 24 year olds has the lowest likelihood of being enrolled in a private school, with 14 (100.0% in the age bracket) attending a public institution.
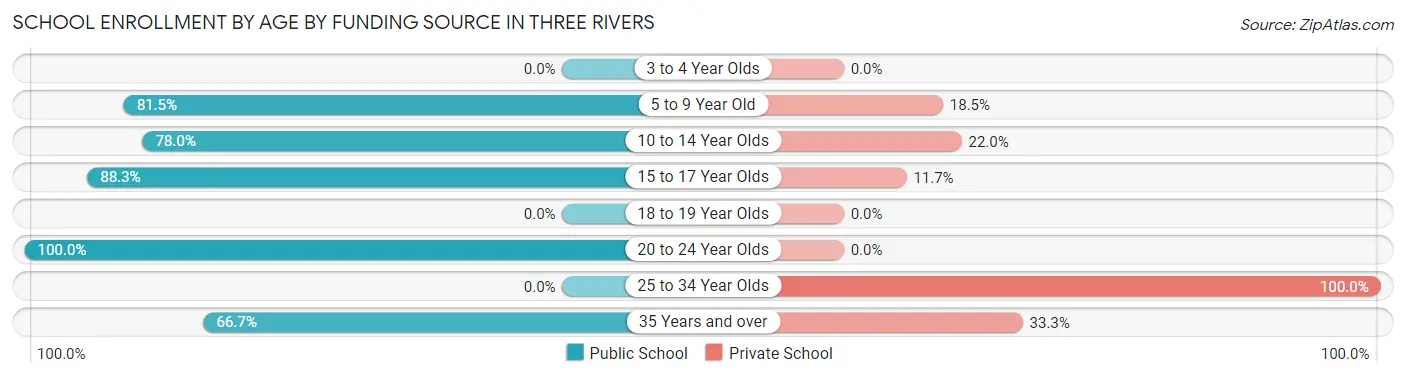
| Age Bracket | Public School | Private School |
| 3 to 4 Year Olds | 0 (0.0%) | 0 (0.0%) |
| 5 to 9 Year Old | 75 (81.5%) | 17 (18.5%) |
| 10 to 14 Year Olds | 167 (78.0%) | 47 (22.0%) |
| 15 to 17 Year Olds | 68 (88.3%) | 9 (11.7%) |
| 18 to 19 Year Olds | 0 (0.0%) | 0 (0.0%) |
| 20 to 24 Year Olds | 14 (100.0%) | 0 (0.0%) |
| 25 to 34 Year Olds | 0 (0.0%) | 32 (100.0%) |
| 35 Years and over | 10 (66.7%) | 5 (33.3%) |
| Total | 334 (75.2%) | 110 (24.8%) |
Educational Attainment by Field of Study in Three Rivers
Bio, nature & agricultural (274 | 24.0%), business (162 | 14.2%), visual & performing arts (153 | 13.4%), physical & health sciences (104 | 9.1%), and social sciences (103 | 9.0%) are the most common fields of study among 1,142 individuals in Three Rivers who have obtained a bachelor's degree or higher.
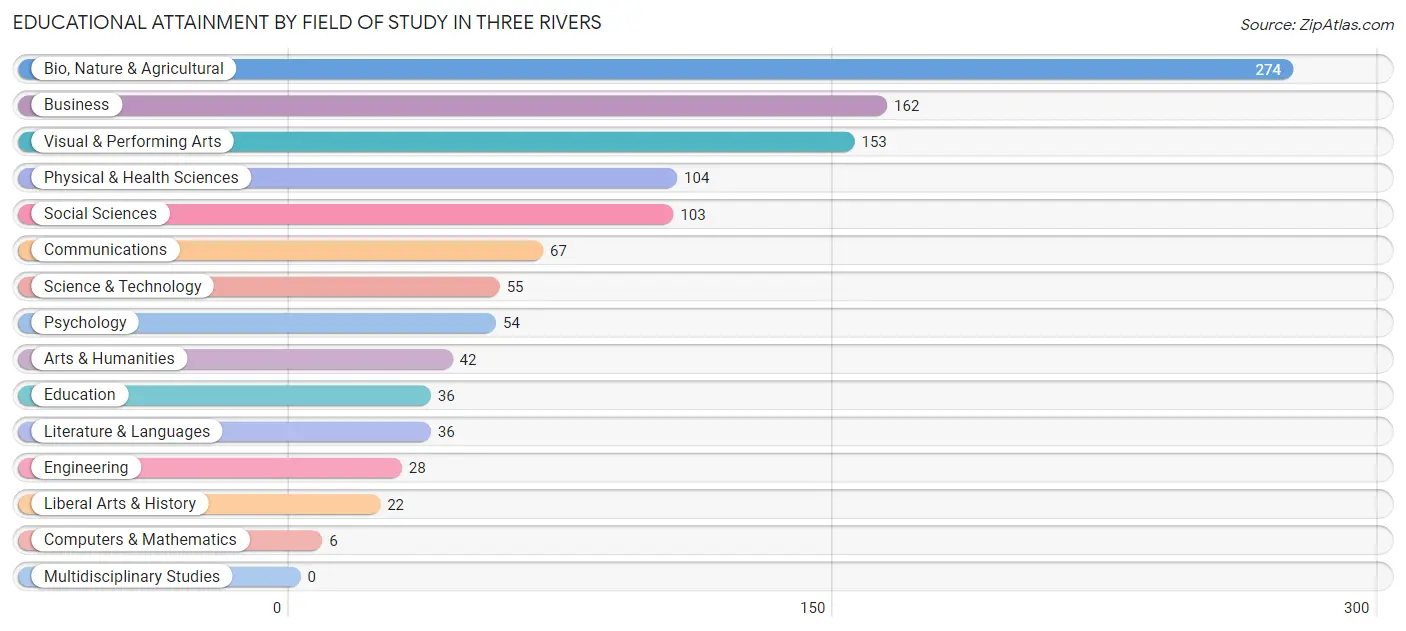
| Field of Study | # Graduates | % Graduates |
| Computers & Mathematics | 6 | 0.5% |
| Bio, Nature & Agricultural | 274 | 24.0% |
| Physical & Health Sciences | 104 | 9.1% |
| Psychology | 54 | 4.7% |
| Social Sciences | 103 | 9.0% |
| Engineering | 28 | 2.5% |
| Multidisciplinary Studies | 0 | 0.0% |
| Science & Technology | 55 | 4.8% |
| Business | 162 | 14.2% |
| Education | 36 | 3.2% |
| Literature & Languages | 36 | 3.2% |
| Liberal Arts & History | 22 | 1.9% |
| Visual & Performing Arts | 153 | 13.4% |
| Communications | 67 | 5.9% |
| Arts & Humanities | 42 | 3.7% |
| Total | 1,142 | 100.0% |
Transportation & Commute in Three Rivers
Vehicle Availability by Sex in Three Rivers
The most prevalent vehicle ownership categories in Three Rivers are males with 2 vehicles (421, accounting for 60.4%) and females with 2 vehicles (183, making up 80.3%).
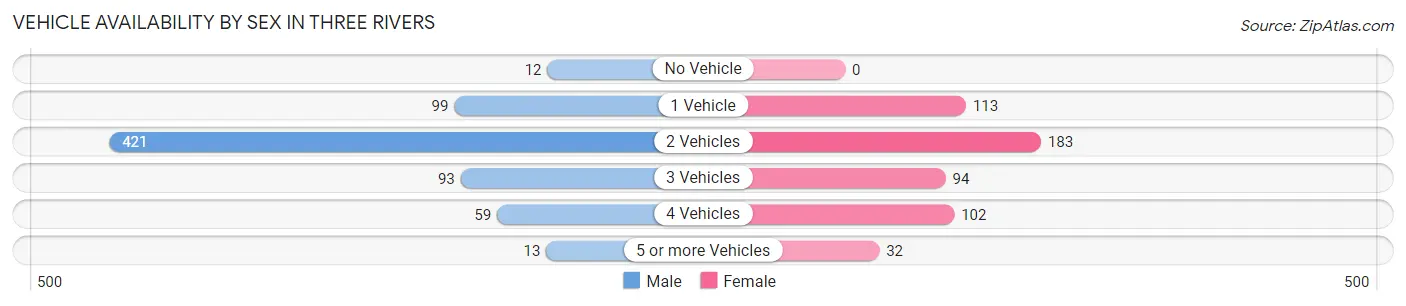
| Vehicles Available | Male | Female |
| No Vehicle | 12 (1.7%) | 0 (0.0%) |
| 1 Vehicle | 99 (14.2%) | 113 (21.6%) |
| 2 Vehicles | 421 (60.4%) | 183 (34.9%) |
| 3 Vehicles | 93 (13.3%) | 94 (17.9%) |
| 4 Vehicles | 59 (8.5%) | 102 (19.5%) |
| 5 or more Vehicles | 13 (1.9%) | 32 (6.1%) |
| Total | 697 (100.0%) | 524 (100.0%) |
Commute Time in Three Rivers
The most frequently occuring commute durations in Three Rivers are 5 to 9 minutes (271 commuters, 27.1%), 15 to 19 minutes (170 commuters, 17.0%), and 10 to 14 minutes (124 commuters, 12.4%).
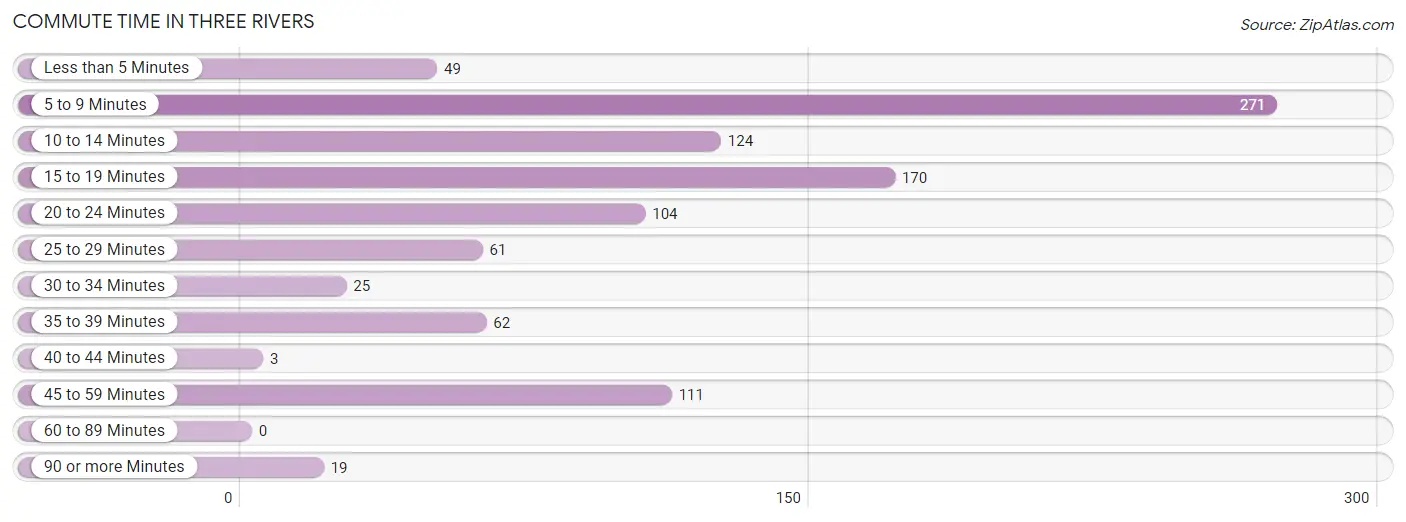
| Commute Time | # Commuters | % Commuters |
| Less than 5 Minutes | 49 | 4.9% |
| 5 to 9 Minutes | 271 | 27.1% |
| 10 to 14 Minutes | 124 | 12.4% |
| 15 to 19 Minutes | 170 | 17.0% |
| 20 to 24 Minutes | 104 | 10.4% |
| 25 to 29 Minutes | 61 | 6.1% |
| 30 to 34 Minutes | 25 | 2.5% |
| 35 to 39 Minutes | 62 | 6.2% |
| 40 to 44 Minutes | 3 | 0.3% |
| 45 to 59 Minutes | 111 | 11.1% |
| 60 to 89 Minutes | 0 | 0.0% |
| 90 or more Minutes | 19 | 1.9% |
Commute Time by Sex in Three Rivers
The most common commute times in Three Rivers are 5 to 9 minutes (223 commuters, 36.7%) for males and 15 to 19 minutes (129 commuters, 33.0%) for females.
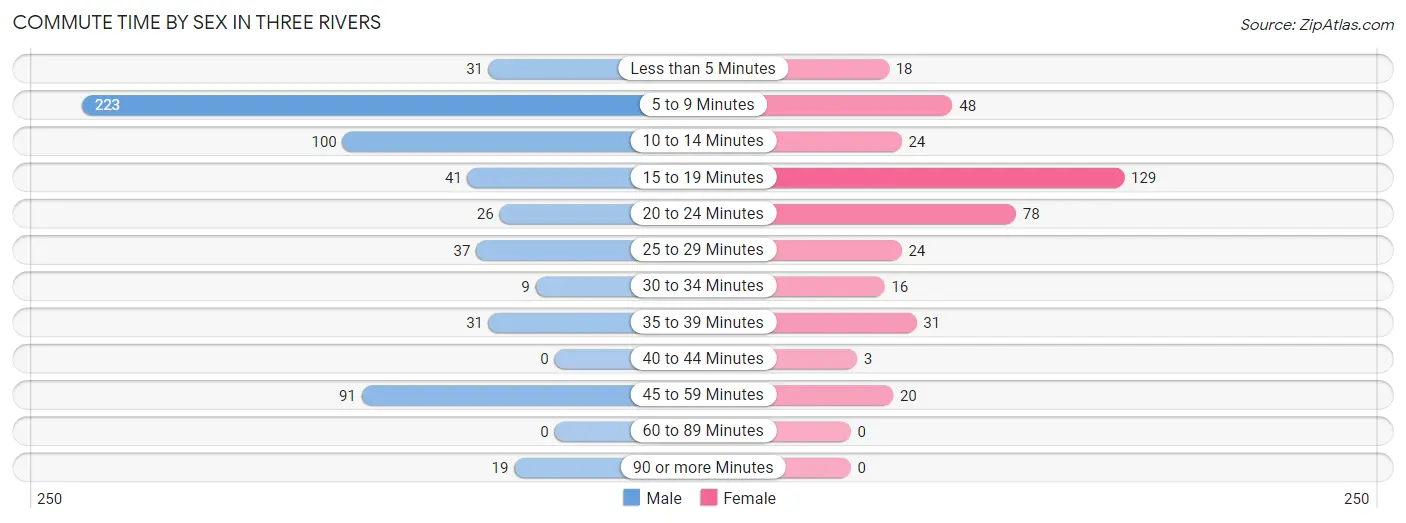
| Commute Time | Male | Female |
| Less than 5 Minutes | 31 (5.1%) | 18 (4.6%) |
| 5 to 9 Minutes | 223 (36.7%) | 48 (12.3%) |
| 10 to 14 Minutes | 100 (16.5%) | 24 (6.1%) |
| 15 to 19 Minutes | 41 (6.7%) | 129 (33.0%) |
| 20 to 24 Minutes | 26 (4.3%) | 78 (20.0%) |
| 25 to 29 Minutes | 37 (6.1%) | 24 (6.1%) |
| 30 to 34 Minutes | 9 (1.5%) | 16 (4.1%) |
| 35 to 39 Minutes | 31 (5.1%) | 31 (7.9%) |
| 40 to 44 Minutes | 0 (0.0%) | 3 (0.8%) |
| 45 to 59 Minutes | 91 (15.0%) | 20 (5.1%) |
| 60 to 89 Minutes | 0 (0.0%) | 0 (0.0%) |
| 90 or more Minutes | 19 (3.1%) | 0 (0.0%) |
Time of Departure to Work by Sex in Three Rivers
The most frequent times of departure to work in Three Rivers are 8:00 AM to 8:29 AM (187, 30.8%) for males and 7:30 AM to 7:59 AM (101, 25.8%) for females.
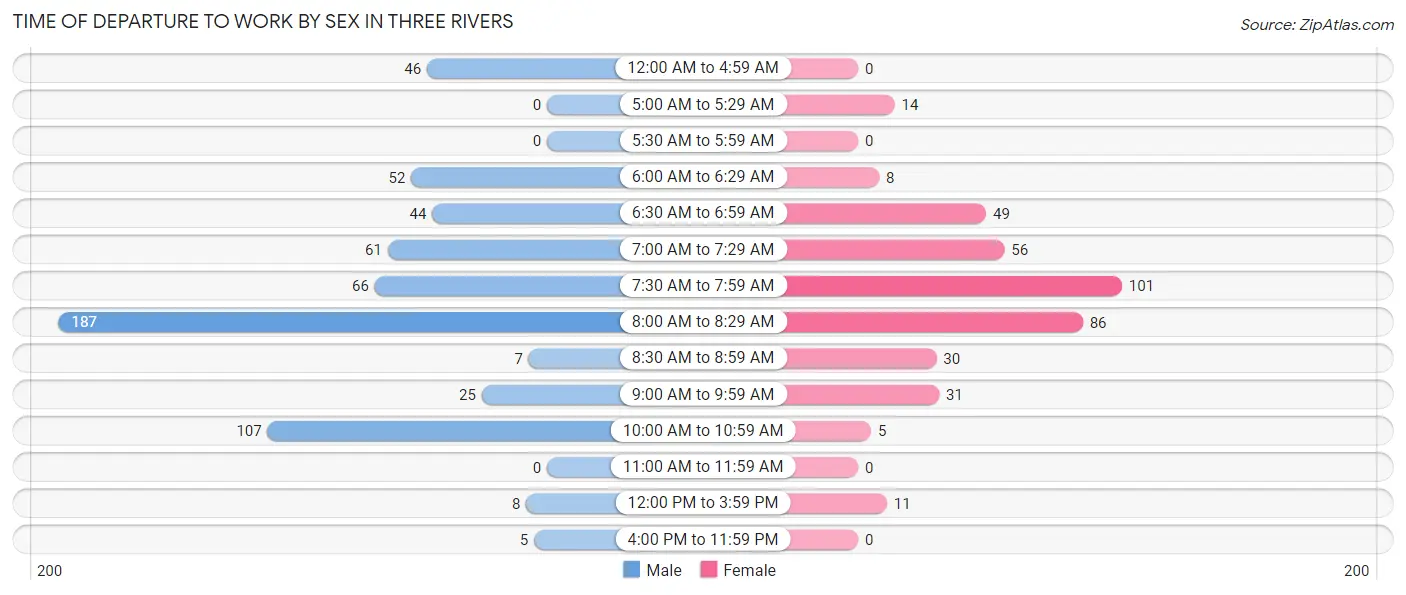
| Time of Departure | Male | Female |
| 12:00 AM to 4:59 AM | 46 (7.6%) | 0 (0.0%) |
| 5:00 AM to 5:29 AM | 0 (0.0%) | 14 (3.6%) |
| 5:30 AM to 5:59 AM | 0 (0.0%) | 0 (0.0%) |
| 6:00 AM to 6:29 AM | 52 (8.6%) | 8 (2.1%) |
| 6:30 AM to 6:59 AM | 44 (7.2%) | 49 (12.5%) |
| 7:00 AM to 7:29 AM | 61 (10.0%) | 56 (14.3%) |
| 7:30 AM to 7:59 AM | 66 (10.9%) | 101 (25.8%) |
| 8:00 AM to 8:29 AM | 187 (30.8%) | 86 (22.0%) |
| 8:30 AM to 8:59 AM | 7 (1.1%) | 30 (7.7%) |
| 9:00 AM to 9:59 AM | 25 (4.1%) | 31 (7.9%) |
| 10:00 AM to 10:59 AM | 107 (17.6%) | 5 (1.3%) |
| 11:00 AM to 11:59 AM | 0 (0.0%) | 0 (0.0%) |
| 12:00 PM to 3:59 PM | 8 (1.3%) | 11 (2.8%) |
| 4:00 PM to 11:59 PM | 5 (0.8%) | 0 (0.0%) |
| Total | 608 (100.0%) | 391 (100.0%) |
Housing Occupancy in Three Rivers
Occupancy by Ownership in Three Rivers
Of the total 1,267 dwellings in Three Rivers, owner-occupied units account for 821 (64.8%), while renter-occupied units make up 446 (35.2%).
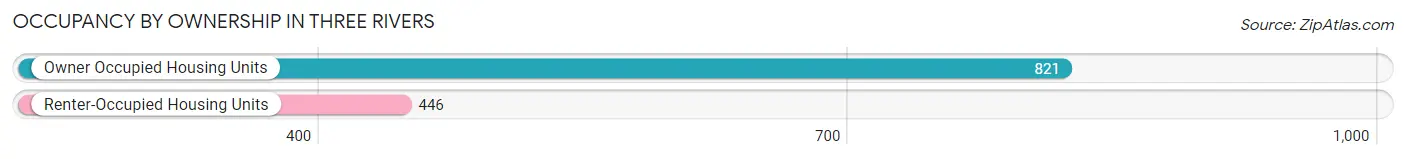
| Occupancy | # Housing Units | % Housing Units |
| Owner Occupied Housing Units | 821 | 64.8% |
| Renter-Occupied Housing Units | 446 | 35.2% |
| Total Occupied Housing Units | 1,267 | 100.0% |
Occupancy by Household Size in Three Rivers
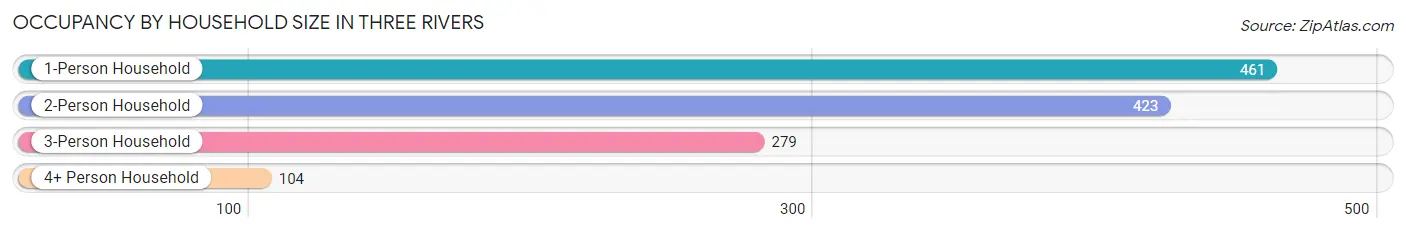
| Household Size | # Housing Units | % Housing Units |
| 1-Person Household | 461 | 36.4% |
| 2-Person Household | 423 | 33.4% |
| 3-Person Household | 279 | 22.0% |
| 4+ Person Household | 104 | 8.2% |
| Total Housing Units | 1,267 | 100.0% |
Occupancy by Ownership by Household Size in Three Rivers
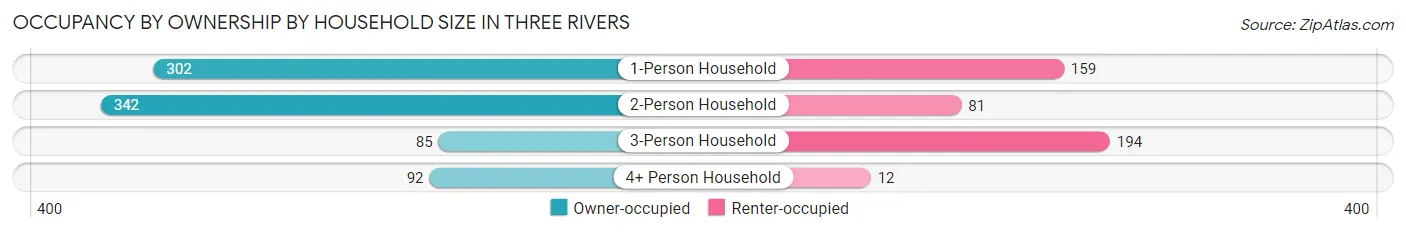
| Household Size | Owner-occupied | Renter-occupied |
| 1-Person Household | 302 (65.5%) | 159 (34.5%) |
| 2-Person Household | 342 (80.8%) | 81 (19.2%) |
| 3-Person Household | 85 (30.5%) | 194 (69.5%) |
| 4+ Person Household | 92 (88.5%) | 12 (11.5%) |
| Total Housing Units | 821 (64.8%) | 446 (35.2%) |
Occupancy by Educational Attainment in Three Rivers
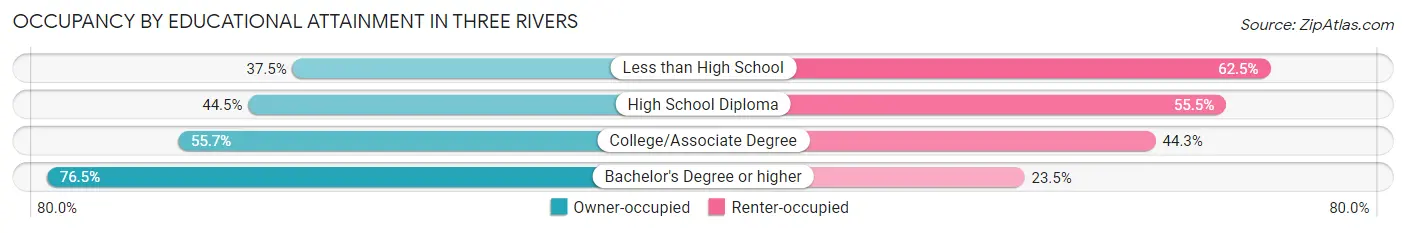
| Household Size | Owner-occupied | Renter-occupied |
| Less than High School | 3 (37.5%) | 5 (62.5%) |
| High School Diploma | 69 (44.5%) | 86 (55.5%) |
| College/Associate Degree | 255 (55.7%) | 203 (44.3%) |
| Bachelor's Degree or higher | 494 (76.5%) | 152 (23.5%) |
Occupancy by Age of Householder in Three Rivers
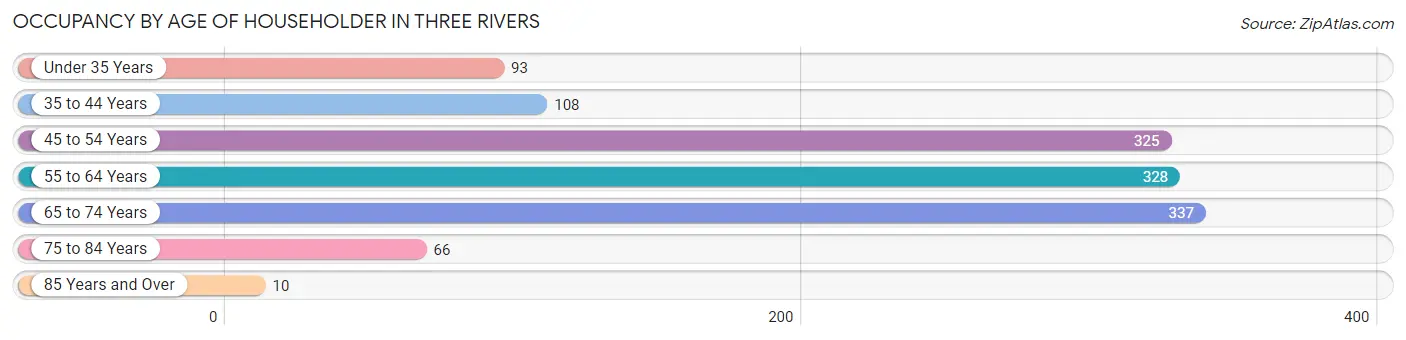
| Age Bracket | # Households | % Households |
| Under 35 Years | 93 | 7.3% |
| 35 to 44 Years | 108 | 8.5% |
| 45 to 54 Years | 325 | 25.7% |
| 55 to 64 Years | 328 | 25.9% |
| 65 to 74 Years | 337 | 26.6% |
| 75 to 84 Years | 66 | 5.2% |
| 85 Years and Over | 10 | 0.8% |
| Total | 1,267 | 100.0% |
Housing Finances in Three Rivers
Median Income by Occupancy in Three Rivers
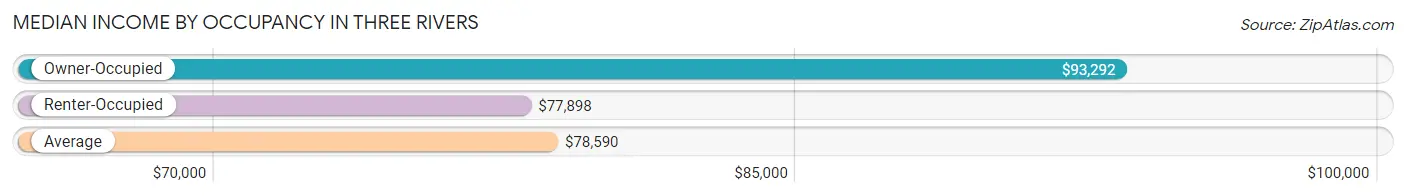
| Occupancy Type | # Households | Median Income |
| Owner-Occupied | 821 (64.8%) | $93,292 |
| Renter-Occupied | 446 (35.2%) | $77,898 |
| Average | 1,267 (100.0%) | $78,590 |
Occupancy by Householder Income Bracket in Three Rivers
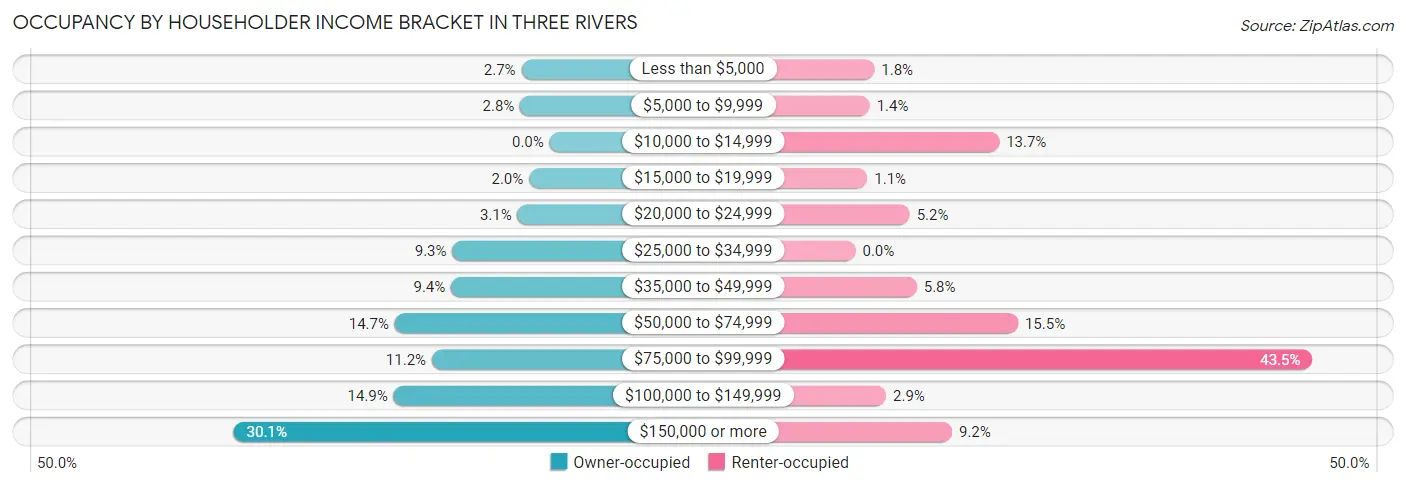
| Income Bracket | Owner-occupied | Renter-occupied |
| Less than $5,000 | 22 (2.7%) | 8 (1.8%) |
| $5,000 to $9,999 | 23 (2.8%) | 6 (1.3%) |
| $10,000 to $14,999 | 0 (0.0%) | 61 (13.7%) |
| $15,000 to $19,999 | 16 (1.9%) | 5 (1.1%) |
| $20,000 to $24,999 | 25 (3.0%) | 23 (5.2%) |
| $25,000 to $34,999 | 76 (9.3%) | 0 (0.0%) |
| $35,000 to $49,999 | 77 (9.4%) | 26 (5.8%) |
| $50,000 to $74,999 | 121 (14.7%) | 69 (15.5%) |
| $75,000 to $99,999 | 92 (11.2%) | 194 (43.5%) |
| $100,000 to $149,999 | 122 (14.9%) | 13 (2.9%) |
| $150,000 or more | 247 (30.1%) | 41 (9.2%) |
| Total | 821 (100.0%) | 446 (100.0%) |
Monthly Housing Cost Tiers in Three Rivers
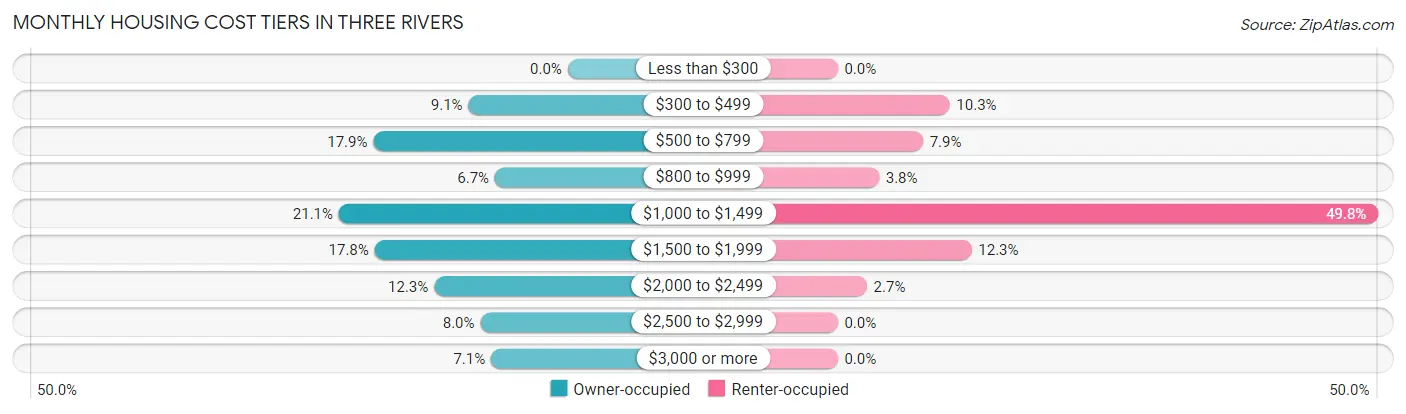
| Monthly Cost | Owner-occupied | Renter-occupied |
| Less than $300 | 0 (0.0%) | 0 (0.0%) |
| $300 to $499 | 75 (9.1%) | 46 (10.3%) |
| $500 to $799 | 147 (17.9%) | 35 (7.9%) |
| $800 to $999 | 55 (6.7%) | 17 (3.8%) |
| $1,000 to $1,499 | 173 (21.1%) | 222 (49.8%) |
| $1,500 to $1,999 | 146 (17.8%) | 55 (12.3%) |
| $2,000 to $2,499 | 101 (12.3%) | 12 (2.7%) |
| $2,500 to $2,999 | 66 (8.0%) | 0 (0.0%) |
| $3,000 or more | 58 (7.1%) | 0 (0.0%) |
| Total | 821 (100.0%) | 446 (100.0%) |
Physical Housing Characteristics in Three Rivers
Housing Structures in Three Rivers
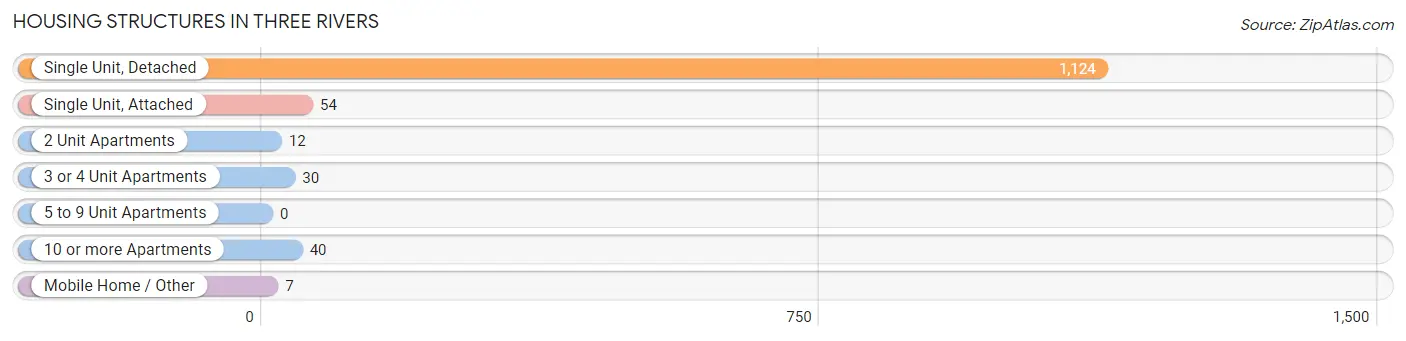
| Structure Type | # Housing Units | % Housing Units |
| Single Unit, Detached | 1,124 | 88.7% |
| Single Unit, Attached | 54 | 4.3% |
| 2 Unit Apartments | 12 | 0.9% |
| 3 or 4 Unit Apartments | 30 | 2.4% |
| 5 to 9 Unit Apartments | 0 | 0.0% |
| 10 or more Apartments | 40 | 3.2% |
| Mobile Home / Other | 7 | 0.5% |
| Total | 1,267 | 100.0% |
Housing Structures by Occupancy in Three Rivers
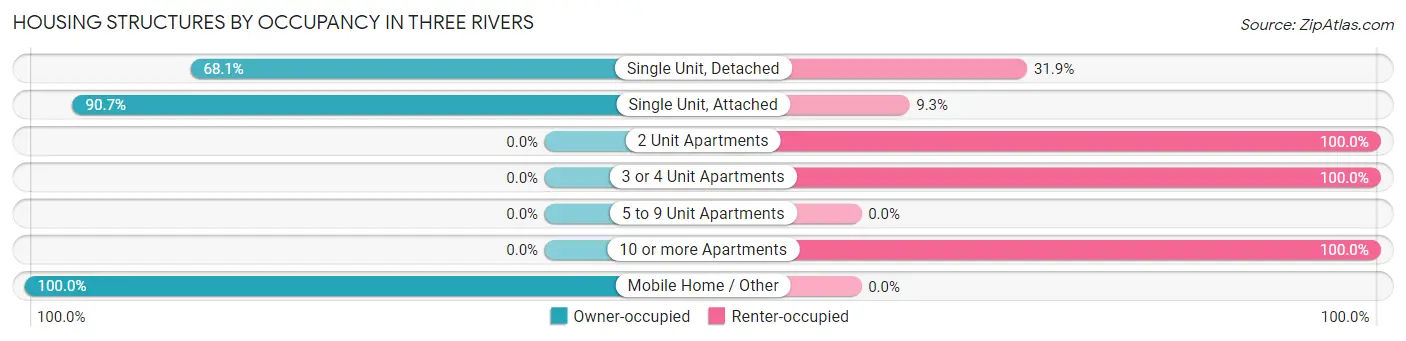
| Structure Type | Owner-occupied | Renter-occupied |
| Single Unit, Detached | 765 (68.1%) | 359 (31.9%) |
| Single Unit, Attached | 49 (90.7%) | 5 (9.3%) |
| 2 Unit Apartments | 0 (0.0%) | 12 (100.0%) |
| 3 or 4 Unit Apartments | 0 (0.0%) | 30 (100.0%) |
| 5 to 9 Unit Apartments | 0 (0.0%) | 0 (0.0%) |
| 10 or more Apartments | 0 (0.0%) | 40 (100.0%) |
| Mobile Home / Other | 7 (100.0%) | 0 (0.0%) |
| Total | 821 (64.8%) | 446 (35.2%) |
Housing Structures by Number of Rooms in Three Rivers
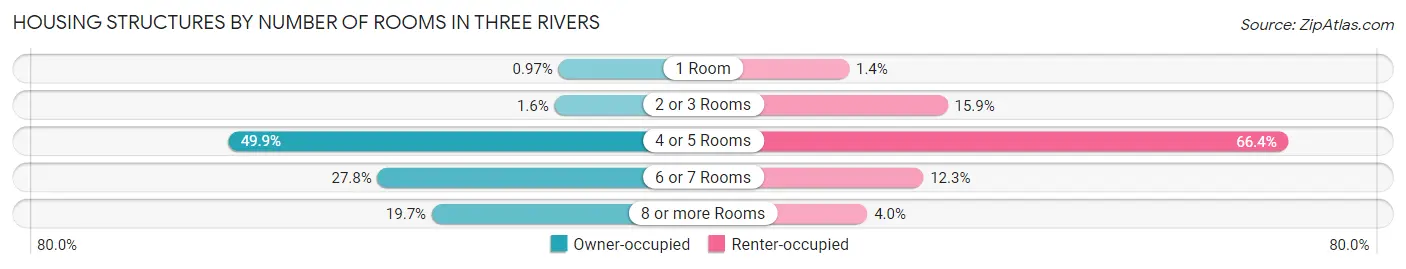
| Number of Rooms | Owner-occupied | Renter-occupied |
| 1 Room | 8 (1.0%) | 6 (1.3%) |
| 2 or 3 Rooms | 13 (1.6%) | 71 (15.9%) |
| 4 or 5 Rooms | 410 (49.9%) | 296 (66.4%) |
| 6 or 7 Rooms | 228 (27.8%) | 55 (12.3%) |
| 8 or more Rooms | 162 (19.7%) | 18 (4.0%) |
| Total | 821 (100.0%) | 446 (100.0%) |
Housing Structure by Heating Type in Three Rivers
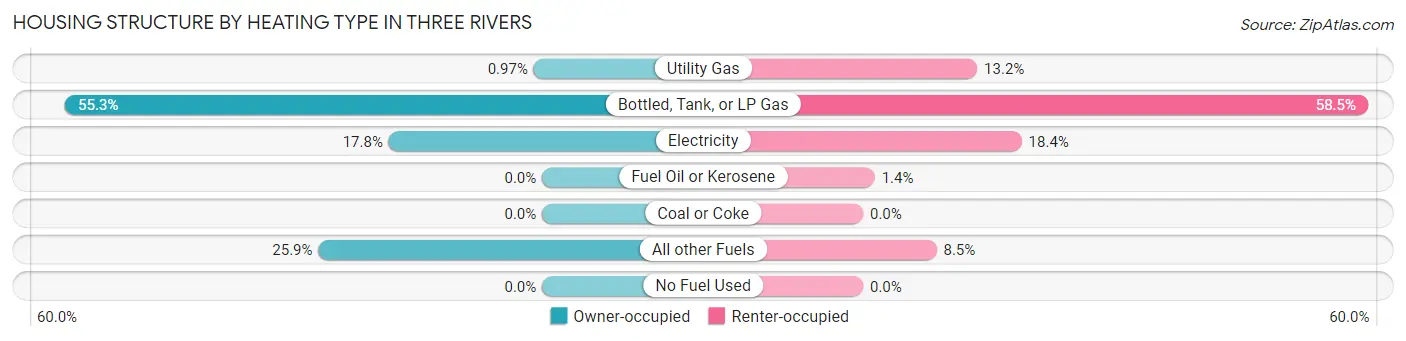
| Heating Type | Owner-occupied | Renter-occupied |
| Utility Gas | 8 (1.0%) | 59 (13.2%) |
| Bottled, Tank, or LP Gas | 454 (55.3%) | 261 (58.5%) |
| Electricity | 146 (17.8%) | 82 (18.4%) |
| Fuel Oil or Kerosene | 0 (0.0%) | 6 (1.3%) |
| Coal or Coke | 0 (0.0%) | 0 (0.0%) |
| All other Fuels | 213 (25.9%) | 38 (8.5%) |
| No Fuel Used | 0 (0.0%) | 0 (0.0%) |
| Total | 821 (100.0%) | 446 (100.0%) |
Household Vehicle Usage in Three Rivers
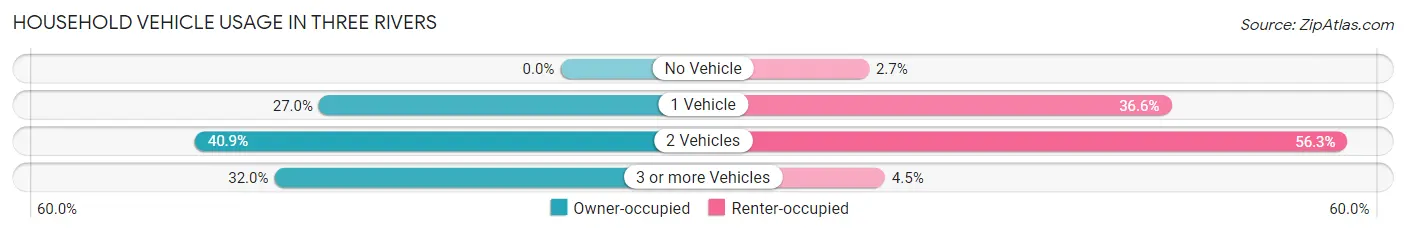
| Vehicles per Household | Owner-occupied | Renter-occupied |
| No Vehicle | 0 (0.0%) | 12 (2.7%) |
| 1 Vehicle | 222 (27.0%) | 163 (36.5%) |
| 2 Vehicles | 336 (40.9%) | 251 (56.3%) |
| 3 or more Vehicles | 263 (32.0%) | 20 (4.5%) |
| Total | 821 (100.0%) | 446 (100.0%) |
Real Estate & Mortgages in Three Rivers
Real Estate and Mortgage Overview in Three Rivers
| Characteristic | Without Mortgage | With Mortgage |
| Housing Units | 337 | 484 |
| Median Property Value | $358,500 | $417,800 |
| Median Household Income | $71,208 | $153 |
| Monthly Housing Costs | $724 | $58 |
| Real Estate Taxes | $3,050 | $0 |
Property Value by Mortgage Status in Three Rivers

| Property Value | Without Mortgage | With Mortgage |
| Less than $50,000 | 7 (2.1%) | 4 (0.8%) |
| $50,000 to $99,999 | 7 (2.1%) | 0 (0.0%) |
| $100,000 to $299,999 | 127 (37.7%) | 73 (15.1%) |
| $300,000 to $499,999 | 74 (22.0%) | 285 (58.9%) |
| $500,000 to $749,999 | 49 (14.5%) | 64 (13.2%) |
| $750,000 to $999,999 | 28 (8.3%) | 44 (9.1%) |
| $1,000,000 or more | 45 (13.4%) | 14 (2.9%) |
| Total | 337 (100.0%) | 484 (100.0%) |
Household Income by Mortgage Status in Three Rivers

| Household Income | Without Mortgage | With Mortgage |
| Less than $10,000 | 29 (8.6%) | 8 (1.7%) |
| $10,000 to $24,999 | 0 (0.0%) | 16 (3.3%) |
| $25,000 to $34,999 | 41 (12.2%) | 41 (8.5%) |
| $35,000 to $49,999 | 56 (16.6%) | 35 (7.2%) |
| $50,000 to $74,999 | 58 (17.2%) | 21 (4.3%) |
| $75,000 to $99,999 | 36 (10.7%) | 63 (13.0%) |
| $100,000 to $149,999 | 23 (6.8%) | 56 (11.6%) |
| $150,000 or more | 94 (27.9%) | 99 (20.4%) |
| Total | 337 (100.0%) | 484 (100.0%) |
Property Value to Household Income Ratio in Three Rivers
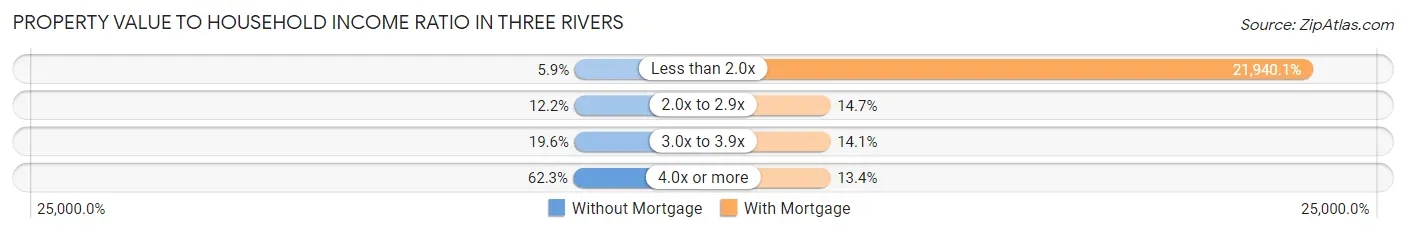
| Value-to-Income Ratio | Without Mortgage | With Mortgage |
| Less than 2.0x | 20 (5.9%) | 106,190 (21,940.1%) |
| 2.0x to 2.9x | 41 (12.2%) | 71 (14.7%) |
| 3.0x to 3.9x | 66 (19.6%) | 68 (14.1%) |
| 4.0x or more | 210 (62.3%) | 65 (13.4%) |
| Total | 337 (100.0%) | 484 (100.0%) |
Real Estate Taxes by Mortgage Status in Three Rivers
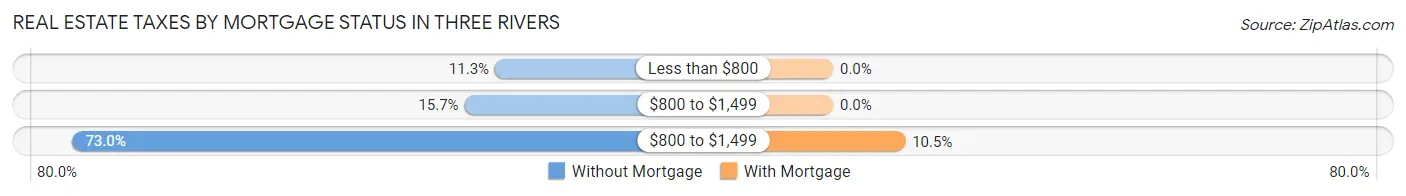
| Property Taxes | Without Mortgage | With Mortgage |
| Less than $800 | 38 (11.3%) | 0 (0.0%) |
| $800 to $1,499 | 53 (15.7%) | 0 (0.0%) |
| $800 to $1,499 | 246 (73.0%) | 51 (10.5%) |
| Total | 337 (100.0%) | 484 (100.0%) |
Health & Disability in Three Rivers
Health Insurance Coverage by Age in Three Rivers
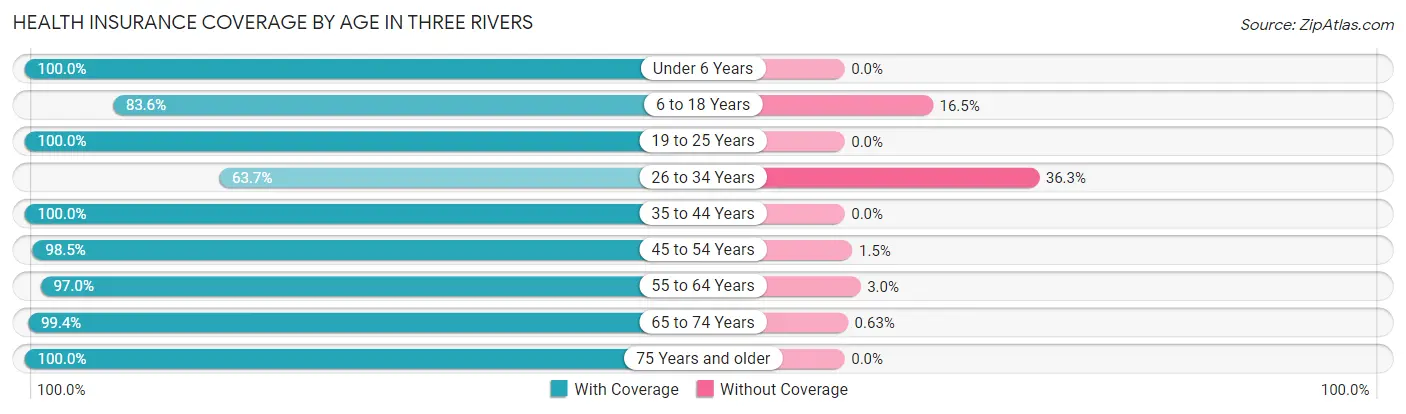
| Age Bracket | With Coverage | Without Coverage |
| Under 6 Years | 21 (100.0%) | 0 (0.0%) |
| 6 to 18 Years | 320 (83.6%) | 63 (16.5%) |
| 19 to 25 Years | 63 (100.0%) | 0 (0.0%) |
| 26 to 34 Years | 130 (63.7%) | 74 (36.3%) |
| 35 to 44 Years | 169 (100.0%) | 0 (0.0%) |
| 45 to 54 Years | 472 (98.5%) | 7 (1.5%) |
| 55 to 64 Years | 523 (97.0%) | 16 (3.0%) |
| 65 to 74 Years | 470 (99.4%) | 3 (0.6%) |
| 75 Years and older | 165 (100.0%) | 0 (0.0%) |
| Total | 2,333 (93.5%) | 163 (6.5%) |
Health Insurance Coverage by Citizenship Status in Three Rivers
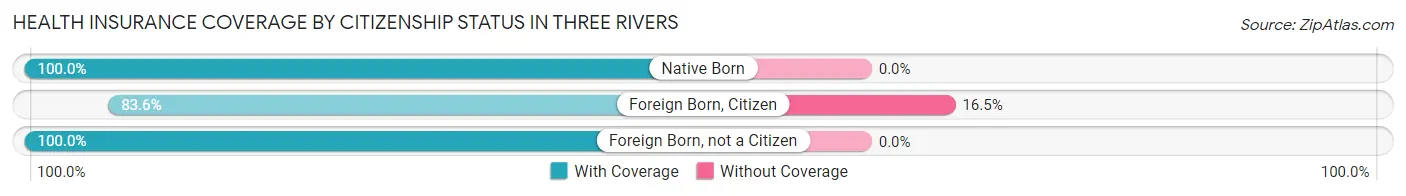
| Citizenship Status | With Coverage | Without Coverage |
| Native Born | 21 (100.0%) | 0 (0.0%) |
| Foreign Born, Citizen | 320 (83.6%) | 63 (16.5%) |
| Foreign Born, not a Citizen | 63 (100.0%) | 0 (0.0%) |
Health Insurance Coverage by Household Income in Three Rivers
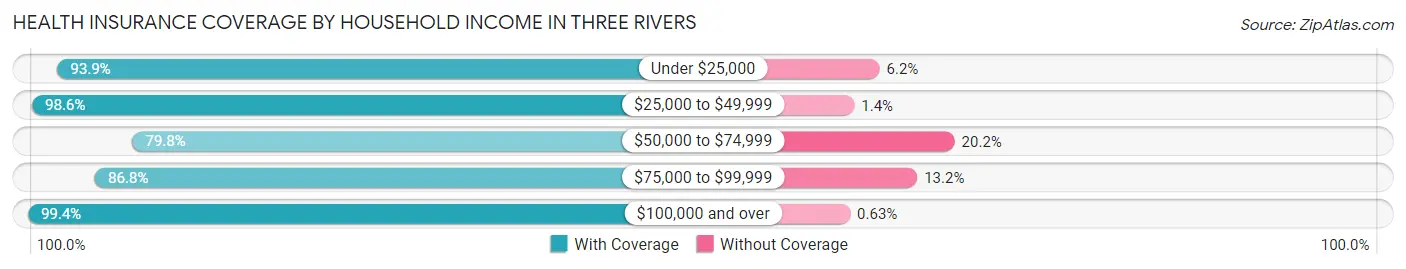
| Household Income | With Coverage | Without Coverage |
| Under $25,000 | 229 (93.9%) | 15 (6.1%) |
| $25,000 to $49,999 | 279 (98.6%) | 4 (1.4%) |
| $50,000 to $74,999 | 233 (79.8%) | 59 (20.2%) |
| $75,000 to $99,999 | 493 (86.8%) | 75 (13.2%) |
| $100,000 and over | 1,096 (99.4%) | 7 (0.6%) |
Public vs Private Health Insurance Coverage by Age in Three Rivers
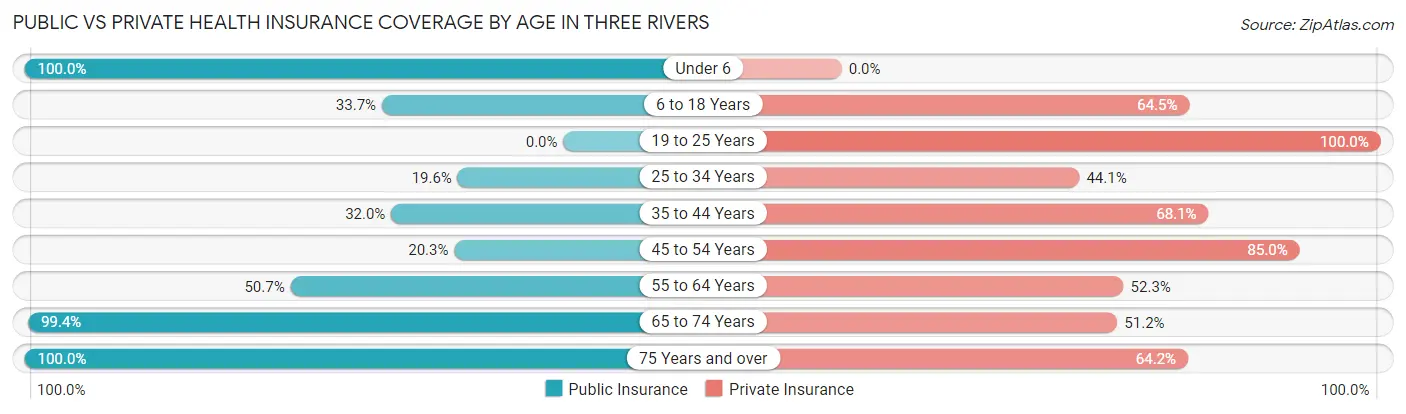
| Age Bracket | Public Insurance | Private Insurance |
| Under 6 | 21 (100.0%) | 0 (0.0%) |
| 6 to 18 Years | 129 (33.7%) | 247 (64.5%) |
| 19 to 25 Years | 0 (0.0%) | 63 (100.0%) |
| 25 to 34 Years | 40 (19.6%) | 90 (44.1%) |
| 35 to 44 Years | 54 (32.0%) | 115 (68.0%) |
| 45 to 54 Years | 97 (20.3%) | 407 (85.0%) |
| 55 to 64 Years | 273 (50.6%) | 282 (52.3%) |
| 65 to 74 Years | 470 (99.4%) | 242 (51.2%) |
| 75 Years and over | 165 (100.0%) | 106 (64.2%) |
| Total | 1,249 (50.0%) | 1,552 (62.2%) |
Disability Status by Sex by Age in Three Rivers
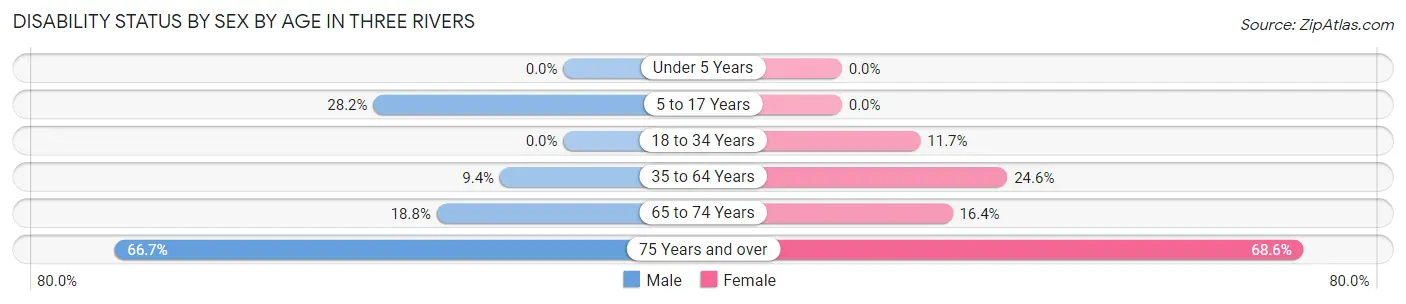
| Age Bracket | Male | Female |
| Under 5 Years | 0 (0.0%) | 0 (0.0%) |
| 5 to 17 Years | 66 (28.2%) | 0 (0.0%) |
| 18 to 34 Years | 0 (0.0%) | 14 (11.7%) |
| 35 to 64 Years | 62 (9.4%) | 130 (24.6%) |
| 65 to 74 Years | 50 (18.8%) | 34 (16.4%) |
| 75 Years and over | 40 (66.7%) | 72 (68.6%) |
Disability Class by Sex by Age in Three Rivers
Disability Class: Hearing Difficulty
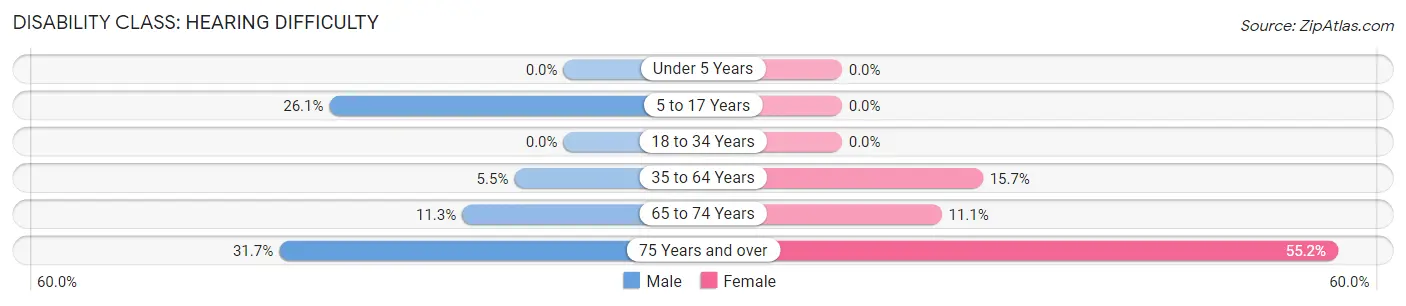
| Age Bracket | Male | Female |
| Under 5 Years | 0 (0.0%) | 0 (0.0%) |
| 5 to 17 Years | 61 (26.1%) | 0 (0.0%) |
| 18 to 34 Years | 0 (0.0%) | 0 (0.0%) |
| 35 to 64 Years | 36 (5.5%) | 83 (15.7%) |
| 65 to 74 Years | 30 (11.3%) | 23 (11.1%) |
| 75 Years and over | 19 (31.7%) | 58 (55.2%) |
Disability Class: Vision Difficulty
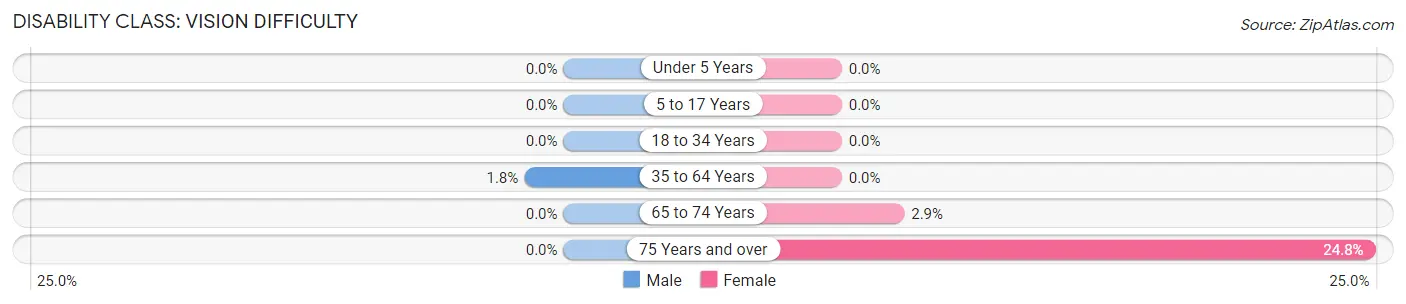
| Age Bracket | Male | Female |
| Under 5 Years | 0 (0.0%) | 0 (0.0%) |
| 5 to 17 Years | 0 (0.0%) | 0 (0.0%) |
| 18 to 34 Years | 0 (0.0%) | 0 (0.0%) |
| 35 to 64 Years | 12 (1.8%) | 0 (0.0%) |
| 65 to 74 Years | 0 (0.0%) | 6 (2.9%) |
| 75 Years and over | 0 (0.0%) | 26 (24.8%) |
Disability Class: Cognitive Difficulty
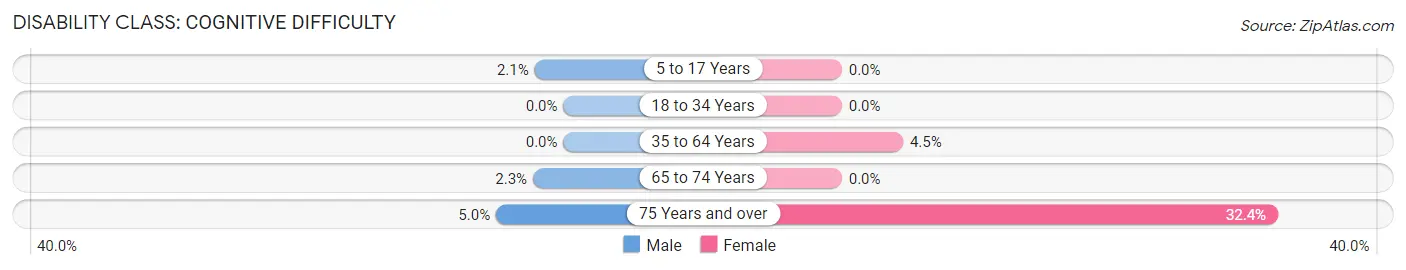
| Age Bracket | Male | Female |
| 5 to 17 Years | 5 (2.1%) | 0 (0.0%) |
| 18 to 34 Years | 0 (0.0%) | 0 (0.0%) |
| 35 to 64 Years | 0 (0.0%) | 24 (4.5%) |
| 65 to 74 Years | 6 (2.3%) | 0 (0.0%) |
| 75 Years and over | 3 (5.0%) | 34 (32.4%) |
Disability Class: Ambulatory Difficulty
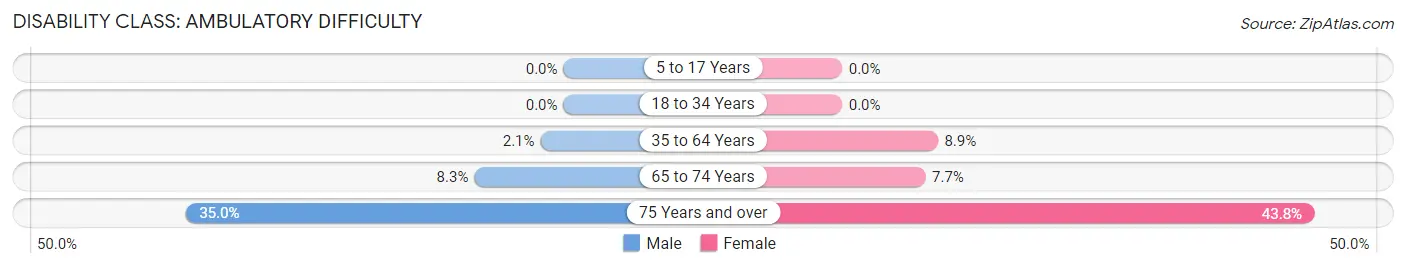
| Age Bracket | Male | Female |
| 5 to 17 Years | 0 (0.0%) | 0 (0.0%) |
| 18 to 34 Years | 0 (0.0%) | 0 (0.0%) |
| 35 to 64 Years | 14 (2.1%) | 47 (8.9%) |
| 65 to 74 Years | 22 (8.3%) | 16 (7.7%) |
| 75 Years and over | 21 (35.0%) | 46 (43.8%) |
Disability Class: Self-Care Difficulty
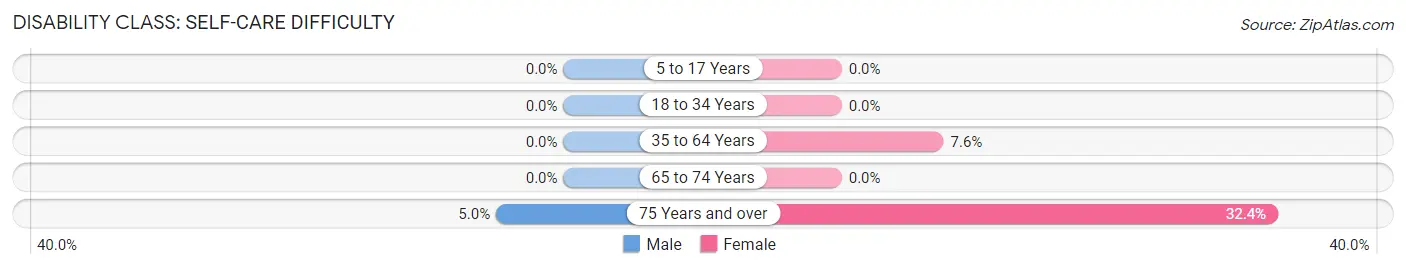
| Age Bracket | Male | Female |
| 5 to 17 Years | 0 (0.0%) | 0 (0.0%) |
| 18 to 34 Years | 0 (0.0%) | 0 (0.0%) |
| 35 to 64 Years | 0 (0.0%) | 40 (7.6%) |
| 65 to 74 Years | 0 (0.0%) | 0 (0.0%) |
| 75 Years and over | 3 (5.0%) | 34 (32.4%) |
Technology Access in Three Rivers
Computing Device Access in Three Rivers
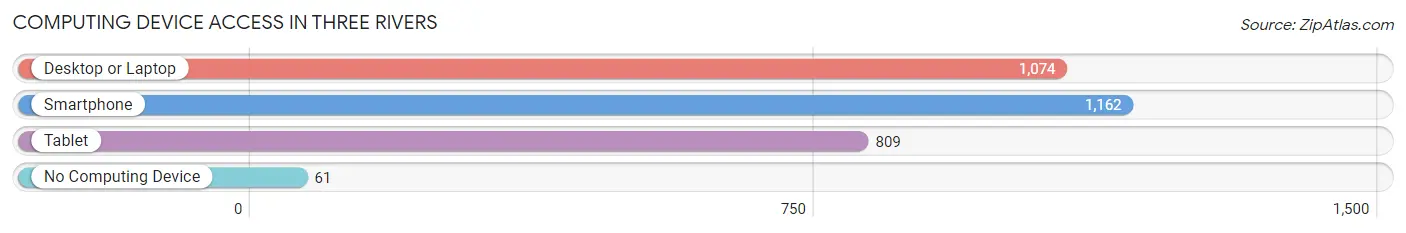
| Device Type | # Households | % Households |
| Desktop or Laptop | 1,074 | 84.8% |
| Smartphone | 1,162 | 91.7% |
| Tablet | 809 | 63.8% |
| No Computing Device | 61 | 4.8% |
| Total | 1,267 | 100.0% |
Internet Access in Three Rivers
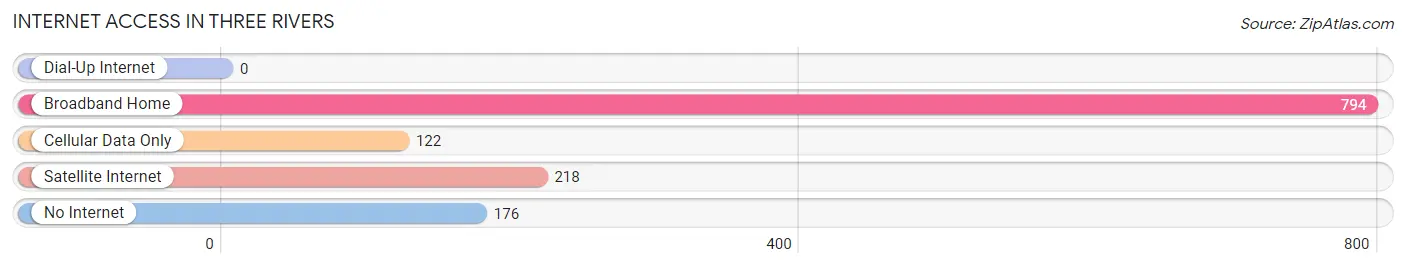
| Internet Type | # Households | % Households |
| Dial-Up Internet | 0 | 0.0% |
| Broadband Home | 794 | 62.7% |
| Cellular Data Only | 122 | 9.6% |
| Satellite Internet | 218 | 17.2% |
| No Internet | 176 | 13.9% |
| Total | 1,267 | 100.0% |
Three Rivers Summary
Three Rivers is a small unincorporated community located in Tulare County, California, United States. It is situated at the base of the Sierra Nevada mountain range, approximately 25 miles east of Visalia and 30 miles southeast of Fresno. The community is named for the three rivers that converge in the area: the Kaweah, the Tule, and the Kings.
History
The area that is now Three Rivers was originally inhabited by the Yokuts people, who lived in the area for thousands of years before the arrival of European settlers. The first Europeans to explore the area were Spanish missionaries, who arrived in the late 18th century. The area was later settled by ranchers and farmers, who established the town of Three Rivers in the late 19th century.
The town was officially incorporated in 1891, and the first post office was established in 1892. The town grew slowly over the next few decades, and by the mid-20th century, it had become a popular tourist destination due to its proximity to Sequoia National Park.
Geography
Three Rivers is located at the base of the Sierra Nevada mountain range, approximately 25 miles east of Visalia and 30 miles southeast of Fresno. The town is situated at an elevation of 1,400 feet, and is surrounded by rolling hills and oak woodlands. The climate is mild and temperate, with hot summers and cool winters.
The town is located at the confluence of three rivers: the Kaweah, the Tule, and the Kings. The rivers provide a variety of recreational activities, including fishing, swimming, and boating.
Economy
The economy of Three Rivers is largely based on tourism, as the town is located near Sequoia National Park and other popular attractions. The town is also home to a variety of small businesses, including restaurants, shops, and galleries.
Demographics
As of the 2010 census, the population of Three Rivers was 1,717. The racial makeup of the town was 87.3% White, 0.7% African American, 0.7% Native American, 0.7% Asian, 0.2% Pacific Islander, 8.2% from other races, and 2.2% from two or more races. Hispanic or Latino of any race were 16.2% of the population.
The median household income in Three Rivers was $41,250, and the median family income was $45,938. The per capita income was $20,945. About 11.2% of families and 14.2% of the population were below the poverty line, including 19.2% of those under age 18 and 8.2% of those age 65 or over.
Common Questions
What is Per Capita Income in Three Rivers?
Per Capita income in Three Rivers is $53,090.
What is the Median Family Income in Three Rivers?
Median Family Income in Three Rivers is $93,708.
What is the Median Household income in Three Rivers?
Median Household Income in Three Rivers is $78,590.
What is Income or Wage Gap in Three Rivers?
Income or Wage Gap in Three Rivers is 53.5%.
Women in Three Rivers earn 46.5 cents for every dollar earned by a man.
What is Inequality or Gini Index in Three Rivers?
Inequality or Gini Index in Three Rivers is 0.44.
What is the Total Population of Three Rivers?
Total Population of Three Rivers is 2,496.
What is the Total Male Population of Three Rivers?
Total Male Population of Three Rivers is 1,365.
What is the Total Female Population of Three Rivers?
Total Female Population of Three Rivers is 1,131.
What is the Ratio of Males per 100 Females in Three Rivers?
There are 120.69 Males per 100 Females in Three Rivers.
What is the Ratio of Females per 100 Males in Three Rivers?
There are 82.86 Females per 100 Males in Three Rivers.
What is the Median Population Age in Three Rivers?
Median Population Age in Three Rivers is 52.5 Years.
What is the Average Family Size in Three Rivers
Average Family Size in Three Rivers is 2.5 People.
What is the Average Household Size in Three Rivers
Average Household Size in Three Rivers is 2.0 People.
How Large is the Labor Force in Three Rivers?
There are 1,287 People in the Labor Forcein in Three Rivers.
What is the Percentage of People in the Labor Force in Three Rivers?
60.4% of People are in the Labor Force in Three Rivers.
What is the Unemployment Rate in Three Rivers?
Unemployment Rate in Three Rivers is 4.2%.