Pajaro, CA Map & Demographics
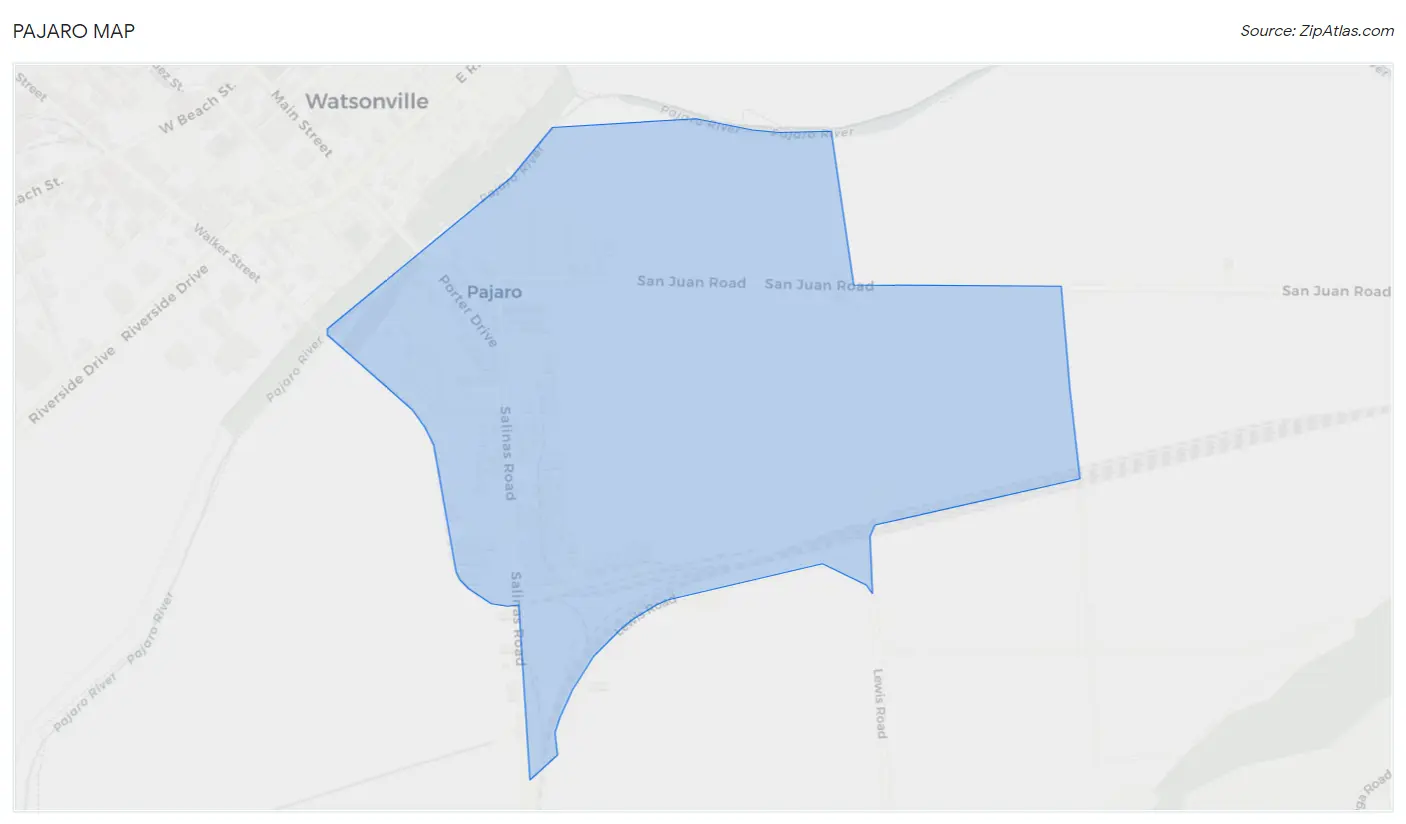
Pajaro Map
Pajaro Overview
$17,152
PER CAPITA INCOME
$77,589
AVG FAMILY INCOME
$81,475
AVG HOUSEHOLD INCOME
48.9%
WAGE / INCOME GAP [ % ]
51.1¢/ $1
WAGE / INCOME GAP [ $ ]
0.30
INEQUALITY / GINI INDEX
2,723
TOTAL POPULATION
1,469
MALE POPULATION
1,254
FEMALE POPULATION
117.15
MALES / 100 FEMALES
85.36
FEMALES / 100 MALES
29.9
MEDIAN AGE
5.0
AVG FAMILY SIZE
5.0
AVG HOUSEHOLD SIZE
1,206
LABOR FORCE [ PEOPLE ]
63.0%
PERCENT IN LABOR FORCE
24.8%
UNEMPLOYMENT RATE
Income in Pajaro
Income Overview in Pajaro
Per Capita Income in Pajaro is $17,152, while median incomes of families and households are $77,589 and $81,475 respectively.
| Characteristic | Number | Measure |
| Per Capita Income | 2,723 | $17,152 |
| Median Family Income | 445 | $77,589 |
| Mean Family Income | 445 | $84,377 |
| Median Household Income | 522 | $81,475 |
| Mean Household Income | 522 | $84,886 |
| Income Deficit | 445 | $0 |
| Wage / Income Gap (%) | 2,723 | 48.95% |
| Wage / Income Gap ($) | 2,723 | 51.05¢ per $1 |
| Gini / Inequality Index | 2,723 | 0.30 |
Earnings by Sex in Pajaro
Average Earnings in Pajaro are $24,693, $29,943 for men and $15,287 for women, a difference of 48.9%.
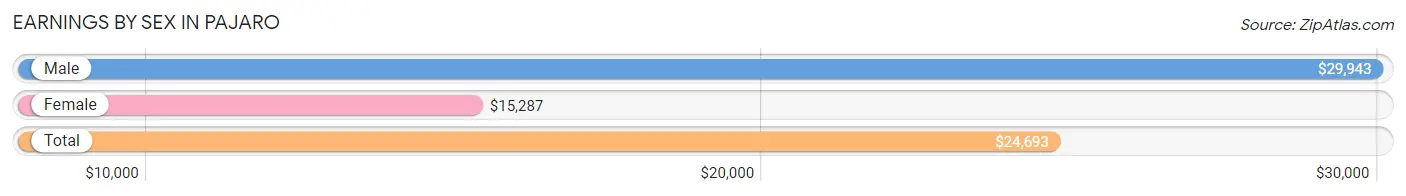
| Sex | Number | Average Earnings |
| Male | 737 (57.2%) | $29,943 |
| Female | 552 (42.8%) | $15,287 |
| Total | 1,289 (100.0%) | $24,693 |
Earnings by Sex by Income Bracket in Pajaro
The most common earnings brackets in Pajaro are $25,000 to $29,999 for men (129 | 17.5%) and $10,000 to $12,499 for women (122 | 22.1%).
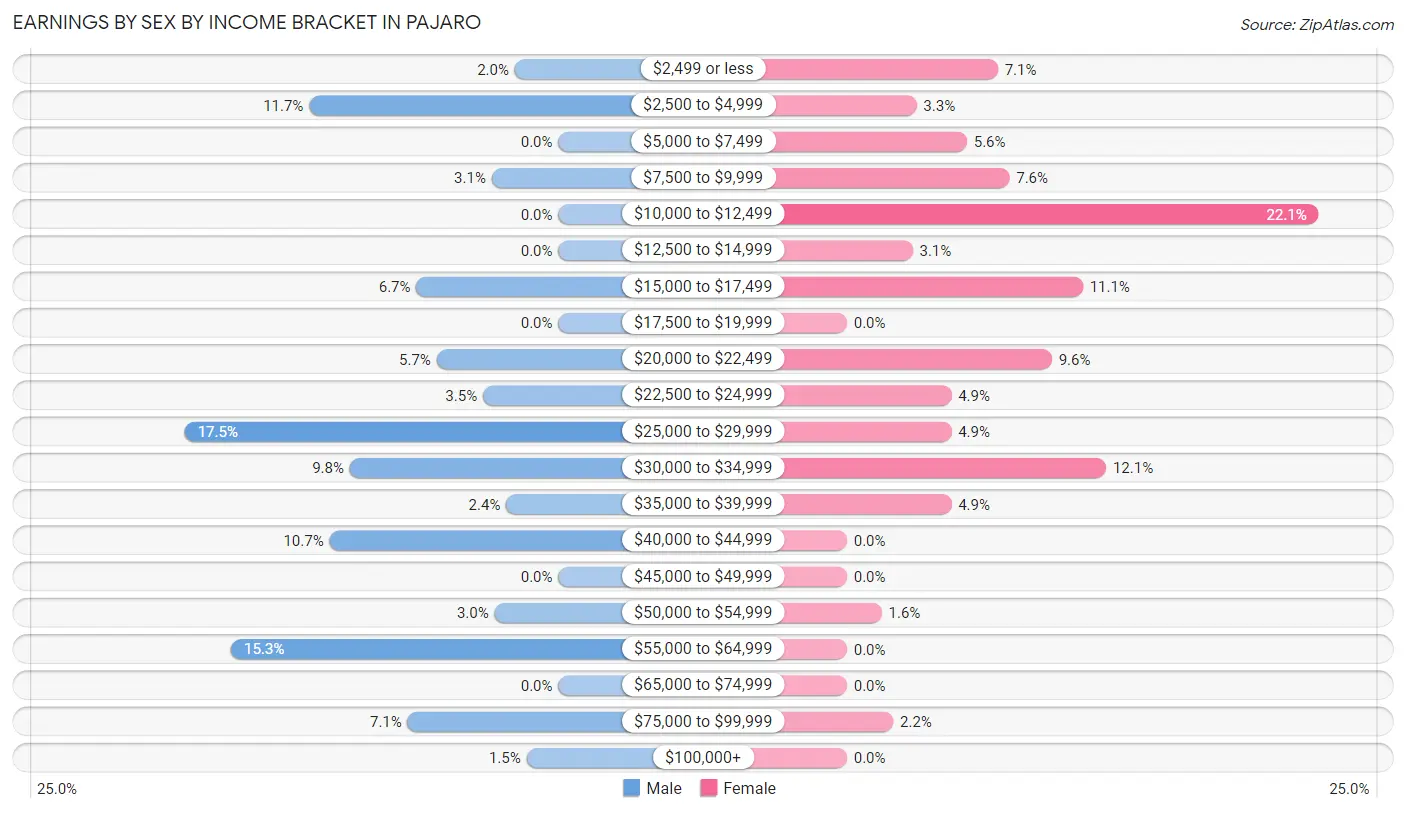
| Income | Male | Female |
| $2,499 or less | 15 (2.0%) | 39 (7.1%) |
| $2,500 to $4,999 | 86 (11.7%) | 18 (3.3%) |
| $5,000 to $7,499 | 0 (0.0%) | 31 (5.6%) |
| $7,500 to $9,999 | 23 (3.1%) | 42 (7.6%) |
| $10,000 to $12,499 | 0 (0.0%) | 122 (22.1%) |
| $12,500 to $14,999 | 0 (0.0%) | 17 (3.1%) |
| $15,000 to $17,499 | 49 (6.7%) | 61 (11.1%) |
| $17,500 to $19,999 | 0 (0.0%) | 0 (0.0%) |
| $20,000 to $22,499 | 42 (5.7%) | 53 (9.6%) |
| $22,500 to $24,999 | 26 (3.5%) | 27 (4.9%) |
| $25,000 to $29,999 | 129 (17.5%) | 27 (4.9%) |
| $30,000 to $34,999 | 72 (9.8%) | 67 (12.1%) |
| $35,000 to $39,999 | 18 (2.4%) | 27 (4.9%) |
| $40,000 to $44,999 | 79 (10.7%) | 0 (0.0%) |
| $45,000 to $49,999 | 0 (0.0%) | 0 (0.0%) |
| $50,000 to $54,999 | 22 (3.0%) | 9 (1.6%) |
| $55,000 to $64,999 | 113 (15.3%) | 0 (0.0%) |
| $65,000 to $74,999 | 0 (0.0%) | 0 (0.0%) |
| $75,000 to $99,999 | 52 (7.1%) | 12 (2.2%) |
| $100,000+ | 11 (1.5%) | 0 (0.0%) |
| Total | 737 (100.0%) | 552 (100.0%) |
Earnings by Sex by Educational Attainment in Pajaro
Average earnings in Pajaro are $40,000 for men and $16,168 for women, a difference of 59.6%. Men with an educational attainment of college or associate's degree enjoy the highest average annual earnings of $58,661, while those with less than high school education earn the least with $31,812. Women with an educational attainment of college or associate's degree earn the most with the average annual earnings of $33,851, while those with less than high school education have the smallest earnings of $13,235.
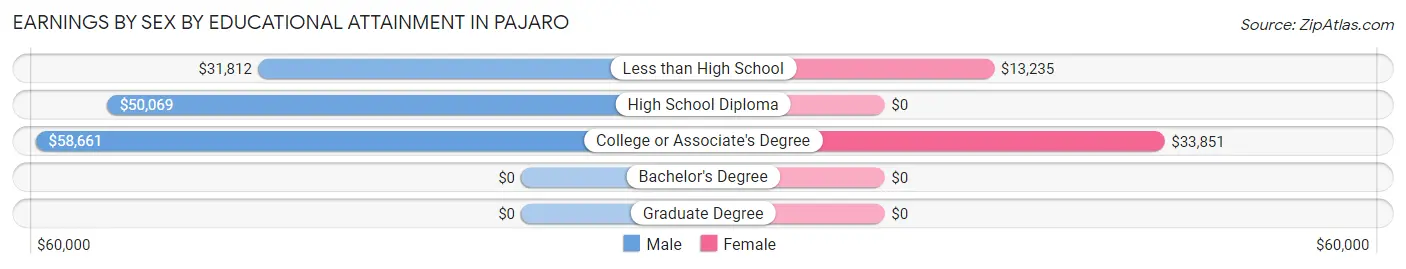
| Educational Attainment | Male Income | Female Income |
| Less than High School | $31,812 | $13,235 |
| High School Diploma | $50,069 | $0 |
| College or Associate's Degree | $58,661 | $33,851 |
| Bachelor's Degree | - | - |
| Graduate Degree | - | - |
| Total | $40,000 | $16,168 |
Family Income in Pajaro
Family Income Brackets in Pajaro
According to the Pajaro family income data, there are 123 families falling into the $75,000 to $99,999 income range, which is the most common income bracket and makes up 27.6% of all families.
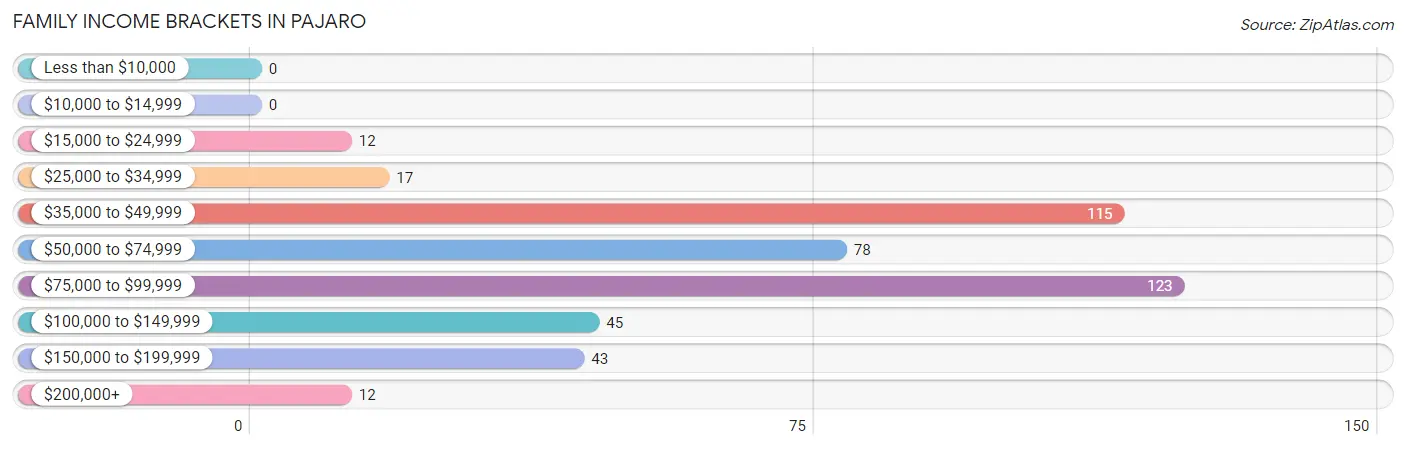
| Income Bracket | # Families | % Families |
| Less than $10,000 | 0 | 0.0% |
| $10,000 to $14,999 | 0 | 0.0% |
| $15,000 to $24,999 | 12 | 2.7% |
| $25,000 to $34,999 | 17 | 3.8% |
| $35,000 to $49,999 | 115 | 25.8% |
| $50,000 to $74,999 | 78 | 17.5% |
| $75,000 to $99,999 | 123 | 27.6% |
| $100,000 to $149,999 | 45 | 10.1% |
| $150,000 to $199,999 | 43 | 9.7% |
| $200,000+ | 12 | 2.7% |
Family Income by Famaliy Size in Pajaro
3-person families (93 | 20.9%) account for the highest median family income in Pajaro with $92,625 per family, while 3-person families (93 | 20.9%) have the highest median income of $30,875 per family member.
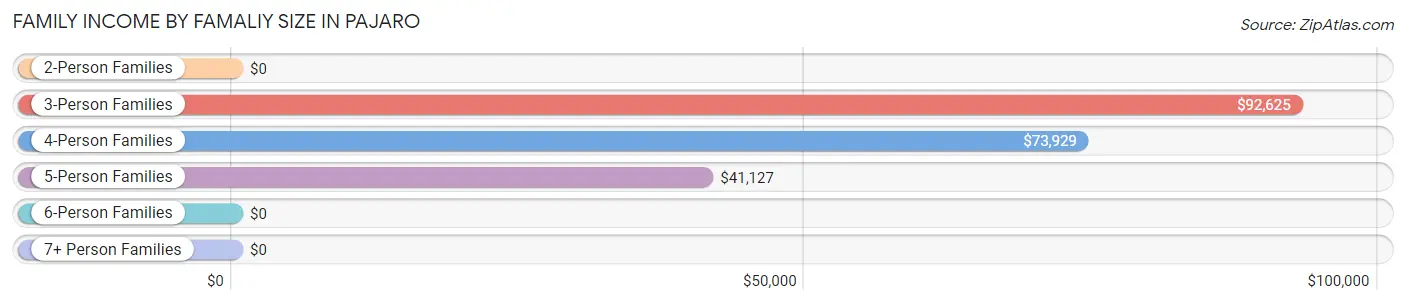
| Income Bracket | # Families | Median Income |
| 2-Person Families | 49 (11.0%) | $0 |
| 3-Person Families | 93 (20.9%) | $92,625 |
| 4-Person Families | 92 (20.7%) | $73,929 |
| 5-Person Families | 121 (27.2%) | $41,127 |
| 6-Person Families | 63 (14.2%) | $0 |
| 7+ Person Families | 27 (6.1%) | $0 |
| Total | 445 (100.0%) | $77,589 |
Family Income by Number of Earners in Pajaro
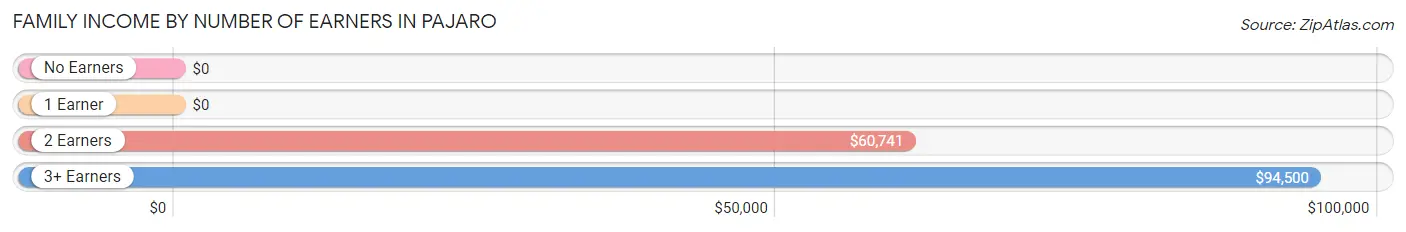
| Number of Earners | # Families | Median Income |
| No Earners | 41 (9.2%) | $0 |
| 1 Earner | 36 (8.1%) | $0 |
| 2 Earners | 234 (52.6%) | $60,741 |
| 3+ Earners | 134 (30.1%) | $94,500 |
| Total | 445 (100.0%) | $77,589 |
Household Income in Pajaro
Household Income Brackets in Pajaro
With 200 households falling in the category, the $75,000 to $99,999 income range is the most frequent in Pajaro, accounting for 38.3% of all households.
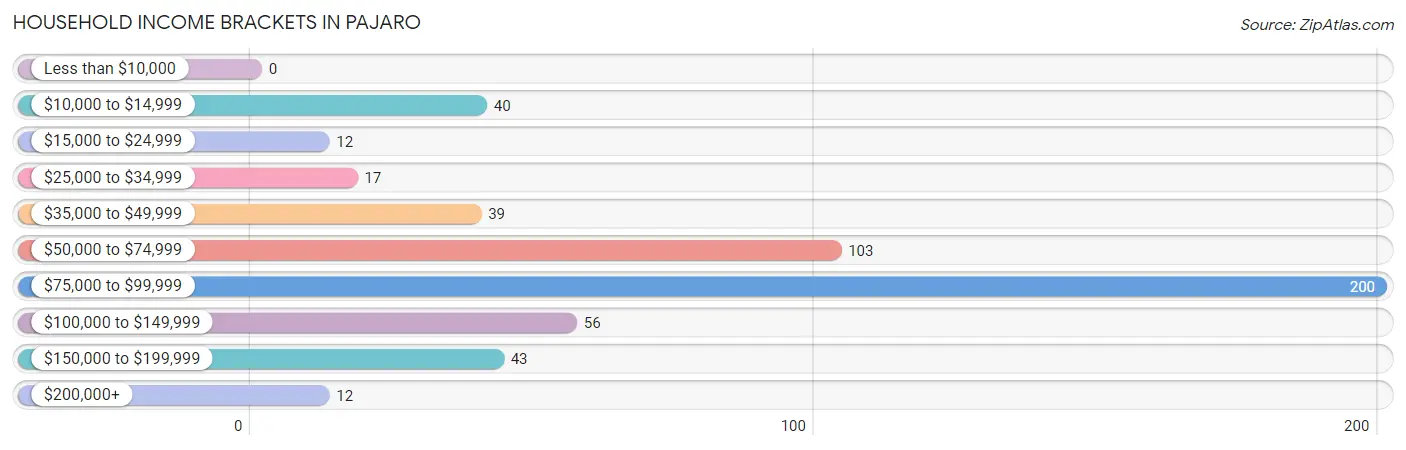
| Income Bracket | # Households | % Households |
| Less than $10,000 | 0 | 0.0% |
| $10,000 to $14,999 | 40 | 7.7% |
| $15,000 to $24,999 | 12 | 2.3% |
| $25,000 to $34,999 | 17 | 3.3% |
| $35,000 to $49,999 | 39 | 7.5% |
| $50,000 to $74,999 | 103 | 19.7% |
| $75,000 to $99,999 | 200 | 38.3% |
| $100,000 to $149,999 | 56 | 10.7% |
| $150,000 to $199,999 | 43 | 8.2% |
| $200,000+ | 12 | 2.3% |
Household Income by Householder Age in Pajaro
The median household income in Pajaro is $81,475, with the highest median household income of $94,830 found in the 65+ years age bracket for the primary householder. A total of 111 households (21.3%) fall into this category.
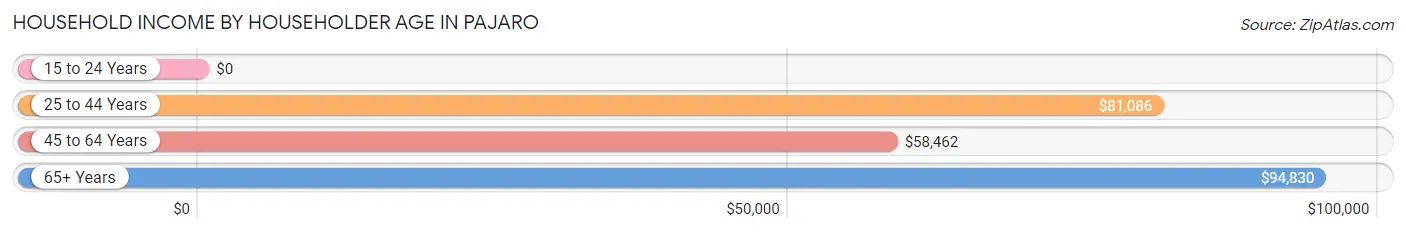
| Income Bracket | # Households | Median Income |
| 15 to 24 Years | 0 (0.0%) | $0 |
| 25 to 44 Years | 301 (57.7%) | $81,086 |
| 45 to 64 Years | 110 (21.1%) | $58,462 |
| 65+ Years | 111 (21.3%) | $94,830 |
| Total | 522 (100.0%) | $81,475 |
Poverty in Pajaro
Income Below Poverty by Sex and Age in Pajaro
With 19.6% poverty level for males and 16.8% for females among the residents of Pajaro, 12 to 14 year old males and 35 to 44 year old females are the most vulnerable to poverty, with 18 males (100.0%) and 53 females (38.1%) in their respective age groups living below the poverty level.
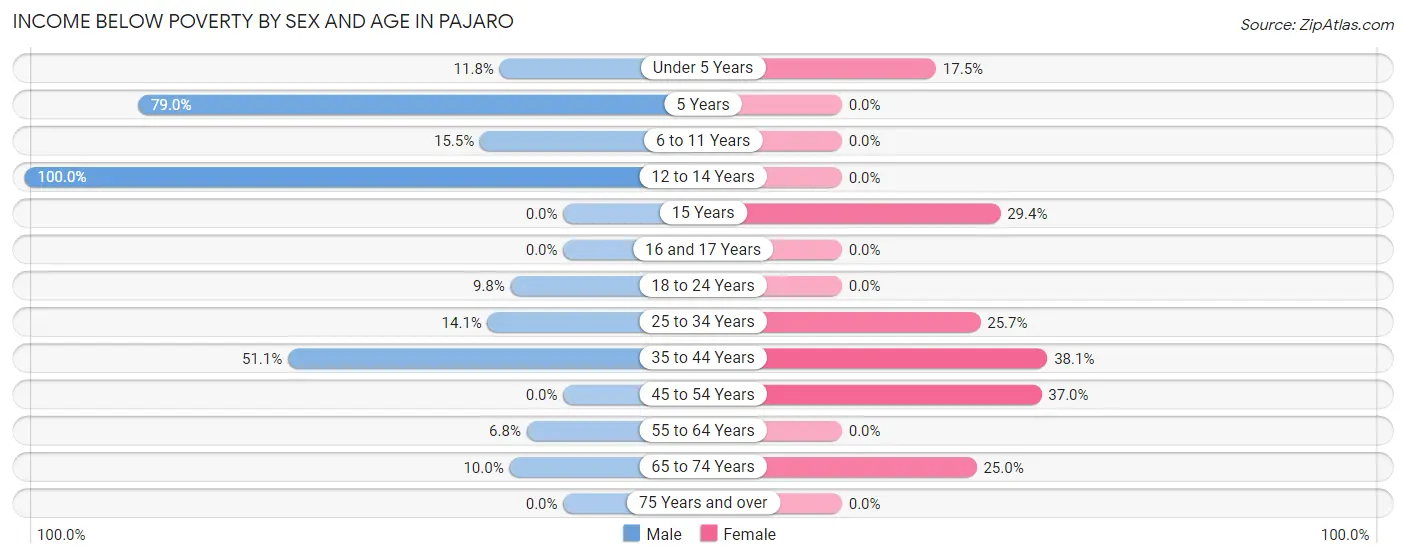
| Age Bracket | Male | Female |
| Under 5 Years | 26 (11.8%) | 29 (17.5%) |
| 5 Years | 15 (78.9%) | 0 (0.0%) |
| 6 to 11 Years | 15 (15.5%) | 0 (0.0%) |
| 12 to 14 Years | 18 (100.0%) | 0 (0.0%) |
| 15 Years | 0 (0.0%) | 15 (29.4%) |
| 16 and 17 Years | 0 (0.0%) | 0 (0.0%) |
| 18 to 24 Years | 28 (9.8%) | 0 (0.0%) |
| 25 to 34 Years | 26 (14.1%) | 63 (25.7%) |
| 35 to 44 Years | 139 (51.1%) | 53 (38.1%) |
| 45 to 54 Years | 0 (0.0%) | 30 (37.0%) |
| 55 to 64 Years | 10 (6.8%) | 0 (0.0%) |
| 65 to 74 Years | 11 (10.0%) | 21 (25.0%) |
| 75 Years and over | 0 (0.0%) | 0 (0.0%) |
| Total | 288 (19.6%) | 211 (16.8%) |
Income Above Poverty by Sex and Age in Pajaro
According to the poverty statistics in Pajaro, males aged 15 years and females aged 5 years are the age groups that are most secure financially, with 100.0% of males and 100.0% of females in these age groups living above the poverty line.
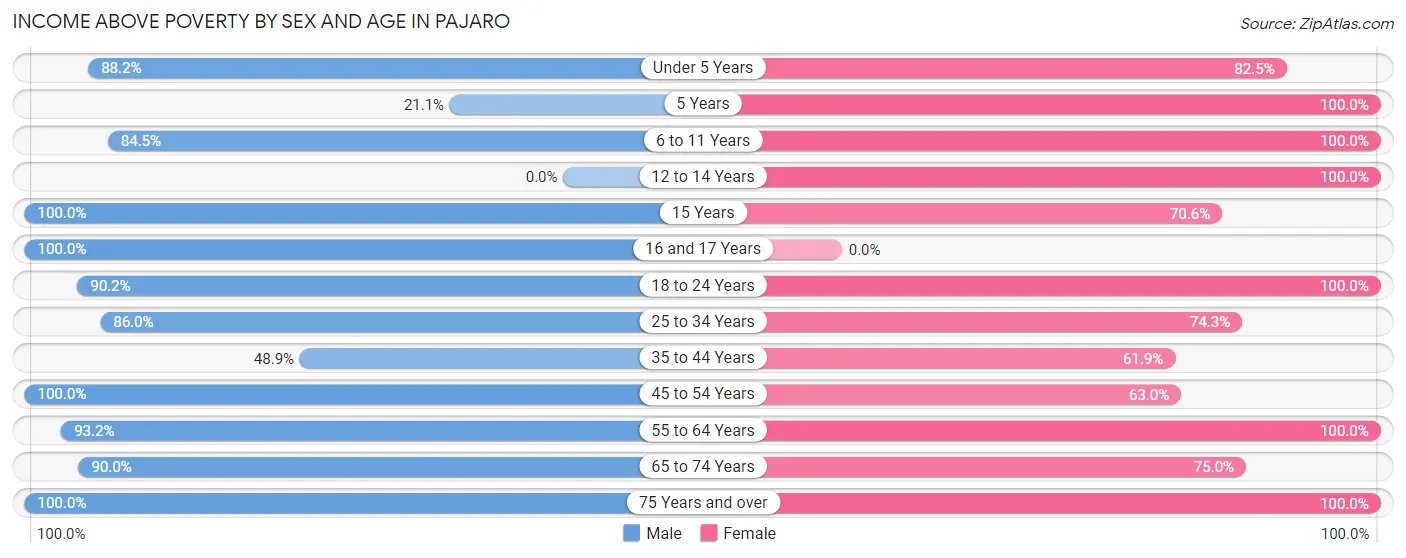
| Age Bracket | Male | Female |
| Under 5 Years | 194 (88.2%) | 137 (82.5%) |
| 5 Years | 4 (21.0%) | 94 (100.0%) |
| 6 to 11 Years | 82 (84.5%) | 83 (100.0%) |
| 12 to 14 Years | 0 (0.0%) | 44 (100.0%) |
| 15 Years | 17 (100.0%) | 36 (70.6%) |
| 16 and 17 Years | 6 (100.0%) | 0 (0.0%) |
| 18 to 24 Years | 258 (90.2%) | 99 (100.0%) |
| 25 to 34 Years | 159 (86.0%) | 182 (74.3%) |
| 35 to 44 Years | 133 (48.9%) | 86 (61.9%) |
| 45 to 54 Years | 65 (100.0%) | 51 (63.0%) |
| 55 to 64 Years | 137 (93.2%) | 108 (100.0%) |
| 65 to 74 Years | 99 (90.0%) | 63 (75.0%) |
| 75 Years and over | 27 (100.0%) | 60 (100.0%) |
| Total | 1,181 (80.4%) | 1,043 (83.2%) |
Income Below Poverty Among Married-Couple Families in Pajaro
The poverty statistics for married-couple families in Pajaro show that 5.0% or 17 of the total 340 families live below the poverty line. Families with 3 or 4 children have the highest poverty rate of 15.0%, comprising of 17 families. On the other hand, families with no children have the lowest poverty rate of 0.0%, which includes 0 families.
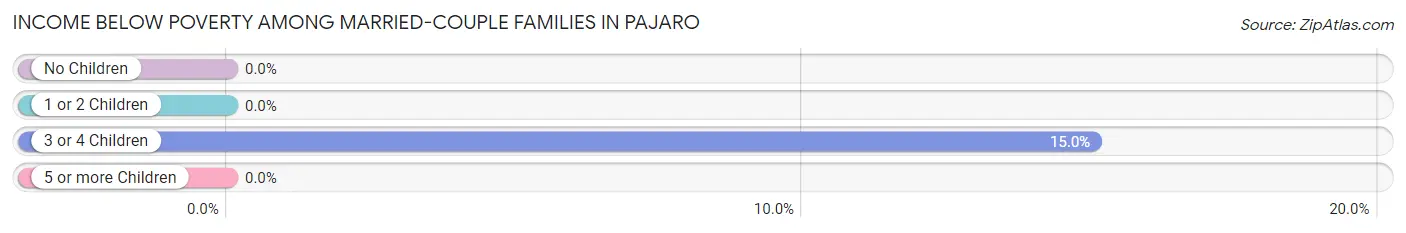
| Children | Above Poverty | Below Poverty |
| No Children | 131 (100.0%) | 0 (0.0%) |
| 1 or 2 Children | 96 (100.0%) | 0 (0.0%) |
| 3 or 4 Children | 96 (85.0%) | 17 (15.0%) |
| 5 or more Children | 0 (0.0%) | 0 (0.0%) |
| Total | 323 (95.0%) | 17 (5.0%) |
Income Below Poverty Among Single-Parent Households in Pajaro
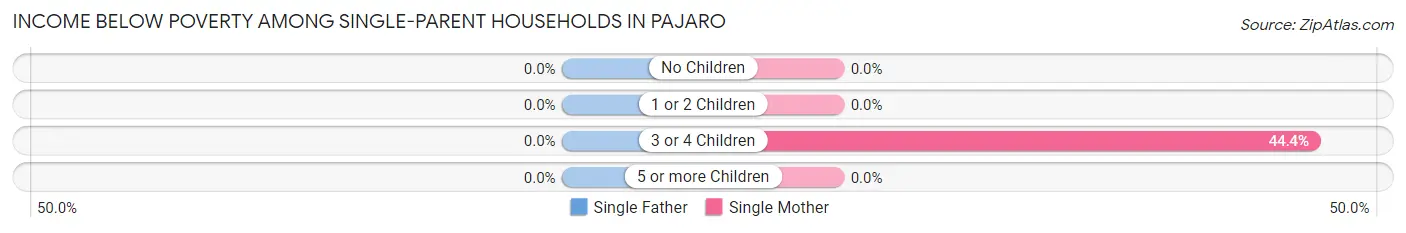
| Children | Single Father | Single Mother |
| No Children | 0 (0.0%) | 0 (0.0%) |
| 1 or 2 Children | 0 (0.0%) | 0 (0.0%) |
| 3 or 4 Children | 0 (0.0%) | 12 (44.4%) |
| 5 or more Children | 0 (0.0%) | 0 (0.0%) |
| Total | 0 (0.0%) | 12 (20.0%) |
Income Below Poverty Among Married-Couple vs Single-Parent Households in Pajaro
The poverty data for Pajaro shows that 17 of the married-couple family households (5.0%) and 12 of the single-parent households (11.4%) are living below the poverty level. Within the married-couple family households, those with 3 or 4 children have the highest poverty rate, with 17 households (15.0%) falling below the poverty line. Among the single-parent households, those with 3 or 4 children have the highest poverty rate, with 12 household (44.4%) living below poverty.
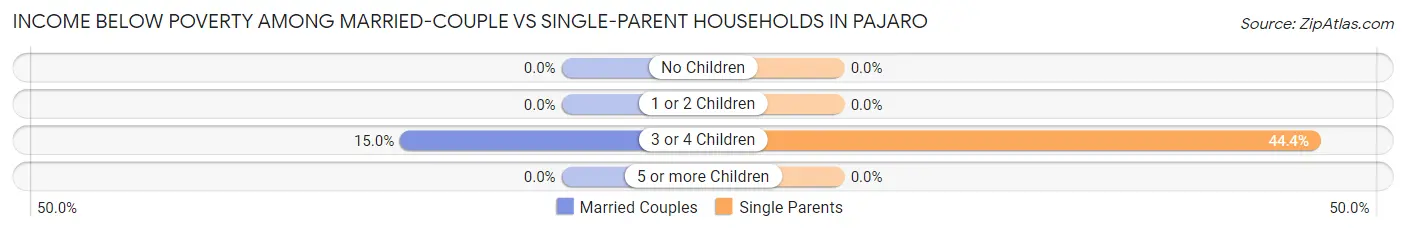
| Children | Married-Couple Families | Single-Parent Households |
| No Children | 0 (0.0%) | 0 (0.0%) |
| 1 or 2 Children | 0 (0.0%) | 0 (0.0%) |
| 3 or 4 Children | 17 (15.0%) | 12 (44.4%) |
| 5 or more Children | 0 (0.0%) | 0 (0.0%) |
| Total | 17 (5.0%) | 12 (11.4%) |
Race in Pajaro
The most populous races in Pajaro are Hispanic or Latino (2,544 | 93.4%), Some other Race (1,381 | 50.7%), and White / Caucasian (748 | 27.5%).
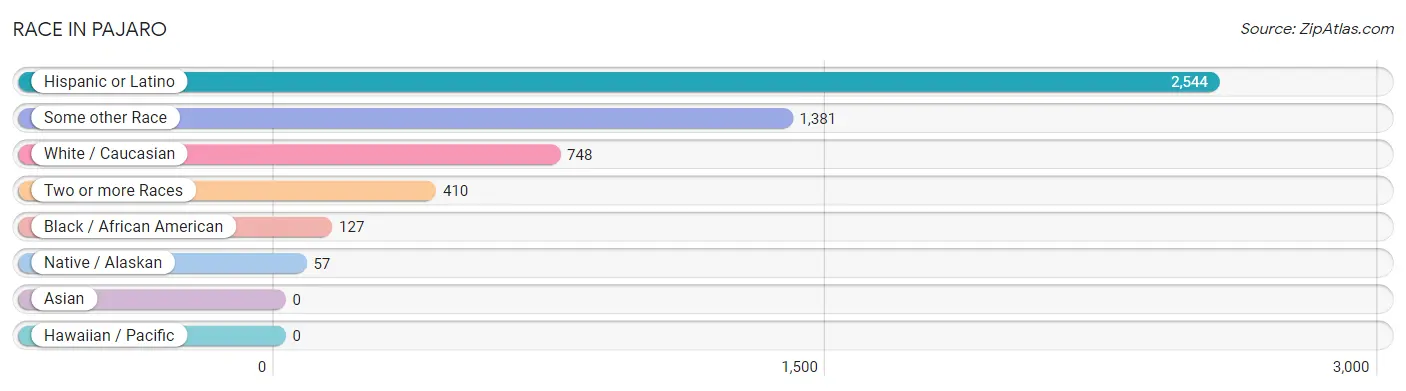
| Race | # Population | % Population |
| Asian | 0 | 0.0% |
| Black / African American | 127 | 4.7% |
| Hawaiian / Pacific | 0 | 0.0% |
| Hispanic or Latino | 2,544 | 93.4% |
| Native / Alaskan | 57 | 2.1% |
| White / Caucasian | 748 | 27.5% |
| Two or more Races | 410 | 15.1% |
| Some other Race | 1,381 | 50.7% |
| Total | 2,723 | 100.0% |
Ancestry in Pajaro
The most populous ancestries reported in Pajaro are Mexican (2,523 | 92.7%), Mexican American Indian (28 | 1.0%), Chickasaw (23 | 0.8%), Korean (21 | 0.8%), and Spanish (21 | 0.8%), together accounting for 96.1% of all Pajaro residents.
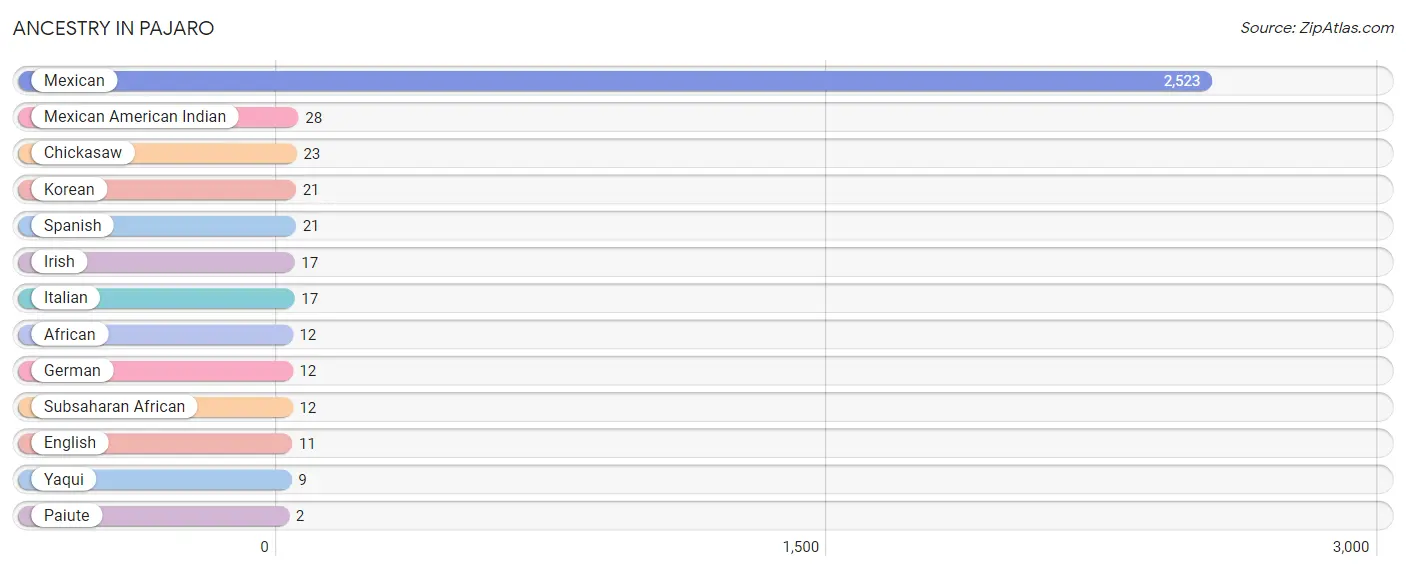
| Ancestry | # Population | % Population |
| African | 12 | 0.4% |
| Chickasaw | 23 | 0.8% |
| English | 11 | 0.4% |
| German | 12 | 0.4% |
| Irish | 17 | 0.6% |
| Italian | 17 | 0.6% |
| Korean | 21 | 0.8% |
| Mexican | 2,523 | 92.7% |
| Mexican American Indian | 28 | 1.0% |
| Paiute | 2 | 0.1% |
| Spanish | 21 | 0.8% |
| Subsaharan African | 12 | 0.4% |
| Yaqui | 9 | 0.3% | View All 13 Rows |
Immigrants in Pajaro
The most numerous immigrant groups reported in Pajaro came from Central America (1,165 | 42.8%), Latin America (1,165 | 42.8%), and Mexico (1,165 | 42.8%), together accounting for 128.3% of all Pajaro residents.
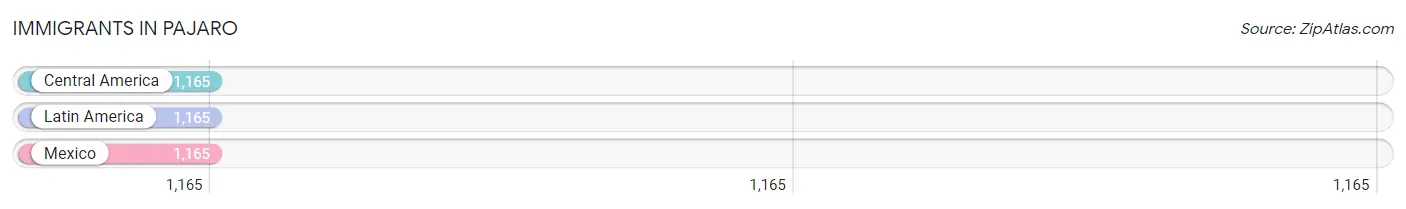
| Immigration Origin | # Population | % Population |
| Central America | 1,165 | 42.8% |
| Latin America | 1,165 | 42.8% |
| Mexico | 1,165 | 42.8% | View All 3 Rows |
Sex and Age in Pajaro
Sex and Age in Pajaro
The most populous age groups in Pajaro are Under 5 Years (220 | 15.0%) for men and 30 to 34 Years (168 | 13.4%) for women.
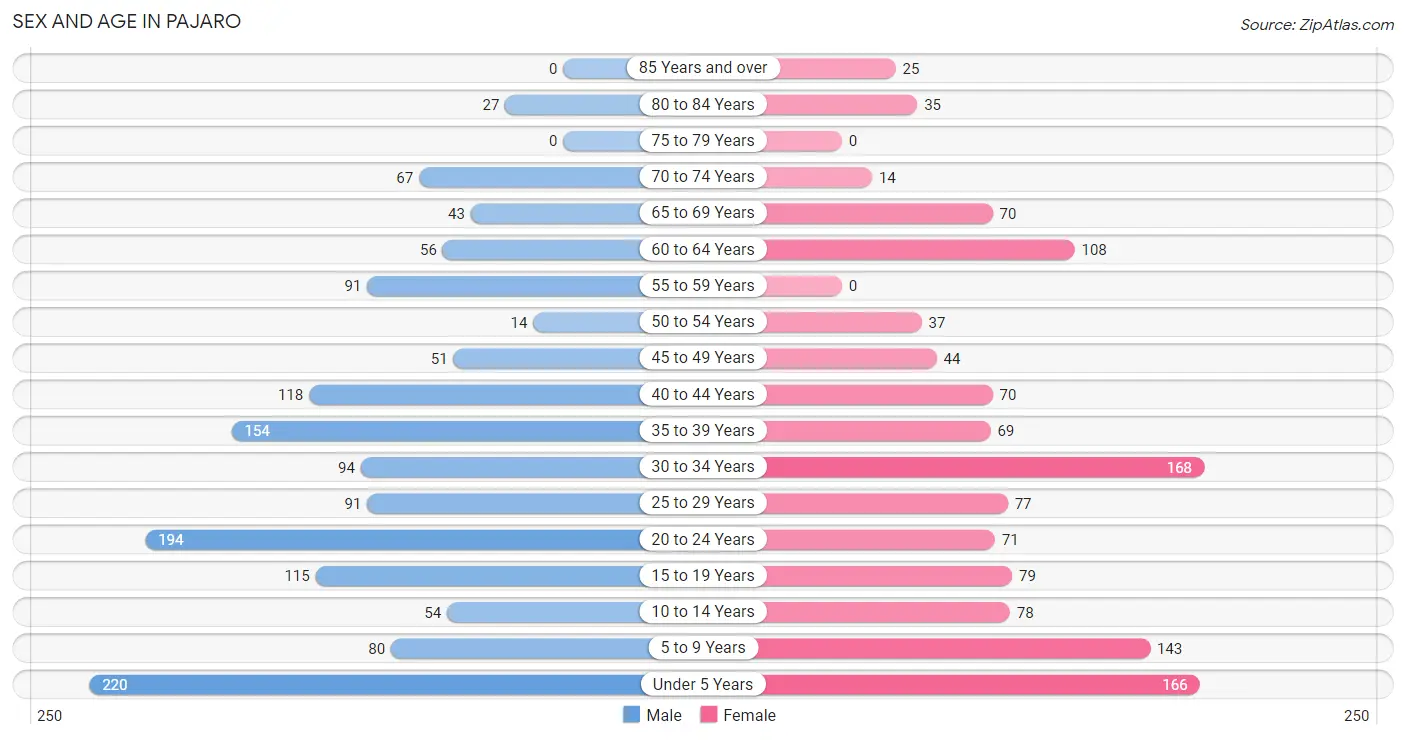
| Age Bracket | Male | Female |
| Under 5 Years | 220 (15.0%) | 166 (13.2%) |
| 5 to 9 Years | 80 (5.4%) | 143 (11.4%) |
| 10 to 14 Years | 54 (3.7%) | 78 (6.2%) |
| 15 to 19 Years | 115 (7.8%) | 79 (6.3%) |
| 20 to 24 Years | 194 (13.2%) | 71 (5.7%) |
| 25 to 29 Years | 91 (6.2%) | 77 (6.1%) |
| 30 to 34 Years | 94 (6.4%) | 168 (13.4%) |
| 35 to 39 Years | 154 (10.5%) | 69 (5.5%) |
| 40 to 44 Years | 118 (8.0%) | 70 (5.6%) |
| 45 to 49 Years | 51 (3.5%) | 44 (3.5%) |
| 50 to 54 Years | 14 (0.9%) | 37 (2.9%) |
| 55 to 59 Years | 91 (6.2%) | 0 (0.0%) |
| 60 to 64 Years | 56 (3.8%) | 108 (8.6%) |
| 65 to 69 Years | 43 (2.9%) | 70 (5.6%) |
| 70 to 74 Years | 67 (4.6%) | 14 (1.1%) |
| 75 to 79 Years | 0 (0.0%) | 0 (0.0%) |
| 80 to 84 Years | 27 (1.8%) | 35 (2.8%) |
| 85 Years and over | 0 (0.0%) | 25 (2.0%) |
| Total | 1,469 (100.0%) | 1,254 (100.0%) |
Families and Households in Pajaro
Median Family Size in Pajaro
The median family size in Pajaro is 5.05 persons per family, with single female/mother families (60 | 13.5%) accounting for the largest median family size of 5.35 persons per family. On the other hand, single male/father families (45 | 10.1%) represent the smallest median family size with 3.96 persons per family.
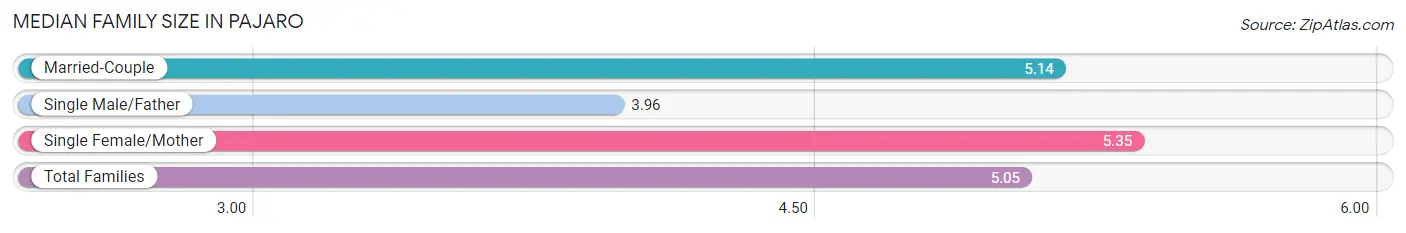
| Family Type | # Families | Family Size |
| Married-Couple | 340 (76.4%) | 5.14 |
| Single Male/Father | 45 (10.1%) | 3.96 |
| Single Female/Mother | 60 (13.5%) | 5.35 |
| Total Families | 445 (100.0%) | 5.05 |
Median Household Size in Pajaro
The median household size in Pajaro is 4.95 persons per household, with single female/mother households (60 | 11.5%) accounting for the largest median household size of 5.85 persons per household. non-family households (77 | 14.7%) represent the smallest median household size with 1.56 persons per household.
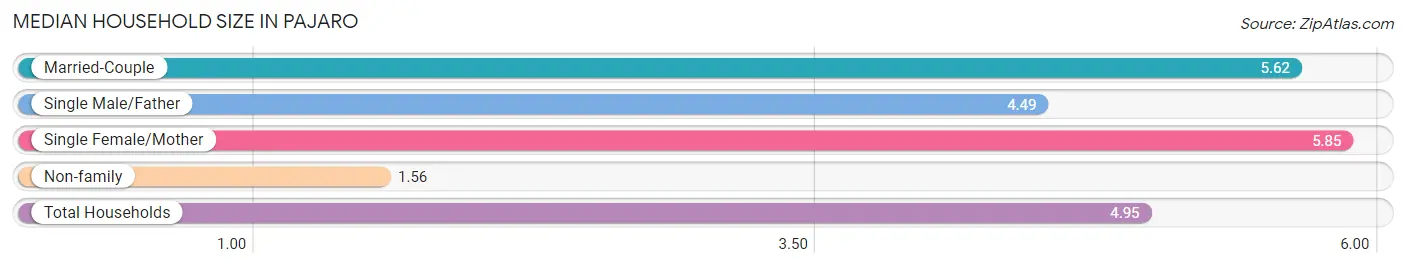
| Household Type | # Households | Household Size |
| Married-Couple | 340 (65.1%) | 5.62 |
| Single Male/Father | 45 (8.6%) | 4.49 |
| Single Female/Mother | 60 (11.5%) | 5.85 |
| Non-family | 77 (14.7%) | 1.56 |
| Total Households | 522 (100.0%) | 4.95 |
Household Size by Marriage Status in Pajaro
Out of a total of 522 households in Pajaro, 445 (85.3%) are family households, while 77 (14.7%) are nonfamily households. The most numerous type of family households are 7+ person households, comprising 119, and the most common type of nonfamily households are 1-person households, comprising 40.
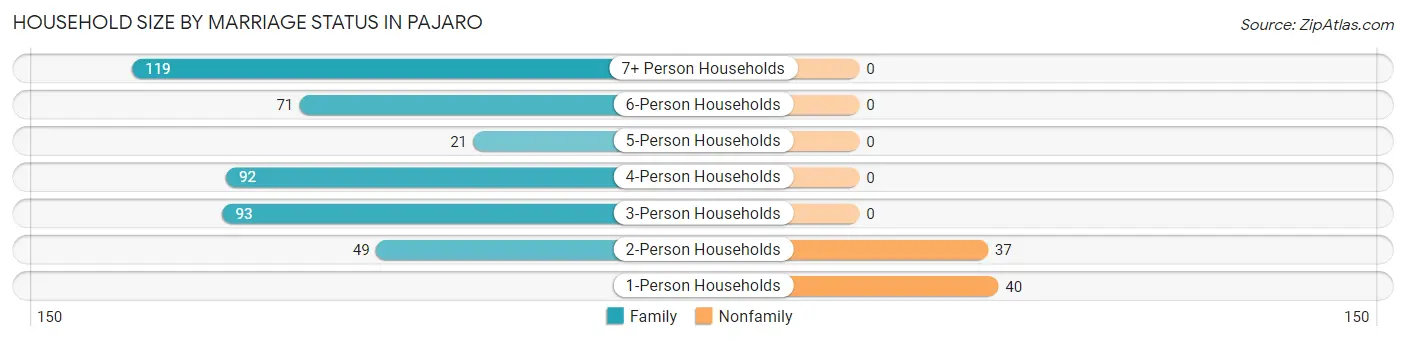
| Household Size | Family Households | Nonfamily Households |
| 1-Person Households | - | 40 (7.7%) |
| 2-Person Households | 49 (9.4%) | 37 (7.1%) |
| 3-Person Households | 93 (17.8%) | 0 (0.0%) |
| 4-Person Households | 92 (17.6%) | 0 (0.0%) |
| 5-Person Households | 21 (4.0%) | 0 (0.0%) |
| 6-Person Households | 71 (13.6%) | 0 (0.0%) |
| 7+ Person Households | 119 (22.8%) | 0 (0.0%) |
| Total | 445 (85.3%) | 77 (14.7%) |
Female Fertility in Pajaro
Fertility by Age in Pajaro
Average fertility rate in Pajaro is 163.0 births per 1,000 women. Women in the age bracket of 20 to 34 years have the highest fertility rate with 297.0 births per 1,000 women. Women in the age bracket of 20 to 34 years acount for 100.0% of all women with births.
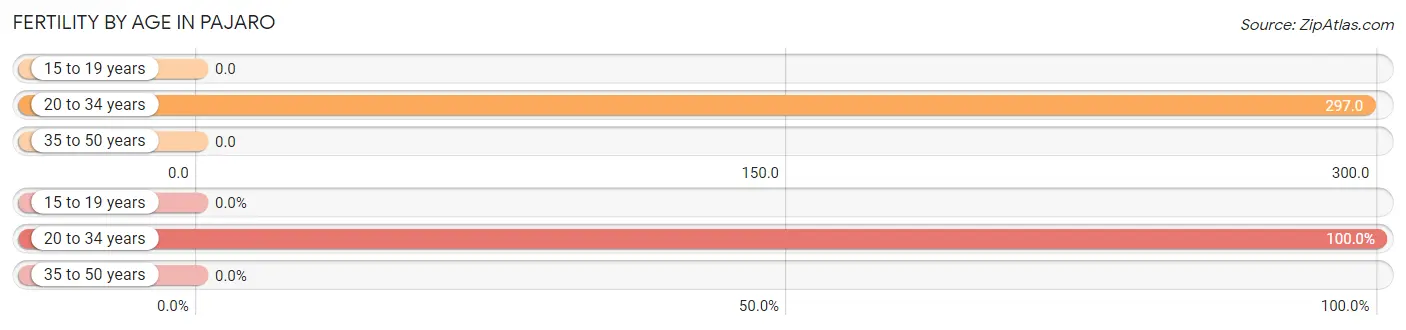
| Age Bracket | Women with Births | Births / 1,000 Women |
| 15 to 19 years | 0 (0.0%) | 0.0 |
| 20 to 34 years | 94 (100.0%) | 297.0 |
| 35 to 50 years | 0 (0.0%) | 0.0 |
| Total | 94 (100.0%) | 163.0 |
Fertility by Age by Marriage Status in Pajaro
84.0% of women with births (94) in Pajaro are married. The highest percentage of unmarried women with births falls into 20 to 34 years age bracket with 16.0% of them unmarried at the time of birth, while the lowest percentage of unmarried women with births belong to 20 to 34 years age bracket with 16.0% of them unmarried.
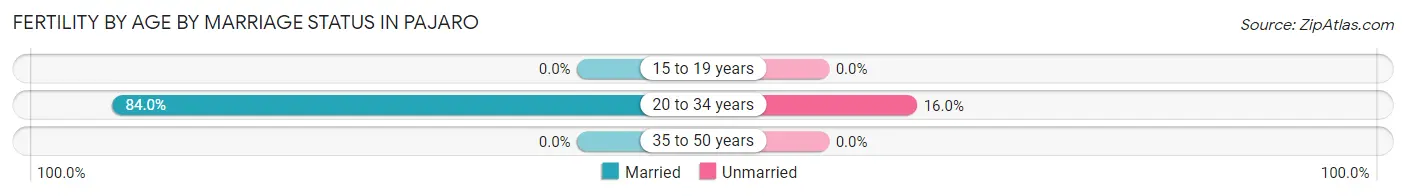
| Age Bracket | Married | Unmarried |
| 15 to 19 years | 0 (0.0%) | 0 (0.0%) |
| 20 to 34 years | 79 (84.0%) | 15 (16.0%) |
| 35 to 50 years | 0 (0.0%) | 0 (0.0%) |
| Total | 79 (84.0%) | 15 (16.0%) |
Fertility by Education in Pajaro
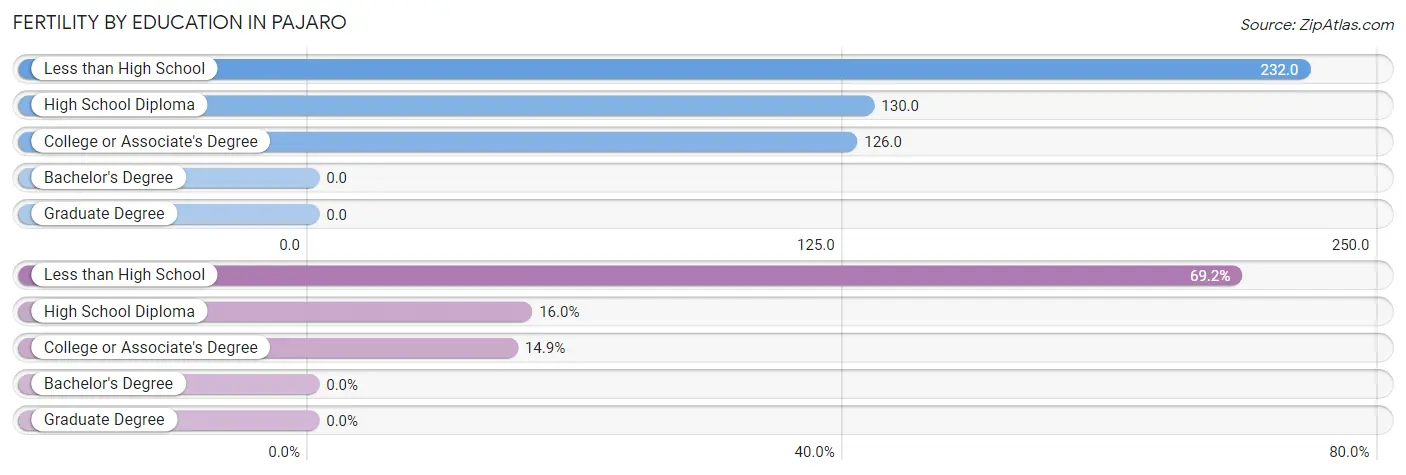
| Educational Attainment | Women with Births | Births / 1,000 Women |
| Less than High School | 65 (69.2%) | 232.0 |
| High School Diploma | 15 (16.0%) | 130.0 |
| College or Associate's Degree | 14 (14.9%) | 126.0 |
| Bachelor's Degree | 0 (0.0%) | 0.0 |
| Graduate Degree | 0 (0.0%) | 0.0 |
| Total | 94 (100.0%) | 163.0 |
Fertility by Education by Marriage Status in Pajaro
16.0% of women with births in Pajaro are unmarried. Women with the educational attainment of less than high school are most likely to be married with 100.0% of them married at childbirth, while women with the educational attainment of high school diploma are least likely to be married with 100.0% of them unmarried at childbirth.
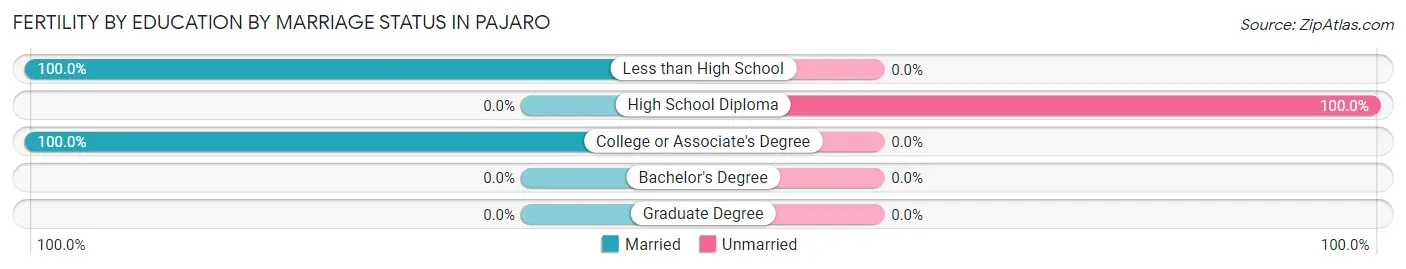
| Educational Attainment | Married | Unmarried |
| Less than High School | 65 (100.0%) | 0 (0.0%) |
| High School Diploma | 0 (0.0%) | 15 (100.0%) |
| College or Associate's Degree | 14 (100.0%) | 0 (0.0%) |
| Bachelor's Degree | 0 (0.0%) | 0 (0.0%) |
| Graduate Degree | 0 (0.0%) | 0 (0.0%) |
| Total | 79 (84.0%) | 15 (16.0%) |
Employment Characteristics in Pajaro
Employment by Class of Employer in Pajaro
Among the 826 employed individuals in Pajaro, private company employees (628 | 76.0%), local government employees (86 | 10.4%), and not-for-profit organizations (40 | 4.8%) make up the most common classes of employment.
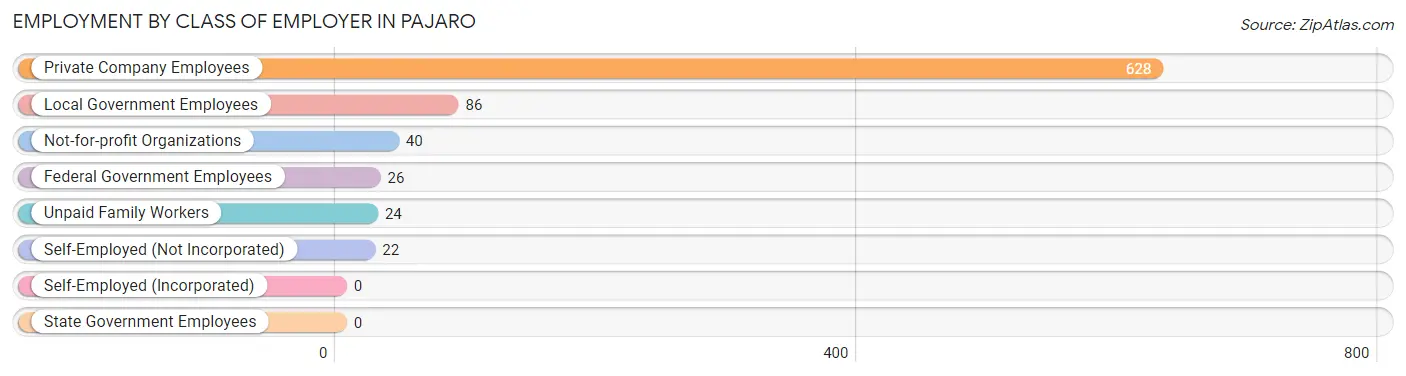
| Employer Class | # Employees | % Employees |
| Private Company Employees | 628 | 76.0% |
| Self-Employed (Incorporated) | 0 | 0.0% |
| Self-Employed (Not Incorporated) | 22 | 2.7% |
| Not-for-profit Organizations | 40 | 4.8% |
| Local Government Employees | 86 | 10.4% |
| State Government Employees | 0 | 0.0% |
| Federal Government Employees | 26 | 3.2% |
| Unpaid Family Workers | 24 | 2.9% |
| Total | 826 | 100.0% |
Employment Status by Age in Pajaro
According to the labor force statistics for Pajaro, out of the total population over 16 years of age (1,914), 63.0% or 1,206 individuals are in the labor force, with 24.8% or 299 of them unemployed. The age group with the highest labor force participation rate is 45 to 54 years, with 76.7% or 112 individuals in the labor force. Within the labor force, the 25 to 29 years age range has the highest percentage of unemployed individuals, with 50.5% or 53 of them being unemployed.
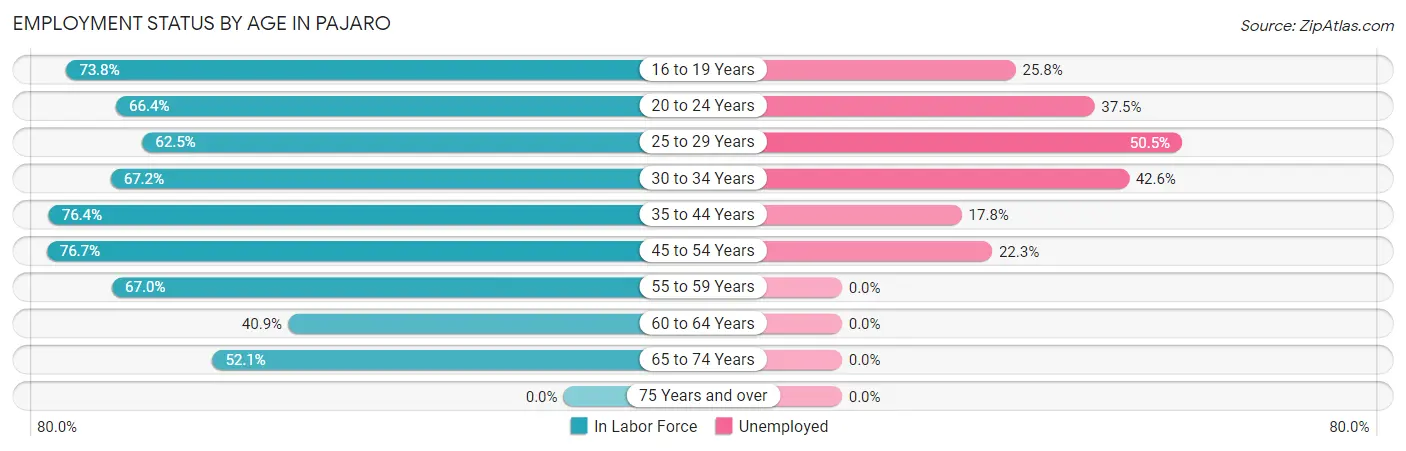
| Age Bracket | In Labor Force | Unemployed |
| 16 to 19 Years | 93 (73.8%) | 24 (25.8%) |
| 20 to 24 Years | 176 (66.4%) | 66 (37.5%) |
| 25 to 29 Years | 105 (62.5%) | 53 (50.5%) |
| 30 to 34 Years | 176 (67.2%) | 75 (42.6%) |
| 35 to 44 Years | 314 (76.4%) | 56 (17.8%) |
| 45 to 54 Years | 112 (76.7%) | 25 (22.3%) |
| 55 to 59 Years | 61 (67.0%) | 0 (0.0%) |
| 60 to 64 Years | 67 (40.9%) | 0 (0.0%) |
| 65 to 74 Years | 101 (52.1%) | 0 (0.0%) |
| 75 Years and over | 0 (0.0%) | 0 (0.0%) |
| Total | 1,206 (63.0%) | 299 (24.8%) |
Employment Status by Educational Attainment in Pajaro
According to labor force statistics for Pajaro, 67.2% of individuals (835) out of the total population between 25 and 64 years of age (1,242) are in the labor force, with 25.0% or 209 of them being unemployed. The group with the highest labor force participation rate are those with the educational attainment of bachelor's degree or higher, with 72.7% or 72 individuals in the labor force. Within the labor force, individuals with bachelor's degree or higher education have the highest percentage of unemployment, with 100.0% or 72 of them being unemployed.
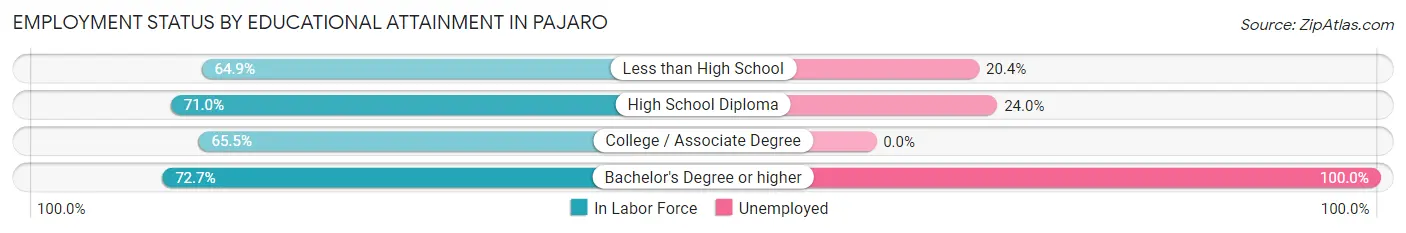
| Educational Attainment | In Labor Force | Unemployed |
| Less than High School | 397 (64.9%) | 125 (20.4%) |
| High School Diploma | 233 (71.0%) | 79 (24.0%) |
| College / Associate Degree | 133 (65.5%) | 0 (0.0%) |
| Bachelor's Degree or higher | 72 (72.7%) | 99 (100.0%) |
| Total | 835 (67.2%) | 310 (25.0%) |
Employment Occupations by Sex in Pajaro
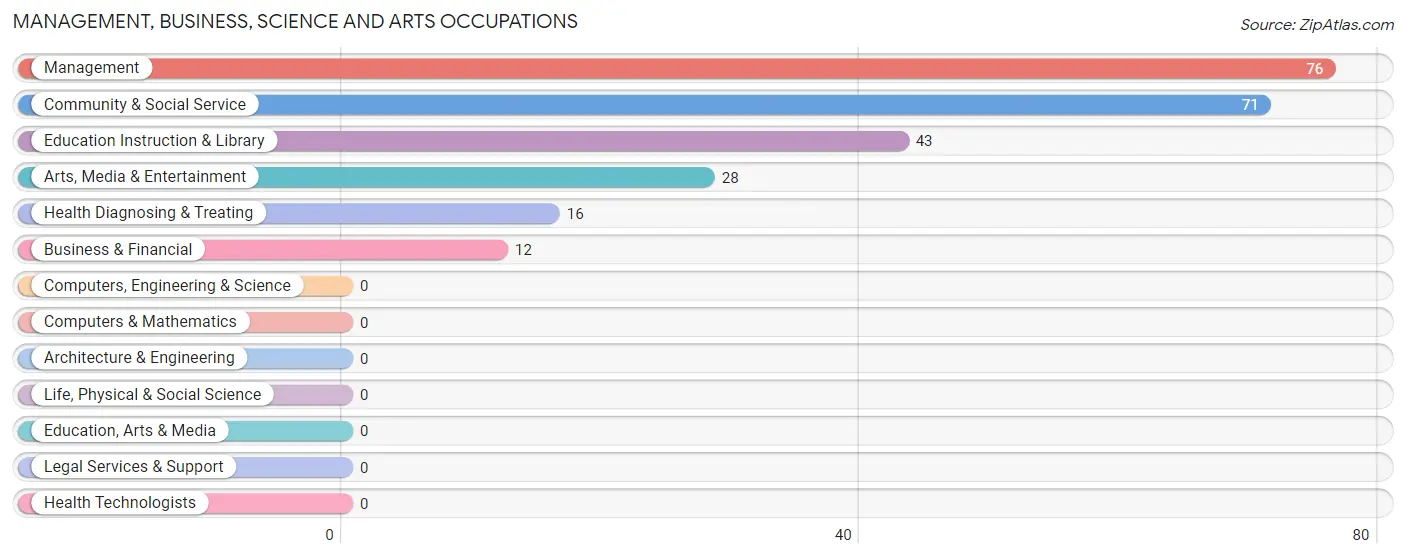
Management, Business, Science and Arts Occupations
The most common Management, Business, Science and Arts occupations in Pajaro are Management (76 | 8.4%), Community & Social Service (71 | 7.8%), Education Instruction & Library (43 | 4.8%), Arts, Media & Entertainment (28 | 3.1%), and Health Diagnosing & Treating (16 | 1.8%).
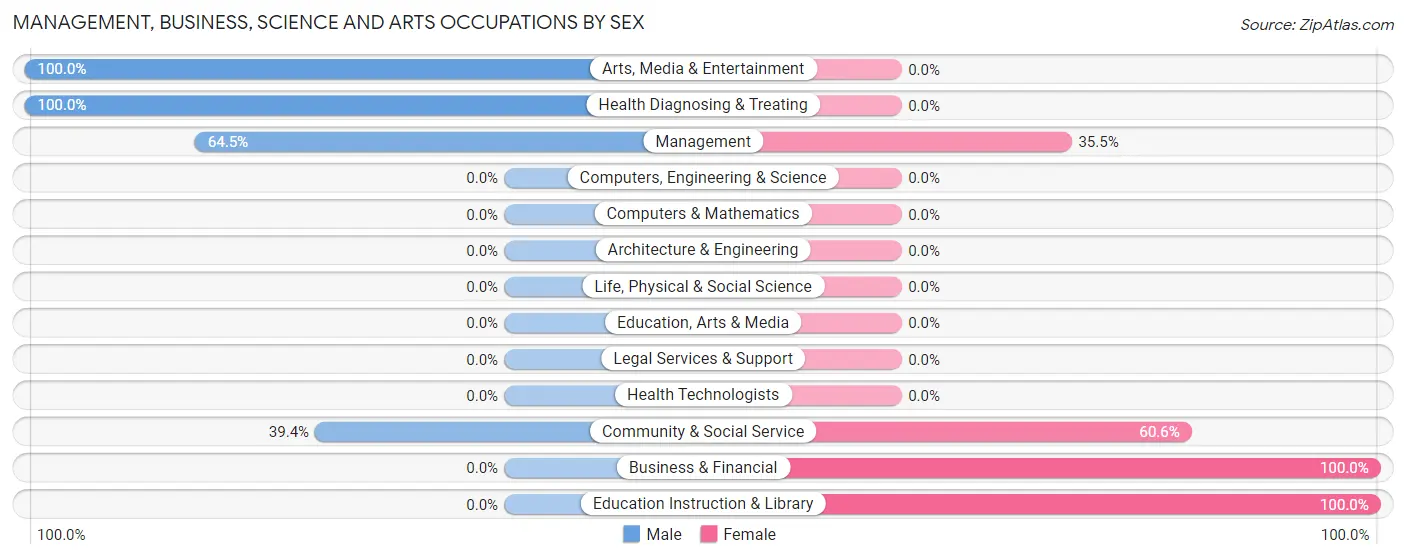
Management, Business, Science and Arts Occupations by Sex
Within the Management, Business, Science and Arts occupations in Pajaro, the most male-oriented occupations are Arts, Media & Entertainment (100.0%), Health Diagnosing & Treating (100.0%), and Management (64.5%), while the most female-oriented occupations are Business & Financial (100.0%), Education Instruction & Library (100.0%), and Community & Social Service (60.6%).
| Occupation | Male | Female |
| Management | 49 (64.5%) | 27 (35.5%) |
| Business & Financial | 0 (0.0%) | 12 (100.0%) |
| Computers, Engineering & Science | 0 (0.0%) | 0 (0.0%) |
| Computers & Mathematics | 0 (0.0%) | 0 (0.0%) |
| Architecture & Engineering | 0 (0.0%) | 0 (0.0%) |
| Life, Physical & Social Science | 0 (0.0%) | 0 (0.0%) |
| Community & Social Service | 28 (39.4%) | 43 (60.6%) |
| Education, Arts & Media | 0 (0.0%) | 0 (0.0%) |
| Legal Services & Support | 0 (0.0%) | 0 (0.0%) |
| Education Instruction & Library | 0 (0.0%) | 43 (100.0%) |
| Arts, Media & Entertainment | 28 (100.0%) | 0 (0.0%) |
| Health Diagnosing & Treating | 16 (100.0%) | 0 (0.0%) |
| Health Technologists | 0 (0.0%) | 0 (0.0%) |
| Total (Category) | 93 (53.1%) | 82 (46.9%) |
| Total (Overall) | 560 (61.8%) | 346 (38.2%) |
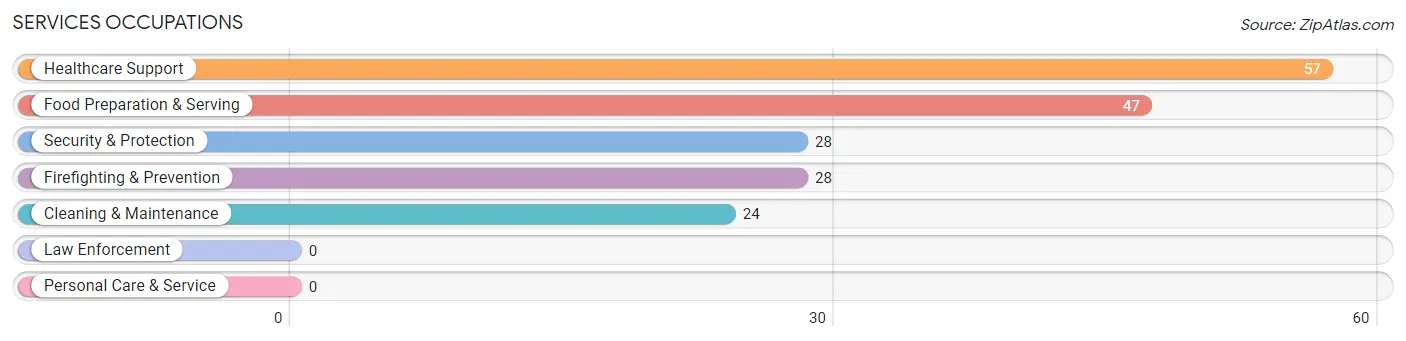
Services Occupations
The most common Services occupations in Pajaro are Healthcare Support (57 | 6.3%), Food Preparation & Serving (47 | 5.2%), Security & Protection (28 | 3.1%), Firefighting & Prevention (28 | 3.1%), and Cleaning & Maintenance (24 | 2.6%).
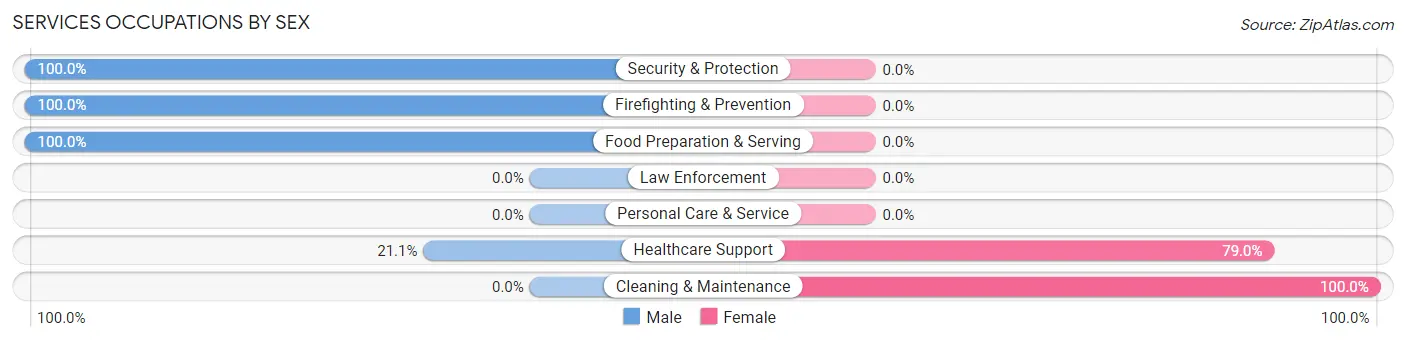
Services Occupations by Sex
Within the Services occupations in Pajaro, the most male-oriented occupations are Security & Protection (100.0%), Firefighting & Prevention (100.0%), and Food Preparation & Serving (100.0%), while the most female-oriented occupations are Cleaning & Maintenance (100.0%), and Healthcare Support (78.9%).
| Occupation | Male | Female |
| Healthcare Support | 12 (21.0%) | 45 (78.9%) |
| Security & Protection | 28 (100.0%) | 0 (0.0%) |
| Firefighting & Prevention | 28 (100.0%) | 0 (0.0%) |
| Law Enforcement | 0 (0.0%) | 0 (0.0%) |
| Food Preparation & Serving | 47 (100.0%) | 0 (0.0%) |
| Cleaning & Maintenance | 0 (0.0%) | 24 (100.0%) |
| Personal Care & Service | 0 (0.0%) | 0 (0.0%) |
| Total (Category) | 87 (55.8%) | 69 (44.2%) |
| Total (Overall) | 560 (61.8%) | 346 (38.2%) |
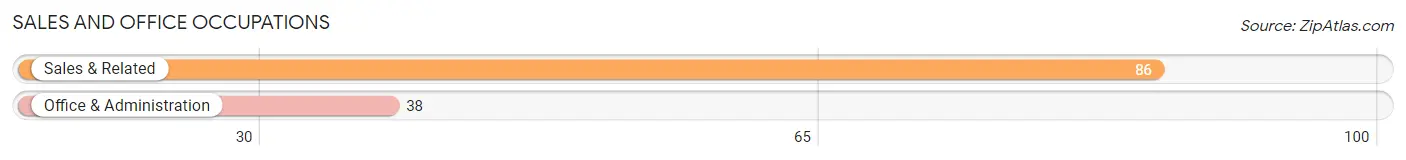
Sales and Office Occupations
The most common Sales and Office occupations in Pajaro are Sales & Related (86 | 9.5%), and Office & Administration (38 | 4.2%).
Sales and Office Occupations by Sex
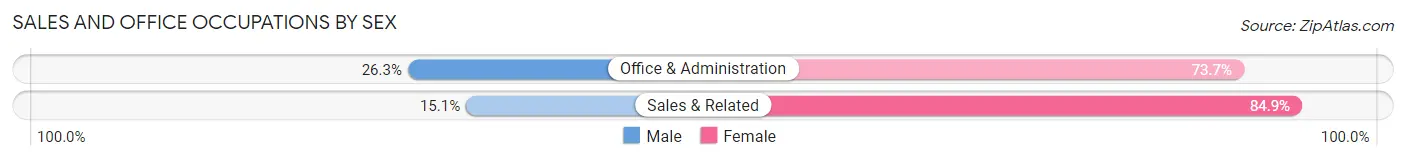
| Occupation | Male | Female |
| Sales & Related | 13 (15.1%) | 73 (84.9%) |
| Office & Administration | 10 (26.3%) | 28 (73.7%) |
| Total (Category) | 23 (18.5%) | 101 (81.5%) |
| Total (Overall) | 560 (61.8%) | 346 (38.2%) |
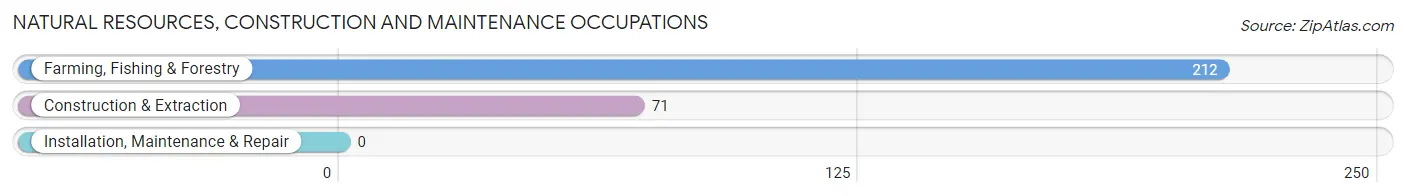
Natural Resources, Construction and Maintenance Occupations
The most common Natural Resources, Construction and Maintenance occupations in Pajaro are Farming, Fishing & Forestry (212 | 23.4%), and Construction & Extraction (71 | 7.8%).
Natural Resources, Construction and Maintenance Occupations by Sex
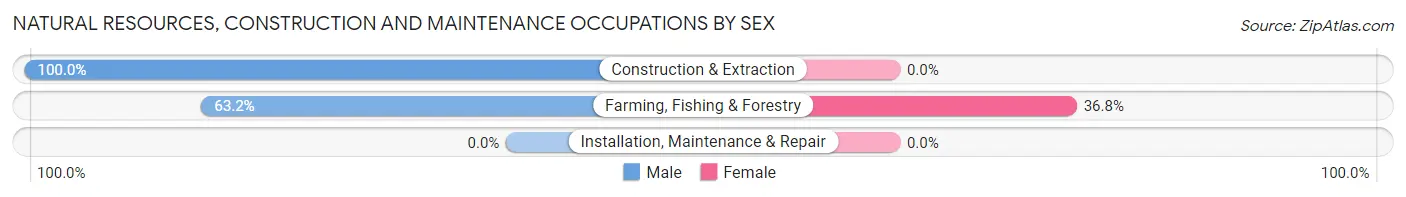
| Occupation | Male | Female |
| Farming, Fishing & Forestry | 134 (63.2%) | 78 (36.8%) |
| Construction & Extraction | 71 (100.0%) | 0 (0.0%) |
| Installation, Maintenance & Repair | 0 (0.0%) | 0 (0.0%) |
| Total (Category) | 205 (72.4%) | 78 (27.6%) |
| Total (Overall) | 560 (61.8%) | 346 (38.2%) |
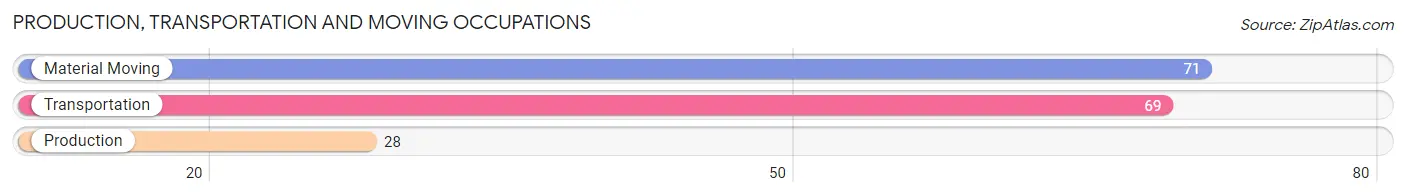
Production, Transportation and Moving Occupations
The most common Production, Transportation and Moving occupations in Pajaro are Material Moving (71 | 7.8%), Transportation (69 | 7.6%), and Production (28 | 3.1%).
Production, Transportation and Moving Occupations by Sex
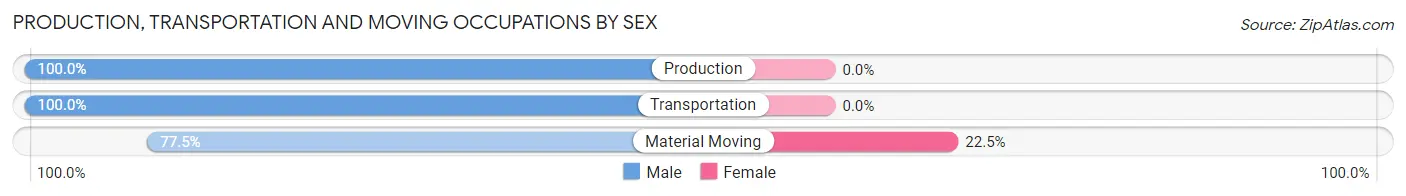
| Occupation | Male | Female |
| Production | 28 (100.0%) | 0 (0.0%) |
| Transportation | 69 (100.0%) | 0 (0.0%) |
| Material Moving | 55 (77.5%) | 16 (22.5%) |
| Total (Category) | 152 (90.5%) | 16 (9.5%) |
| Total (Overall) | 560 (61.8%) | 346 (38.2%) |
Employment Industries by Sex in Pajaro
Employment Industries in Pajaro
The major employment industries in Pajaro include Agriculture, Fishing & Hunting (277 | 30.6%), Accommodation & Food Services (124 | 13.7%), Manufacturing (100 | 11.0%), Health Care & Social Assistance (66 | 7.3%), and Construction (55 | 6.1%).
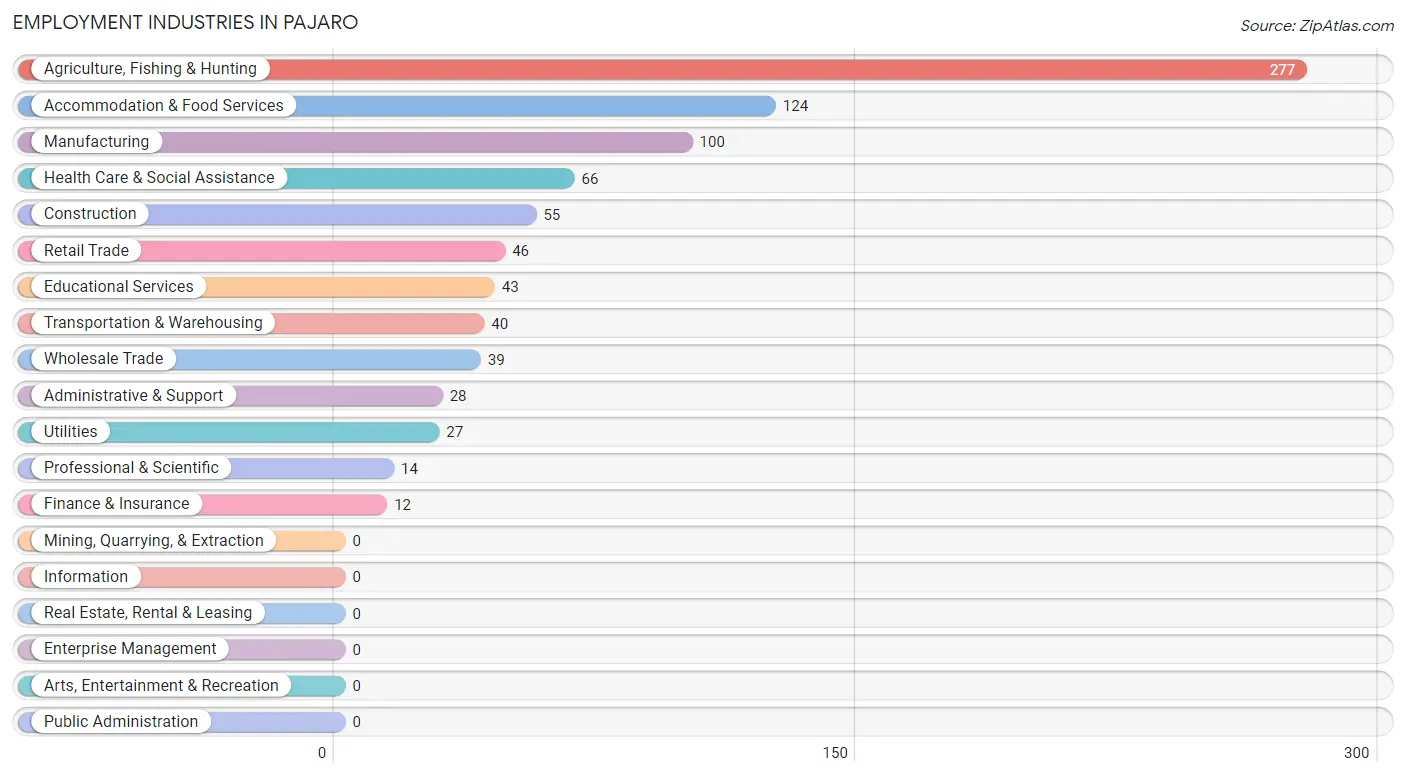
Employment Industries by Sex in Pajaro
The Pajaro industries that see more men than women are Construction (100.0%), Wholesale Trade (100.0%), and Transportation & Warehousing (100.0%), whereas the industries that tend to have a higher number of women are Finance & Insurance (100.0%), Educational Services (100.0%), and Health Care & Social Assistance (57.6%).
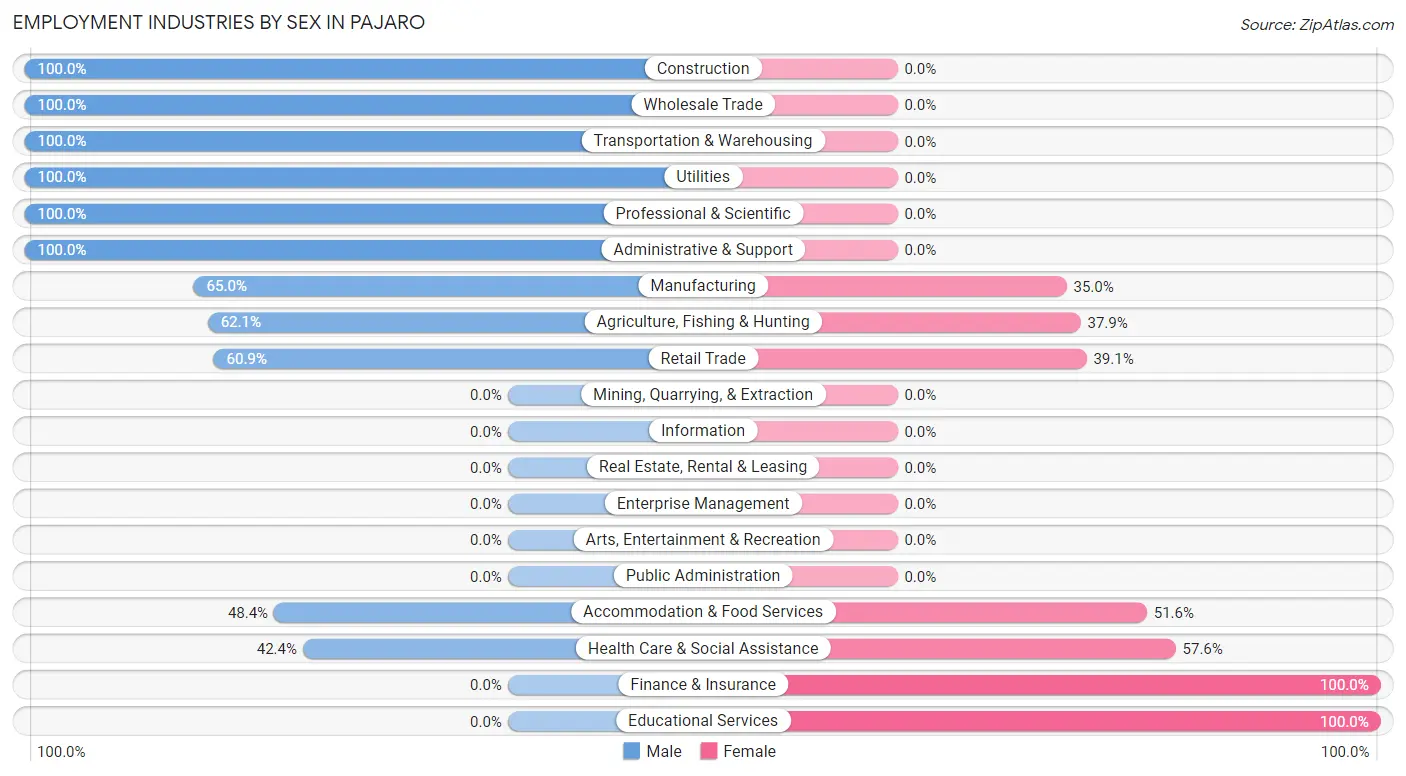
| Industry | Male | Female |
| Agriculture, Fishing & Hunting | 172 (62.1%) | 105 (37.9%) |
| Mining, Quarrying, & Extraction | 0 (0.0%) | 0 (0.0%) |
| Construction | 55 (100.0%) | 0 (0.0%) |
| Manufacturing | 65 (65.0%) | 35 (35.0%) |
| Wholesale Trade | 39 (100.0%) | 0 (0.0%) |
| Retail Trade | 28 (60.9%) | 18 (39.1%) |
| Transportation & Warehousing | 40 (100.0%) | 0 (0.0%) |
| Utilities | 27 (100.0%) | 0 (0.0%) |
| Information | 0 (0.0%) | 0 (0.0%) |
| Finance & Insurance | 0 (0.0%) | 12 (100.0%) |
| Real Estate, Rental & Leasing | 0 (0.0%) | 0 (0.0%) |
| Professional & Scientific | 14 (100.0%) | 0 (0.0%) |
| Enterprise Management | 0 (0.0%) | 0 (0.0%) |
| Administrative & Support | 28 (100.0%) | 0 (0.0%) |
| Educational Services | 0 (0.0%) | 43 (100.0%) |
| Health Care & Social Assistance | 28 (42.4%) | 38 (57.6%) |
| Arts, Entertainment & Recreation | 0 (0.0%) | 0 (0.0%) |
| Accommodation & Food Services | 60 (48.4%) | 64 (51.6%) |
| Public Administration | 0 (0.0%) | 0 (0.0%) |
| Total | 560 (61.8%) | 346 (38.2%) |
Education in Pajaro
School Enrollment in Pajaro
The most common levels of schooling among the 607 students in Pajaro are college / undergraduate (133 | 21.9%), middle school (129 | 21.2%), and high school (119 | 19.6%).
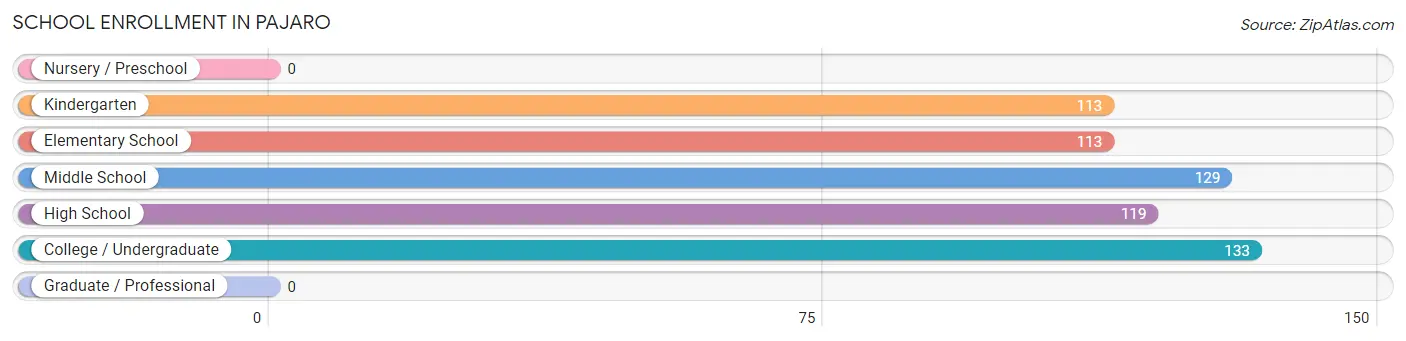
| School Level | # Students | % Students |
| Nursery / Preschool | 0 | 0.0% |
| Kindergarten | 113 | 18.6% |
| Elementary School | 113 | 18.6% |
| Middle School | 129 | 21.2% |
| High School | 119 | 19.6% |
| College / Undergraduate | 133 | 21.9% |
| Graduate / Professional | 0 | 0.0% |
| Total | 607 | 100.0% |
School Enrollment by Age by Funding Source in Pajaro
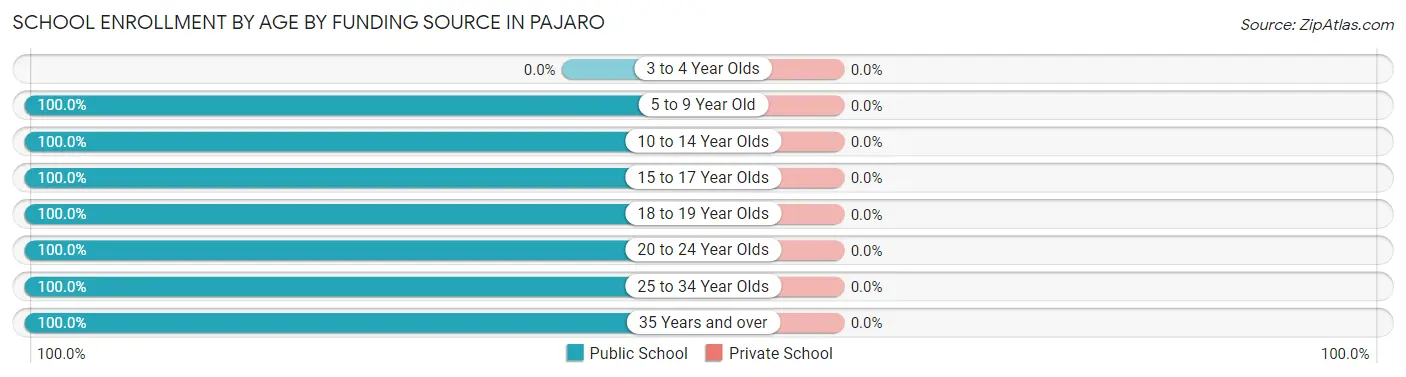
| Age Bracket | Public School | Private School |
| 3 to 4 Year Olds | 0 (0.0%) | 0 (0.0%) |
| 5 to 9 Year Old | 223 (100.0%) | 0 (0.0%) |
| 10 to 14 Year Olds | 132 (100.0%) | 0 (0.0%) |
| 15 to 17 Year Olds | 74 (100.0%) | 0 (0.0%) |
| 18 to 19 Year Olds | 95 (100.0%) | 0 (0.0%) |
| 20 to 24 Year Olds | 52 (100.0%) | 0 (0.0%) |
| 25 to 34 Year Olds | 12 (100.0%) | 0 (0.0%) |
| 35 Years and over | 19 (100.0%) | 0 (0.0%) |
| Total | 607 (100.0%) | 0 (0.0%) |
Educational Attainment by Field of Study in Pajaro
Arts & humanities (61 | 61.6%), visual & performing arts (15 | 15.1%), social sciences (12 | 12.1%), and business (11 | 11.1%) are the most common fields of study among 99 individuals in Pajaro who have obtained a bachelor's degree or higher.
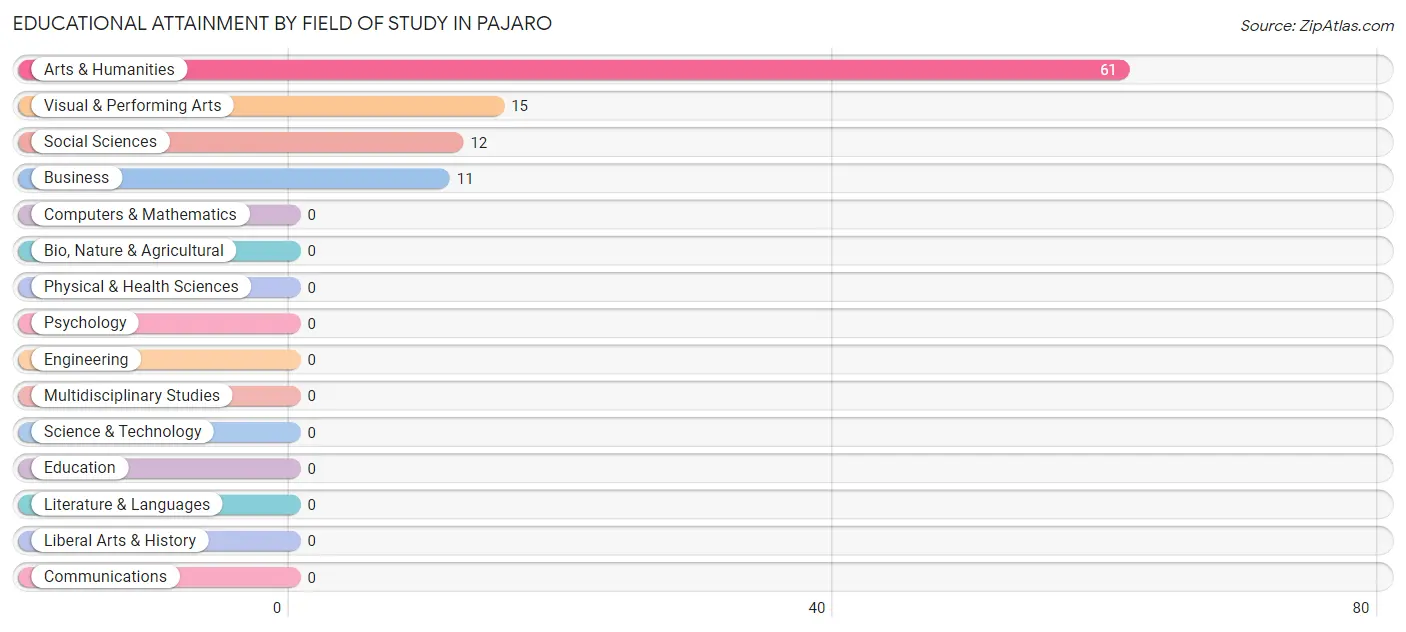
| Field of Study | # Graduates | % Graduates |
| Computers & Mathematics | 0 | 0.0% |
| Bio, Nature & Agricultural | 0 | 0.0% |
| Physical & Health Sciences | 0 | 0.0% |
| Psychology | 0 | 0.0% |
| Social Sciences | 12 | 12.1% |
| Engineering | 0 | 0.0% |
| Multidisciplinary Studies | 0 | 0.0% |
| Science & Technology | 0 | 0.0% |
| Business | 11 | 11.1% |
| Education | 0 | 0.0% |
| Literature & Languages | 0 | 0.0% |
| Liberal Arts & History | 0 | 0.0% |
| Visual & Performing Arts | 15 | 15.1% |
| Communications | 0 | 0.0% |
| Arts & Humanities | 61 | 61.6% |
| Total | 99 | 100.0% |
Transportation & Commute in Pajaro
Vehicle Availability by Sex in Pajaro
The most prevalent vehicle ownership categories in Pajaro are males with 3 vehicles (266, accounting for 50.8%) and females with 3 vehicles (146, making up 91.7%).
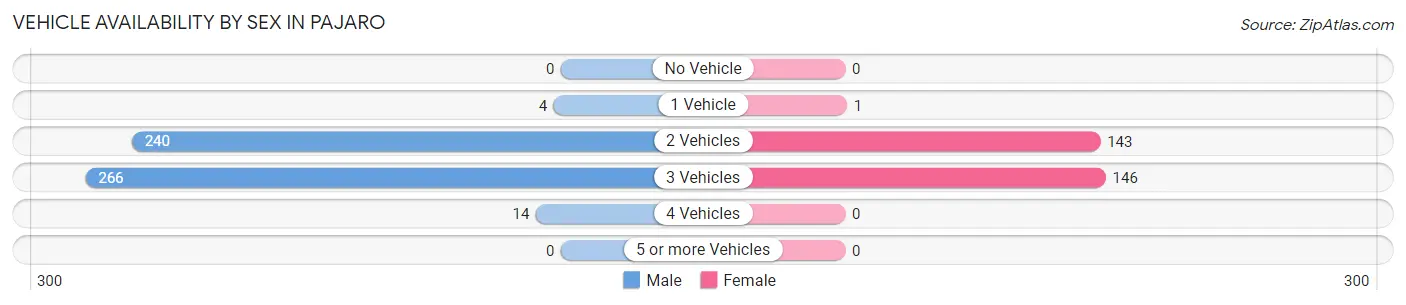
| Vehicles Available | Male | Female |
| No Vehicle | 0 (0.0%) | 0 (0.0%) |
| 1 Vehicle | 4 (0.8%) | 1 (0.3%) |
| 2 Vehicles | 240 (45.8%) | 143 (49.3%) |
| 3 Vehicles | 266 (50.8%) | 146 (50.3%) |
| 4 Vehicles | 14 (2.7%) | 0 (0.0%) |
| 5 or more Vehicles | 0 (0.0%) | 0 (0.0%) |
| Total | 524 (100.0%) | 290 (100.0%) |
Commute Time in Pajaro
The most frequently occuring commute durations in Pajaro are 15 to 19 minutes (226 commuters, 31.3%), 20 to 24 minutes (122 commuters, 16.9%), and 30 to 34 minutes (93 commuters, 12.9%).
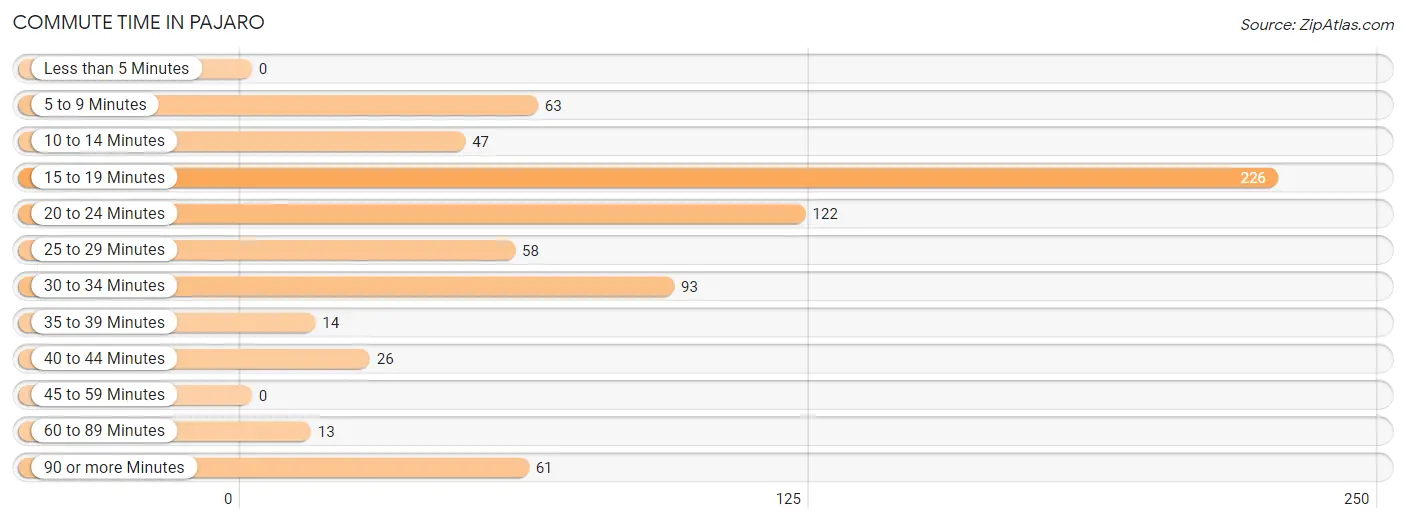
| Commute Time | # Commuters | % Commuters |
| Less than 5 Minutes | 0 | 0.0% |
| 5 to 9 Minutes | 63 | 8.7% |
| 10 to 14 Minutes | 47 | 6.5% |
| 15 to 19 Minutes | 226 | 31.3% |
| 20 to 24 Minutes | 122 | 16.9% |
| 25 to 29 Minutes | 58 | 8.0% |
| 30 to 34 Minutes | 93 | 12.9% |
| 35 to 39 Minutes | 14 | 1.9% |
| 40 to 44 Minutes | 26 | 3.6% |
| 45 to 59 Minutes | 0 | 0.0% |
| 60 to 89 Minutes | 13 | 1.8% |
| 90 or more Minutes | 61 | 8.4% |
Commute Time by Sex in Pajaro
The most common commute times in Pajaro are 15 to 19 minutes (98 commuters, 19.4%) for males and 15 to 19 minutes (128 commuters, 59.0%) for females.
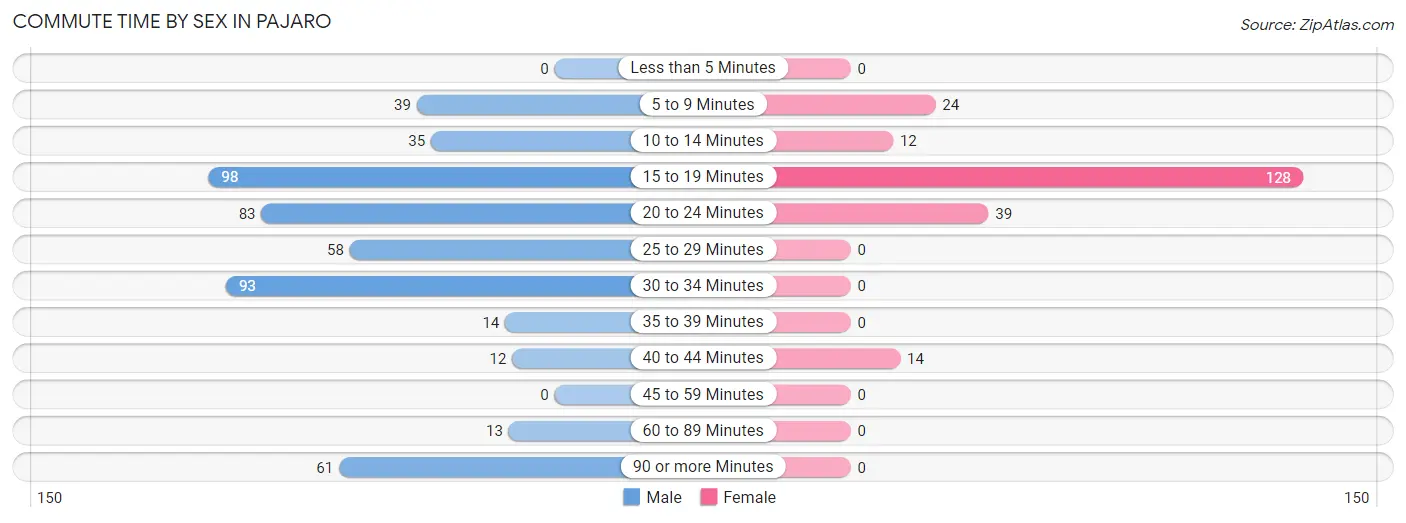
| Commute Time | Male | Female |
| Less than 5 Minutes | 0 (0.0%) | 0 (0.0%) |
| 5 to 9 Minutes | 39 (7.7%) | 24 (11.1%) |
| 10 to 14 Minutes | 35 (6.9%) | 12 (5.5%) |
| 15 to 19 Minutes | 98 (19.4%) | 128 (59.0%) |
| 20 to 24 Minutes | 83 (16.4%) | 39 (18.0%) |
| 25 to 29 Minutes | 58 (11.5%) | 0 (0.0%) |
| 30 to 34 Minutes | 93 (18.4%) | 0 (0.0%) |
| 35 to 39 Minutes | 14 (2.8%) | 0 (0.0%) |
| 40 to 44 Minutes | 12 (2.4%) | 14 (6.5%) |
| 45 to 59 Minutes | 0 (0.0%) | 0 (0.0%) |
| 60 to 89 Minutes | 13 (2.6%) | 0 (0.0%) |
| 90 or more Minutes | 61 (12.1%) | 0 (0.0%) |
Time of Departure to Work by Sex in Pajaro
The most frequent times of departure to work in Pajaro are 7:00 AM to 7:29 AM (113, 22.3%) for males and 7:00 AM to 7:29 AM (68, 31.3%) for females.
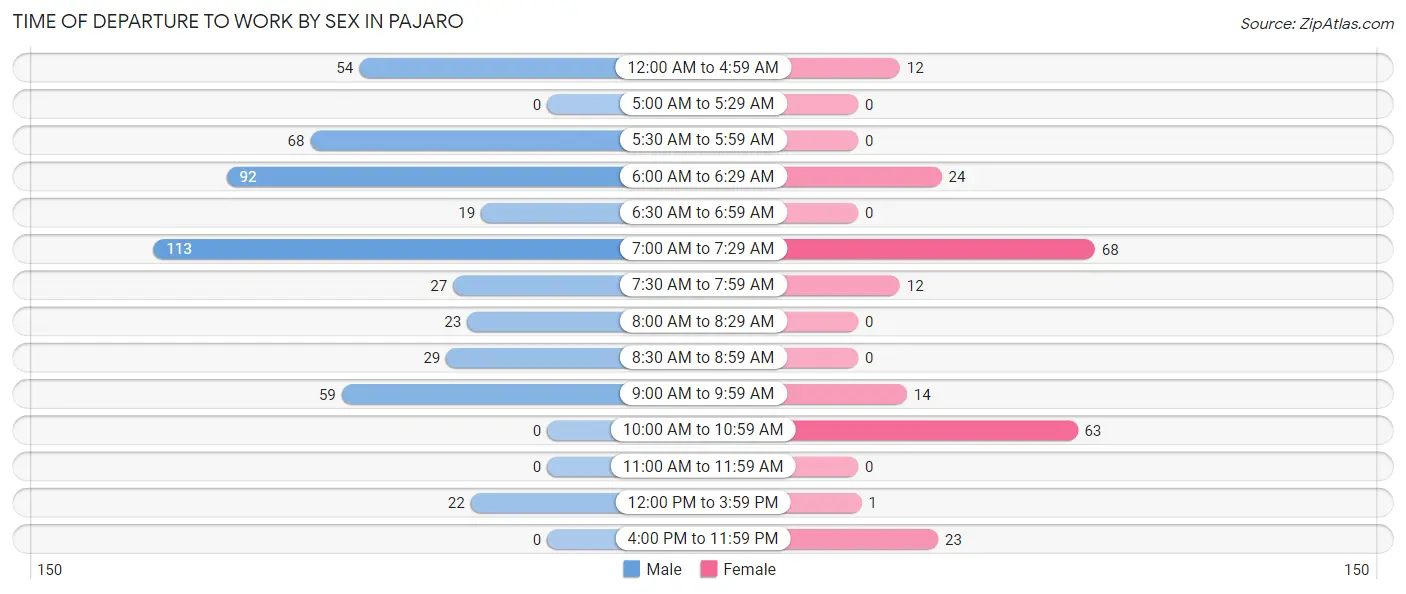
| Time of Departure | Male | Female |
| 12:00 AM to 4:59 AM | 54 (10.7%) | 12 (5.5%) |
| 5:00 AM to 5:29 AM | 0 (0.0%) | 0 (0.0%) |
| 5:30 AM to 5:59 AM | 68 (13.4%) | 0 (0.0%) |
| 6:00 AM to 6:29 AM | 92 (18.2%) | 24 (11.1%) |
| 6:30 AM to 6:59 AM | 19 (3.7%) | 0 (0.0%) |
| 7:00 AM to 7:29 AM | 113 (22.3%) | 68 (31.3%) |
| 7:30 AM to 7:59 AM | 27 (5.3%) | 12 (5.5%) |
| 8:00 AM to 8:29 AM | 23 (4.5%) | 0 (0.0%) |
| 8:30 AM to 8:59 AM | 29 (5.7%) | 0 (0.0%) |
| 9:00 AM to 9:59 AM | 59 (11.7%) | 14 (6.5%) |
| 10:00 AM to 10:59 AM | 0 (0.0%) | 63 (29.0%) |
| 11:00 AM to 11:59 AM | 0 (0.0%) | 0 (0.0%) |
| 12:00 PM to 3:59 PM | 22 (4.3%) | 1 (0.5%) |
| 4:00 PM to 11:59 PM | 0 (0.0%) | 23 (10.6%) |
| Total | 506 (100.0%) | 217 (100.0%) |
Housing Occupancy in Pajaro
Occupancy by Ownership in Pajaro
Of the total 522 dwellings in Pajaro, owner-occupied units account for 192 (36.8%), while renter-occupied units make up 330 (63.2%).
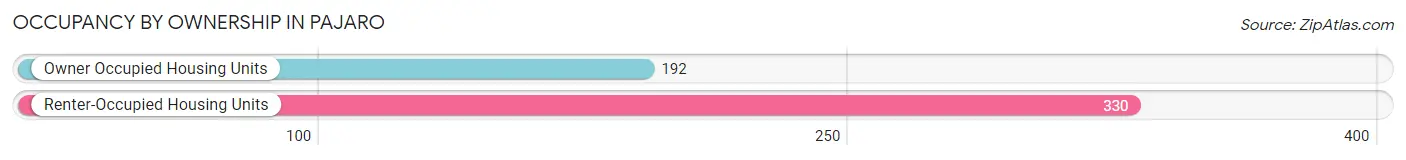
| Occupancy | # Housing Units | % Housing Units |
| Owner Occupied Housing Units | 192 | 36.8% |
| Renter-Occupied Housing Units | 330 | 63.2% |
| Total Occupied Housing Units | 522 | 100.0% |
Occupancy by Household Size in Pajaro
| Household Size | # Housing Units | % Housing Units |
| 1-Person Household | 40 | 7.7% |
| 2-Person Household | 86 | 16.5% |
| 3-Person Household | 93 | 17.8% |
| 4+ Person Household | 303 | 58.1% |
| Total Housing Units | 522 | 100.0% |
Occupancy by Ownership by Household Size in Pajaro
| Household Size | Owner-occupied | Renter-occupied |
| 1-Person Household | 21 (52.5%) | 19 (47.5%) |
| 2-Person Household | 49 (57.0%) | 37 (43.0%) |
| 3-Person Household | 53 (57.0%) | 40 (43.0%) |
| 4+ Person Household | 69 (22.8%) | 234 (77.2%) |
| Total Housing Units | 192 (36.8%) | 330 (63.2%) |
Occupancy by Educational Attainment in Pajaro
| Household Size | Owner-occupied | Renter-occupied |
| Less than High School | 62 (24.4%) | 192 (75.6%) |
| High School Diploma | 66 (49.2%) | 68 (50.7%) |
| College/Associate Degree | 52 (42.6%) | 70 (57.4%) |
| Bachelor's Degree or higher | 12 (100.0%) | 0 (0.0%) |
Occupancy by Age of Householder in Pajaro
| Age Bracket | # Households | % Households |
| Under 35 Years | 106 | 20.3% |
| 35 to 44 Years | 195 | 37.4% |
| 45 to 54 Years | 34 | 6.5% |
| 55 to 64 Years | 76 | 14.6% |
| 65 to 74 Years | 84 | 16.1% |
| 75 to 84 Years | 27 | 5.2% |
| 85 Years and Over | 0 | 0.0% |
| Total | 522 | 100.0% |
Housing Finances in Pajaro
Median Income by Occupancy in Pajaro
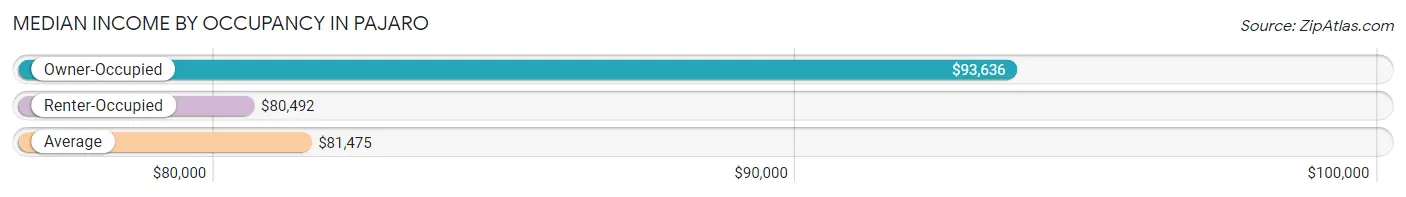
| Occupancy Type | # Households | Median Income |
| Owner-Occupied | 192 (36.8%) | $93,636 |
| Renter-Occupied | 330 (63.2%) | $80,492 |
| Average | 522 (100.0%) | $81,475 |
Occupancy by Householder Income Bracket in Pajaro
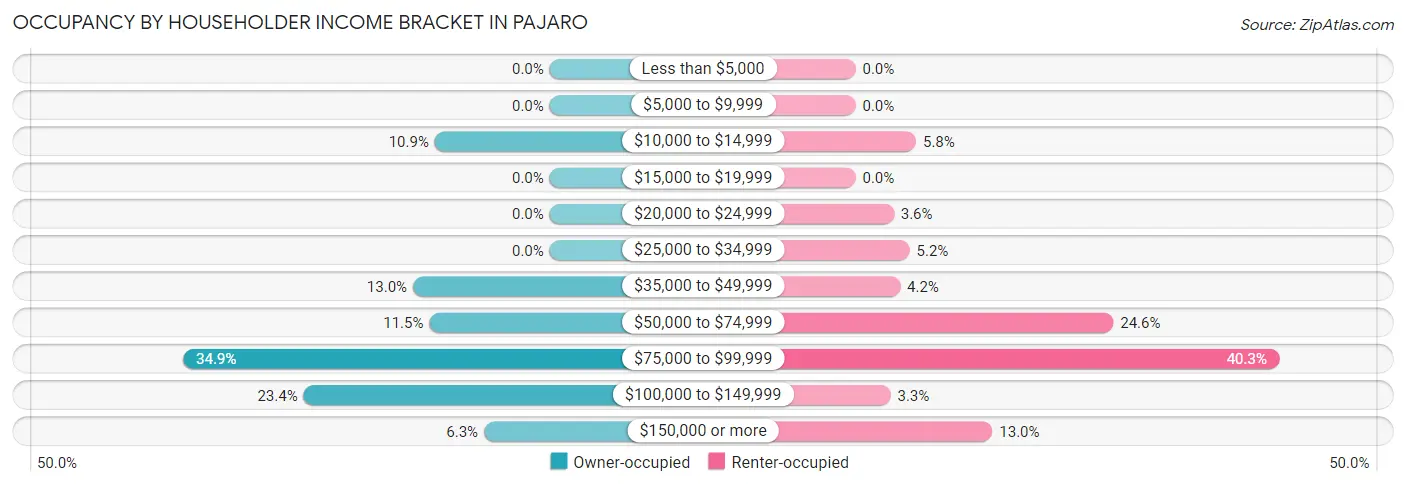
| Income Bracket | Owner-occupied | Renter-occupied |
| Less than $5,000 | 0 (0.0%) | 0 (0.0%) |
| $5,000 to $9,999 | 0 (0.0%) | 0 (0.0%) |
| $10,000 to $14,999 | 21 (10.9%) | 19 (5.8%) |
| $15,000 to $19,999 | 0 (0.0%) | 0 (0.0%) |
| $20,000 to $24,999 | 0 (0.0%) | 12 (3.6%) |
| $25,000 to $34,999 | 0 (0.0%) | 17 (5.1%) |
| $35,000 to $49,999 | 25 (13.0%) | 14 (4.2%) |
| $50,000 to $74,999 | 22 (11.5%) | 81 (24.5%) |
| $75,000 to $99,999 | 67 (34.9%) | 133 (40.3%) |
| $100,000 to $149,999 | 45 (23.4%) | 11 (3.3%) |
| $150,000 or more | 12 (6.2%) | 43 (13.0%) |
| Total | 192 (100.0%) | 330 (100.0%) |
Monthly Housing Cost Tiers in Pajaro
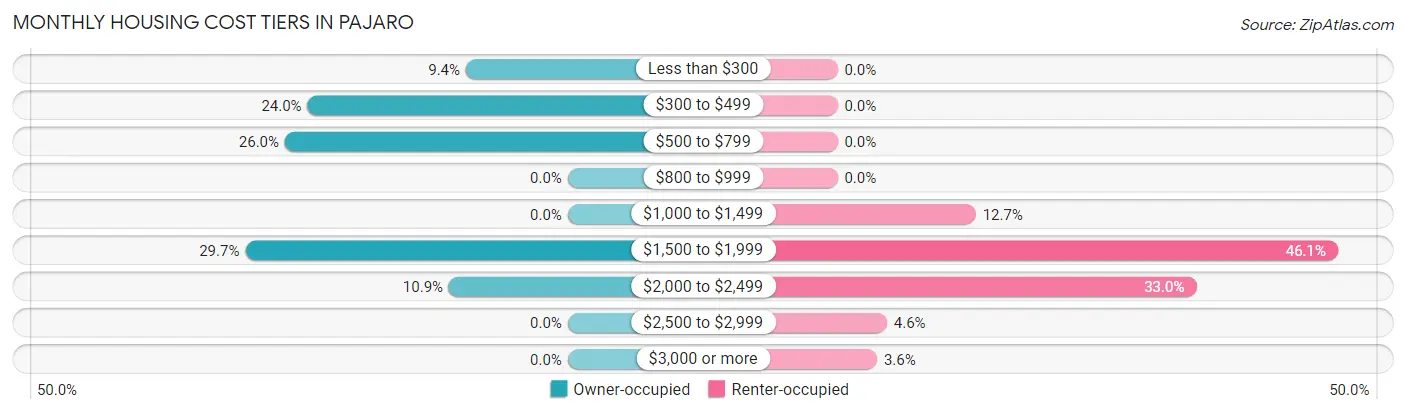
| Monthly Cost | Owner-occupied | Renter-occupied |
| Less than $300 | 18 (9.4%) | 0 (0.0%) |
| $300 to $499 | 46 (24.0%) | 0 (0.0%) |
| $500 to $799 | 50 (26.0%) | 0 (0.0%) |
| $800 to $999 | 0 (0.0%) | 0 (0.0%) |
| $1,000 to $1,499 | 0 (0.0%) | 42 (12.7%) |
| $1,500 to $1,999 | 57 (29.7%) | 152 (46.1%) |
| $2,000 to $2,499 | 21 (10.9%) | 109 (33.0%) |
| $2,500 to $2,999 | 0 (0.0%) | 15 (4.5%) |
| $3,000 or more | 0 (0.0%) | 12 (3.6%) |
| Total | 192 (100.0%) | 330 (100.0%) |
Physical Housing Characteristics in Pajaro
Housing Structures in Pajaro
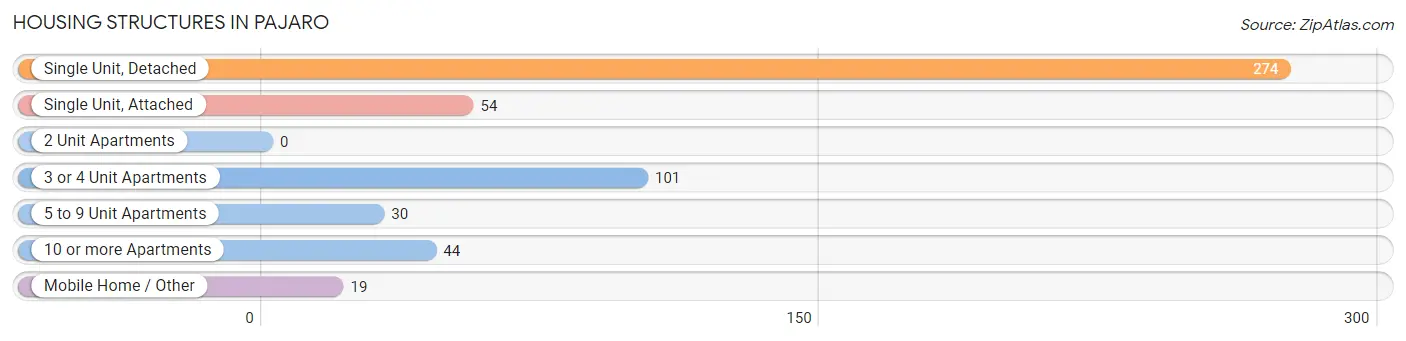
| Structure Type | # Housing Units | % Housing Units |
| Single Unit, Detached | 274 | 52.5% |
| Single Unit, Attached | 54 | 10.3% |
| 2 Unit Apartments | 0 | 0.0% |
| 3 or 4 Unit Apartments | 101 | 19.4% |
| 5 to 9 Unit Apartments | 30 | 5.8% |
| 10 or more Apartments | 44 | 8.4% |
| Mobile Home / Other | 19 | 3.6% |
| Total | 522 | 100.0% |
Housing Structures by Occupancy in Pajaro
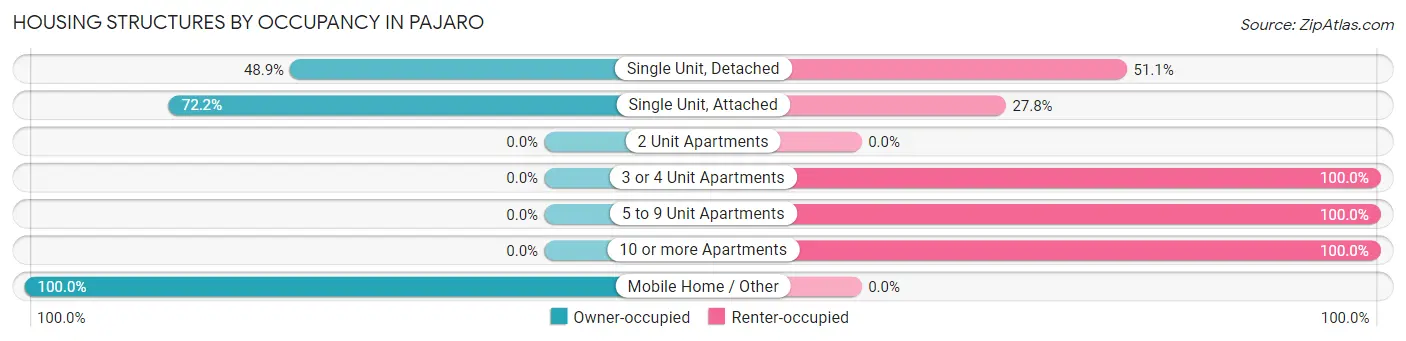
| Structure Type | Owner-occupied | Renter-occupied |
| Single Unit, Detached | 134 (48.9%) | 140 (51.1%) |
| Single Unit, Attached | 39 (72.2%) | 15 (27.8%) |
| 2 Unit Apartments | 0 (0.0%) | 0 (0.0%) |
| 3 or 4 Unit Apartments | 0 (0.0%) | 101 (100.0%) |
| 5 to 9 Unit Apartments | 0 (0.0%) | 30 (100.0%) |
| 10 or more Apartments | 0 (0.0%) | 44 (100.0%) |
| Mobile Home / Other | 19 (100.0%) | 0 (0.0%) |
| Total | 192 (36.8%) | 330 (63.2%) |
Housing Structures by Number of Rooms in Pajaro
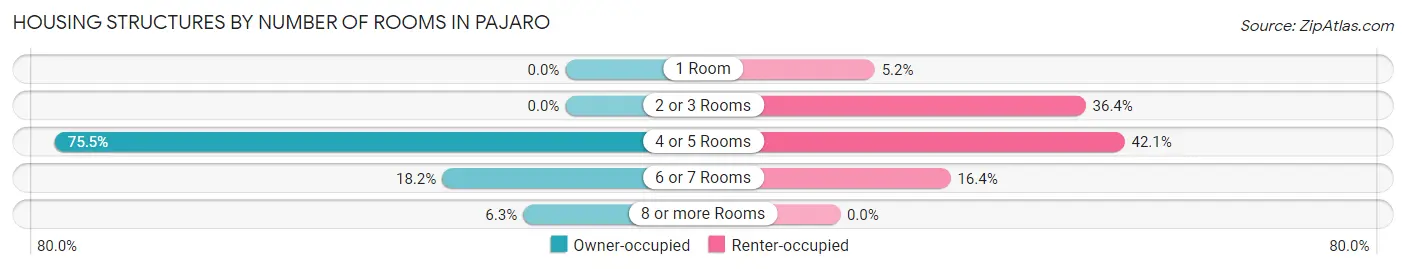
| Number of Rooms | Owner-occupied | Renter-occupied |
| 1 Room | 0 (0.0%) | 17 (5.1%) |
| 2 or 3 Rooms | 0 (0.0%) | 120 (36.4%) |
| 4 or 5 Rooms | 145 (75.5%) | 139 (42.1%) |
| 6 or 7 Rooms | 35 (18.2%) | 54 (16.4%) |
| 8 or more Rooms | 12 (6.2%) | 0 (0.0%) |
| Total | 192 (100.0%) | 330 (100.0%) |
Housing Structure by Heating Type in Pajaro
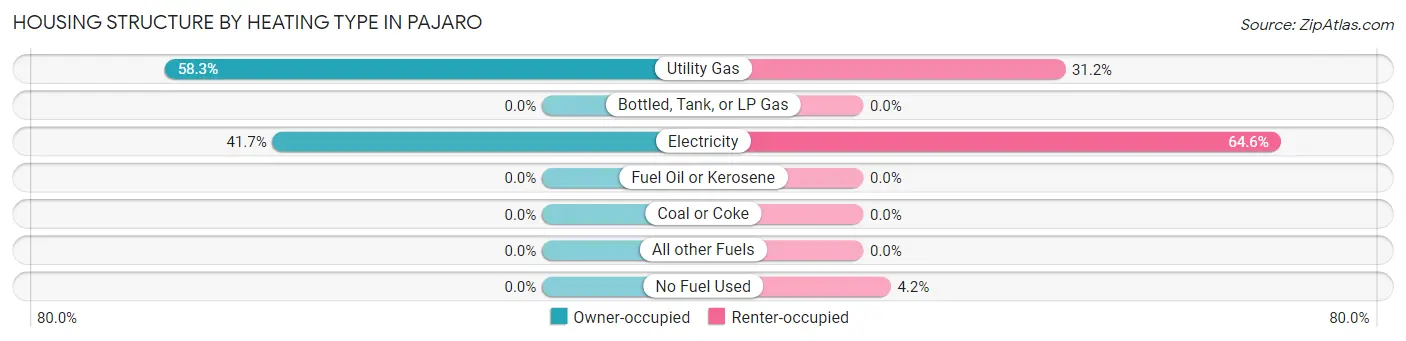
| Heating Type | Owner-occupied | Renter-occupied |
| Utility Gas | 112 (58.3%) | 103 (31.2%) |
| Bottled, Tank, or LP Gas | 0 (0.0%) | 0 (0.0%) |
| Electricity | 80 (41.7%) | 213 (64.5%) |
| Fuel Oil or Kerosene | 0 (0.0%) | 0 (0.0%) |
| Coal or Coke | 0 (0.0%) | 0 (0.0%) |
| All other Fuels | 0 (0.0%) | 0 (0.0%) |
| No Fuel Used | 0 (0.0%) | 14 (4.2%) |
| Total | 192 (100.0%) | 330 (100.0%) |
Household Vehicle Usage in Pajaro
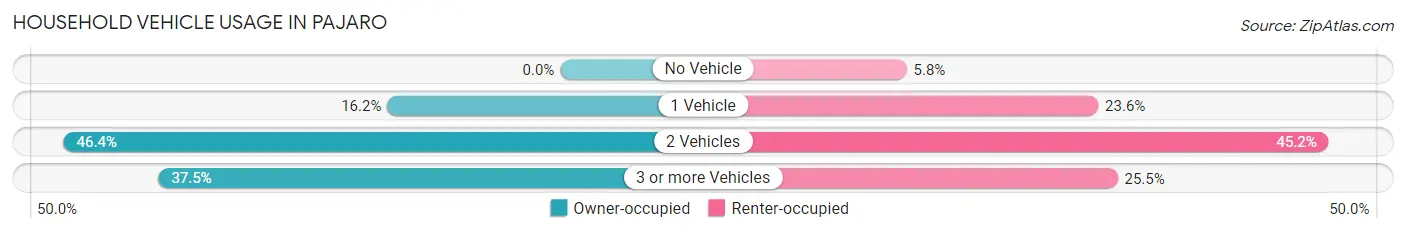
| Vehicles per Household | Owner-occupied | Renter-occupied |
| No Vehicle | 0 (0.0%) | 19 (5.8%) |
| 1 Vehicle | 31 (16.2%) | 78 (23.6%) |
| 2 Vehicles | 89 (46.4%) | 149 (45.2%) |
| 3 or more Vehicles | 72 (37.5%) | 84 (25.5%) |
| Total | 192 (100.0%) | 330 (100.0%) |
Real Estate & Mortgages in Pajaro
Real Estate and Mortgage Overview in Pajaro
| Characteristic | Without Mortgage | With Mortgage |
| Housing Units | 114 | 78 |
| Median Property Value | $527,300 | $545,500 |
| Median Household Income | $98,750 | $0 |
| Monthly Housing Costs | $400 | $0 |
| Real Estate Taxes | - | - |
Property Value by Mortgage Status in Pajaro
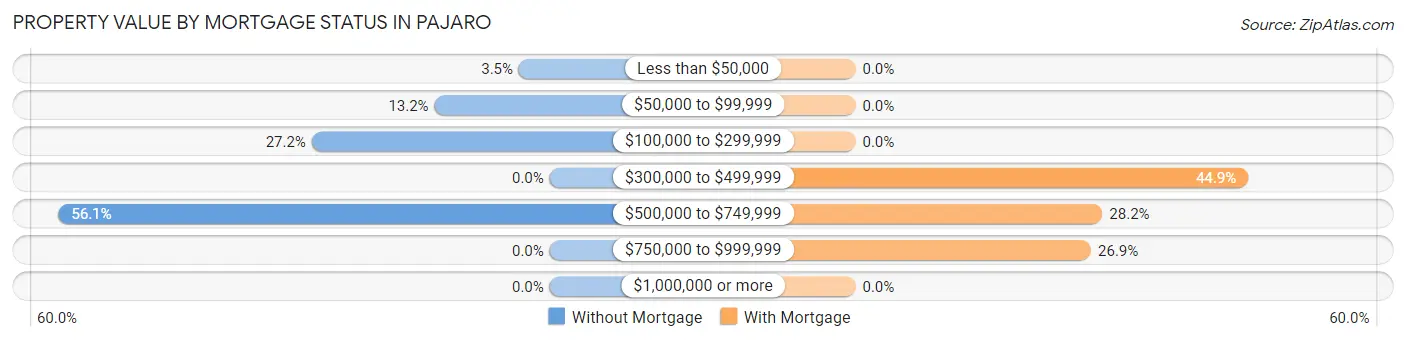
| Property Value | Without Mortgage | With Mortgage |
| Less than $50,000 | 4 (3.5%) | 0 (0.0%) |
| $50,000 to $99,999 | 15 (13.2%) | 0 (0.0%) |
| $100,000 to $299,999 | 31 (27.2%) | 0 (0.0%) |
| $300,000 to $499,999 | 0 (0.0%) | 35 (44.9%) |
| $500,000 to $749,999 | 64 (56.1%) | 22 (28.2%) |
| $750,000 to $999,999 | 0 (0.0%) | 21 (26.9%) |
| $1,000,000 or more | 0 (0.0%) | 0 (0.0%) |
| Total | 114 (100.0%) | 78 (100.0%) |
Household Income by Mortgage Status in Pajaro
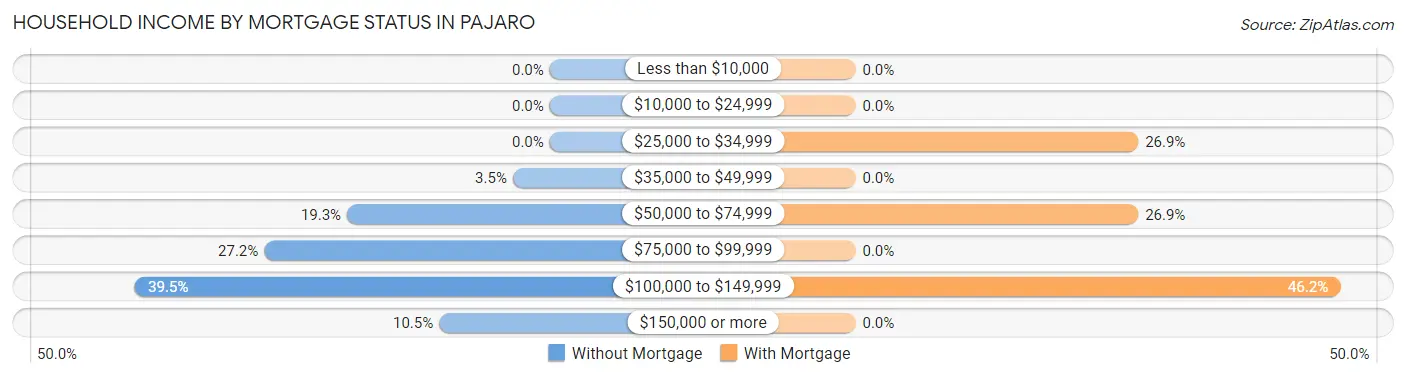
| Household Income | Without Mortgage | With Mortgage |
| Less than $10,000 | 0 (0.0%) | 0 (0.0%) |
| $10,000 to $24,999 | 0 (0.0%) | 0 (0.0%) |
| $25,000 to $34,999 | 0 (0.0%) | 21 (26.9%) |
| $35,000 to $49,999 | 4 (3.5%) | 0 (0.0%) |
| $50,000 to $74,999 | 22 (19.3%) | 21 (26.9%) |
| $75,000 to $99,999 | 31 (27.2%) | 0 (0.0%) |
| $100,000 to $149,999 | 45 (39.5%) | 36 (46.2%) |
| $150,000 or more | 12 (10.5%) | 0 (0.0%) |
| Total | 114 (100.0%) | 78 (100.0%) |
Property Value to Household Income Ratio in Pajaro
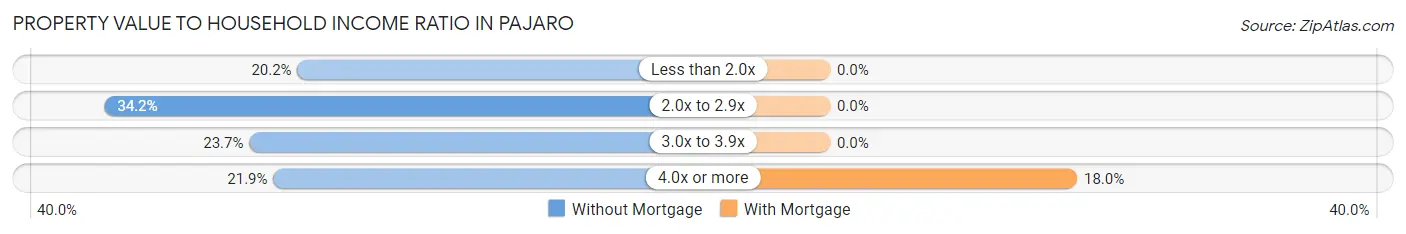
| Value-to-Income Ratio | Without Mortgage | With Mortgage |
| Less than 2.0x | 23 (20.2%) | 0 (0.0%) |
| 2.0x to 2.9x | 39 (34.2%) | 0 (0.0%) |
| 3.0x to 3.9x | 27 (23.7%) | 0 (0.0%) |
| 4.0x or more | 25 (21.9%) | 14 (17.9%) |
| Total | 114 (100.0%) | 78 (100.0%) |
Real Estate Taxes by Mortgage Status in Pajaro
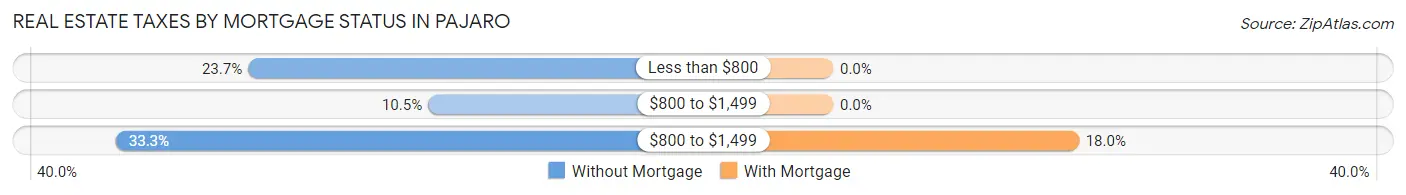
| Property Taxes | Without Mortgage | With Mortgage |
| Less than $800 | 27 (23.7%) | 0 (0.0%) |
| $800 to $1,499 | 12 (10.5%) | 0 (0.0%) |
| $800 to $1,499 | 38 (33.3%) | 14 (17.9%) |
| Total | 114 (100.0%) | 78 (100.0%) |
Health & Disability in Pajaro
Health Insurance Coverage by Age in Pajaro
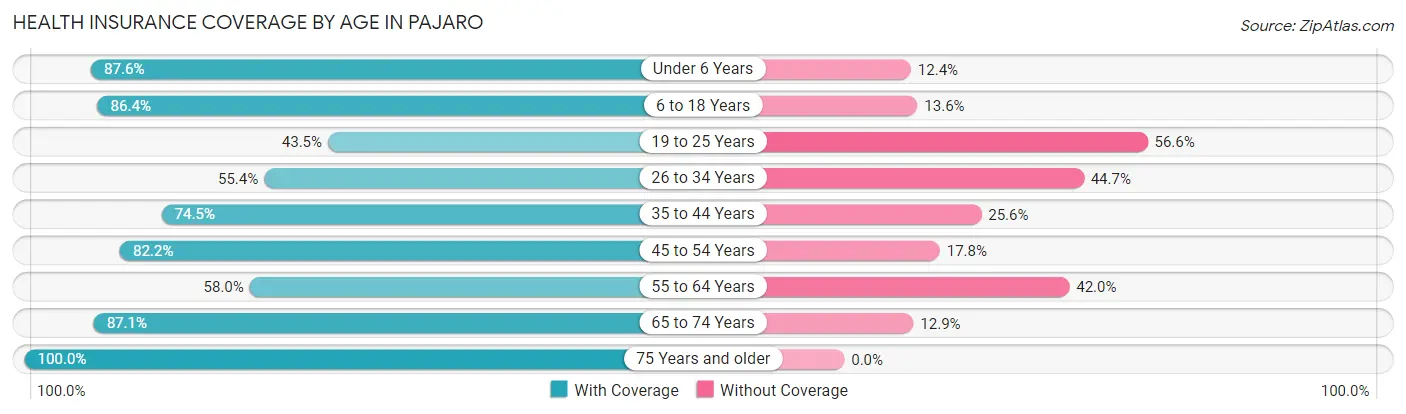
| Age Bracket | With Coverage | Without Coverage |
| Under 6 Years | 437 (87.6%) | 62 (12.4%) |
| 6 to 18 Years | 355 (86.4%) | 56 (13.6%) |
| 19 to 25 Years | 126 (43.4%) | 164 (56.6%) |
| 26 to 34 Years | 238 (55.3%) | 192 (44.7%) |
| 35 to 44 Years | 306 (74.5%) | 105 (25.6%) |
| 45 to 54 Years | 120 (82.2%) | 26 (17.8%) |
| 55 to 64 Years | 148 (58.0%) | 107 (42.0%) |
| 65 to 74 Years | 169 (87.1%) | 25 (12.9%) |
| 75 Years and older | 87 (100.0%) | 0 (0.0%) |
| Total | 1,986 (72.9%) | 737 (27.1%) |
Health Insurance Coverage by Citizenship Status in Pajaro
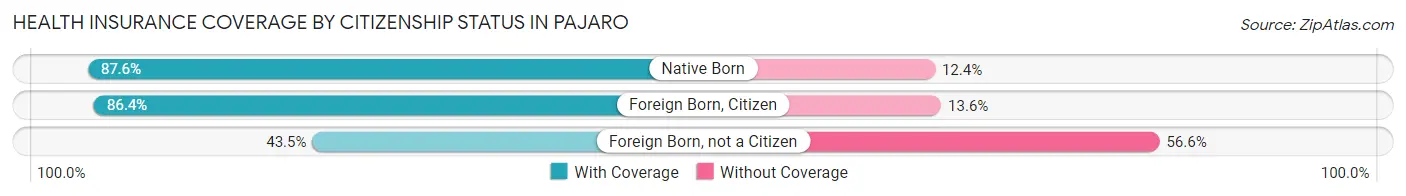
| Citizenship Status | With Coverage | Without Coverage |
| Native Born | 437 (87.6%) | 62 (12.4%) |
| Foreign Born, Citizen | 355 (86.4%) | 56 (13.6%) |
| Foreign Born, not a Citizen | 126 (43.4%) | 164 (56.6%) |
Health Insurance Coverage by Household Income in Pajaro
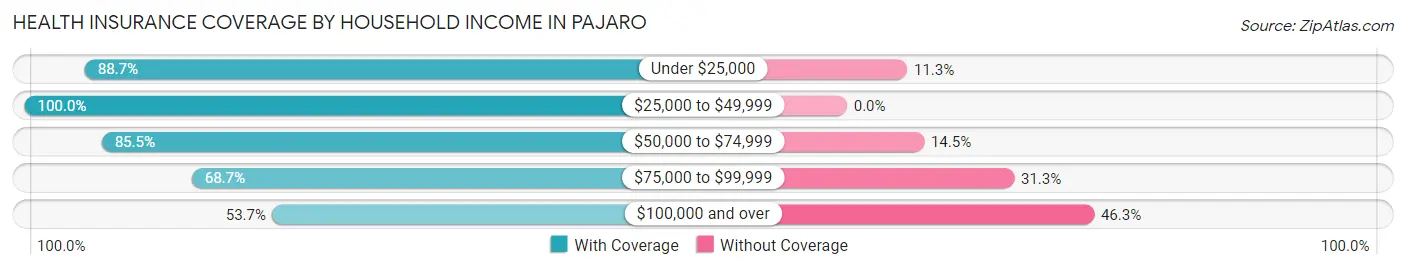
| Household Income | With Coverage | Without Coverage |
| Under $25,000 | 110 (88.7%) | 14 (11.3%) |
| $25,000 to $49,999 | 254 (100.0%) | 0 (0.0%) |
| $50,000 to $74,999 | 414 (85.5%) | 70 (14.5%) |
| $75,000 to $99,999 | 662 (68.7%) | 302 (31.3%) |
| $100,000 and over | 407 (53.7%) | 351 (46.3%) |
Public vs Private Health Insurance Coverage by Age in Pajaro
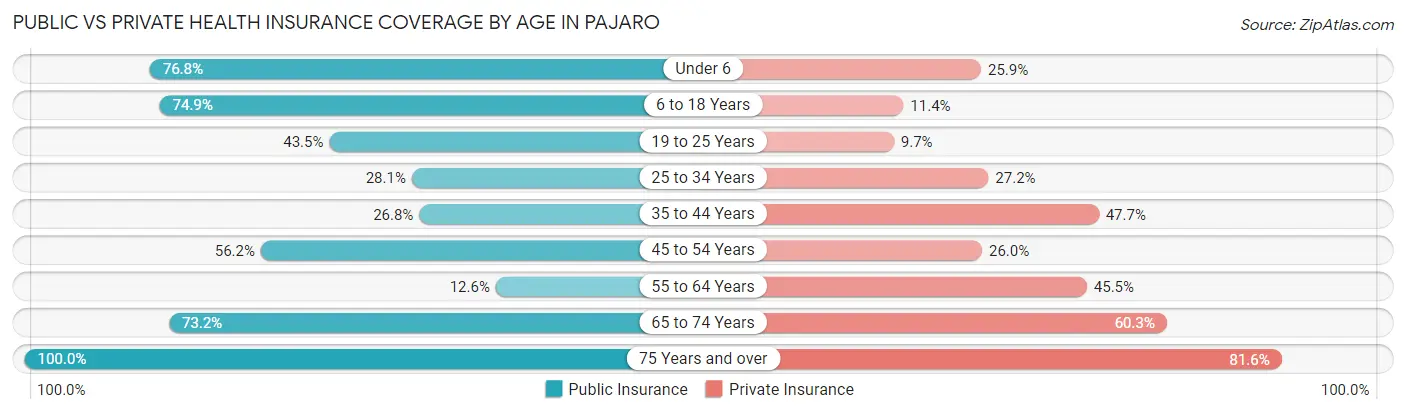
| Age Bracket | Public Insurance | Private Insurance |
| Under 6 | 383 (76.7%) | 129 (25.9%) |
| 6 to 18 Years | 308 (74.9%) | 47 (11.4%) |
| 19 to 25 Years | 126 (43.4%) | 28 (9.7%) |
| 25 to 34 Years | 121 (28.1%) | 117 (27.2%) |
| 35 to 44 Years | 110 (26.8%) | 196 (47.7%) |
| 45 to 54 Years | 82 (56.2%) | 38 (26.0%) |
| 55 to 64 Years | 32 (12.6%) | 116 (45.5%) |
| 65 to 74 Years | 142 (73.2%) | 117 (60.3%) |
| 75 Years and over | 87 (100.0%) | 71 (81.6%) |
| Total | 1,391 (51.1%) | 859 (31.6%) |
Disability Status by Sex by Age in Pajaro
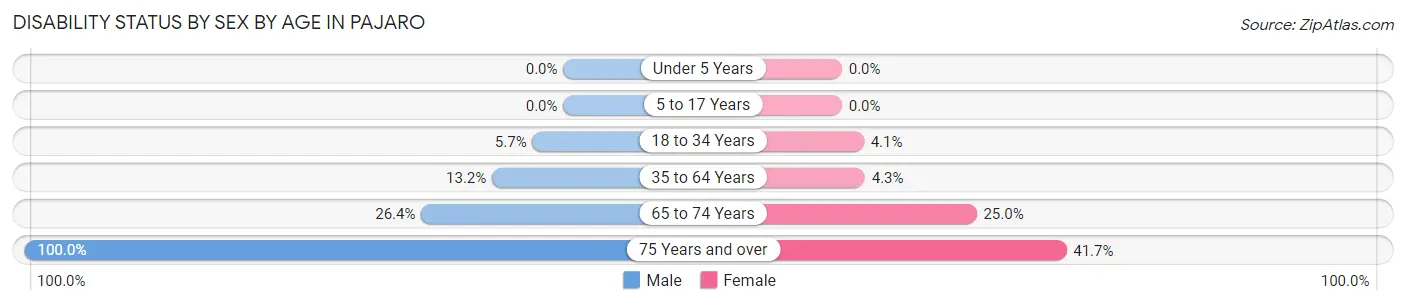
| Age Bracket | Male | Female |
| Under 5 Years | 0 (0.0%) | 0 (0.0%) |
| 5 to 17 Years | 0 (0.0%) | 0 (0.0%) |
| 18 to 34 Years | 27 (5.7%) | 14 (4.1%) |
| 35 to 64 Years | 64 (13.2%) | 14 (4.3%) |
| 65 to 74 Years | 29 (26.4%) | 21 (25.0%) |
| 75 Years and over | 27 (100.0%) | 25 (41.7%) |
Disability Class by Sex by Age in Pajaro
Disability Class: Hearing Difficulty
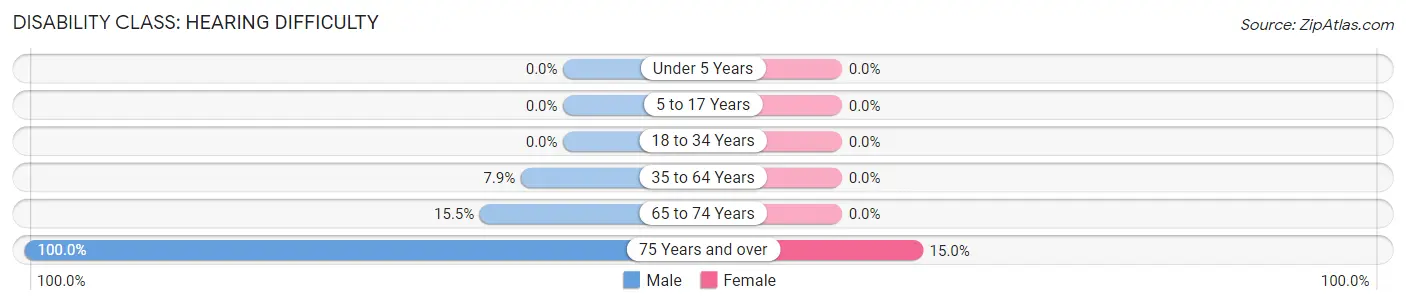
| Age Bracket | Male | Female |
| Under 5 Years | 0 (0.0%) | 0 (0.0%) |
| 5 to 17 Years | 0 (0.0%) | 0 (0.0%) |
| 18 to 34 Years | 0 (0.0%) | 0 (0.0%) |
| 35 to 64 Years | 38 (7.9%) | 0 (0.0%) |
| 65 to 74 Years | 17 (15.4%) | 0 (0.0%) |
| 75 Years and over | 27 (100.0%) | 9 (15.0%) |
Disability Class: Vision Difficulty
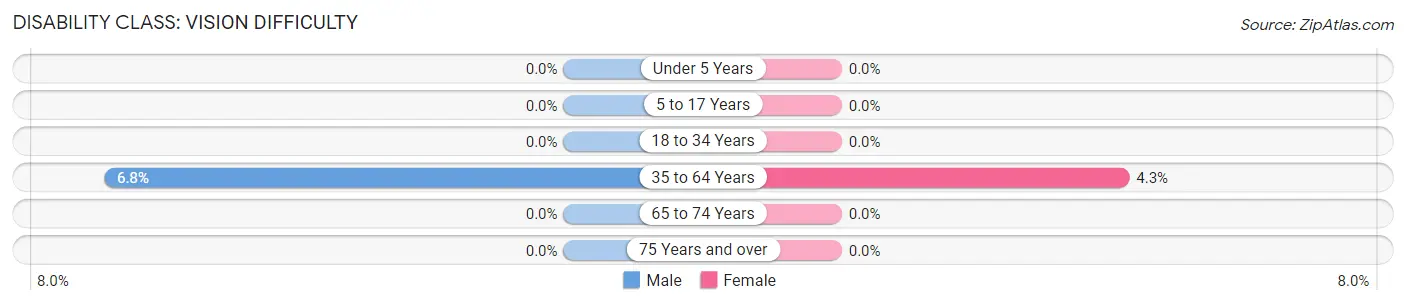
| Age Bracket | Male | Female |
| Under 5 Years | 0 (0.0%) | 0 (0.0%) |
| 5 to 17 Years | 0 (0.0%) | 0 (0.0%) |
| 18 to 34 Years | 0 (0.0%) | 0 (0.0%) |
| 35 to 64 Years | 33 (6.8%) | 14 (4.3%) |
| 65 to 74 Years | 0 (0.0%) | 0 (0.0%) |
| 75 Years and over | 0 (0.0%) | 0 (0.0%) |
Disability Class: Cognitive Difficulty
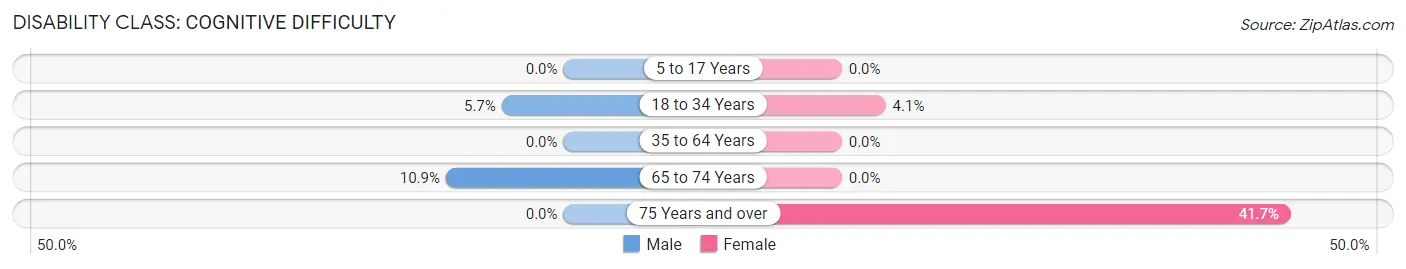
| Age Bracket | Male | Female |
| 5 to 17 Years | 0 (0.0%) | 0 (0.0%) |
| 18 to 34 Years | 27 (5.7%) | 14 (4.1%) |
| 35 to 64 Years | 0 (0.0%) | 0 (0.0%) |
| 65 to 74 Years | 12 (10.9%) | 0 (0.0%) |
| 75 Years and over | 0 (0.0%) | 25 (41.7%) |
Disability Class: Ambulatory Difficulty
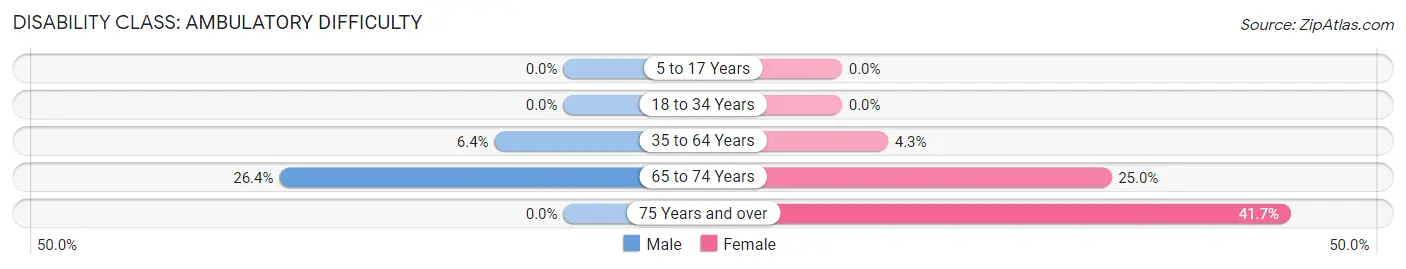
| Age Bracket | Male | Female |
| 5 to 17 Years | 0 (0.0%) | 0 (0.0%) |
| 18 to 34 Years | 0 (0.0%) | 0 (0.0%) |
| 35 to 64 Years | 31 (6.4%) | 14 (4.3%) |
| 65 to 74 Years | 29 (26.4%) | 21 (25.0%) |
| 75 Years and over | 0 (0.0%) | 25 (41.7%) |
Disability Class: Self-Care Difficulty
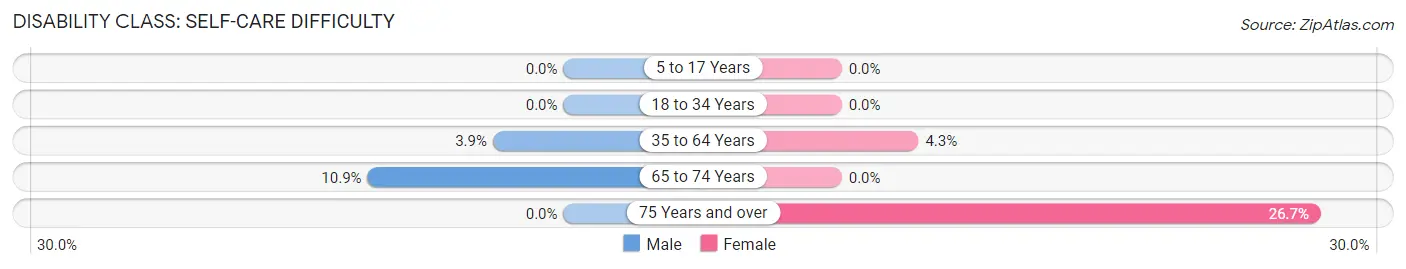
| Age Bracket | Male | Female |
| 5 to 17 Years | 0 (0.0%) | 0 (0.0%) |
| 18 to 34 Years | 0 (0.0%) | 0 (0.0%) |
| 35 to 64 Years | 19 (3.9%) | 14 (4.3%) |
| 65 to 74 Years | 12 (10.9%) | 0 (0.0%) |
| 75 Years and over | 0 (0.0%) | 16 (26.7%) |
Technology Access in Pajaro
Computing Device Access in Pajaro
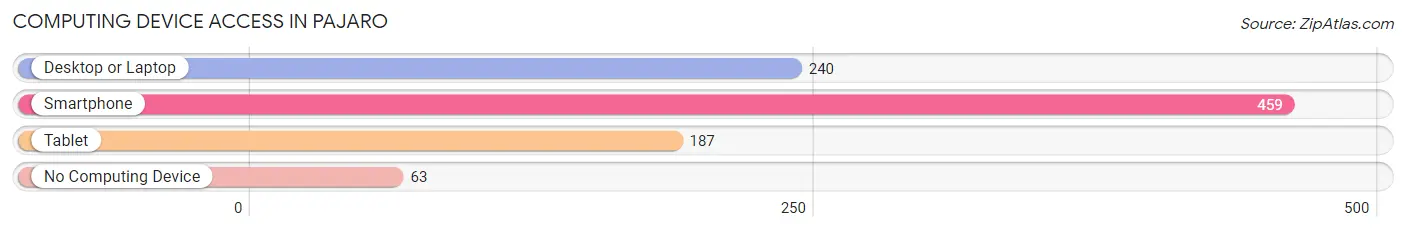
| Device Type | # Households | % Households |
| Desktop or Laptop | 240 | 46.0% |
| Smartphone | 459 | 87.9% |
| Tablet | 187 | 35.8% |
| No Computing Device | 63 | 12.1% |
| Total | 522 | 100.0% |
Internet Access in Pajaro
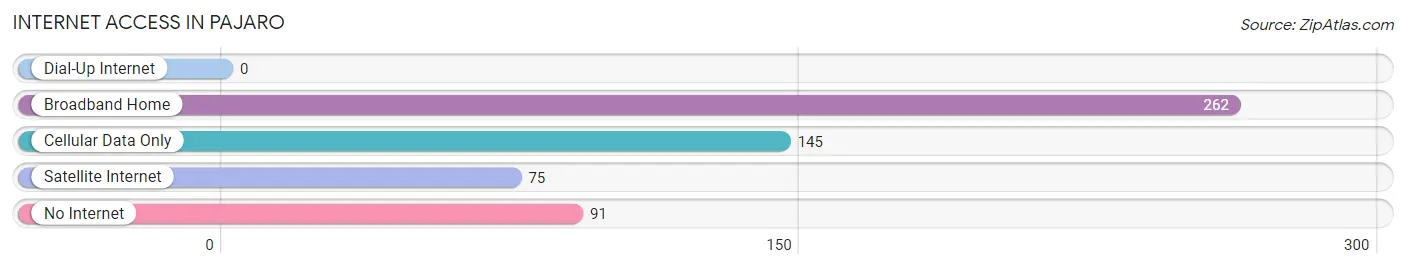
| Internet Type | # Households | % Households |
| Dial-Up Internet | 0 | 0.0% |
| Broadband Home | 262 | 50.2% |
| Cellular Data Only | 145 | 27.8% |
| Satellite Internet | 75 | 14.4% |
| No Internet | 91 | 17.4% |
| Total | 522 | 100.0% |
Pajaro Summary
Pajaro, California is a small unincorporated community located in Monterey County, California. It is situated on the banks of the Pajaro River, which flows through the area and is a major source of water for the region. The population of Pajaro was estimated to be around 1,000 people in 2020.
History
The area now known as Pajaro was originally inhabited by the Ohlone people, who lived in the area for thousands of years before the arrival of Europeans. The first Europeans to settle in the area were Spanish missionaries, who established the Mission San Juan Bautista in 1797. The mission was the first of its kind in the area and served as a base for the Spanish colonization of the region.
In the mid-1800s, the area was settled by Mexican ranchers and farmers, who established the town of Pajaro. The town was named after the Pajaro River, which flows through the area. The town grew steadily over the years and by the early 1900s, it had become a thriving agricultural community.
Geography
Pajaro is located in Monterey County, California, about 30 miles south of San Jose. It is situated on the banks of the Pajaro River, which flows through the area and is a major source of water for the region. The town is surrounded by rolling hills and is located in a temperate climate zone, with mild winters and warm summers.
Economy
The economy of Pajaro is largely based on agriculture. The area is known for its production of strawberries, lettuce, and other vegetables. The town is also home to several wineries, which produce a variety of wines. In addition, the town is home to several small businesses, including restaurants, shops, and other services.
Demographics
The population of Pajaro was estimated to be around 1,000 people in 2020. The town is predominantly Hispanic, with around 80% of the population identifying as Hispanic or Latino. The median household income in Pajaro is around $50,000, which is slightly lower than the national average. The town has a high rate of poverty, with around 25% of the population living below the poverty line.
Conclusion
Pajaro, California is a small unincorporated community located in Monterey County, California. It is situated on the banks of the Pajaro River, which flows through the area and is a major source of water for the region. The town has a long history, dating back to the Spanish missionaries who established the Mission San Juan Bautista in 1797. The economy of Pajaro is largely based on agriculture, with the town being known for its production of strawberries, lettuce, and other vegetables. The population of Pajaro was estimated to be around 1,000 people in 2020, with the town being predominantly Hispanic.
Common Questions
What is Per Capita Income in Pajaro?
Per Capita income in Pajaro is $17,152.
What is the Median Family Income in Pajaro?
Median Family Income in Pajaro is $77,589.
What is the Median Household income in Pajaro?
Median Household Income in Pajaro is $81,475.
What is Income or Wage Gap in Pajaro?
Income or Wage Gap in Pajaro is 48.9%.
Women in Pajaro earn 51.1 cents for every dollar earned by a man.
What is Inequality or Gini Index in Pajaro?
Inequality or Gini Index in Pajaro is 0.30.
What is the Total Population of Pajaro?
Total Population of Pajaro is 2,723.
What is the Total Male Population of Pajaro?
Total Male Population of Pajaro is 1,469.
What is the Total Female Population of Pajaro?
Total Female Population of Pajaro is 1,254.
What is the Ratio of Males per 100 Females in Pajaro?
There are 117.15 Males per 100 Females in Pajaro.
What is the Ratio of Females per 100 Males in Pajaro?
There are 85.36 Females per 100 Males in Pajaro.
What is the Median Population Age in Pajaro?
Median Population Age in Pajaro is 29.9 Years.
What is the Average Family Size in Pajaro
Average Family Size in Pajaro is 5.0 People.
What is the Average Household Size in Pajaro
Average Household Size in Pajaro is 5.0 People.
How Large is the Labor Force in Pajaro?
There are 1,206 People in the Labor Forcein in Pajaro.
What is the Percentage of People in the Labor Force in Pajaro?
63.0% of People are in the Labor Force in Pajaro.
What is the Unemployment Rate in Pajaro?
Unemployment Rate in Pajaro is 24.8%.