Cities with the Highest Percentage of Population with a Degree in Visual and Performing Arts in Missouri
RELATED REPORTS & OPTIONS
Visual and Performing Arts
Missouri
Compare Cities
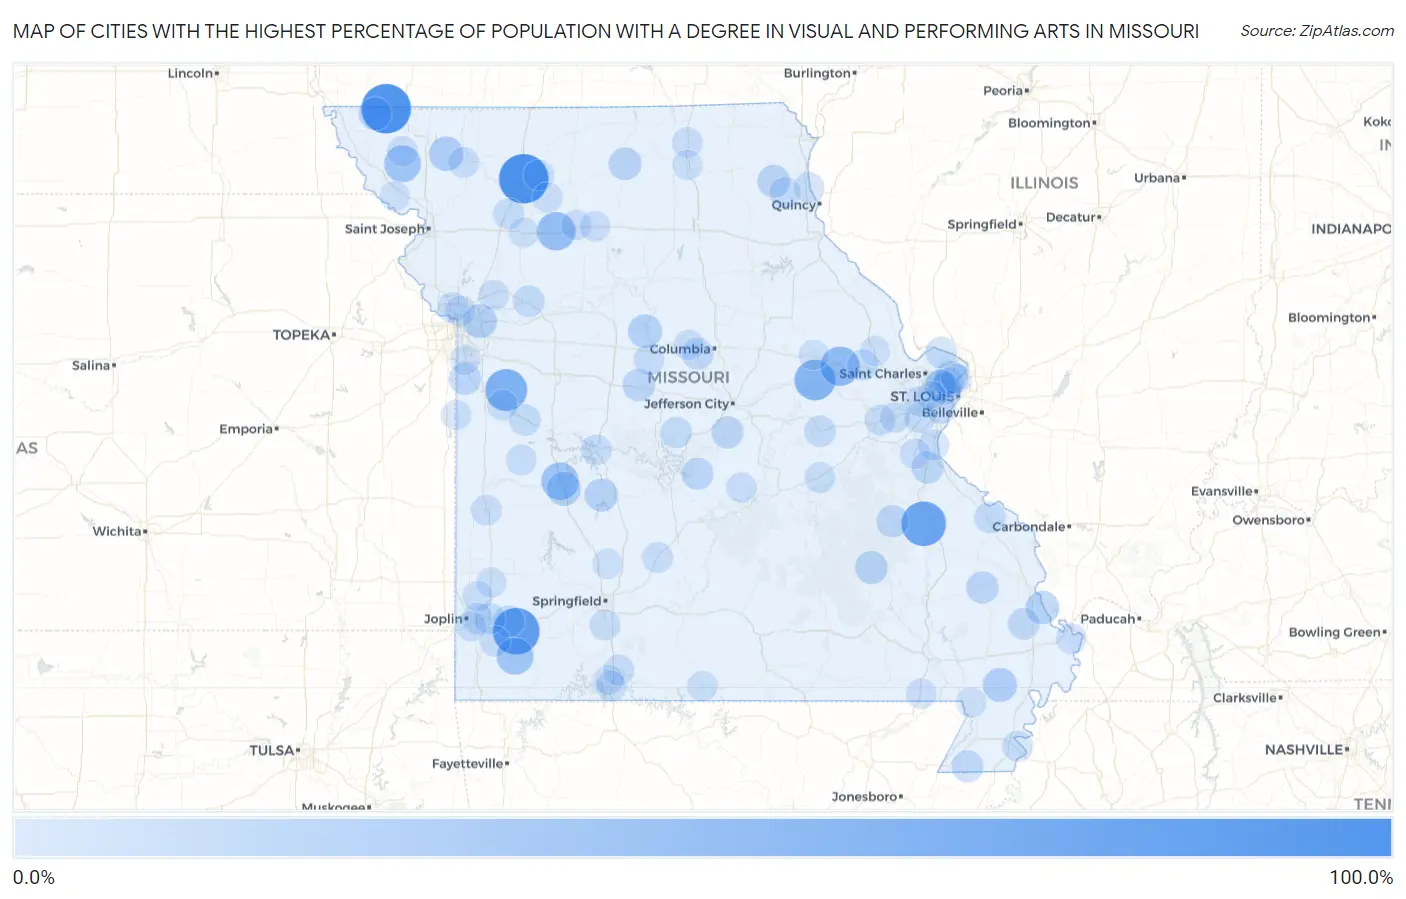
Map of Cities with the Highest Percentage of Population with a Degree in Visual and Performing Arts in Missouri
0.0%
100.0%
Cities with the Highest Percentage of Population with a Degree in Visual and Performing Arts in Missouri
| City | % Graduates | vs State | vs National | |
| 1. | Faucett | 100.0% | 3.8%(+96.2)#1 | 4.3%(+95.7)#19 |
| 2. | Coffey | 100.0% | 3.8%(+96.2)#2 | 4.3%(+95.7)#25 |
| 3. | Blanchard | 100.0% | 3.8%(+96.2)#3 | 4.3%(+95.7)#41 |
| 4. | Wentworth | 85.7% | 3.8%(+81.9)#4 | 4.3%(+81.5)#50 |
| 5. | Doe Run | 76.1% | 3.8%(+72.3)#5 | 4.3%(+71.8)#57 |
| 6. | Gunn City | 62.5% | 3.8%(+58.7)#6 | 4.3%(+58.2)#73 |
| 7. | Mckittrick | 57.1% | 3.8%(+53.4)#7 | 4.3%(+52.9)#89 |
| 8. | Pendleton | 50.0% | 3.8%(+46.2)#8 | 4.3%(+45.7)#125 |
| 9. | Mooresville | 46.2% | 3.8%(+42.4)#9 | 4.3%(+41.9)#144 |
| 10. | Osceola | 41.2% | 3.8%(+37.5)#10 | 4.3%(+37.0)#169 |
| 11. | Maitland | 38.3% | 3.8%(+34.5)#11 | 4.3%(+34.0)#188 |
| 12. | Fairview | 37.9% | 3.8%(+34.1)#12 | 4.3%(+33.6)#194 |
| 13. | Conception Junction | 26.9% | 3.8%(+23.2)#13 | 4.3%(+22.7)#378 |
| 14. | Parma | 25.0% | 3.8%(+21.2)#14 | 4.3%(+20.7)#418 |
| 15. | Vista | 25.0% | 3.8%(+21.2)#15 | 4.3%(+20.7)#447 |
| 16. | Sugar Creek | 24.7% | 3.8%(+20.9)#16 | 4.3%(+20.4)#451 |
| 17. | Arrow Rock | 23.8% | 3.8%(+20.0)#17 | 4.3%(+19.6)#465 |
| 18. | Commerce | 22.2% | 3.8%(+18.5)#18 | 4.3%(+18.0)#518 |
| 19. | Hermitage | 21.3% | 3.8%(+17.6)#19 | 4.3%(+17.1)#557 |
| 20. | Castle Point | 20.5% | 3.8%(+16.8)#20 | 4.3%(+16.3)#599 |
| 21. | Westboro | 20.0% | 3.8%(+16.2)#21 | 4.3%(+15.7)#639 |
| 22. | Milan | 19.3% | 3.8%(+15.5)#22 | 4.3%(+15.0)#683 |
| 23. | Centerville | 19.2% | 3.8%(+15.5)#23 | 4.3%(+15.0)#688 |
| 24. | Lewistown | 18.9% | 3.8%(+15.1)#24 | 4.3%(+14.6)#718 |
| 25. | Pagedale | 17.3% | 3.8%(+13.5)#25 | 4.3%(+13.0)#829 |
| 26. | Otterville | 17.2% | 3.8%(+13.5)#26 | 4.3%(+13.0)#834 |
| 27. | Marble Hill | 17.0% | 3.8%(+13.2)#27 | 4.3%(+12.7)#848 |
| 28. | St Thomas | 16.9% | 3.8%(+13.1)#28 | 4.3%(+12.6)#859 |
| 29. | Olympian Village | 16.7% | 3.8%(+12.9)#29 | 4.3%(+12.4)#874 |
| 30. | Caledonia | 16.7% | 3.8%(+12.9)#30 | 4.3%(+12.4)#895 |
| 31. | Riverview Estates | 16.7% | 3.8%(+12.9)#31 | 4.3%(+12.4)#906 |
| 32. | Vinita Park | 16.5% | 3.8%(+12.8)#32 | 4.3%(+12.3)#913 |
| 33. | Brumley | 15.8% | 3.8%(+12.0)#33 | 4.3%(+11.5)#975 |
| 34. | Hornersville | 15.0% | 3.8%(+11.2)#34 | 4.3%(+10.7)#1,058 |
| 35. | Morley | 14.3% | 3.8%(+10.5)#35 | 4.3%(+10.0)#1,148 |
| 36. | Huntsdale | 14.3% | 3.8%(+10.5)#36 | 4.3%(+10.0)#1,174 |
| 37. | Sarcoxie | 13.6% | 3.8%(+9.87)#37 | 4.3%(+9.38)#1,241 |
| 38. | Urich | 13.6% | 3.8%(+9.87)#38 | 4.3%(+9.38)#1,246 |
| 39. | Richmond | 13.6% | 3.8%(+9.81)#39 | 4.3%(+9.33)#1,251 |
| 40. | Rosebud | 13.5% | 3.8%(+9.74)#40 | 4.3%(+9.26)#1,264 |
| 41. | Barnett | 13.3% | 3.8%(+9.56)#41 | 4.3%(+9.08)#1,302 |
| 42. | Brewer | 13.0% | 3.8%(+9.27)#42 | 4.3%(+8.79)#1,343 |
| 43. | Portage Des Sioux | 12.0% | 3.8%(+8.23)#43 | 4.3%(+7.75)#1,520 |
| 44. | Wright City | 11.8% | 3.8%(+8.01)#44 | 4.3%(+7.53)#1,566 |
| 45. | Ewing | 11.8% | 3.8%(+7.99)#45 | 4.3%(+7.51)#1,575 |
| 46. | Fidelity | 11.1% | 3.8%(+7.34)#46 | 4.3%(+6.86)#1,705 |
| 47. | Parkdale | 11.1% | 3.8%(+7.34)#47 | 4.3%(+6.86)#1,712 |
| 48. | Winston | 11.1% | 3.8%(+7.34)#48 | 4.3%(+6.86)#1,723 |
| 49. | Merriam Woods | 11.0% | 3.8%(+7.19)#49 | 4.3%(+6.71)#1,759 |
| 50. | Duenweg | 10.9% | 3.8%(+7.14)#50 | 4.3%(+6.66)#1,771 |
| 51. | Cuba | 10.9% | 3.8%(+7.09)#51 | 4.3%(+6.61)#1,787 |
| 52. | Sycamore Hills | 10.9% | 3.8%(+7.08)#52 | 4.3%(+6.60)#1,788 |
| 53. | Conway | 10.7% | 3.8%(+6.94)#53 | 4.3%(+6.46)#1,826 |
| 54. | Nixa | 10.7% | 3.8%(+6.90)#54 | 4.3%(+6.42)#1,848 |
| 55. | Stanberry | 10.4% | 3.8%(+6.67)#55 | 4.3%(+6.19)#1,920 |
| 56. | Pevely | 10.4% | 3.8%(+6.59)#56 | 4.3%(+6.11)#1,943 |
| 57. | Granby | 10.1% | 3.8%(+6.37)#57 | 4.3%(+5.89)#2,015 |
| 58. | Country Club Hills | 10.1% | 3.8%(+6.36)#58 | 4.3%(+5.87)#2,022 |
| 59. | Warsaw | 10.1% | 3.8%(+6.31)#59 | 4.3%(+5.83)#2,032 |
| 60. | Winchester | 10.0% | 3.8%(+6.23)#60 | 4.3%(+5.75)#2,050 |
| 61. | Appleton City | 9.9% | 3.8%(+6.11)#61 | 4.3%(+5.62)#2,108 |
| 62. | Nevada | 9.8% | 3.8%(+6.01)#62 | 4.3%(+5.53)#2,137 |
| 63. | Villa Ridge | 9.8% | 3.8%(+5.98)#63 | 4.3%(+5.50)#2,154 |
| 64. | Garden City | 9.7% | 3.8%(+5.91)#64 | 4.3%(+5.43)#2,178 |
| 65. | Caruthersville | 9.6% | 3.8%(+5.87)#65 | 4.3%(+5.39)#2,195 |
| 66. | Pilot Grove | 9.6% | 3.8%(+5.84)#66 | 4.3%(+5.36)#2,206 |
| 67. | La Grange | 9.6% | 3.8%(+5.82)#67 | 4.3%(+5.34)#2,215 |
| 68. | Gilman City | 9.5% | 3.8%(+5.75)#68 | 4.3%(+5.27)#2,238 |
| 69. | Hollister | 9.5% | 3.8%(+5.73)#69 | 4.3%(+5.25)#2,249 |
| 70. | Lake Waukomis | 9.4% | 3.8%(+5.65)#70 | 4.3%(+5.17)#2,279 |
| 71. | Greentop | 9.4% | 3.8%(+5.63)#71 | 4.3%(+5.15)#2,286 |
| 72. | Alba | 9.2% | 3.8%(+5.44)#72 | 4.3%(+4.96)#2,355 |
| 73. | Pacific | 9.2% | 3.8%(+5.40)#73 | 4.3%(+4.91)#2,372 |
| 74. | Neelyville | 9.1% | 3.8%(+5.32)#74 | 4.3%(+4.84)#2,405 |
| 75. | Oakwood Park | 9.1% | 3.8%(+5.32)#75 | 4.3%(+4.84)#2,410 |
| 76. | Skidmore | 9.1% | 3.8%(+5.32)#76 | 4.3%(+4.84)#2,413 |
| 77. | Prathersville | 9.1% | 3.8%(+5.32)#77 | 4.3%(+4.84)#2,425 |
| 78. | Wyatt | 8.7% | 3.8%(+4.92)#78 | 4.3%(+4.44)#2,607 |
| 79. | Rocheport | 8.7% | 3.8%(+4.92)#79 | 4.3%(+4.44)#2,608 |
| 80. | Chillicothe | 8.6% | 3.8%(+4.80)#80 | 4.3%(+4.32)#2,658 |
| 81. | Drexel | 8.3% | 3.8%(+4.56)#81 | 4.3%(+4.08)#2,773 |
| 82. | Wheeling | 8.3% | 3.8%(+4.56)#82 | 4.3%(+4.08)#2,792 |
| 83. | Hillsboro | 8.1% | 3.8%(+4.34)#83 | 4.3%(+3.86)#2,907 |
| 84. | Gainesville | 8.1% | 3.8%(+4.34)#84 | 4.3%(+3.86)#2,910 |
| 85. | Saginaw | 8.1% | 3.8%(+4.29)#85 | 4.3%(+3.81)#2,932 |
| 86. | Jamesport | 8.0% | 3.8%(+4.23)#86 | 4.3%(+3.75)#2,968 |
| 87. | Lakeshire | 7.9% | 3.8%(+4.17)#87 | 4.3%(+3.68)#3,008 |
| 88. | Dixon | 7.9% | 3.8%(+4.15)#88 | 4.3%(+3.67)#3,017 |
| 89. | Hamilton | 7.9% | 3.8%(+4.10)#89 | 4.3%(+3.62)#3,040 |
| 90. | Pleasant Hope | 7.8% | 3.8%(+4.02)#90 | 4.3%(+3.54)#3,093 |
| 91. | New Florence | 7.8% | 3.8%(+4.01)#91 | 4.3%(+3.53)#3,106 |
| 92. | Oregon | 7.8% | 3.8%(+4.00)#92 | 4.3%(+3.51)#3,116 |
| 93. | Grandview | 7.6% | 3.8%(+3.85)#93 | 4.3%(+3.37)#3,213 |
| 94. | Campbell | 7.6% | 3.8%(+3.80)#94 | 4.3%(+3.32)#3,248 |
| 95. | Kirksville | 7.4% | 3.8%(+3.62)#95 | 4.3%(+3.14)#3,373 |
| 96. | Branson | 7.4% | 3.8%(+3.60)#96 | 4.3%(+3.12)#3,388 |
| 97. | Moscow Mills | 7.3% | 3.8%(+3.48)#97 | 4.3%(+3.00)#3,487 |
| 98. | Riverview | 7.2% | 3.8%(+3.45)#98 | 4.3%(+2.96)#3,513 |
| 99. | Crystal Lake Park | 7.2% | 3.8%(+3.39)#99 | 4.3%(+2.91)#3,547 |
| 100. | Jasper | 7.1% | 3.8%(+3.37)#100 | 4.3%(+2.89)#3,569 |
Common Questions
What are the Top 10 Cities with the Highest Percentage of Population with a Degree in Visual and Performing Arts in Missouri?
Top 10 Cities with the Highest Percentage of Population with a Degree in Visual and Performing Arts in Missouri are:
#1
100.0%
#2
100.0%
#3
85.7%
#4
76.1%
#5
62.5%
#6
57.1%
#7
50.0%
#8
46.2%
#9
41.2%
#10
38.3%
What city has the Highest Percentage of Population with a Degree in Visual and Performing Arts in Missouri?
Coffey has the Highest Percentage of Population with a Degree in Visual and Performing Arts in Missouri with 100.0%.
What is the Percentage of Population with a Degree in Visual and Performing Arts in the State of Missouri?
Percentage of Population with a Degree in Visual and Performing Arts in Missouri is 3.8%.
What is the Percentage of Population with a Degree in Visual and Performing Arts in the United States?
Percentage of Population with a Degree in Visual and Performing Arts in the United States is 4.3%.