Cities with the Highest Percentage of Population with a Degree in Visual and Performing Arts in Pennsylvania
RELATED REPORTS & OPTIONS
Visual and Performing Arts
Pennsylvania
Compare Cities
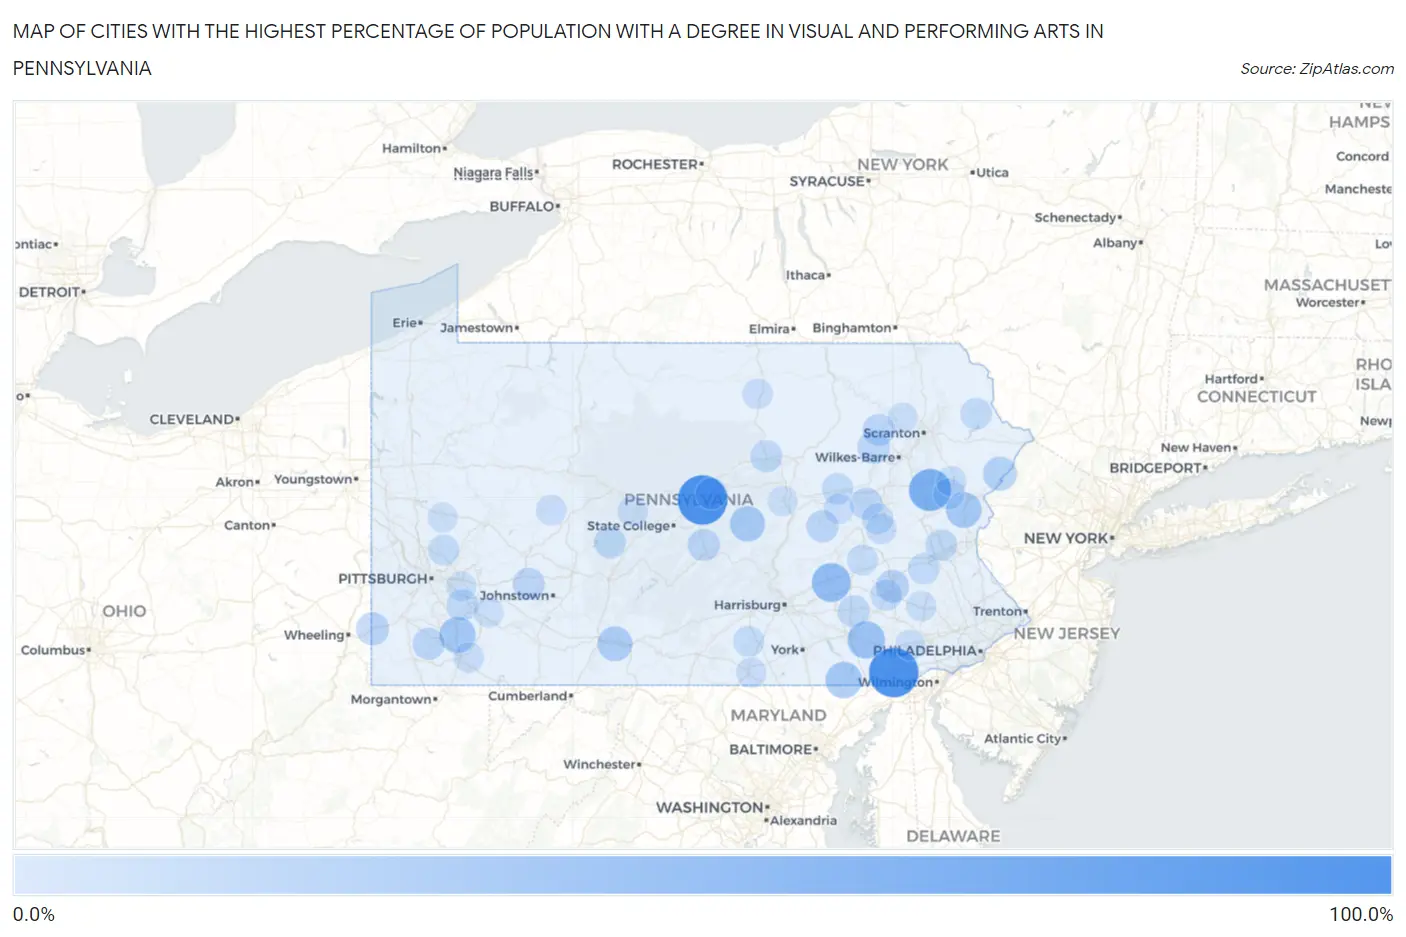
Map of Cities with the Highest Percentage of Population with a Degree in Visual and Performing Arts in Pennsylvania
0.0%
100.0%
Cities with the Highest Percentage of Population with a Degree in Visual and Performing Arts in Pennsylvania
| City | % Graduates | vs State | vs National | |
| 1. | Lincoln University | 100.0% | 3.8%(+96.2)#1 | 4.3%(+95.7)#1 |
| 2. | Hublersburg | 100.0% | 3.8%(+96.2)#2 | 4.3%(+95.7)#22 |
| 3. | Holiday Pocono | 65.3% | 3.8%(+61.5)#3 | 4.3%(+61.0)#68 |
| 4. | Marion Center Borough | 51.0% | 3.8%(+47.2)#4 | 4.3%(+46.7)#106 |
| 5. | Shelltown | 50.0% | 3.8%(+46.2)#5 | 4.3%(+45.7)#118 |
| 6. | Jonestown | 50.0% | 3.8%(+46.2)#6 | 4.3%(+45.7)#119 |
| 7. | Ronks | 43.3% | 3.8%(+39.5)#7 | 4.3%(+39.1)#158 |
| 8. | Susquehanna Trails | 38.2% | 3.8%(+34.4)#8 | 4.3%(+34.0)#189 |
| 9. | Star Junction | 37.5% | 3.8%(+33.7)#9 | 4.3%(+33.2)#197 |
| 10. | Saylorsburg | 35.6% | 3.8%(+31.8)#10 | 4.3%(+31.3)#220 |
| 11. | Troxelville | 33.3% | 3.8%(+29.5)#11 | 4.3%(+29.1)#248 |
| 12. | Ohiopyle Borough | 33.3% | 3.8%(+29.5)#12 | 4.3%(+29.1)#270 |
| 13. | Earlston | 32.0% | 3.8%(+28.2)#13 | 4.3%(+27.7)#281 |
| 14. | Troutville Borough | 30.0% | 3.8%(+26.2)#14 | 4.3%(+25.7)#313 |
| 15. | Haysville Borough | 29.7% | 3.8%(+25.9)#15 | 4.3%(+25.5)#316 |
| 16. | Spring Grove Borough | 29.3% | 3.8%(+25.4)#16 | 4.3%(+25.0)#322 |
| 17. | Cross Keys | 29.2% | 3.8%(+25.4)#17 | 4.3%(+25.0)#325 |
| 18. | Pine Ridge | 27.9% | 3.8%(+24.1)#18 | 4.3%(+23.7)#358 |
| 19. | Coalport Borough | 25.7% | 3.8%(+21.9)#19 | 4.3%(+21.5)#401 |
| 20. | Dawson Borough | 25.0% | 3.8%(+21.2)#20 | 4.3%(+20.7)#423 |
| 21. | Mckees Rocks Borough | 24.2% | 3.8%(+20.4)#21 | 4.3%(+20.0)#456 |
| 22. | West Alexander | 23.5% | 3.8%(+19.7)#22 | 4.3%(+19.3)#471 |
| 23. | Muhlenberg Park | 22.5% | 3.8%(+18.7)#23 | 4.3%(+18.3)#500 |
| 24. | Pikes Creek | 22.1% | 3.8%(+18.2)#24 | 4.3%(+17.8)#527 |
| 25. | Fredericktown | 20.6% | 3.8%(+16.8)#25 | 4.3%(+16.3)#596 |
| 26. | Shamokin | 20.0% | 3.8%(+16.2)#26 | 4.3%(+15.8)#619 |
| 27. | Nuremberg | 20.0% | 3.8%(+16.2)#27 | 4.3%(+15.7)#631 |
| 28. | Reedsville | 19.8% | 3.8%(+16.0)#28 | 4.3%(+15.6)#647 |
| 29. | Dixonville | 19.8% | 3.8%(+15.9)#29 | 4.3%(+15.5)#651 |
| 30. | Noxen | 19.5% | 3.8%(+15.7)#30 | 4.3%(+15.3)#669 |
| 31. | Robinson | 19.4% | 3.8%(+15.6)#31 | 4.3%(+15.2)#675 |
| 32. | Ernest Borough | 19.3% | 3.8%(+15.5)#32 | 4.3%(+15.1)#682 |
| 33. | Garden View | 19.2% | 3.8%(+15.4)#33 | 4.3%(+15.0)#690 |
| 34. | Big Run Borough | 19.0% | 3.8%(+15.2)#34 | 4.3%(+14.8)#704 |
| 35. | Chest Springs Borough | 19.0% | 3.8%(+15.2)#35 | 4.3%(+14.8)#707 |
| 36. | Brickerville | 19.0% | 3.8%(+15.2)#36 | 4.3%(+14.8)#711 |
| 37. | Garrett Borough | 18.8% | 3.8%(+14.9)#37 | 4.3%(+14.5)#726 |
| 38. | Lamar | 18.6% | 3.8%(+14.8)#38 | 4.3%(+14.4)#739 |
| 39. | Snow Shoe Borough | 18.2% | 3.8%(+14.4)#39 | 4.3%(+13.9)#761 |
| 40. | Blandburg | 18.2% | 3.8%(+14.4)#40 | 4.3%(+13.9)#763 |
| 41. | Herminie | 18.2% | 3.8%(+14.4)#41 | 4.3%(+13.9)#766 |
| 42. | Stiles | 17.9% | 3.8%(+14.0)#42 | 4.3%(+13.6)#789 |
| 43. | White Mills | 17.6% | 3.8%(+13.8)#43 | 4.3%(+13.4)#801 |
| 44. | West Lawn | 17.5% | 3.8%(+13.6)#44 | 4.3%(+13.2)#818 |
| 45. | East Conemaugh Borough | 16.9% | 3.8%(+13.1)#45 | 4.3%(+12.7)#853 |
| 46. | Lightstreet | 16.8% | 3.8%(+12.9)#46 | 4.3%(+12.5)#862 |
| 47. | Mertztown | 16.7% | 3.8%(+12.8)#47 | 4.3%(+12.4)#878 |
| 48. | Sunbrook | 16.7% | 3.8%(+12.8)#48 | 4.3%(+12.4)#896 |
| 49. | New Buffalo Borough | 16.7% | 3.8%(+12.8)#49 | 4.3%(+12.4)#903 |
| 50. | New Oxford Borough | 16.6% | 3.8%(+12.7)#50 | 4.3%(+12.3)#912 |
| 51. | Brackenridge Borough | 16.5% | 3.8%(+12.7)#51 | 4.3%(+12.3)#914 |
| 52. | Juniata Terrace Borough | 15.6% | 3.8%(+11.8)#52 | 4.3%(+11.4)#993 |
| 53. | Mount Oliver Borough | 15.5% | 3.8%(+11.7)#53 | 4.3%(+11.3)#1,008 |
| 54. | Bairdford | 15.4% | 3.8%(+11.6)#54 | 4.3%(+11.1)#1,023 |
| 55. | Delano | 15.4% | 3.8%(+11.6)#55 | 4.3%(+11.1)#1,028 |
| 56. | Sierra View | 15.1% | 3.8%(+11.2)#56 | 4.3%(+10.8)#1,052 |
| 57. | Summit Station | 15.0% | 3.8%(+11.2)#57 | 4.3%(+10.7)#1,063 |
| 58. | Idaville | 15.0% | 3.8%(+11.2)#58 | 4.3%(+10.7)#1,064 |
| 59. | Dauphin Borough | 14.7% | 3.8%(+10.9)#59 | 4.3%(+10.5)#1,092 |
| 60. | Sharon Hill Borough | 14.7% | 3.8%(+10.8)#60 | 4.3%(+10.4)#1,100 |
| 61. | Thompsontown Borough | 14.6% | 3.8%(+10.8)#61 | 4.3%(+10.4)#1,105 |
| 62. | Stoneboro Borough | 14.5% | 3.8%(+10.7)#62 | 4.3%(+10.2)#1,122 |
| 63. | Riegelsville Borough | 14.4% | 3.8%(+10.6)#63 | 4.3%(+10.2)#1,130 |
| 64. | New Centerville Borough | 14.3% | 3.8%(+10.5)#64 | 4.3%(+10.0)#1,168 |
| 65. | Glasgow Borough | 14.3% | 3.8%(+10.5)#65 | 4.3%(+10.0)#1,171 |
| 66. | Tuscarora | 13.3% | 3.8%(+9.51)#66 | 4.3%(+9.08)#1,292 |
| 67. | Darby Borough | 13.2% | 3.8%(+9.38)#67 | 4.3%(+8.96)#1,319 |
| 68. | Stockdale Borough | 13.2% | 3.8%(+9.38)#68 | 4.3%(+8.96)#1,323 |
| 69. | Delmont Borough | 13.1% | 3.8%(+9.29)#69 | 4.3%(+8.86)#1,333 |
| 70. | Freedom Borough | 13.1% | 3.8%(+9.25)#70 | 4.3%(+8.82)#1,338 |
| 71. | Rossiter | 13.0% | 3.8%(+9.22)#71 | 4.3%(+8.79)#1,341 |
| 72. | West Elizabeth Borough | 13.0% | 3.8%(+9.22)#72 | 4.3%(+8.79)#1,344 |
| 73. | Cokeburg Borough | 12.9% | 3.8%(+9.08)#73 | 4.3%(+8.65)#1,356 |
| 74. | Howard Borough | 12.9% | 3.8%(+9.05)#74 | 4.3%(+8.62)#1,364 |
| 75. | Lake Heritage | 12.7% | 3.8%(+8.92)#75 | 4.3%(+8.50)#1,381 |
| 76. | Lemont Furnace | 12.7% | 3.8%(+8.88)#76 | 4.3%(+8.45)#1,387 |
| 77. | New Milford Borough | 12.7% | 3.8%(+8.88)#77 | 4.3%(+8.45)#1,388 |
| 78. | South Philipsburg | 12.7% | 3.8%(+8.85)#78 | 4.3%(+8.42)#1,391 |
| 79. | Dover Borough | 12.6% | 3.8%(+8.81)#79 | 4.3%(+8.38)#1,399 |
| 80. | Hallam Borough | 12.6% | 3.8%(+8.80)#80 | 4.3%(+8.38)#1,401 |
| 81. | Mount Holly Springs Borough | 12.5% | 3.8%(+8.68)#81 | 4.3%(+8.25)#1,410 |
| 82. | Arnot | 12.5% | 3.8%(+8.68)#82 | 4.3%(+8.25)#1,416 |
| 83. | Slabtown | 12.5% | 3.8%(+8.68)#83 | 4.3%(+8.25)#1,430 |
| 84. | Emerald Lakes | 12.2% | 3.8%(+8.41)#84 | 4.3%(+7.98)#1,471 |
| 85. | Caln | 12.2% | 3.8%(+8.41)#85 | 4.3%(+7.98)#1,472 |
| 86. | Jessup Borough | 12.2% | 3.8%(+8.35)#86 | 4.3%(+7.92)#1,488 |
| 87. | Milesburg Borough | 12.0% | 3.8%(+8.21)#87 | 4.3%(+7.78)#1,515 |
| 88. | Canton Borough | 12.0% | 3.8%(+8.21)#88 | 4.3%(+7.78)#1,516 |
| 89. | Stowe | 11.9% | 3.8%(+8.07)#89 | 4.3%(+7.64)#1,544 |
| 90. | Muncy Borough | 11.8% | 3.8%(+7.98)#90 | 4.3%(+7.55)#1,560 |
| 91. | Fairchance Borough | 11.7% | 3.8%(+7.85)#91 | 4.3%(+7.42)#1,592 |
| 92. | Fredonia Borough | 11.6% | 3.8%(+7.80)#92 | 4.3%(+7.38)#1,604 |
| 93. | Meadowood | 11.3% | 3.8%(+7.52)#93 | 4.3%(+7.09)#1,647 |
| 94. | Level Green | 11.3% | 3.8%(+7.50)#94 | 4.3%(+7.08)#1,649 |
| 95. | Lake Winola | 11.3% | 3.8%(+7.50)#95 | 4.3%(+7.07)#1,652 |
| 96. | Chalfant Borough | 11.3% | 3.8%(+7.48)#96 | 4.3%(+7.05)#1,656 |
| 97. | Orangeville Borough | 11.2% | 3.8%(+7.41)#97 | 4.3%(+6.98)#1,667 |
| 98. | Linntown | 11.2% | 3.8%(+7.40)#98 | 4.3%(+6.97)#1,671 |
| 99. | Cressona Borough | 11.2% | 3.8%(+7.34)#99 | 4.3%(+6.92)#1,680 |
| 100. | Calumet | 11.1% | 3.8%(+7.29)#100 | 4.3%(+6.86)#1,691 |
Common Questions
What are the Top 10 Cities with the Highest Percentage of Population with a Degree in Visual and Performing Arts in Pennsylvania?
Top 10 Cities with the Highest Percentage of Population with a Degree in Visual and Performing Arts in Pennsylvania are:
#1
100.0%
#2
100.0%
#3
65.3%
#4
50.0%
#5
43.3%
#6
38.2%
#7
37.5%
#8
35.6%
#9
33.3%
#10
32.0%
What city has the Highest Percentage of Population with a Degree in Visual and Performing Arts in Pennsylvania?
Lincoln University has the Highest Percentage of Population with a Degree in Visual and Performing Arts in Pennsylvania with 100.0%.
What is the Percentage of Population with a Degree in Visual and Performing Arts in the State of Pennsylvania?
Percentage of Population with a Degree in Visual and Performing Arts in Pennsylvania is 3.8%.
What is the Percentage of Population with a Degree in Visual and Performing Arts in the United States?
Percentage of Population with a Degree in Visual and Performing Arts in the United States is 4.3%.