Lone Pine, CA Map & Demographics
Lone Pine Map
Lone Pine Overview
$27,933
PER CAPITA INCOME
$64,432
AVG FAMILY INCOME
$39,881
AVG HOUSEHOLD INCOME
18.2%
WAGE / INCOME GAP [ % ]
81.8¢/ $1
WAGE / INCOME GAP [ $ ]
0.52
INEQUALITY / GINI INDEX
1,323
TOTAL POPULATION
778
MALE POPULATION
545
FEMALE POPULATION
142.75
MALES / 100 FEMALES
70.05
FEMALES / 100 MALES
45.6
MEDIAN AGE
3.6
AVG FAMILY SIZE
2.2
AVG HOUSEHOLD SIZE
370
LABOR FORCE [ PEOPLE ]
38.0%
PERCENT IN LABOR FORCE
5.1%
UNEMPLOYMENT RATE
Lone Pine Zip Codes
Lone Pine Area Codes
Income in Lone Pine
Income Overview in Lone Pine
Per Capita Income in Lone Pine is $27,933, while median incomes of families and households are $64,432 and $39,881 respectively.
| Characteristic | Number | Measure |
| Per Capita Income | 1,323 | $27,933 |
| Median Family Income | 251 | $64,432 |
| Mean Family Income | 251 | $103,072 |
| Median Household Income | 570 | $39,881 |
| Mean Household Income | 570 | $67,874 |
| Income Deficit | 251 | $0 |
| Wage / Income Gap (%) | 1,323 | 18.24% |
| Wage / Income Gap ($) | 1,323 | 81.76¢ per $1 |
| Gini / Inequality Index | 1,323 | 0.52 |
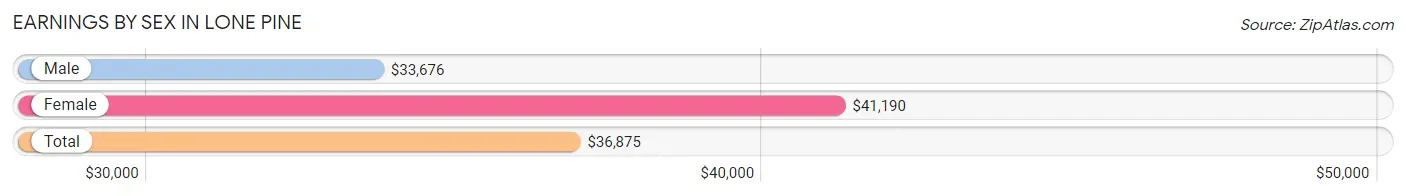
Earnings by Sex in Lone Pine
Average Earnings in Lone Pine are $36,875, $33,676 for men and $41,190 for women, a difference of 18.2%.
| Sex | Number | Average Earnings |
| Male | 258 (67.2%) | $33,676 |
| Female | 126 (32.8%) | $41,190 |
| Total | 384 (100.0%) | $36,875 |
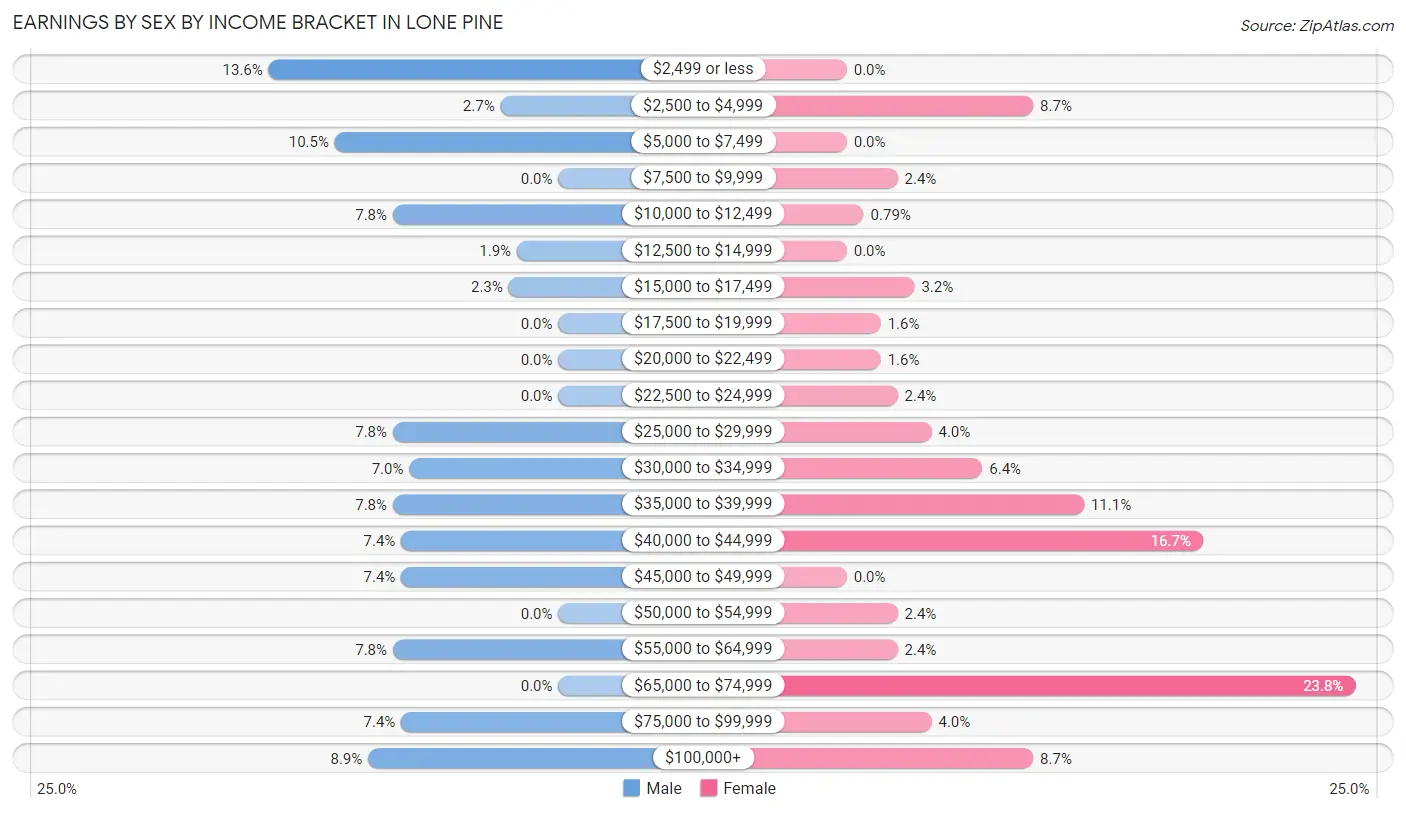
Earnings by Sex by Income Bracket in Lone Pine
The most common earnings brackets in Lone Pine are $2,499 or less for men (35 | 13.6%) and $65,000 to $74,999 for women (30 | 23.8%).
| Income | Male | Female |
| $2,499 or less | 35 (13.6%) | 0 (0.0%) |
| $2,500 to $4,999 | 7 (2.7%) | 11 (8.7%) |
| $5,000 to $7,499 | 27 (10.5%) | 0 (0.0%) |
| $7,500 to $9,999 | 0 (0.0%) | 3 (2.4%) |
| $10,000 to $12,499 | 20 (7.7%) | 1 (0.8%) |
| $12,500 to $14,999 | 5 (1.9%) | 0 (0.0%) |
| $15,000 to $17,499 | 6 (2.3%) | 4 (3.2%) |
| $17,500 to $19,999 | 0 (0.0%) | 2 (1.6%) |
| $20,000 to $22,499 | 0 (0.0%) | 2 (1.6%) |
| $22,500 to $24,999 | 0 (0.0%) | 3 (2.4%) |
| $25,000 to $29,999 | 20 (7.7%) | 5 (4.0%) |
| $30,000 to $34,999 | 18 (7.0%) | 8 (6.4%) |
| $35,000 to $39,999 | 20 (7.7%) | 14 (11.1%) |
| $40,000 to $44,999 | 19 (7.4%) | 21 (16.7%) |
| $45,000 to $49,999 | 19 (7.4%) | 0 (0.0%) |
| $50,000 to $54,999 | 0 (0.0%) | 3 (2.4%) |
| $55,000 to $64,999 | 20 (7.7%) | 3 (2.4%) |
| $65,000 to $74,999 | 0 (0.0%) | 30 (23.8%) |
| $75,000 to $99,999 | 19 (7.4%) | 5 (4.0%) |
| $100,000+ | 23 (8.9%) | 11 (8.7%) |
| Total | 258 (100.0%) | 126 (100.0%) |
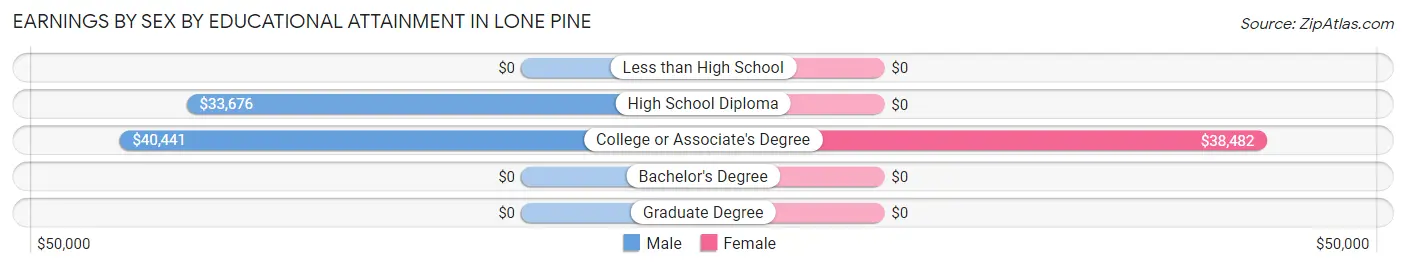
Earnings by Sex by Educational Attainment in Lone Pine
Average earnings in Lone Pine are $34,632 for men and $41,488 for women, a difference of 16.5%. Men with an educational attainment of college or associate's degree enjoy the highest average annual earnings of $40,441, while those with high school diploma education earn the least with $33,676. Women with an educational attainment of college or associate's degree earn the most with the average annual earnings of $38,482, while those with college or associate's degree education have the smallest earnings of $38,482.
| Educational Attainment | Male Income | Female Income |
| Less than High School | - | - |
| High School Diploma | $33,676 | $0 |
| College or Associate's Degree | $40,441 | $38,482 |
| Bachelor's Degree | - | - |
| Graduate Degree | - | - |
| Total | $34,632 | $41,488 |
Family Income in Lone Pine
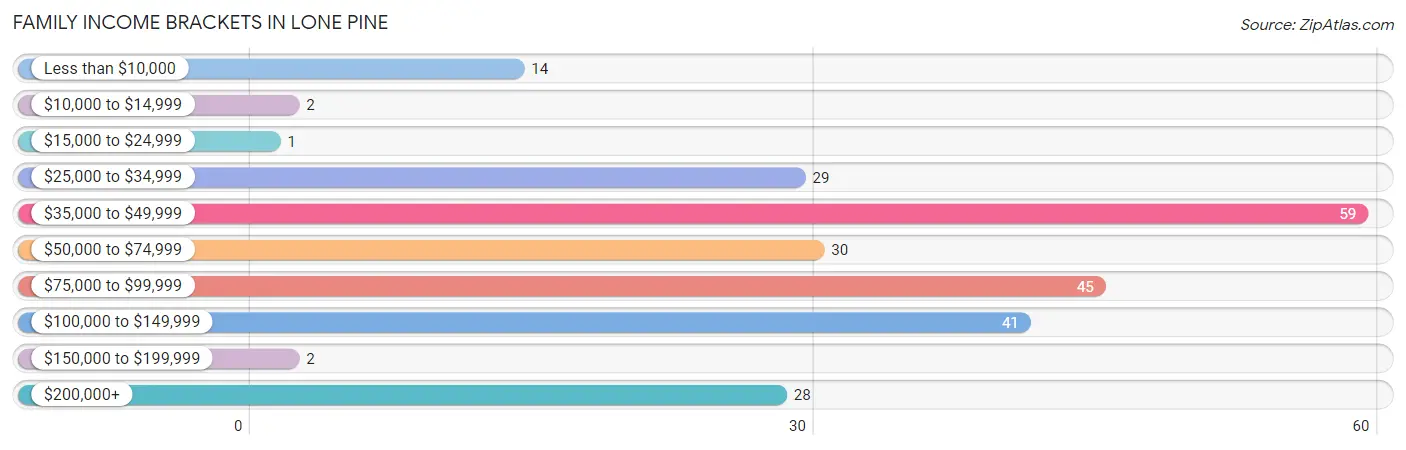
Family Income Brackets in Lone Pine
According to the Lone Pine family income data, there are 59 families falling into the $35,000 to $49,999 income range, which is the most common income bracket and makes up 23.5% of all families. Conversely, the $15,000 to $24,999 income bracket is the least frequent group with only 1 families (0.4%) belonging to this category.
| Income Bracket | # Families | % Families |
| Less than $10,000 | 14 | 5.6% |
| $10,000 to $14,999 | 2 | 0.8% |
| $15,000 to $24,999 | 1 | 0.4% |
| $25,000 to $34,999 | 29 | 11.6% |
| $35,000 to $49,999 | 59 | 23.5% |
| $50,000 to $74,999 | 30 | 12.0% |
| $75,000 to $99,999 | 45 | 17.9% |
| $100,000 to $149,999 | 41 | 16.3% |
| $150,000 to $199,999 | 2 | 0.8% |
| $200,000+ | 28 | 11.2% |
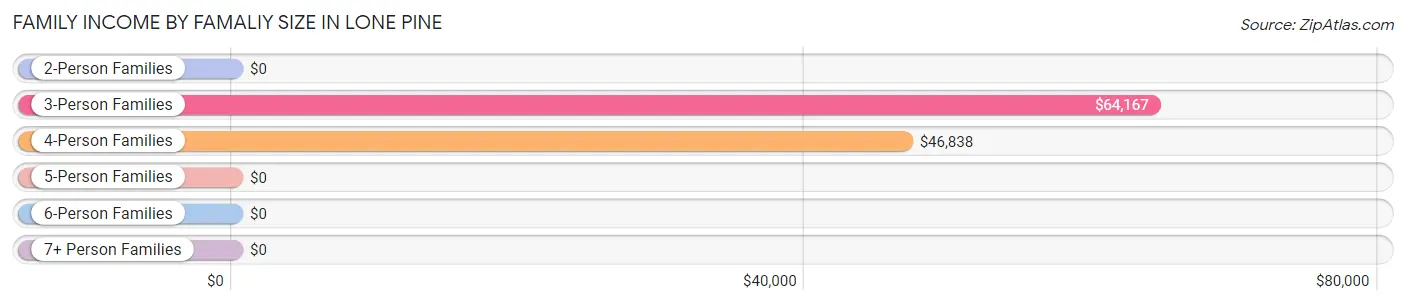
Family Income by Famaliy Size in Lone Pine
3-person families (22 | 8.8%) account for the highest median family income in Lone Pine with $64,167 per family, while 3-person families (22 | 8.8%) have the highest median income of $21,389 per family member.
| Income Bracket | # Families | Median Income |
| 2-Person Families | 155 (61.8%) | $0 |
| 3-Person Families | 22 (8.8%) | $64,167 |
| 4-Person Families | 29 (11.6%) | $46,838 |
| 5-Person Families | 28 (11.2%) | $0 |
| 6-Person Families | 17 (6.8%) | $0 |
| 7+ Person Families | 0 (0.0%) | $0 |
| Total | 251 (100.0%) | $64,432 |
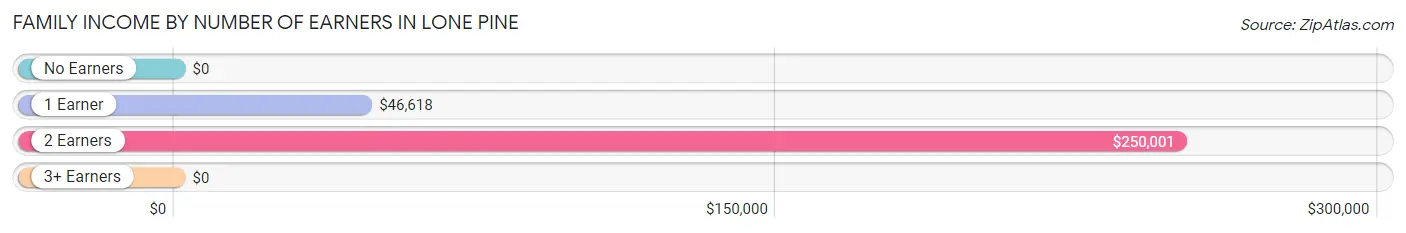
Family Income by Number of Earners in Lone Pine
| Number of Earners | # Families | Median Income |
| No Earners | 89 (35.5%) | $0 |
| 1 Earner | 110 (43.8%) | $46,618 |
| 2 Earners | 51 (20.3%) | $250,001 |
| 3+ Earners | 1 (0.4%) | $0 |
| Total | 251 (100.0%) | $64,432 |
Household Income in Lone Pine
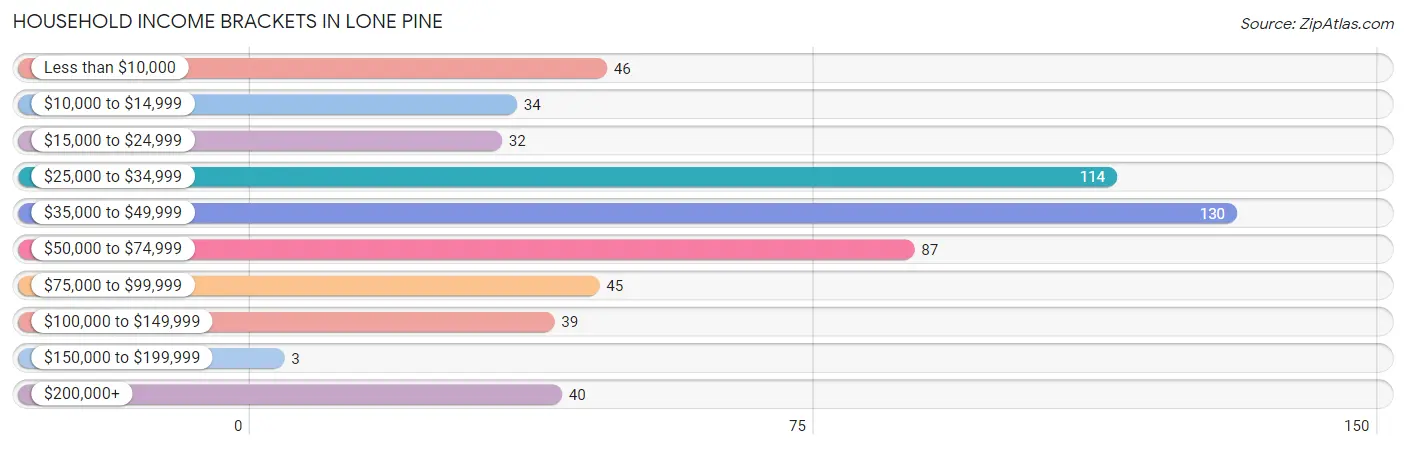
Household Income Brackets in Lone Pine
With 130 households falling in the category, the $35,000 to $49,999 income range is the most frequent in Lone Pine, accounting for 22.8% of all households. In contrast, only 3 households (0.5%) fall into the $150,000 to $199,999 income bracket, making it the least populous group.
| Income Bracket | # Households | % Households |
| Less than $10,000 | 46 | 8.1% |
| $10,000 to $14,999 | 34 | 6.0% |
| $15,000 to $24,999 | 32 | 5.6% |
| $25,000 to $34,999 | 114 | 20.0% |
| $35,000 to $49,999 | 130 | 22.8% |
| $50,000 to $74,999 | 87 | 15.3% |
| $75,000 to $99,999 | 45 | 7.9% |
| $100,000 to $149,999 | 39 | 6.8% |
| $150,000 to $199,999 | 3 | 0.5% |
| $200,000+ | 40 | 7.0% |
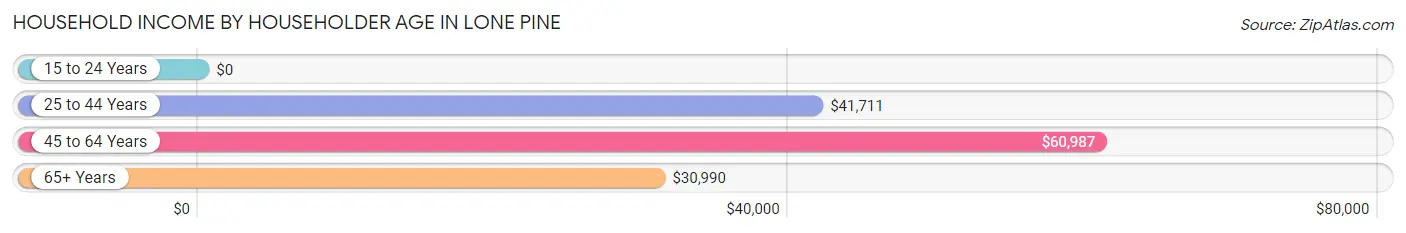
Household Income by Householder Age in Lone Pine
The median household income in Lone Pine is $39,881, with the highest median household income of $60,987 found in the 45 to 64 years age bracket for the primary householder. A total of 233 households (40.9%) fall into this category.
| Income Bracket | # Households | Median Income |
| 15 to 24 Years | 0 (0.0%) | $0 |
| 25 to 44 Years | 128 (22.5%) | $41,711 |
| 45 to 64 Years | 233 (40.9%) | $60,987 |
| 65+ Years | 209 (36.7%) | $30,990 |
| Total | 570 (100.0%) | $39,881 |
Poverty in Lone Pine
Income Below Poverty by Sex and Age in Lone Pine
With 15.2% poverty level for males and 3.1% for females among the residents of Lone Pine, 35 to 44 year old males and 18 to 24 year old females are the most vulnerable to poverty, with 54 males (44.3%) and 3 females (60.0%) in their respective age groups living below the poverty level.
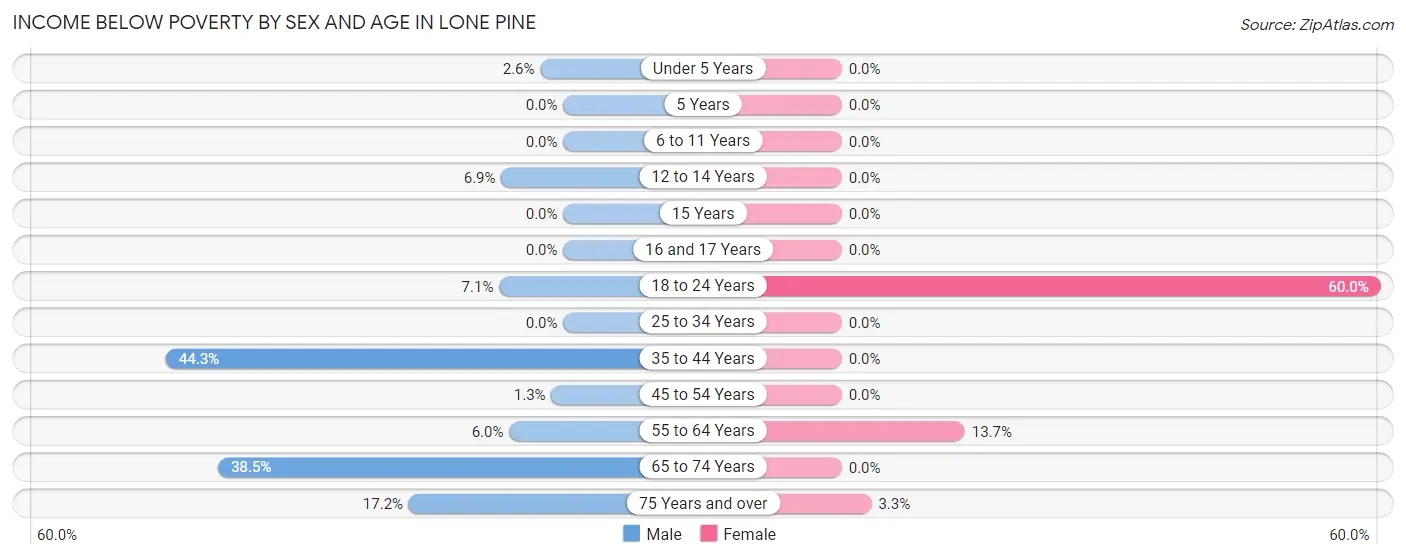
| Age Bracket | Male | Female |
| Under 5 Years | 2 (2.6%) | 0 (0.0%) |
| 5 Years | 0 (0.0%) | 0 (0.0%) |
| 6 to 11 Years | 0 (0.0%) | 0 (0.0%) |
| 12 to 14 Years | 2 (6.9%) | 0 (0.0%) |
| 15 Years | 0 (0.0%) | 0 (0.0%) |
| 16 and 17 Years | 0 (0.0%) | 0 (0.0%) |
| 18 to 24 Years | 1 (7.1%) | 3 (60.0%) |
| 25 to 34 Years | 0 (0.0%) | 0 (0.0%) |
| 35 to 44 Years | 54 (44.3%) | 0 (0.0%) |
| 45 to 54 Years | 1 (1.3%) | 0 (0.0%) |
| 55 to 64 Years | 8 (6.0%) | 10 (13.7%) |
| 65 to 74 Years | 30 (38.5%) | 0 (0.0%) |
| 75 Years and over | 16 (17.2%) | 3 (3.3%) |
| Total | 114 (15.2%) | 16 (3.1%) |
Income Above Poverty by Sex and Age in Lone Pine
According to the poverty statistics in Lone Pine, males aged 6 to 11 years and females aged under 5 years are the age groups that are most secure financially, with 100.0% of males and 100.0% of females in these age groups living above the poverty line.
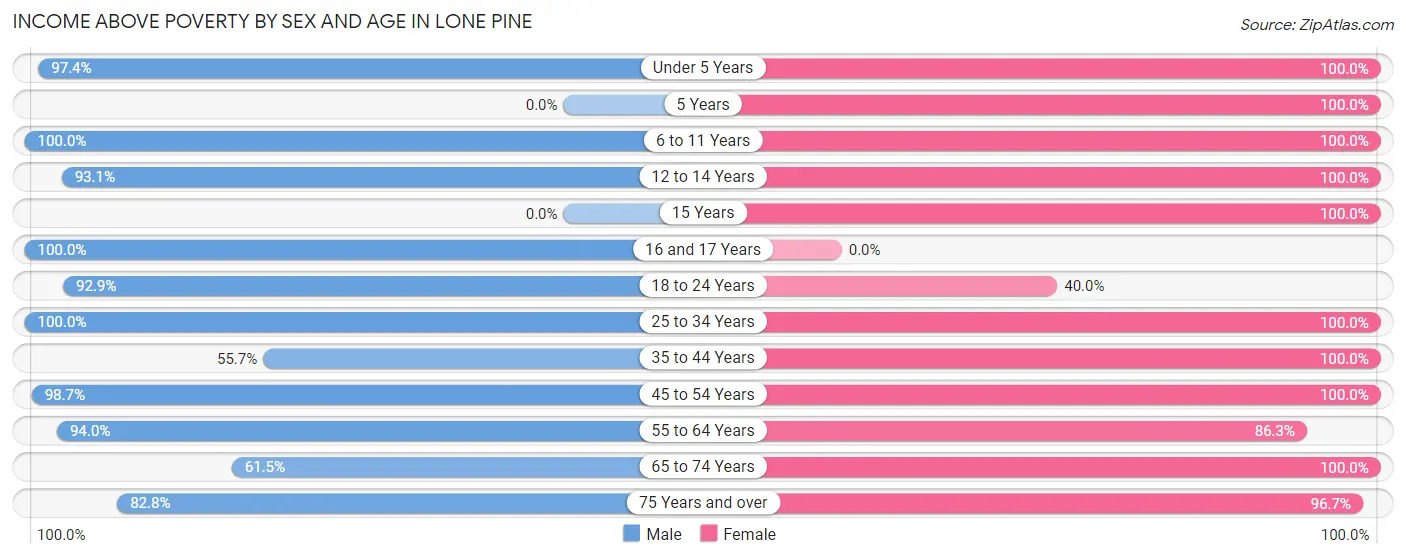
| Age Bracket | Male | Female |
| Under 5 Years | 76 (97.4%) | 61 (100.0%) |
| 5 Years | 0 (0.0%) | 30 (100.0%) |
| 6 to 11 Years | 56 (100.0%) | 43 (100.0%) |
| 12 to 14 Years | 27 (93.1%) | 50 (100.0%) |
| 15 Years | 0 (0.0%) | 3 (100.0%) |
| 16 and 17 Years | 41 (100.0%) | 0 (0.0%) |
| 18 to 24 Years | 13 (92.9%) | 2 (40.0%) |
| 25 to 34 Years | 32 (100.0%) | 44 (100.0%) |
| 35 to 44 Years | 68 (55.7%) | 29 (100.0%) |
| 45 to 54 Years | 74 (98.7%) | 47 (100.0%) |
| 55 to 64 Years | 125 (94.0%) | 63 (86.3%) |
| 65 to 74 Years | 48 (61.5%) | 42 (100.0%) |
| 75 Years and over | 77 (82.8%) | 88 (96.7%) |
| Total | 637 (84.8%) | 502 (96.9%) |
Income Below Poverty Among Married-Couple Families in Lone Pine
The poverty statistics for married-couple families in Lone Pine show that 5.6% or 12 of the total 215 families live below the poverty line. Families with no children have the highest poverty rate of 8.6%, comprising of 12 families. On the other hand, families with 1 or 2 children have the lowest poverty rate of 0.0%, which includes 0 families.
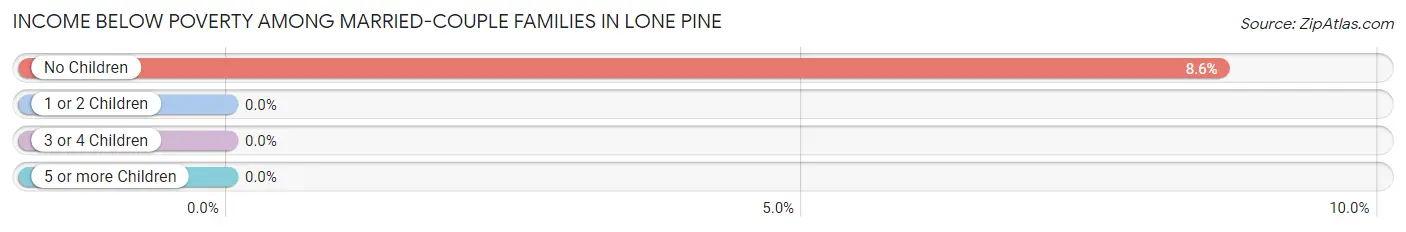
| Children | Above Poverty | Below Poverty |
| No Children | 127 (91.4%) | 12 (8.6%) |
| 1 or 2 Children | 31 (100.0%) | 0 (0.0%) |
| 3 or 4 Children | 45 (100.0%) | 0 (0.0%) |
| 5 or more Children | 0 (0.0%) | 0 (0.0%) |
| Total | 203 (94.4%) | 12 (5.6%) |
Income Below Poverty Among Single-Parent Households in Lone Pine
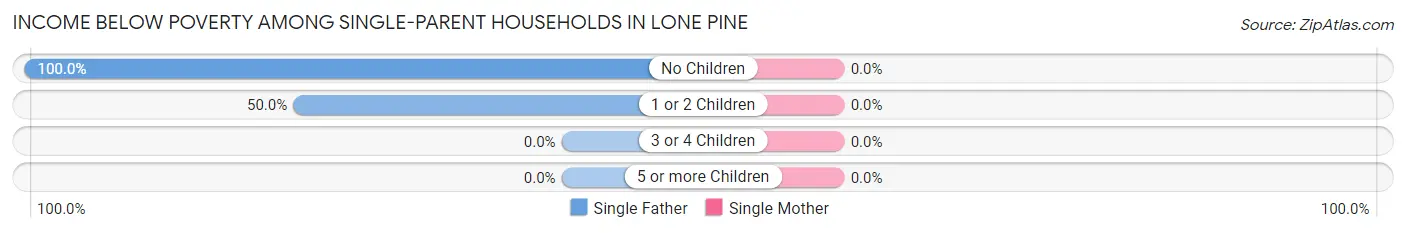
| Children | Single Father | Single Mother |
| No Children | 2 (100.0%) | 0 (0.0%) |
| 1 or 2 Children | 2 (50.0%) | 0 (0.0%) |
| 3 or 4 Children | 0 (0.0%) | 0 (0.0%) |
| 5 or more Children | 0 (0.0%) | 0 (0.0%) |
| Total | 4 (66.7%) | 0 (0.0%) |
Income Below Poverty Among Married-Couple vs Single-Parent Households in Lone Pine
The poverty data for Lone Pine shows that 12 of the married-couple family households (5.6%) and 4 of the single-parent households (11.1%) are living below the poverty level. Within the married-couple family households, those with no children have the highest poverty rate, with 12 households (8.6%) falling below the poverty line. Among the single-parent households, those with no children have the highest poverty rate, with 2 household (28.6%) living below poverty.
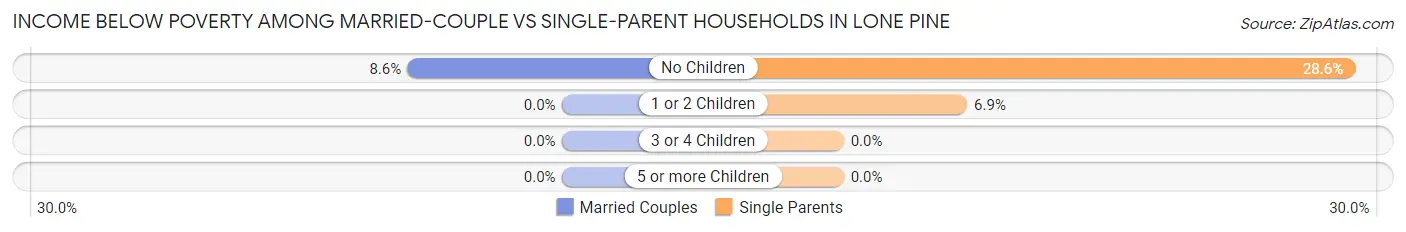
| Children | Married-Couple Families | Single-Parent Households |
| No Children | 12 (8.6%) | 2 (28.6%) |
| 1 or 2 Children | 0 (0.0%) | 2 (6.9%) |
| 3 or 4 Children | 0 (0.0%) | 0 (0.0%) |
| 5 or more Children | 0 (0.0%) | 0 (0.0%) |
| Total | 12 (5.6%) | 4 (11.1%) |
Race in Lone Pine
The most populous races in Lone Pine are White / Caucasian (925 | 69.9%), Hispanic or Latino (457 | 34.5%), and Two or more Races (169 | 12.8%).
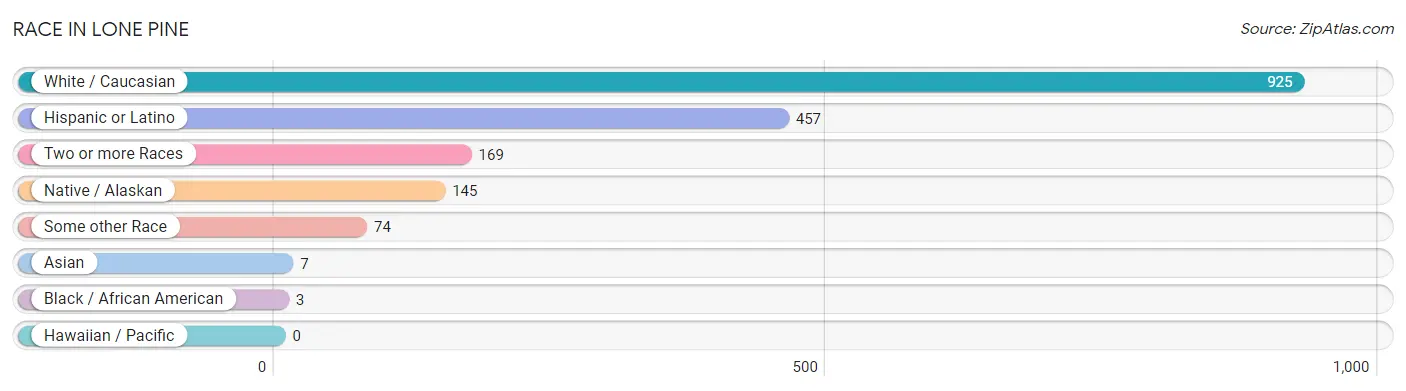
| Race | # Population | % Population |
| Asian | 7 | 0.5% |
| Black / African American | 3 | 0.2% |
| Hawaiian / Pacific | 0 | 0.0% |
| Hispanic or Latino | 457 | 34.5% |
| Native / Alaskan | 145 | 11.0% |
| White / Caucasian | 925 | 69.9% |
| Two or more Races | 169 | 12.8% |
| Some other Race | 74 | 5.6% |
| Total | 1,323 | 100.0% |
Ancestry in Lone Pine
The most populous ancestries reported in Lone Pine are Mexican (379 | 28.6%), German (241 | 18.2%), Danish (118 | 8.9%), English (55 | 4.2%), and Irish (54 | 4.1%), together accounting for 64.0% of all Lone Pine residents.
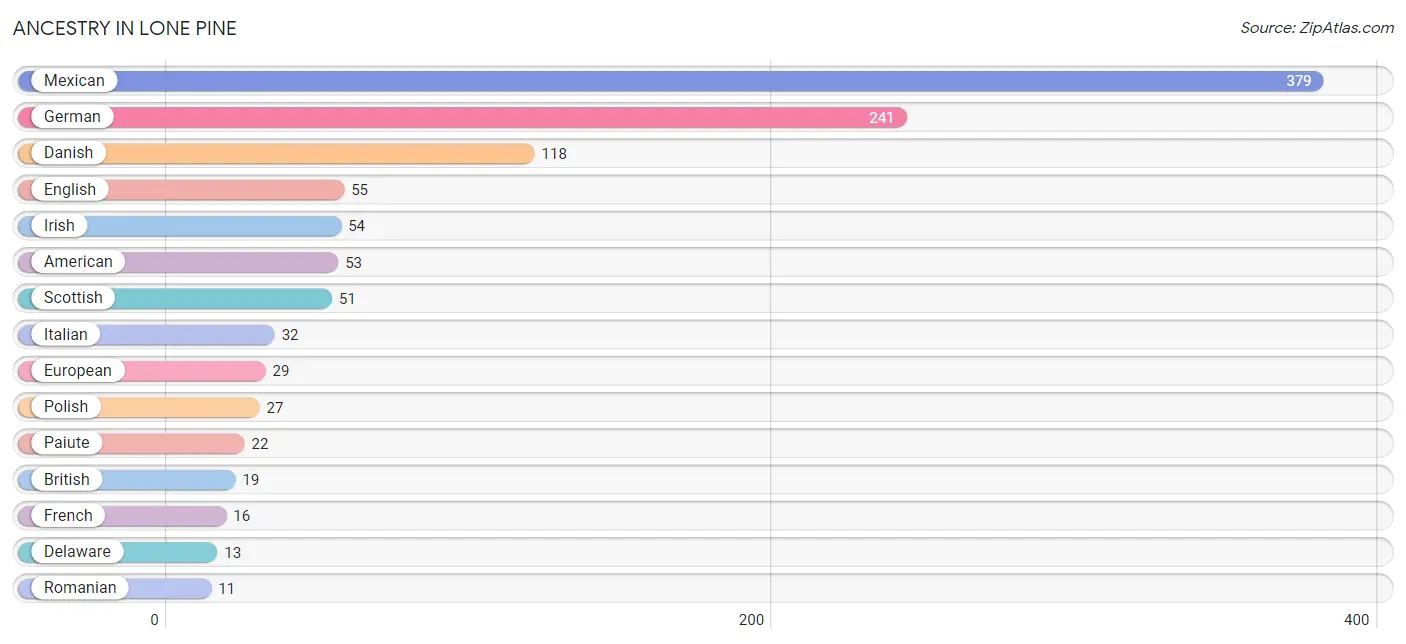
| Ancestry | # Population | % Population |
| American | 53 | 4.0% |
| Austrian | 9 | 0.7% |
| British | 19 | 1.4% |
| Choctaw | 4 | 0.3% |
| Danish | 118 | 8.9% |
| Delaware | 13 | 1.0% |
| Dutch | 4 | 0.3% |
| English | 55 | 4.2% |
| European | 29 | 2.2% |
| French | 16 | 1.2% |
| German | 241 | 18.2% |
| Irish | 54 | 4.1% |
| Italian | 32 | 2.4% |
| Laotian | 4 | 0.3% |
| Lithuanian | 3 | 0.2% |
| Mexican | 379 | 28.6% |
| Navajo | 5 | 0.4% |
| Paiute | 22 | 1.7% |
| Polish | 27 | 2.0% |
| Pueblo | 3 | 0.2% |
| Romanian | 11 | 0.8% |
| Russian | 6 | 0.4% |
| Scandinavian | 1 | 0.1% |
| Scottish | 51 | 3.8% |
| Shoshone | 11 | 0.8% |
| Spanish | 10 | 0.8% |
| Thai | 7 | 0.5% |
| Welsh | 11 | 0.8% | View All 28 Rows |
Immigrants in Lone Pine
The most numerous immigrant groups reported in Lone Pine came from Central America (59 | 4.5%), Latin America (59 | 4.5%), Mexico (59 | 4.5%), Asia (7 | 0.5%), and India (7 | 0.5%), together accounting for 14.4% of all Lone Pine residents.
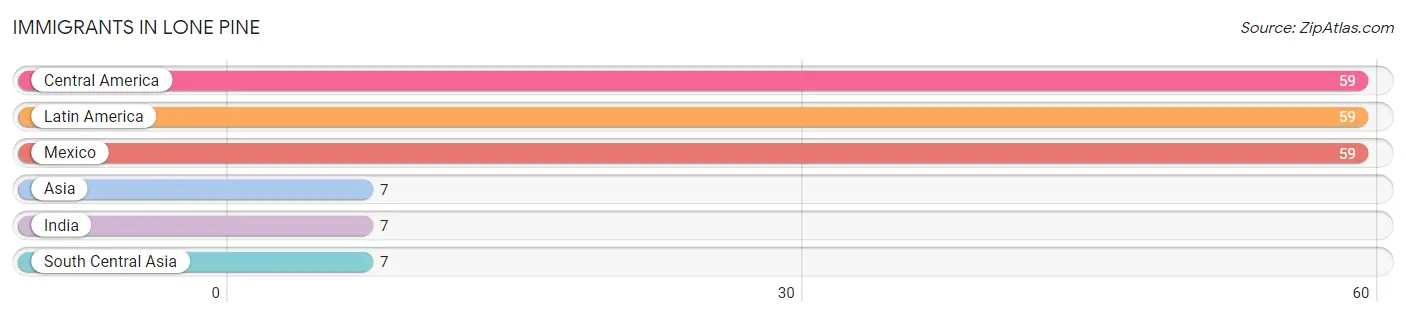
| Immigration Origin | # Population | % Population |
| Asia | 7 | 0.5% |
| Central America | 59 | 4.5% |
| India | 7 | 0.5% |
| Latin America | 59 | 4.5% |
| Mexico | 59 | 4.5% |
| South Central Asia | 7 | 0.5% | View All 6 Rows |
Sex and Age in Lone Pine
Sex and Age in Lone Pine
The most populous age groups in Lone Pine are 60 to 64 Years (129 | 16.6%) for men and 5 to 9 Years (69 | 12.7%) for women.
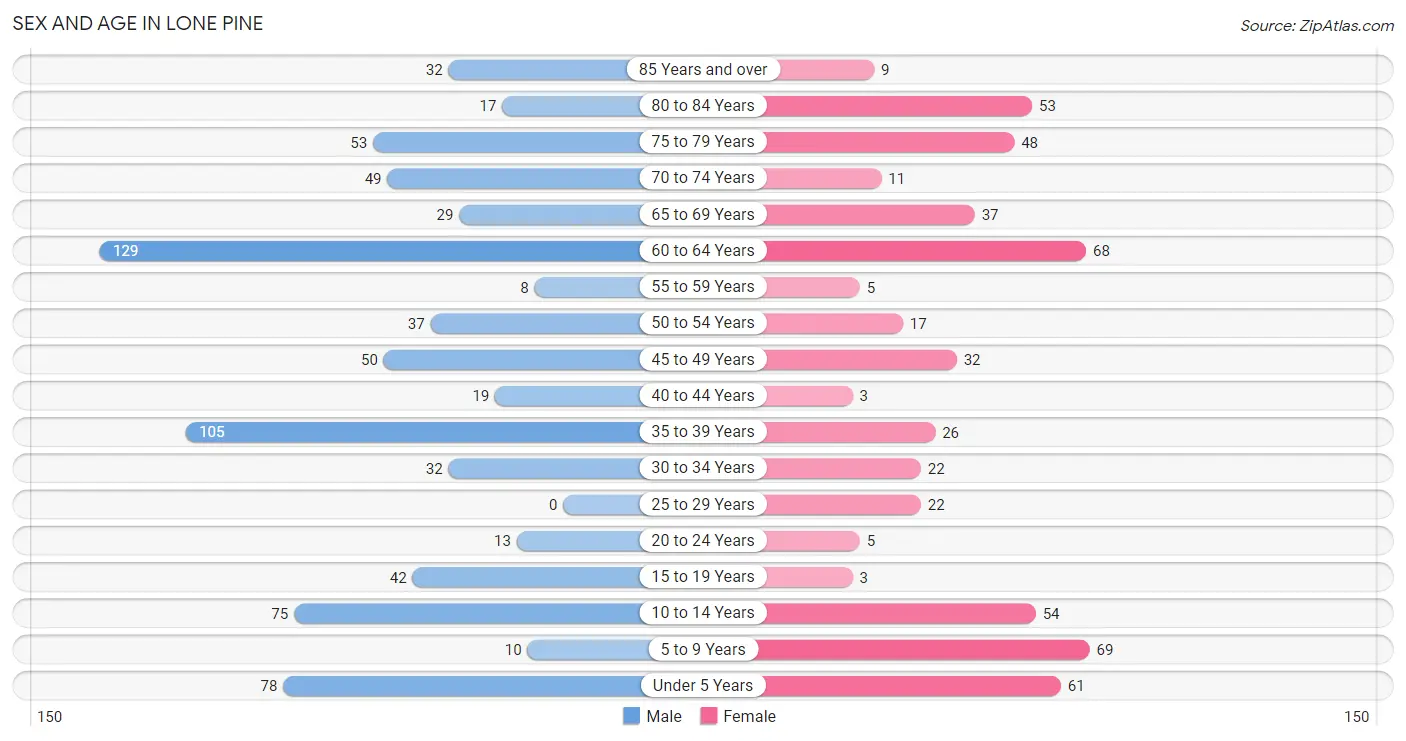
| Age Bracket | Male | Female |
| Under 5 Years | 78 (10.0%) | 61 (11.2%) |
| 5 to 9 Years | 10 (1.3%) | 69 (12.7%) |
| 10 to 14 Years | 75 (9.6%) | 54 (9.9%) |
| 15 to 19 Years | 42 (5.4%) | 3 (0.5%) |
| 20 to 24 Years | 13 (1.7%) | 5 (0.9%) |
| 25 to 29 Years | 0 (0.0%) | 22 (4.0%) |
| 30 to 34 Years | 32 (4.1%) | 22 (4.0%) |
| 35 to 39 Years | 105 (13.5%) | 26 (4.8%) |
| 40 to 44 Years | 19 (2.4%) | 3 (0.5%) |
| 45 to 49 Years | 50 (6.4%) | 32 (5.9%) |
| 50 to 54 Years | 37 (4.8%) | 17 (3.1%) |
| 55 to 59 Years | 8 (1.0%) | 5 (0.9%) |
| 60 to 64 Years | 129 (16.6%) | 68 (12.5%) |
| 65 to 69 Years | 29 (3.7%) | 37 (6.8%) |
| 70 to 74 Years | 49 (6.3%) | 11 (2.0%) |
| 75 to 79 Years | 53 (6.8%) | 48 (8.8%) |
| 80 to 84 Years | 17 (2.2%) | 53 (9.7%) |
| 85 Years and over | 32 (4.1%) | 9 (1.7%) |
| Total | 778 (100.0%) | 545 (100.0%) |
Families and Households in Lone Pine
Median Family Size in Lone Pine
The median family size in Lone Pine is 3.58 persons per family, with single female/mother families (30 | 11.9%) accounting for the largest median family size of 3.9 persons per family. On the other hand, single male/father families (6 | 2.4%) represent the smallest median family size with 3.00 persons per family.
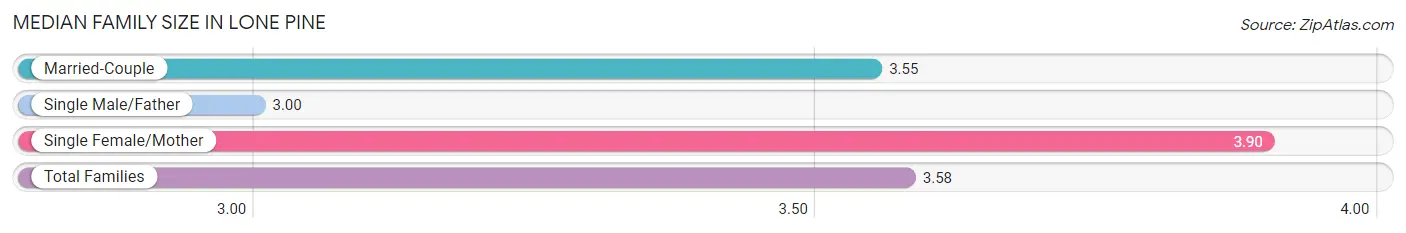
| Family Type | # Families | Family Size |
| Married-Couple | 215 (85.7%) | 3.55 |
| Single Male/Father | 6 (2.4%) | 3.00 |
| Single Female/Mother | 30 (11.9%) | 3.90 |
| Total Families | 251 (100.0%) | 3.58 |
Median Household Size in Lone Pine
The median household size in Lone Pine is 2.23 persons per household, with single female/mother households (30 | 5.3%) accounting for the largest median household size of 4.03 persons per household. non-family households (319 | 56.0%) represent the smallest median household size with 1.13 persons per household.
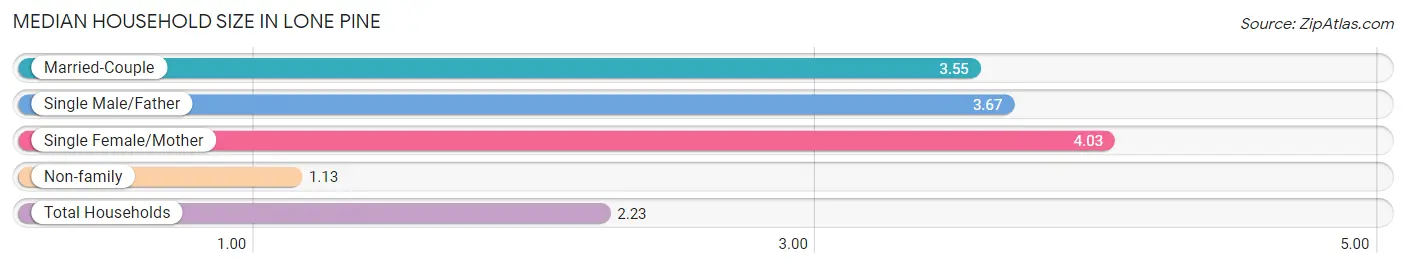
| Household Type | # Households | Household Size |
| Married-Couple | 215 (37.7%) | 3.55 |
| Single Male/Father | 6 (1.1%) | 3.67 |
| Single Female/Mother | 30 (5.3%) | 4.03 |
| Non-family | 319 (56.0%) | 1.13 |
| Total Households | 570 (100.0%) | 2.23 |
Household Size by Marriage Status in Lone Pine
Out of a total of 570 households in Lone Pine, 251 (44.0%) are family households, while 319 (56.0%) are nonfamily households. The most numerous type of family households are 2-person households, comprising 154, and the most common type of nonfamily households are 1-person households, comprising 274.
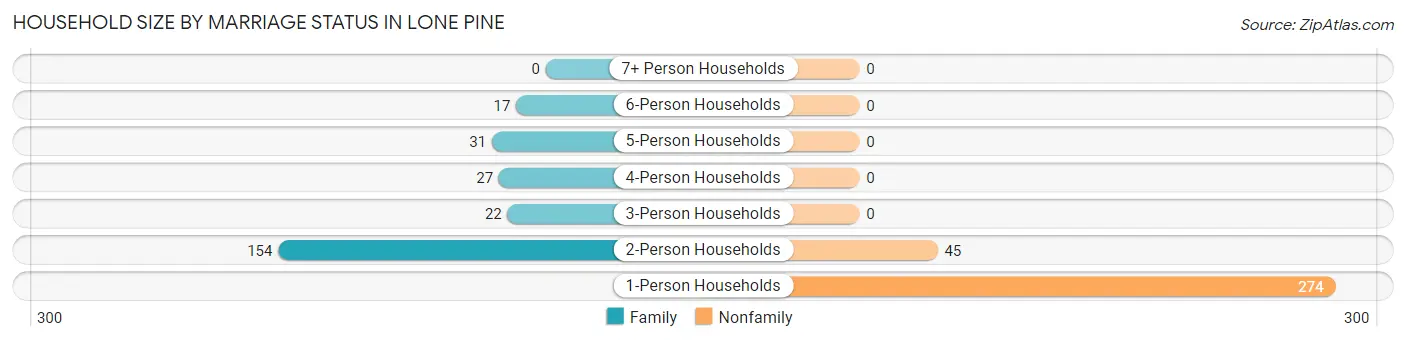
| Household Size | Family Households | Nonfamily Households |
| 1-Person Households | - | 274 (48.1%) |
| 2-Person Households | 154 (27.0%) | 45 (7.9%) |
| 3-Person Households | 22 (3.9%) | 0 (0.0%) |
| 4-Person Households | 27 (4.7%) | 0 (0.0%) |
| 5-Person Households | 31 (5.4%) | 0 (0.0%) |
| 6-Person Households | 17 (3.0%) | 0 (0.0%) |
| 7+ Person Households | 0 (0.0%) | 0 (0.0%) |
| Total | 251 (44.0%) | 319 (56.0%) |
Female Fertility in Lone Pine
Fertility by Age in Lone Pine
| Age Bracket | Women with Births | Births / 1,000 Women |
| 15 to 19 years | 0 (0.0%) | 0.0 |
| 20 to 34 years | 0 (0.0%) | 0.0 |
| 35 to 50 years | 0 (0.0%) | 0.0 |
| Total | 0 (0.0%) | 0.0 |
Fertility by Age by Marriage Status in Lone Pine
| Age Bracket | Married | Unmarried |
| 15 to 19 years | 0 (0.0%) | 0 (0.0%) |
| 20 to 34 years | 0 (0.0%) | 0 (0.0%) |
| 35 to 50 years | 0 (0.0%) | 0 (0.0%) |
| Total | 0 (0.0%) | 0 (0.0%) |
Fertility by Education in Lone Pine
| Educational Attainment | Women with Births | Births / 1,000 Women |
| Less than High School | 0 (0.0%) | 0.0 |
| High School Diploma | 0 (0.0%) | 0.0 |
| College or Associate's Degree | 0 (0.0%) | 0.0 |
| Bachelor's Degree | 0 (0.0%) | 0.0 |
| Graduate Degree | 0 (0.0%) | 0.0 |
| Total | 0 (0.0%) | 0.0 |
Fertility by Education by Marriage Status in Lone Pine
| Educational Attainment | Married | Unmarried |
| Less than High School | 0 (0.0%) | 0 (0.0%) |
| High School Diploma | 0 (0.0%) | 0 (0.0%) |
| College or Associate's Degree | 0 (0.0%) | 0 (0.0%) |
| Bachelor's Degree | 0 (0.0%) | 0 (0.0%) |
| Graduate Degree | 0 (0.0%) | 0 (0.0%) |
| Total | 0 (0.0%) | 0 (0.0%) |
Employment Characteristics in Lone Pine
Employment by Class of Employer in Lone Pine
Among the 348 employed individuals in Lone Pine, private company employees (147 | 42.2%), self-employed (not incorporated) (80 | 23.0%), and local government employees (66 | 19.0%) make up the most common classes of employment.
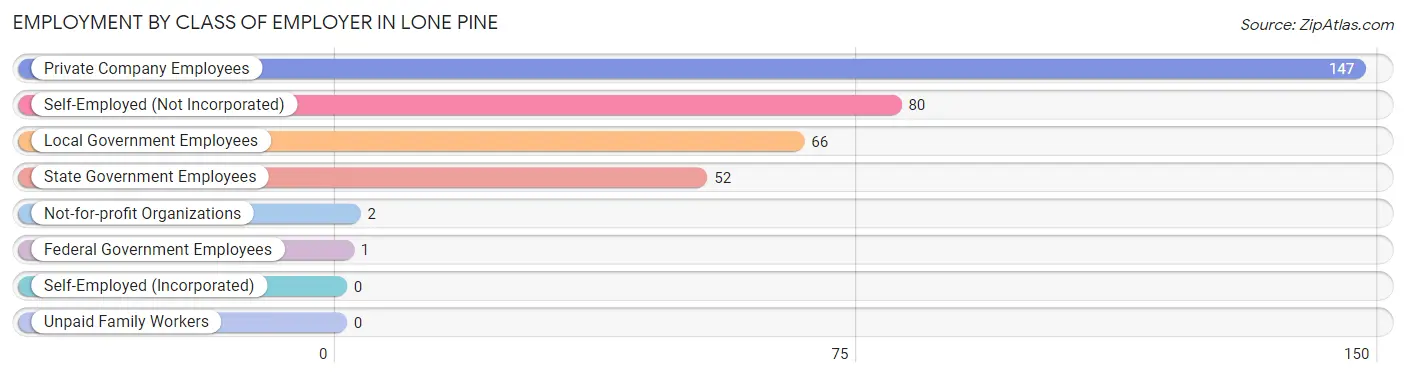
| Employer Class | # Employees | % Employees |
| Private Company Employees | 147 | 42.2% |
| Self-Employed (Incorporated) | 0 | 0.0% |
| Self-Employed (Not Incorporated) | 80 | 23.0% |
| Not-for-profit Organizations | 2 | 0.6% |
| Local Government Employees | 66 | 19.0% |
| State Government Employees | 52 | 14.9% |
| Federal Government Employees | 1 | 0.3% |
| Unpaid Family Workers | 0 | 0.0% |
| Total | 348 | 100.0% |
Employment Status by Age in Lone Pine
According to the labor force statistics for Lone Pine, out of the total population over 16 years of age (973), 38.0% or 370 individuals are in the labor force, with 5.1% or 19 of them unemployed. The age group with the highest labor force participation rate is 25 to 29 years, with 100.0% or 22 individuals in the labor force. Within the labor force, the 60 to 64 years age range has the highest percentage of unemployed individuals, with 24.4% or 10 of them being unemployed.
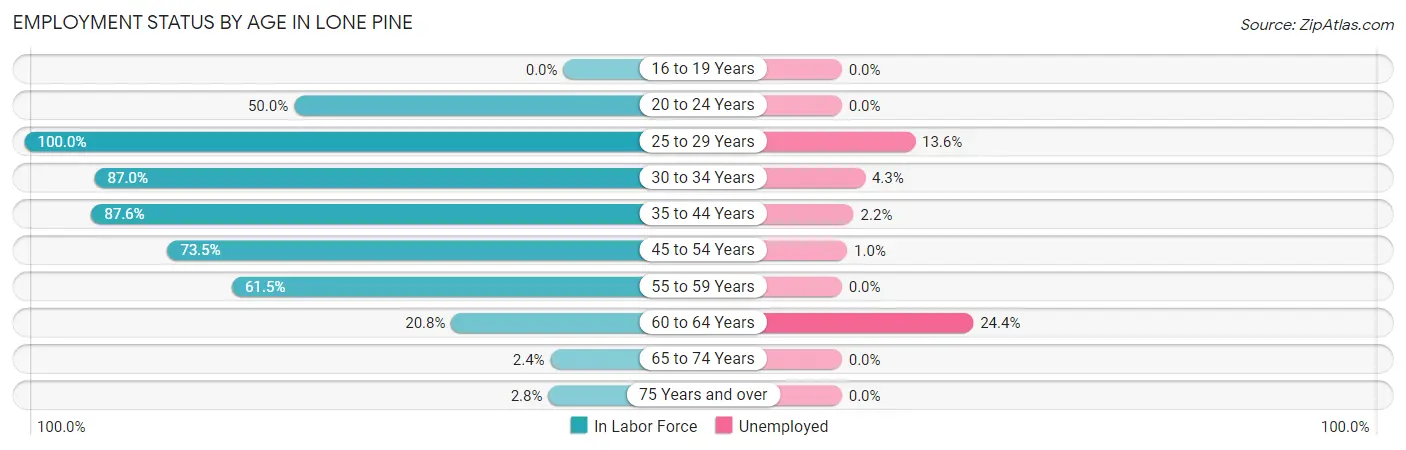
| Age Bracket | In Labor Force | Unemployed |
| 16 to 19 Years | 0 (0.0%) | 0 (0.0%) |
| 20 to 24 Years | 9 (50.0%) | 0 (0.0%) |
| 25 to 29 Years | 22 (100.0%) | 3 (13.6%) |
| 30 to 34 Years | 47 (87.0%) | 2 (4.3%) |
| 35 to 44 Years | 134 (87.6%) | 3 (2.2%) |
| 45 to 54 Years | 100 (73.5%) | 1 (1.0%) |
| 55 to 59 Years | 8 (61.5%) | 0 (0.0%) |
| 60 to 64 Years | 41 (20.8%) | 10 (24.4%) |
| 65 to 74 Years | 3 (2.4%) | 0 (0.0%) |
| 75 Years and over | 6 (2.8%) | 0 (0.0%) |
| Total | 370 (38.0%) | 19 (5.1%) |
Employment Status by Educational Attainment in Lone Pine
According to labor force statistics for Lone Pine, 61.2% of individuals (352) out of the total population between 25 and 64 years of age (575) are in the labor force, with 5.4% or 19 of them being unemployed. The group with the highest labor force participation rate are those with the educational attainment of bachelor's degree or higher, with 81.3% or 130 individuals in the labor force. Within the labor force, individuals with college / associate degree education have the highest percentage of unemployment, with 12.7% or 14 of them being unemployed.
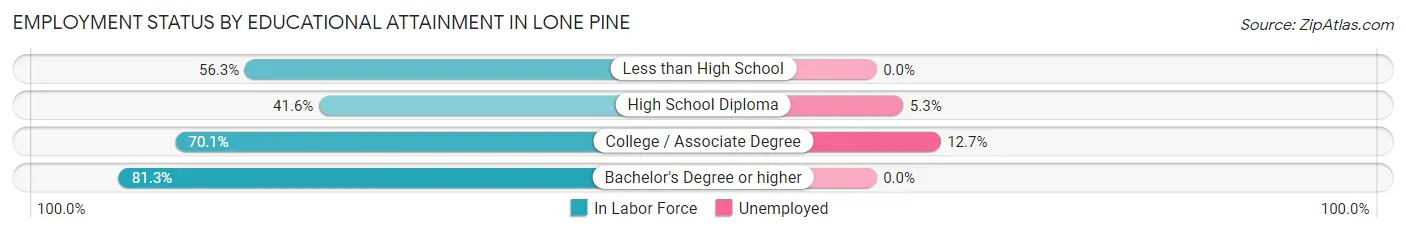
| Educational Attainment | In Labor Force | Unemployed |
| Less than High School | 18 (56.3%) | 0 (0.0%) |
| High School Diploma | 94 (41.6%) | 12 (5.3%) |
| College / Associate Degree | 110 (70.1%) | 20 (12.7%) |
| Bachelor's Degree or higher | 130 (81.3%) | 0 (0.0%) |
| Total | 352 (61.2%) | 31 (5.4%) |
Employment Occupations by Sex in Lone Pine
Management, Business, Science and Arts Occupations
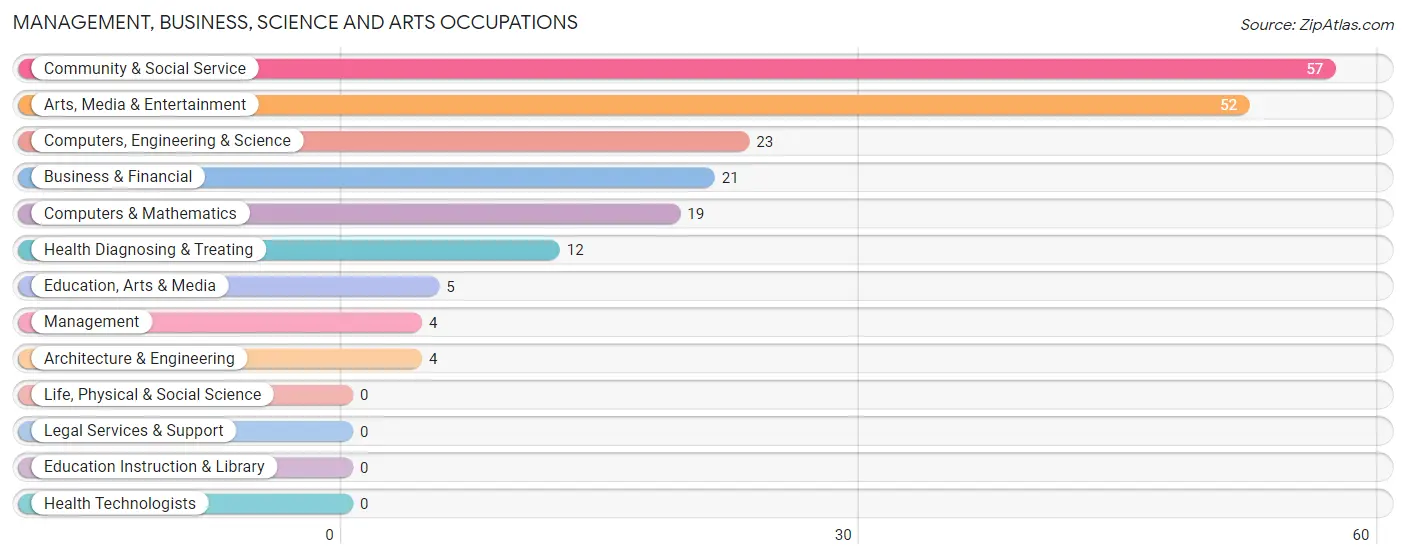
The most common Management, Business, Science and Arts occupations in Lone Pine are Community & Social Service (57 | 16.2%), Arts, Media & Entertainment (52 | 14.8%), Computers, Engineering & Science (23 | 6.6%), Business & Financial (21 | 6.0%), and Computers & Mathematics (19 | 5.4%).
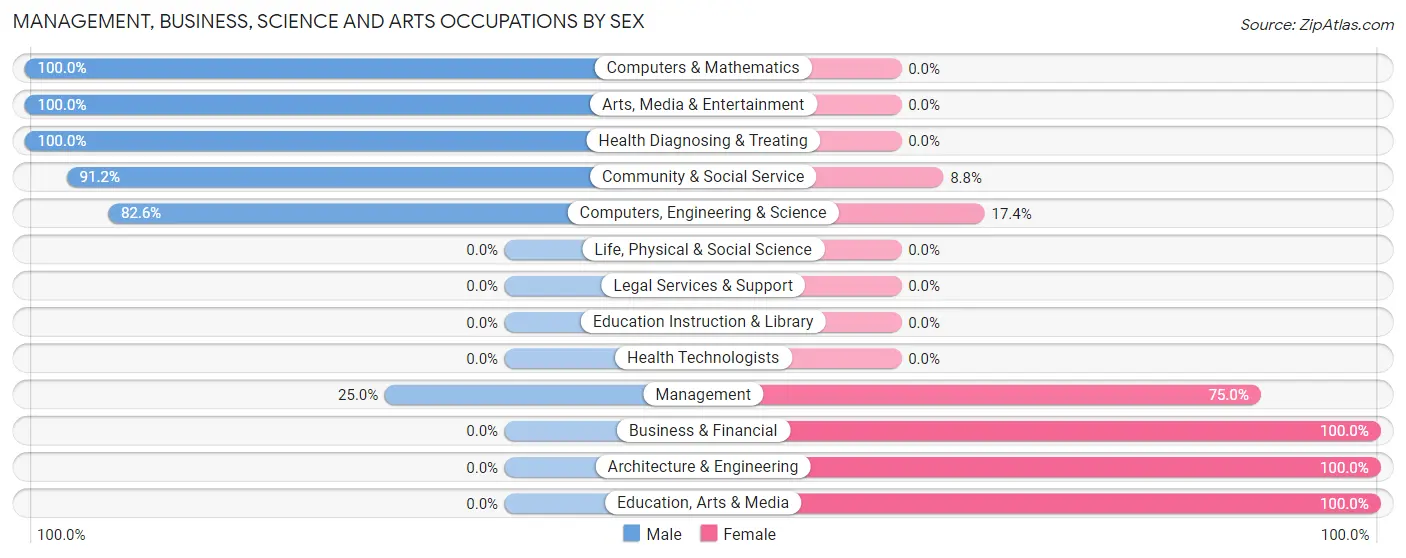
Management, Business, Science and Arts Occupations by Sex
Within the Management, Business, Science and Arts occupations in Lone Pine, the most male-oriented occupations are Computers & Mathematics (100.0%), Arts, Media & Entertainment (100.0%), and Health Diagnosing & Treating (100.0%), while the most female-oriented occupations are Business & Financial (100.0%), Architecture & Engineering (100.0%), and Education, Arts & Media (100.0%).
| Occupation | Male | Female |
| Management | 1 (25.0%) | 3 (75.0%) |
| Business & Financial | 0 (0.0%) | 21 (100.0%) |
| Computers, Engineering & Science | 19 (82.6%) | 4 (17.4%) |
| Computers & Mathematics | 19 (100.0%) | 0 (0.0%) |
| Architecture & Engineering | 0 (0.0%) | 4 (100.0%) |
| Life, Physical & Social Science | 0 (0.0%) | 0 (0.0%) |
| Community & Social Service | 52 (91.2%) | 5 (8.8%) |
| Education, Arts & Media | 0 (0.0%) | 5 (100.0%) |
| Legal Services & Support | 0 (0.0%) | 0 (0.0%) |
| Education Instruction & Library | 0 (0.0%) | 0 (0.0%) |
| Arts, Media & Entertainment | 52 (100.0%) | 0 (0.0%) |
| Health Diagnosing & Treating | 12 (100.0%) | 0 (0.0%) |
| Health Technologists | 0 (0.0%) | 0 (0.0%) |
| Total (Category) | 84 (71.8%) | 33 (28.2%) |
| Total (Overall) | 244 (69.5%) | 107 (30.5%) |
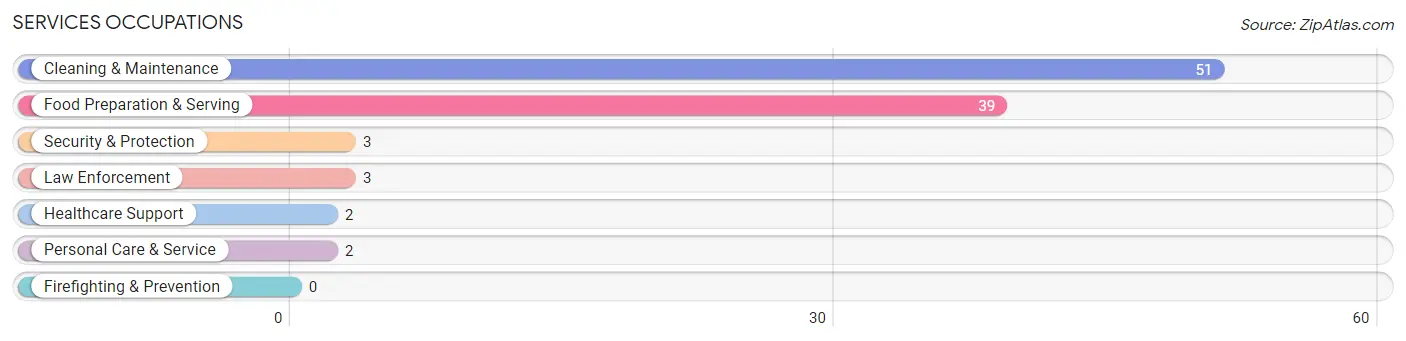
Services Occupations
The most common Services occupations in Lone Pine are Cleaning & Maintenance (51 | 14.5%), Food Preparation & Serving (39 | 11.1%), Security & Protection (3 | 0.9%), Law Enforcement (3 | 0.9%), and Healthcare Support (2 | 0.6%).
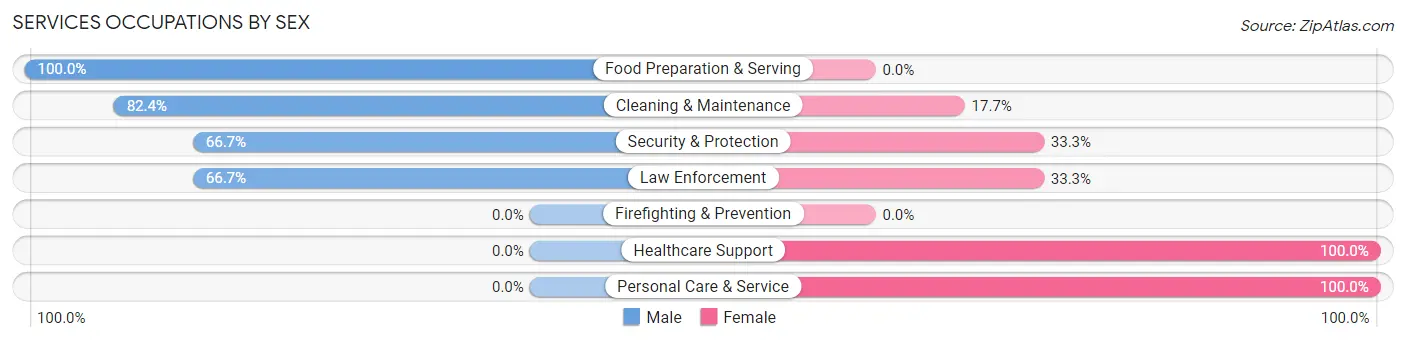
Services Occupations by Sex
Within the Services occupations in Lone Pine, the most male-oriented occupations are Food Preparation & Serving (100.0%), Cleaning & Maintenance (82.4%), and Security & Protection (66.7%), while the most female-oriented occupations are Healthcare Support (100.0%), Personal Care & Service (100.0%), and Security & Protection (33.3%).
| Occupation | Male | Female |
| Healthcare Support | 0 (0.0%) | 2 (100.0%) |
| Security & Protection | 2 (66.7%) | 1 (33.3%) |
| Firefighting & Prevention | 0 (0.0%) | 0 (0.0%) |
| Law Enforcement | 2 (66.7%) | 1 (33.3%) |
| Food Preparation & Serving | 39 (100.0%) | 0 (0.0%) |
| Cleaning & Maintenance | 42 (82.4%) | 9 (17.6%) |
| Personal Care & Service | 0 (0.0%) | 2 (100.0%) |
| Total (Category) | 83 (85.6%) | 14 (14.4%) |
| Total (Overall) | 244 (69.5%) | 107 (30.5%) |
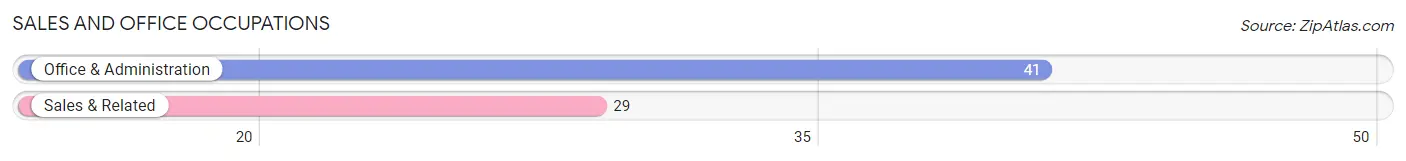
Sales and Office Occupations
The most common Sales and Office occupations in Lone Pine are Office & Administration (41 | 11.7%), and Sales & Related (29 | 8.3%).
Sales and Office Occupations by Sex
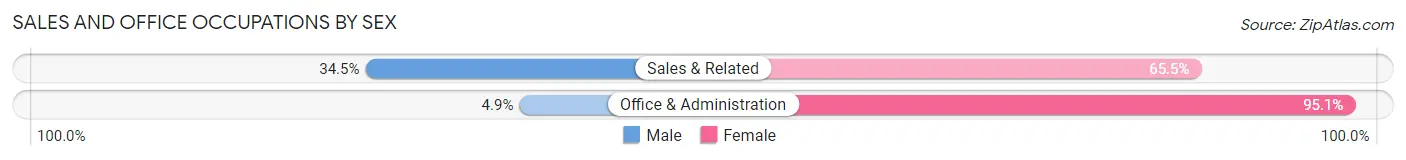
| Occupation | Male | Female |
| Sales & Related | 10 (34.5%) | 19 (65.5%) |
| Office & Administration | 2 (4.9%) | 39 (95.1%) |
| Total (Category) | 12 (17.1%) | 58 (82.9%) |
| Total (Overall) | 244 (69.5%) | 107 (30.5%) |
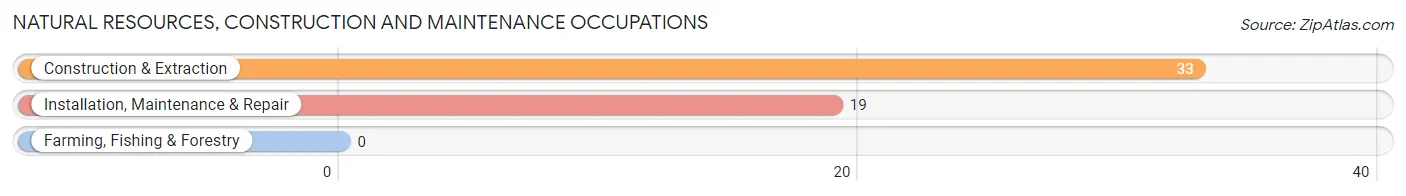
Natural Resources, Construction and Maintenance Occupations
The most common Natural Resources, Construction and Maintenance occupations in Lone Pine are Construction & Extraction (33 | 9.4%), and Installation, Maintenance & Repair (19 | 5.4%).
Natural Resources, Construction and Maintenance Occupations by Sex
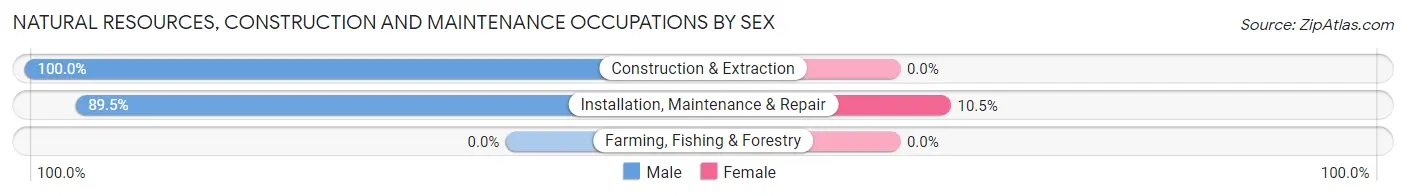
| Occupation | Male | Female |
| Farming, Fishing & Forestry | 0 (0.0%) | 0 (0.0%) |
| Construction & Extraction | 33 (100.0%) | 0 (0.0%) |
| Installation, Maintenance & Repair | 17 (89.5%) | 2 (10.5%) |
| Total (Category) | 50 (96.2%) | 2 (3.8%) |
| Total (Overall) | 244 (69.5%) | 107 (30.5%) |
Production, Transportation and Moving Occupations
The most common Production, Transportation and Moving occupations in Lone Pine are Transportation (13 | 3.7%), and Production (2 | 0.6%).
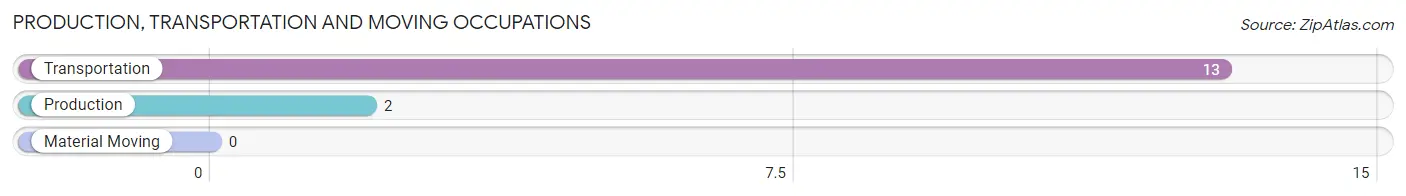
Production, Transportation and Moving Occupations by Sex
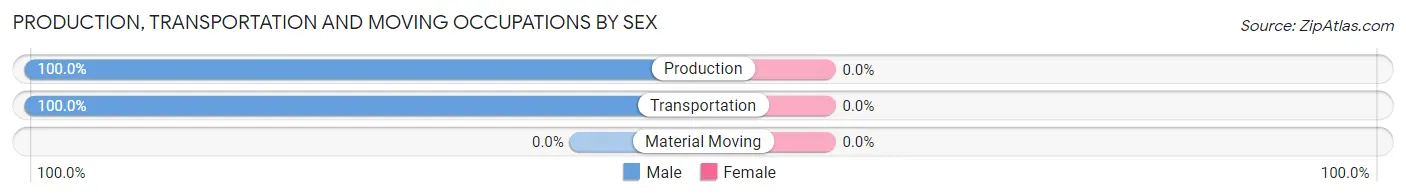
| Occupation | Male | Female |
| Production | 2 (100.0%) | 0 (0.0%) |
| Transportation | 13 (100.0%) | 0 (0.0%) |
| Material Moving | 0 (0.0%) | 0 (0.0%) |
| Total (Category) | 15 (100.0%) | 0 (0.0%) |
| Total (Overall) | 244 (69.5%) | 107 (30.5%) |
Employment Industries by Sex in Lone Pine
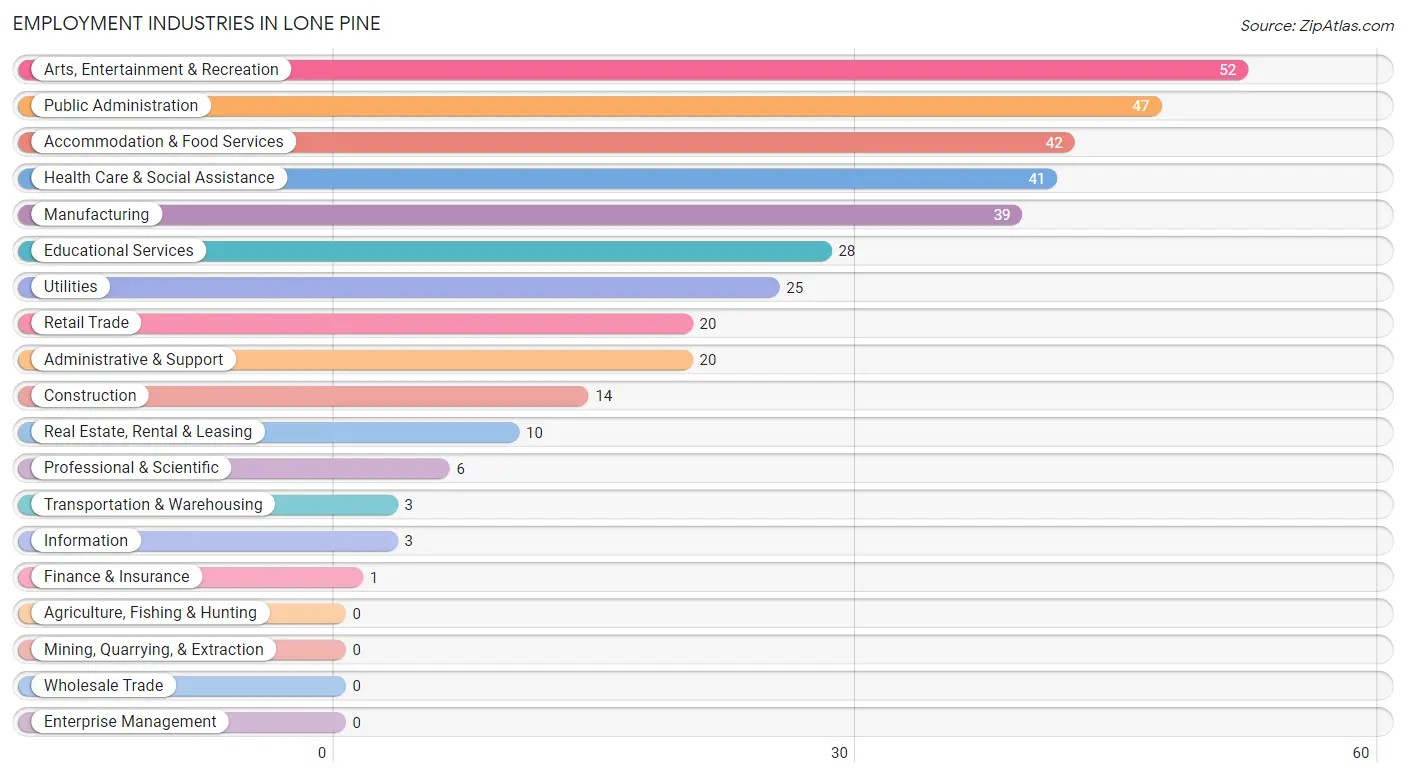
Employment Industries in Lone Pine
The major employment industries in Lone Pine include Arts, Entertainment & Recreation (52 | 14.8%), Public Administration (47 | 13.4%), Accommodation & Food Services (42 | 12.0%), Health Care & Social Assistance (41 | 11.7%), and Manufacturing (39 | 11.1%).
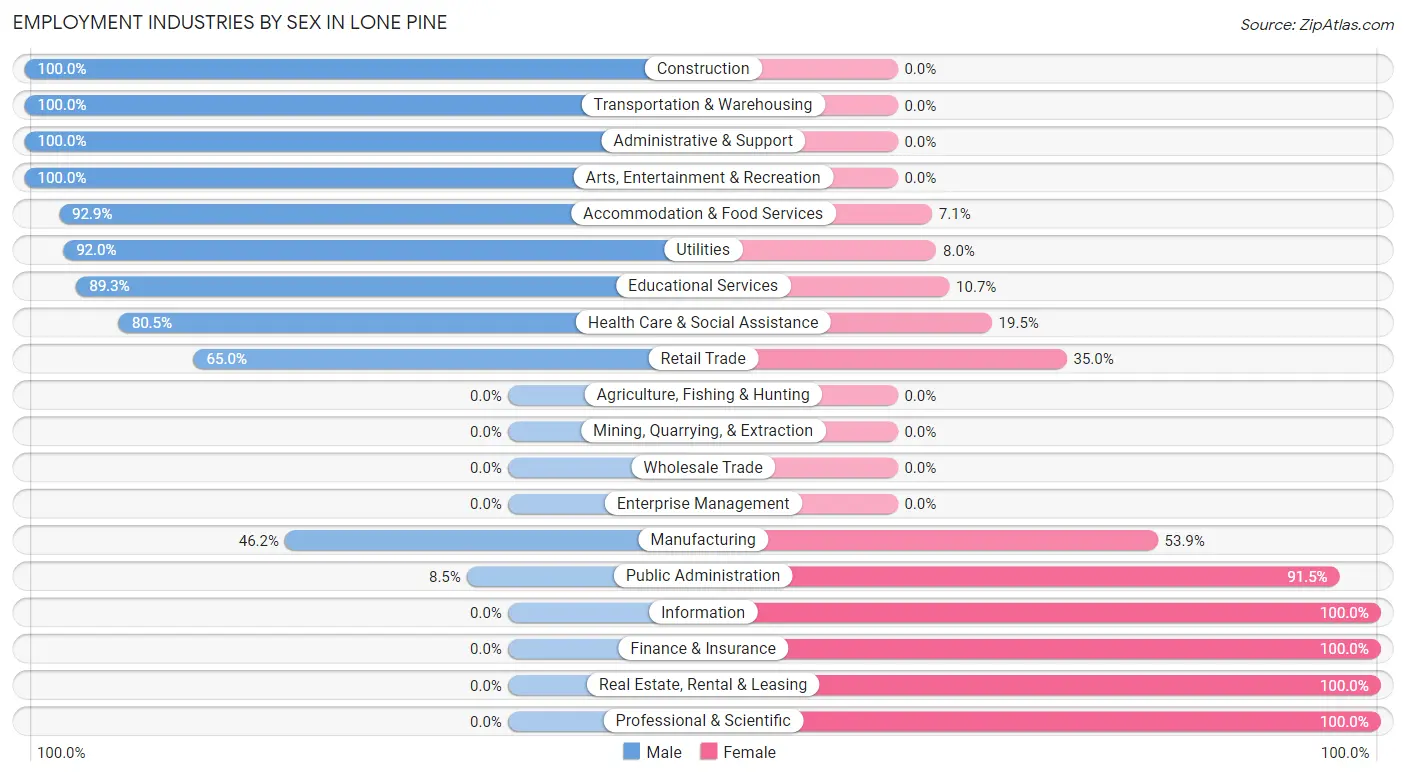
Employment Industries by Sex in Lone Pine
The Lone Pine industries that see more men than women are Construction (100.0%), Transportation & Warehousing (100.0%), and Administrative & Support (100.0%), whereas the industries that tend to have a higher number of women are Information (100.0%), Finance & Insurance (100.0%), and Real Estate, Rental & Leasing (100.0%).
| Industry | Male | Female |
| Agriculture, Fishing & Hunting | 0 (0.0%) | 0 (0.0%) |
| Mining, Quarrying, & Extraction | 0 (0.0%) | 0 (0.0%) |
| Construction | 14 (100.0%) | 0 (0.0%) |
| Manufacturing | 18 (46.2%) | 21 (53.8%) |
| Wholesale Trade | 0 (0.0%) | 0 (0.0%) |
| Retail Trade | 13 (65.0%) | 7 (35.0%) |
| Transportation & Warehousing | 3 (100.0%) | 0 (0.0%) |
| Utilities | 23 (92.0%) | 2 (8.0%) |
| Information | 0 (0.0%) | 3 (100.0%) |
| Finance & Insurance | 0 (0.0%) | 1 (100.0%) |
| Real Estate, Rental & Leasing | 0 (0.0%) | 10 (100.0%) |
| Professional & Scientific | 0 (0.0%) | 6 (100.0%) |
| Enterprise Management | 0 (0.0%) | 0 (0.0%) |
| Administrative & Support | 20 (100.0%) | 0 (0.0%) |
| Educational Services | 25 (89.3%) | 3 (10.7%) |
| Health Care & Social Assistance | 33 (80.5%) | 8 (19.5%) |
| Arts, Entertainment & Recreation | 52 (100.0%) | 0 (0.0%) |
| Accommodation & Food Services | 39 (92.9%) | 3 (7.1%) |
| Public Administration | 4 (8.5%) | 43 (91.5%) |
| Total | 244 (69.5%) | 107 (30.5%) |
Education in Lone Pine
School Enrollment in Lone Pine
The most common levels of schooling among the 225 students in Lone Pine are middle school (81 | 36.0%), high school (71 | 31.6%), and elementary school (58 | 25.8%).
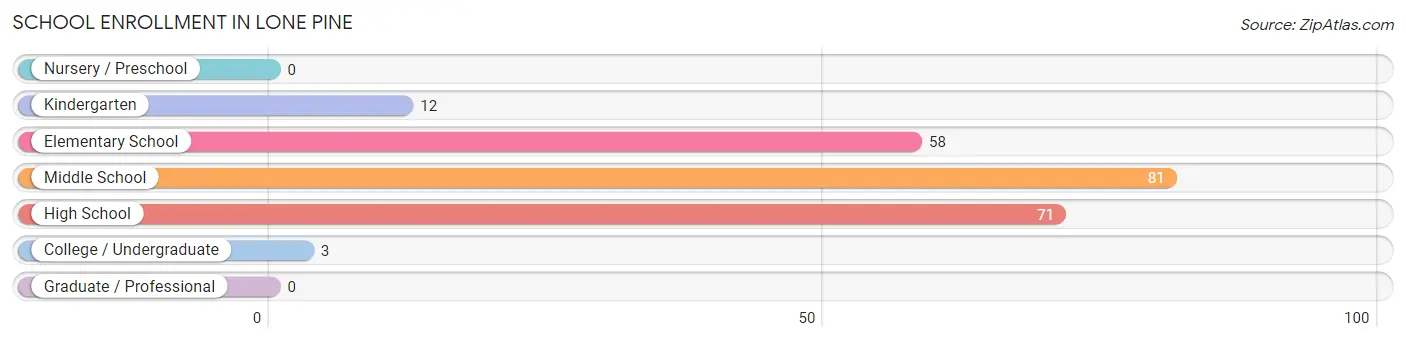
| School Level | # Students | % Students |
| Nursery / Preschool | 0 | 0.0% |
| Kindergarten | 12 | 5.3% |
| Elementary School | 58 | 25.8% |
| Middle School | 81 | 36.0% |
| High School | 71 | 31.6% |
| College / Undergraduate | 3 | 1.3% |
| Graduate / Professional | 0 | 0.0% |
| Total | 225 | 100.0% |
School Enrollment by Age by Funding Source in Lone Pine
Out of a total of 225 students who are enrolled in schools in Lone Pine, 51 (22.7%) attend a private institution, while the remaining 174 (77.3%) are enrolled in public schools. The age group of 10 to 14 year olds has the highest likelihood of being enrolled in private schools, with 51 (39.5% in the age bracket) enrolled. Conversely, the age group of 5 to 9 year old has the lowest likelihood of being enrolled in a private school, with 49 (100.0% in the age bracket) attending a public institution.
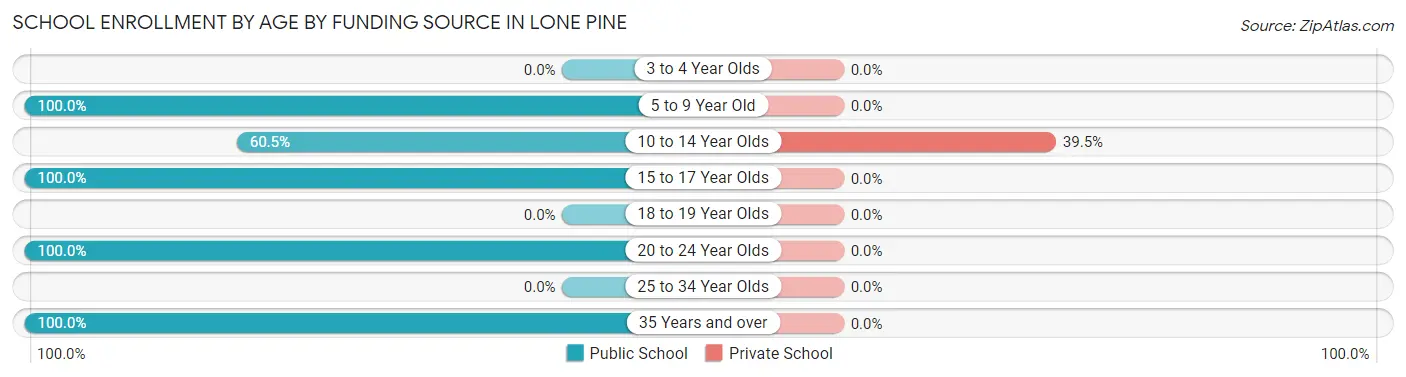
| Age Bracket | Public School | Private School |
| 3 to 4 Year Olds | 0 (0.0%) | 0 (0.0%) |
| 5 to 9 Year Old | 49 (100.0%) | 0 (0.0%) |
| 10 to 14 Year Olds | 78 (60.5%) | 51 (39.5%) |
| 15 to 17 Year Olds | 44 (100.0%) | 0 (0.0%) |
| 18 to 19 Year Olds | 0 (0.0%) | 0 (0.0%) |
| 20 to 24 Year Olds | 1 (100.0%) | 0 (0.0%) |
| 25 to 34 Year Olds | 0 (0.0%) | 0 (0.0%) |
| 35 Years and over | 2 (100.0%) | 0 (0.0%) |
| Total | 174 (77.3%) | 51 (22.7%) |
Educational Attainment by Field of Study in Lone Pine
Social sciences (55 | 26.7%), business (45 | 21.8%), visual & performing arts (29 | 14.1%), bio, nature & agricultural (26 | 12.6%), and literature & languages (19 | 9.2%) are the most common fields of study among 206 individuals in Lone Pine who have obtained a bachelor's degree or higher.
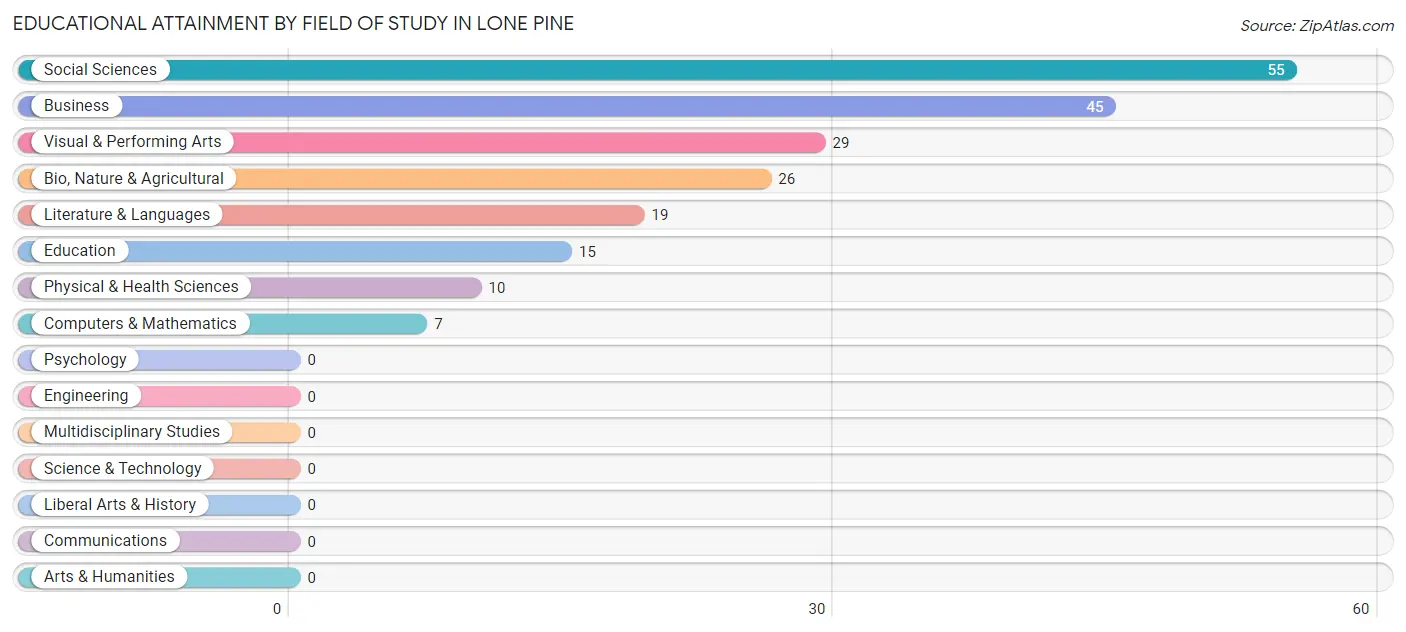
| Field of Study | # Graduates | % Graduates |
| Computers & Mathematics | 7 | 3.4% |
| Bio, Nature & Agricultural | 26 | 12.6% |
| Physical & Health Sciences | 10 | 4.9% |
| Psychology | 0 | 0.0% |
| Social Sciences | 55 | 26.7% |
| Engineering | 0 | 0.0% |
| Multidisciplinary Studies | 0 | 0.0% |
| Science & Technology | 0 | 0.0% |
| Business | 45 | 21.8% |
| Education | 15 | 7.3% |
| Literature & Languages | 19 | 9.2% |
| Liberal Arts & History | 0 | 0.0% |
| Visual & Performing Arts | 29 | 14.1% |
| Communications | 0 | 0.0% |
| Arts & Humanities | 0 | 0.0% |
| Total | 206 | 100.0% |
Transportation & Commute in Lone Pine
Vehicle Availability by Sex in Lone Pine
The most prevalent vehicle ownership categories in Lone Pine are males with 1 vehicle (113, accounting for 46.9%) and females with 1 vehicle (36, making up 105.6%).
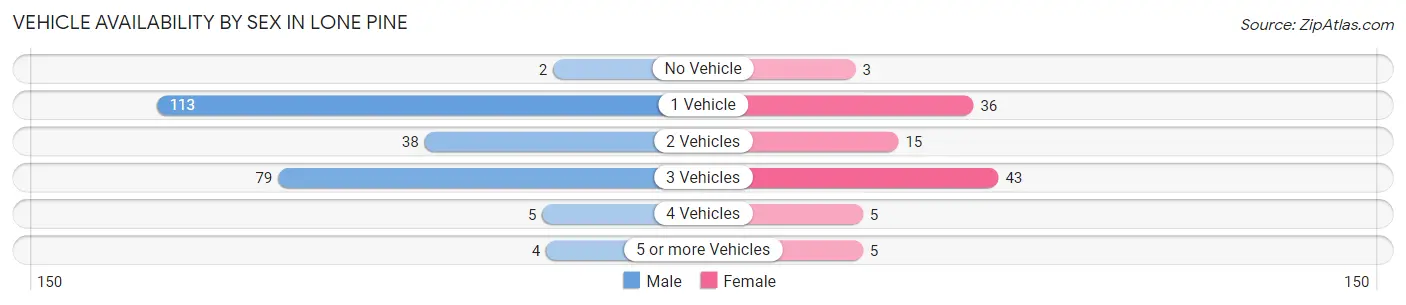
| Vehicles Available | Male | Female |
| No Vehicle | 2 (0.8%) | 3 (2.8%) |
| 1 Vehicle | 113 (46.9%) | 36 (33.6%) |
| 2 Vehicles | 38 (15.8%) | 15 (14.0%) |
| 3 Vehicles | 79 (32.8%) | 43 (40.2%) |
| 4 Vehicles | 5 (2.1%) | 5 (4.7%) |
| 5 or more Vehicles | 4 (1.7%) | 5 (4.7%) |
| Total | 241 (100.0%) | 107 (100.0%) |
Commute Time in Lone Pine
The most frequently occuring commute durations in Lone Pine are 5 to 9 minutes (96 commuters, 28.0%), 15 to 19 minutes (81 commuters, 23.6%), and less than 5 minutes (64 commuters, 18.7%).
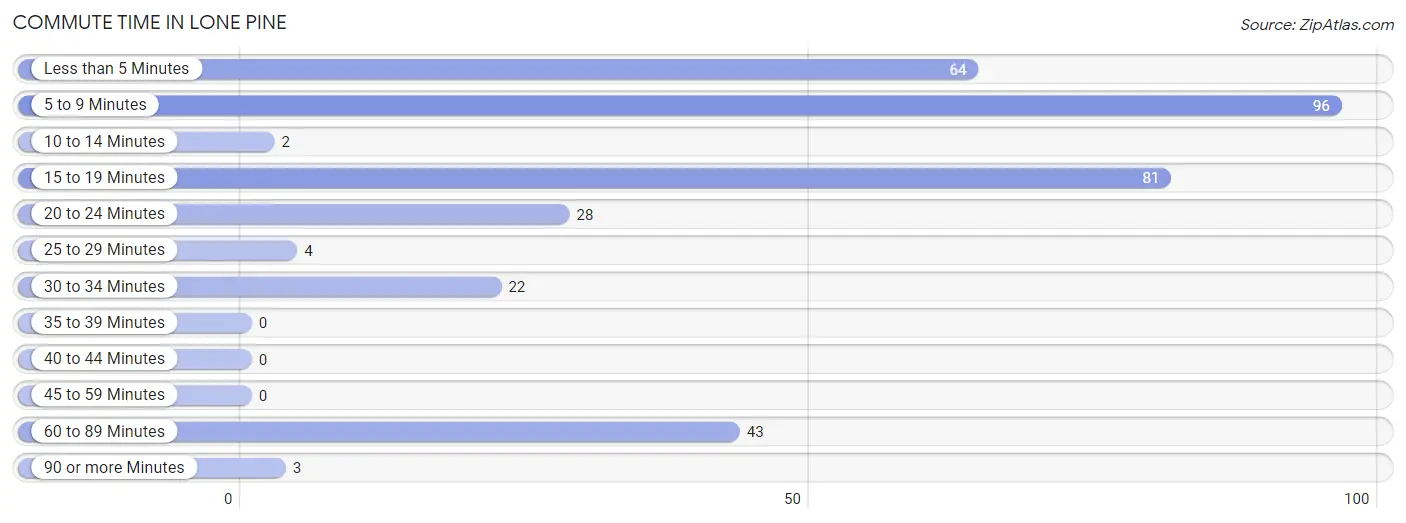
| Commute Time | # Commuters | % Commuters |
| Less than 5 Minutes | 64 | 18.7% |
| 5 to 9 Minutes | 96 | 28.0% |
| 10 to 14 Minutes | 2 | 0.6% |
| 15 to 19 Minutes | 81 | 23.6% |
| 20 to 24 Minutes | 28 | 8.2% |
| 25 to 29 Minutes | 4 | 1.2% |
| 30 to 34 Minutes | 22 | 6.4% |
| 35 to 39 Minutes | 0 | 0.0% |
| 40 to 44 Minutes | 0 | 0.0% |
| 45 to 59 Minutes | 0 | 0.0% |
| 60 to 89 Minutes | 43 | 12.5% |
| 90 or more Minutes | 3 | 0.9% |
Commute Time by Sex in Lone Pine
The most common commute times in Lone Pine are 5 to 9 minutes (81 commuters, 33.8%) for males and 60 to 89 minutes (35 commuters, 34.0%) for females.
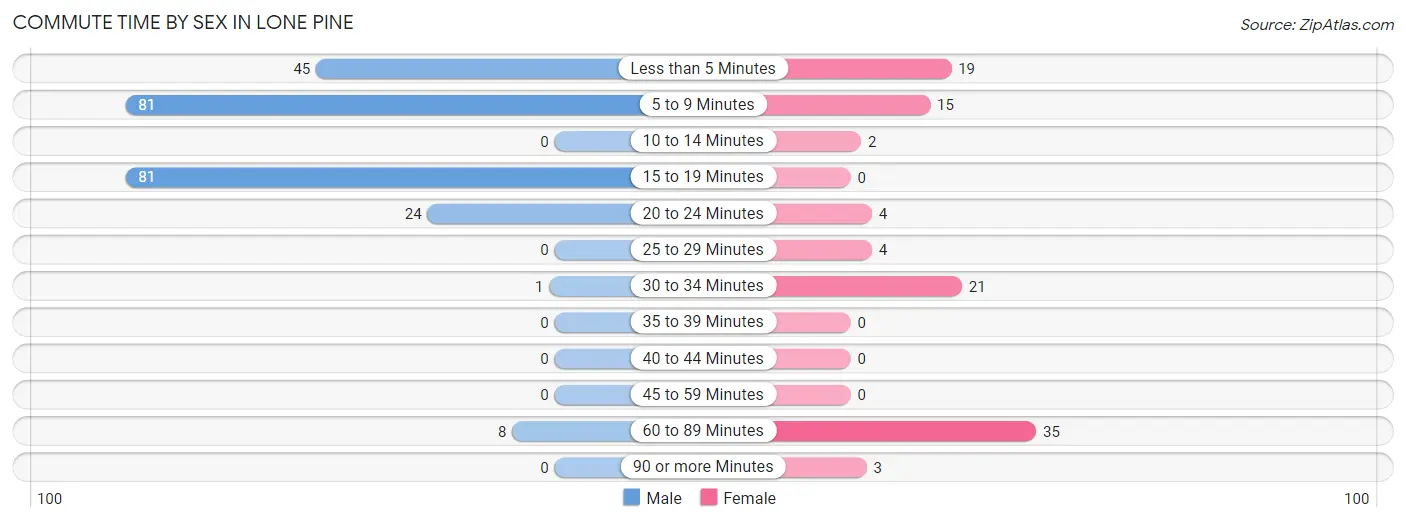
| Commute Time | Male | Female |
| Less than 5 Minutes | 45 (18.8%) | 19 (18.4%) |
| 5 to 9 Minutes | 81 (33.8%) | 15 (14.6%) |
| 10 to 14 Minutes | 0 (0.0%) | 2 (1.9%) |
| 15 to 19 Minutes | 81 (33.8%) | 0 (0.0%) |
| 20 to 24 Minutes | 24 (10.0%) | 4 (3.9%) |
| 25 to 29 Minutes | 0 (0.0%) | 4 (3.9%) |
| 30 to 34 Minutes | 1 (0.4%) | 21 (20.4%) |
| 35 to 39 Minutes | 0 (0.0%) | 0 (0.0%) |
| 40 to 44 Minutes | 0 (0.0%) | 0 (0.0%) |
| 45 to 59 Minutes | 0 (0.0%) | 0 (0.0%) |
| 60 to 89 Minutes | 8 (3.3%) | 35 (34.0%) |
| 90 or more Minutes | 0 (0.0%) | 3 (2.9%) |
Time of Departure to Work by Sex in Lone Pine
The most frequent times of departure to work in Lone Pine are 12:00 PM to 3:59 PM (47, 19.6%) for males and 7:00 AM to 7:29 AM (31, 30.1%) for females.
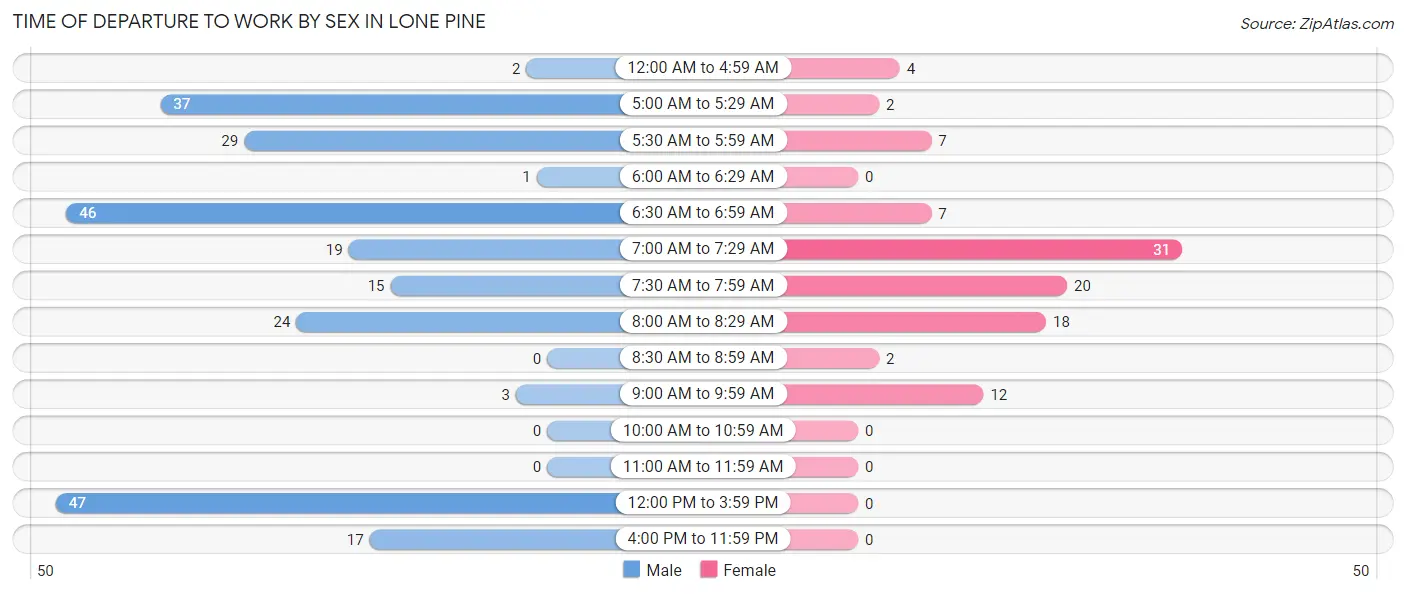
| Time of Departure | Male | Female |
| 12:00 AM to 4:59 AM | 2 (0.8%) | 4 (3.9%) |
| 5:00 AM to 5:29 AM | 37 (15.4%) | 2 (1.9%) |
| 5:30 AM to 5:59 AM | 29 (12.1%) | 7 (6.8%) |
| 6:00 AM to 6:29 AM | 1 (0.4%) | 0 (0.0%) |
| 6:30 AM to 6:59 AM | 46 (19.2%) | 7 (6.8%) |
| 7:00 AM to 7:29 AM | 19 (7.9%) | 31 (30.1%) |
| 7:30 AM to 7:59 AM | 15 (6.2%) | 20 (19.4%) |
| 8:00 AM to 8:29 AM | 24 (10.0%) | 18 (17.5%) |
| 8:30 AM to 8:59 AM | 0 (0.0%) | 2 (1.9%) |
| 9:00 AM to 9:59 AM | 3 (1.3%) | 12 (11.7%) |
| 10:00 AM to 10:59 AM | 0 (0.0%) | 0 (0.0%) |
| 11:00 AM to 11:59 AM | 0 (0.0%) | 0 (0.0%) |
| 12:00 PM to 3:59 PM | 47 (19.6%) | 0 (0.0%) |
| 4:00 PM to 11:59 PM | 17 (7.1%) | 0 (0.0%) |
| Total | 240 (100.0%) | 103 (100.0%) |
Housing Occupancy in Lone Pine
Occupancy by Ownership in Lone Pine
Of the total 570 dwellings in Lone Pine, owner-occupied units account for 369 (64.7%), while renter-occupied units make up 201 (35.3%).
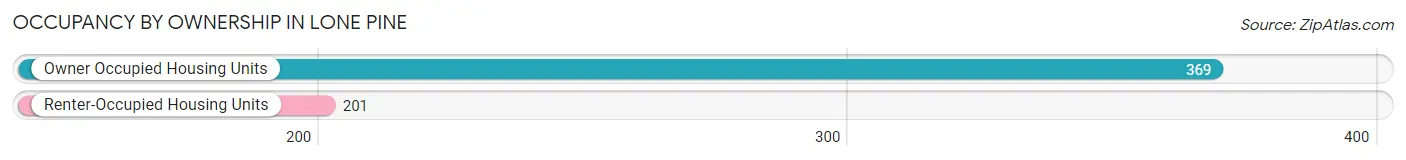
| Occupancy | # Housing Units | % Housing Units |
| Owner Occupied Housing Units | 369 | 64.7% |
| Renter-Occupied Housing Units | 201 | 35.3% |
| Total Occupied Housing Units | 570 | 100.0% |
Occupancy by Household Size in Lone Pine
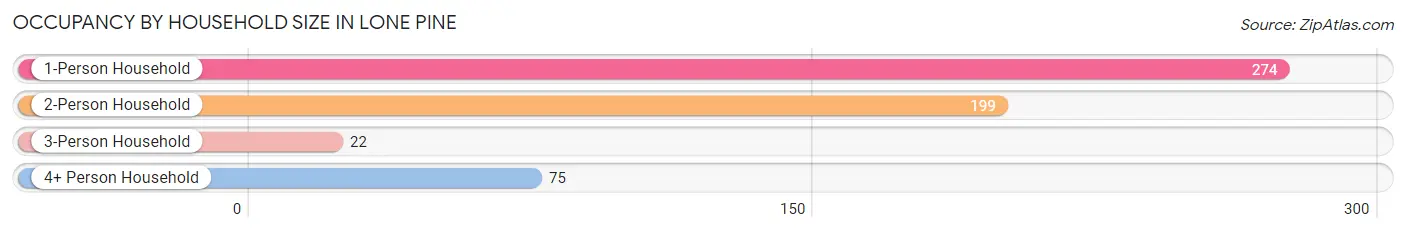
| Household Size | # Housing Units | % Housing Units |
| 1-Person Household | 274 | 48.1% |
| 2-Person Household | 199 | 34.9% |
| 3-Person Household | 22 | 3.9% |
| 4+ Person Household | 75 | 13.2% |
| Total Housing Units | 570 | 100.0% |
Occupancy by Ownership by Household Size in Lone Pine
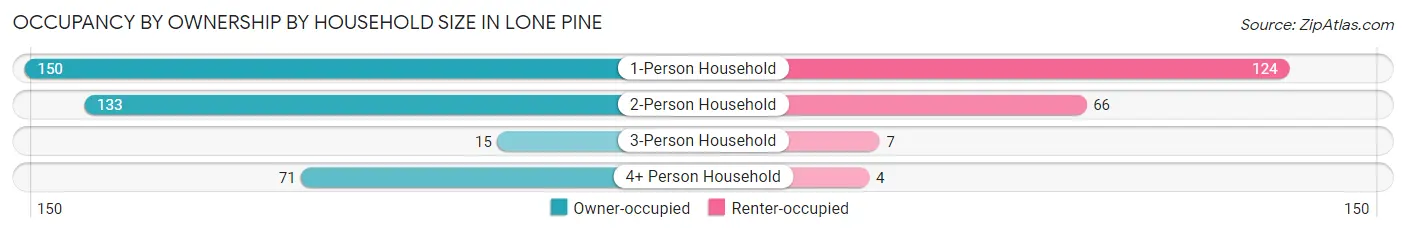
| Household Size | Owner-occupied | Renter-occupied |
| 1-Person Household | 150 (54.7%) | 124 (45.3%) |
| 2-Person Household | 133 (66.8%) | 66 (33.2%) |
| 3-Person Household | 15 (68.2%) | 7 (31.8%) |
| 4+ Person Household | 71 (94.7%) | 4 (5.3%) |
| Total Housing Units | 369 (64.7%) | 201 (35.3%) |
Occupancy by Educational Attainment in Lone Pine
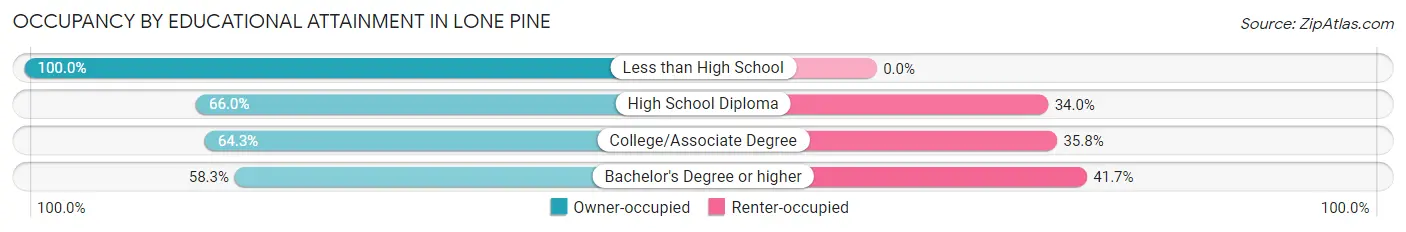
| Household Size | Owner-occupied | Renter-occupied |
| Less than High School | 24 (100.0%) | 0 (0.0%) |
| High School Diploma | 130 (66.0%) | 67 (34.0%) |
| College/Associate Degree | 124 (64.2%) | 69 (35.7%) |
| Bachelor's Degree or higher | 91 (58.3%) | 65 (41.7%) |
Occupancy by Age of Householder in Lone Pine
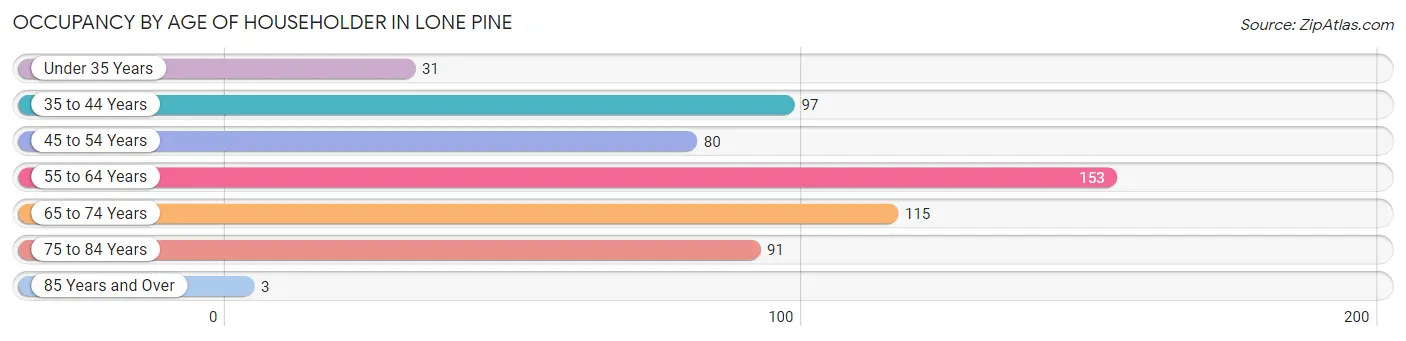
| Age Bracket | # Households | % Households |
| Under 35 Years | 31 | 5.4% |
| 35 to 44 Years | 97 | 17.0% |
| 45 to 54 Years | 80 | 14.0% |
| 55 to 64 Years | 153 | 26.8% |
| 65 to 74 Years | 115 | 20.2% |
| 75 to 84 Years | 91 | 16.0% |
| 85 Years and Over | 3 | 0.5% |
| Total | 570 | 100.0% |
Housing Finances in Lone Pine
Median Income by Occupancy in Lone Pine
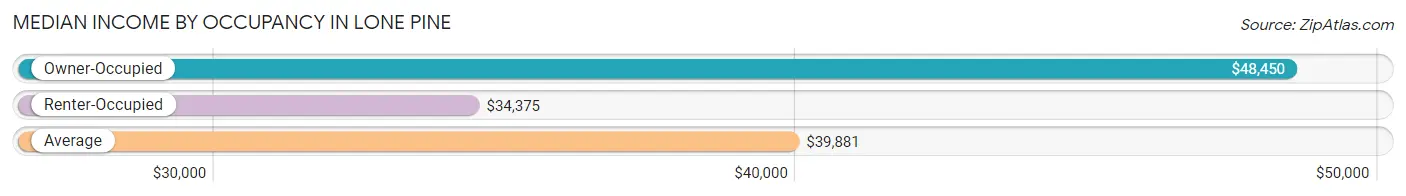
| Occupancy Type | # Households | Median Income |
| Owner-Occupied | 369 (64.7%) | $48,450 |
| Renter-Occupied | 201 (35.3%) | $34,375 |
| Average | 570 (100.0%) | $39,881 |
Occupancy by Householder Income Bracket in Lone Pine
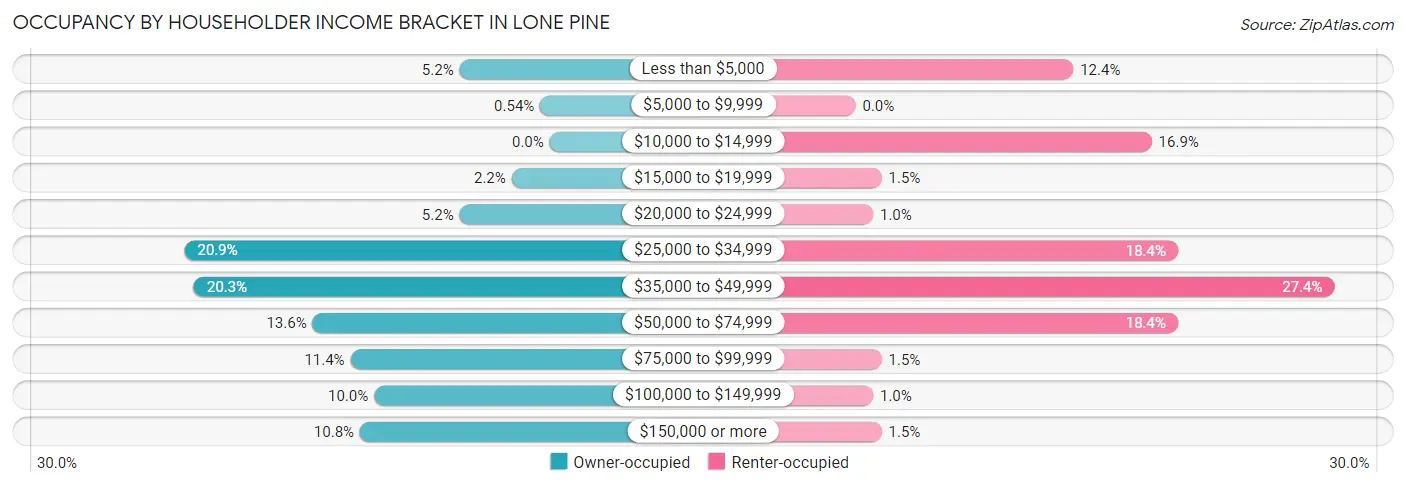
| Income Bracket | Owner-occupied | Renter-occupied |
| Less than $5,000 | 19 (5.1%) | 25 (12.4%) |
| $5,000 to $9,999 | 2 (0.5%) | 0 (0.0%) |
| $10,000 to $14,999 | 0 (0.0%) | 34 (16.9%) |
| $15,000 to $19,999 | 8 (2.2%) | 3 (1.5%) |
| $20,000 to $24,999 | 19 (5.1%) | 2 (1.0%) |
| $25,000 to $34,999 | 77 (20.9%) | 37 (18.4%) |
| $35,000 to $49,999 | 75 (20.3%) | 55 (27.4%) |
| $50,000 to $74,999 | 50 (13.6%) | 37 (18.4%) |
| $75,000 to $99,999 | 42 (11.4%) | 3 (1.5%) |
| $100,000 to $149,999 | 37 (10.0%) | 2 (1.0%) |
| $150,000 or more | 40 (10.8%) | 3 (1.5%) |
| Total | 369 (100.0%) | 201 (100.0%) |
Monthly Housing Cost Tiers in Lone Pine
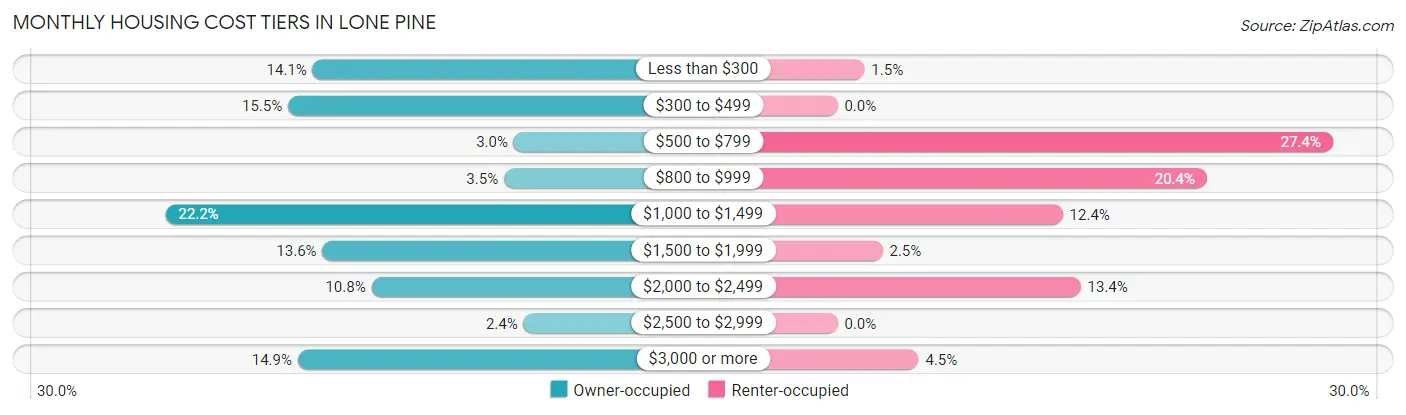
| Monthly Cost | Owner-occupied | Renter-occupied |
| Less than $300 | 52 (14.1%) | 3 (1.5%) |
| $300 to $499 | 57 (15.4%) | 0 (0.0%) |
| $500 to $799 | 11 (3.0%) | 55 (27.4%) |
| $800 to $999 | 13 (3.5%) | 41 (20.4%) |
| $1,000 to $1,499 | 82 (22.2%) | 25 (12.4%) |
| $1,500 to $1,999 | 50 (13.6%) | 5 (2.5%) |
| $2,000 to $2,499 | 40 (10.8%) | 27 (13.4%) |
| $2,500 to $2,999 | 9 (2.4%) | 0 (0.0%) |
| $3,000 or more | 55 (14.9%) | 9 (4.5%) |
| Total | 369 (100.0%) | 201 (100.0%) |
Physical Housing Characteristics in Lone Pine
Housing Structures in Lone Pine
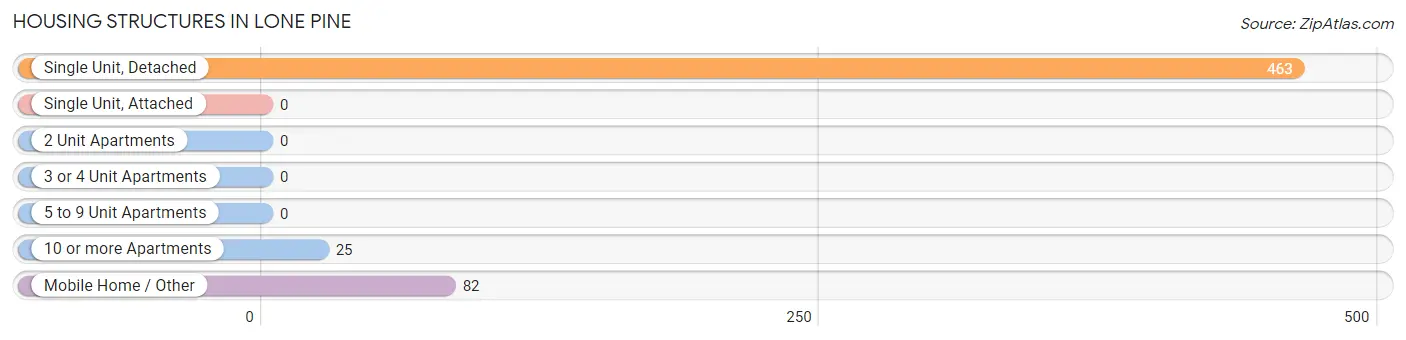
| Structure Type | # Housing Units | % Housing Units |
| Single Unit, Detached | 463 | 81.2% |
| Single Unit, Attached | 0 | 0.0% |
| 2 Unit Apartments | 0 | 0.0% |
| 3 or 4 Unit Apartments | 0 | 0.0% |
| 5 to 9 Unit Apartments | 0 | 0.0% |
| 10 or more Apartments | 25 | 4.4% |
| Mobile Home / Other | 82 | 14.4% |
| Total | 570 | 100.0% |
Housing Structures by Occupancy in Lone Pine
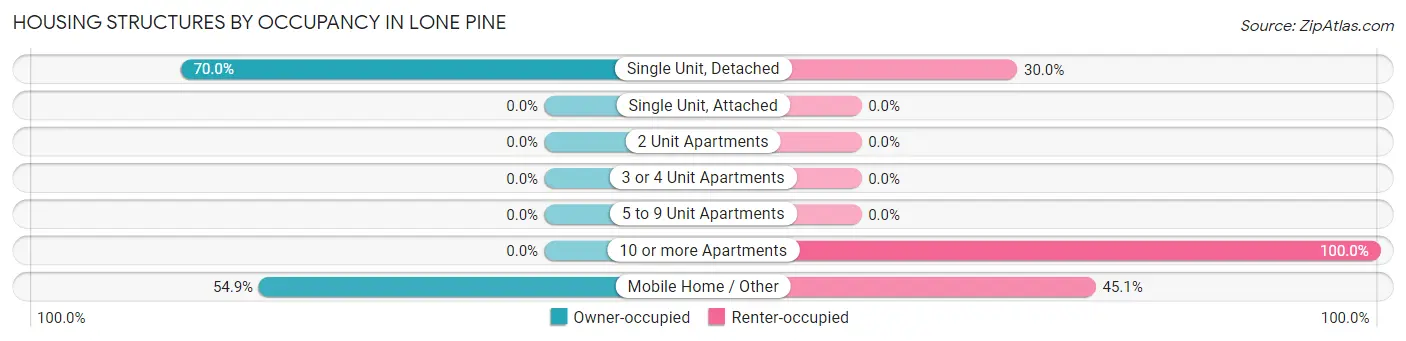
| Structure Type | Owner-occupied | Renter-occupied |
| Single Unit, Detached | 324 (70.0%) | 139 (30.0%) |
| Single Unit, Attached | 0 (0.0%) | 0 (0.0%) |
| 2 Unit Apartments | 0 (0.0%) | 0 (0.0%) |
| 3 or 4 Unit Apartments | 0 (0.0%) | 0 (0.0%) |
| 5 to 9 Unit Apartments | 0 (0.0%) | 0 (0.0%) |
| 10 or more Apartments | 0 (0.0%) | 25 (100.0%) |
| Mobile Home / Other | 45 (54.9%) | 37 (45.1%) |
| Total | 369 (64.7%) | 201 (35.3%) |
Housing Structures by Number of Rooms in Lone Pine
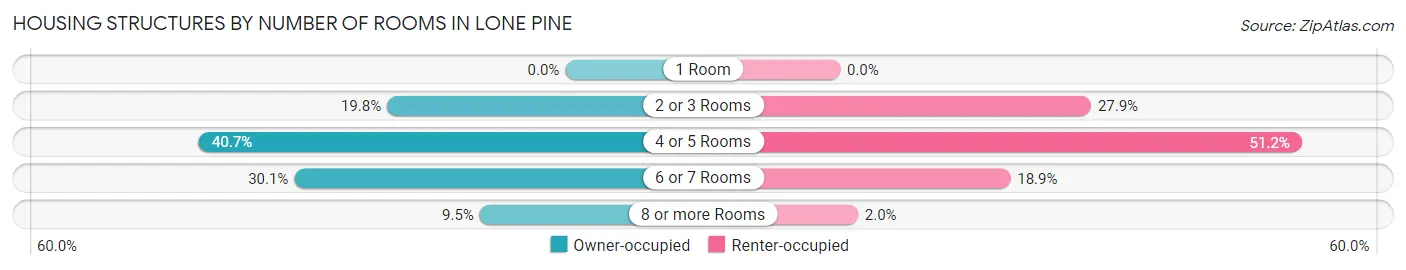
| Number of Rooms | Owner-occupied | Renter-occupied |
| 1 Room | 0 (0.0%) | 0 (0.0%) |
| 2 or 3 Rooms | 73 (19.8%) | 56 (27.9%) |
| 4 or 5 Rooms | 150 (40.6%) | 103 (51.2%) |
| 6 or 7 Rooms | 111 (30.1%) | 38 (18.9%) |
| 8 or more Rooms | 35 (9.5%) | 4 (2.0%) |
| Total | 369 (100.0%) | 201 (100.0%) |
Housing Structure by Heating Type in Lone Pine
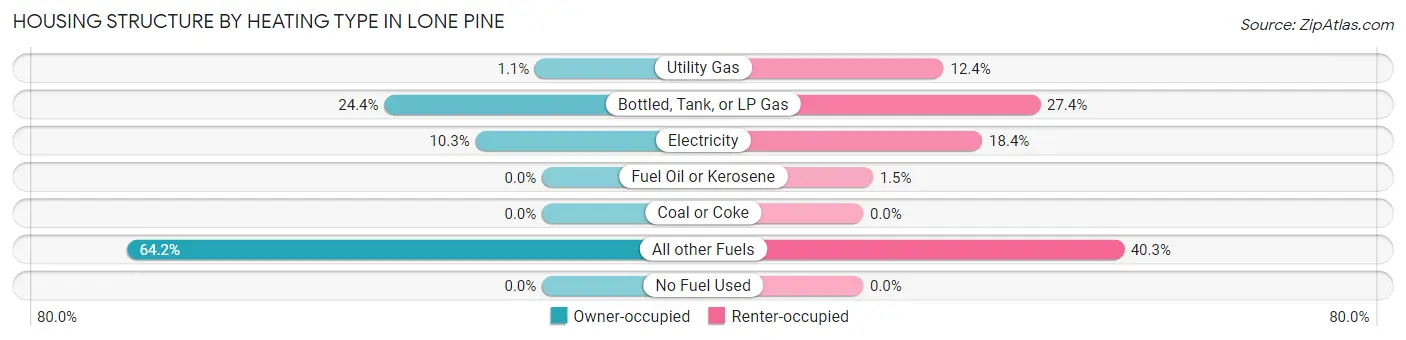
| Heating Type | Owner-occupied | Renter-occupied |
| Utility Gas | 4 (1.1%) | 25 (12.4%) |
| Bottled, Tank, or LP Gas | 90 (24.4%) | 55 (27.4%) |
| Electricity | 38 (10.3%) | 37 (18.4%) |
| Fuel Oil or Kerosene | 0 (0.0%) | 3 (1.5%) |
| Coal or Coke | 0 (0.0%) | 0 (0.0%) |
| All other Fuels | 237 (64.2%) | 81 (40.3%) |
| No Fuel Used | 0 (0.0%) | 0 (0.0%) |
| Total | 369 (100.0%) | 201 (100.0%) |
Household Vehicle Usage in Lone Pine
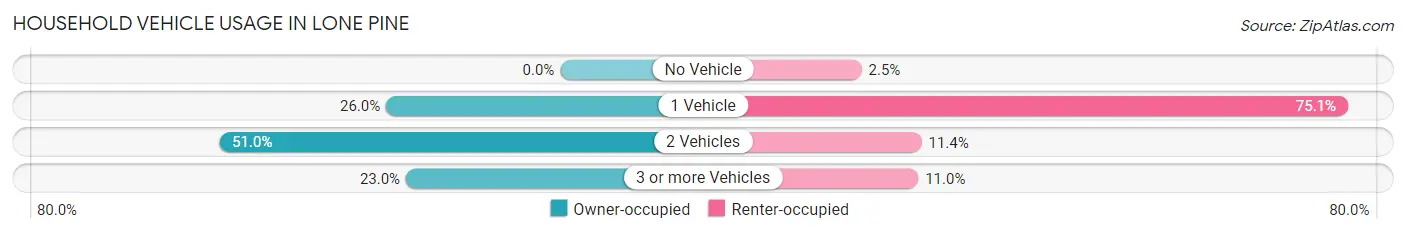
| Vehicles per Household | Owner-occupied | Renter-occupied |
| No Vehicle | 0 (0.0%) | 5 (2.5%) |
| 1 Vehicle | 96 (26.0%) | 151 (75.1%) |
| 2 Vehicles | 188 (50.9%) | 23 (11.4%) |
| 3 or more Vehicles | 85 (23.0%) | 22 (11.0%) |
| Total | 369 (100.0%) | 201 (100.0%) |
Real Estate & Mortgages in Lone Pine
Real Estate and Mortgage Overview in Lone Pine
| Characteristic | Without Mortgage | With Mortgage |
| Housing Units | 164 | 205 |
| Median Property Value | $262,500 | $236,300 |
| Median Household Income | $38,214 | $37 |
| Monthly Housing Costs | $394 | $55 |
| Real Estate Taxes | $1,855 | $13 |
Property Value by Mortgage Status in Lone Pine
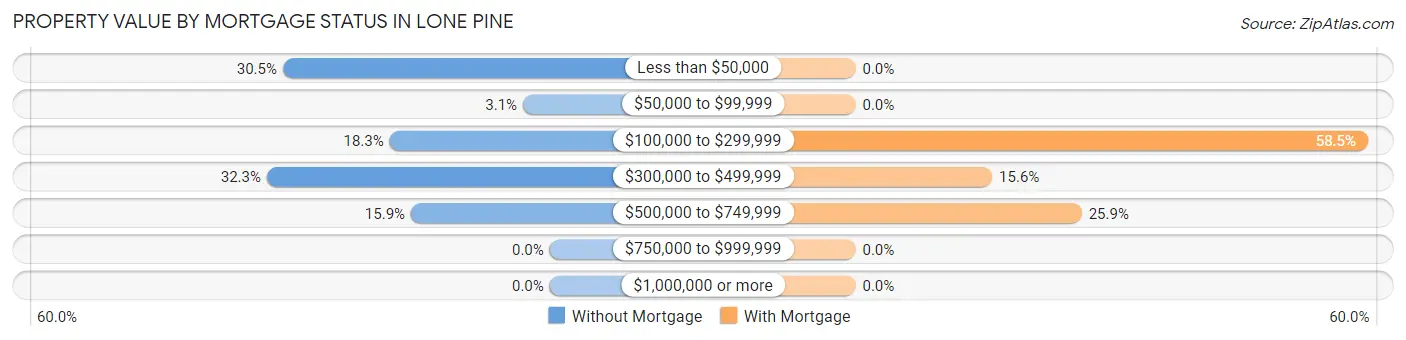
| Property Value | Without Mortgage | With Mortgage |
| Less than $50,000 | 50 (30.5%) | 0 (0.0%) |
| $50,000 to $99,999 | 5 (3.0%) | 0 (0.0%) |
| $100,000 to $299,999 | 30 (18.3%) | 120 (58.5%) |
| $300,000 to $499,999 | 53 (32.3%) | 32 (15.6%) |
| $500,000 to $749,999 | 26 (15.9%) | 53 (25.9%) |
| $750,000 to $999,999 | 0 (0.0%) | 0 (0.0%) |
| $1,000,000 or more | 0 (0.0%) | 0 (0.0%) |
| Total | 164 (100.0%) | 205 (100.0%) |
Household Income by Mortgage Status in Lone Pine
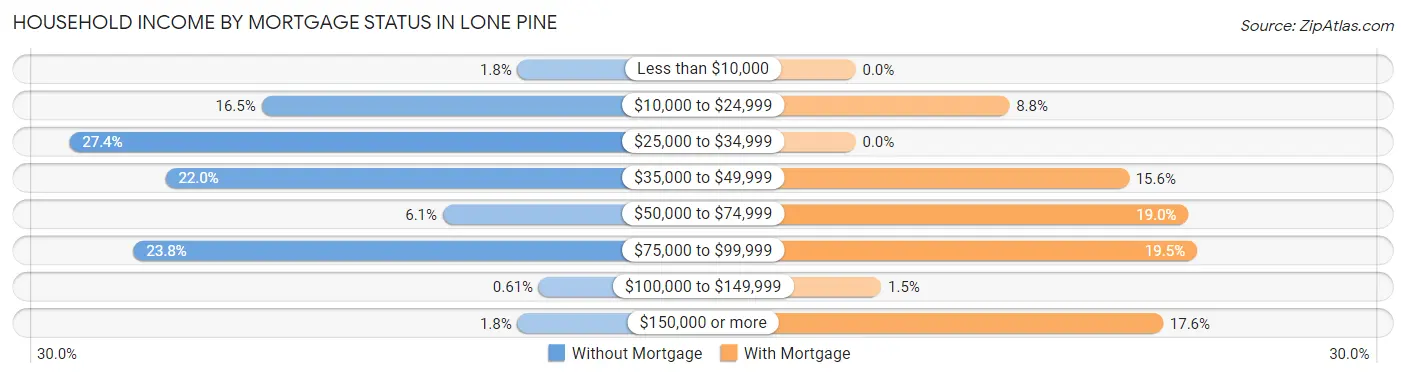
| Household Income | Without Mortgage | With Mortgage |
| Less than $10,000 | 3 (1.8%) | 0 (0.0%) |
| $10,000 to $24,999 | 27 (16.5%) | 18 (8.8%) |
| $25,000 to $34,999 | 45 (27.4%) | 0 (0.0%) |
| $35,000 to $49,999 | 36 (22.0%) | 32 (15.6%) |
| $50,000 to $74,999 | 10 (6.1%) | 39 (19.0%) |
| $75,000 to $99,999 | 39 (23.8%) | 40 (19.5%) |
| $100,000 to $149,999 | 1 (0.6%) | 3 (1.5%) |
| $150,000 or more | 3 (1.8%) | 36 (17.6%) |
| Total | 164 (100.0%) | 205 (100.0%) |
Property Value to Household Income Ratio in Lone Pine
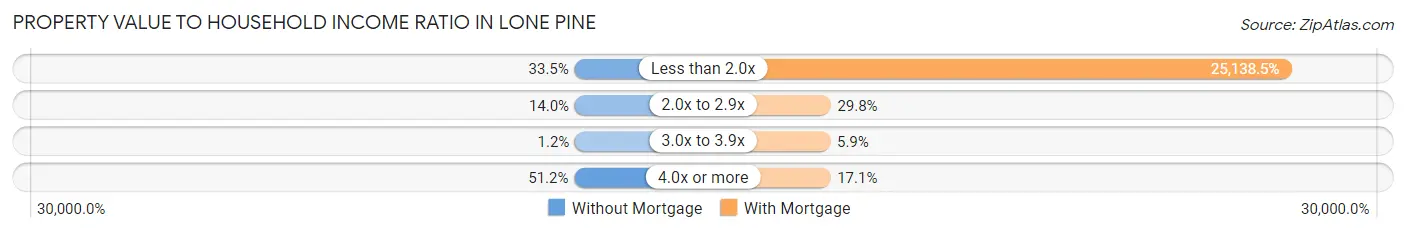
| Value-to-Income Ratio | Without Mortgage | With Mortgage |
| Less than 2.0x | 55 (33.5%) | 51,534 (25,138.5%) |
| 2.0x to 2.9x | 23 (14.0%) | 61 (29.8%) |
| 3.0x to 3.9x | 2 (1.2%) | 12 (5.9%) |
| 4.0x or more | 84 (51.2%) | 35 (17.1%) |
| Total | 164 (100.0%) | 205 (100.0%) |
Real Estate Taxes by Mortgage Status in Lone Pine
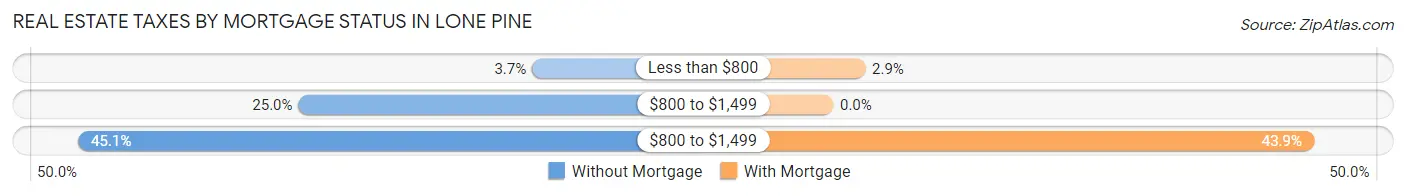
| Property Taxes | Without Mortgage | With Mortgage |
| Less than $800 | 6 (3.7%) | 6 (2.9%) |
| $800 to $1,499 | 41 (25.0%) | 0 (0.0%) |
| $800 to $1,499 | 74 (45.1%) | 90 (43.9%) |
| Total | 164 (100.0%) | 205 (100.0%) |
Health & Disability in Lone Pine
Health Insurance Coverage by Age in Lone Pine
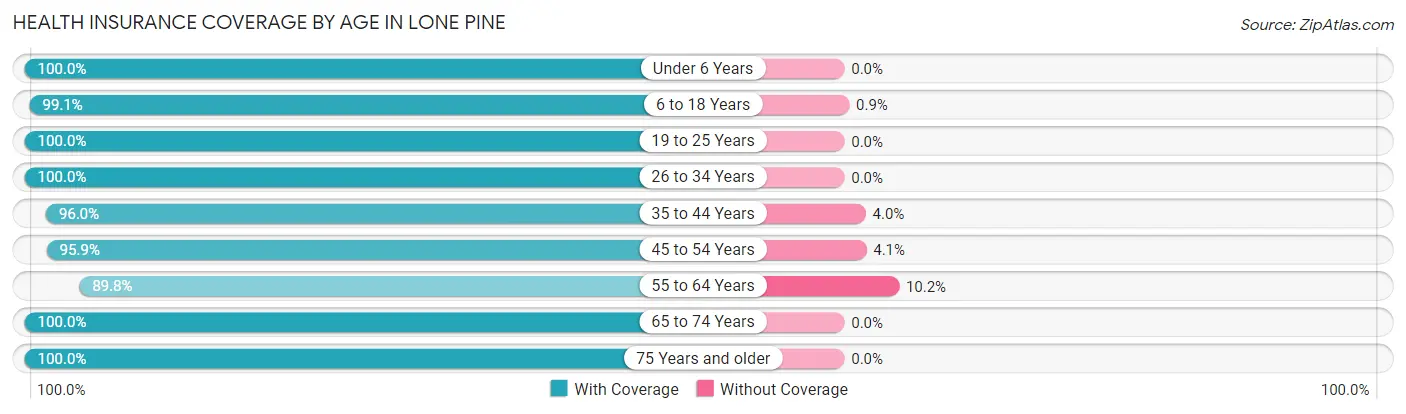
| Age Bracket | With Coverage | Without Coverage |
| Under 6 Years | 169 (100.0%) | 0 (0.0%) |
| 6 to 18 Years | 221 (99.1%) | 2 (0.9%) |
| 19 to 25 Years | 21 (100.0%) | 0 (0.0%) |
| 26 to 34 Years | 73 (100.0%) | 0 (0.0%) |
| 35 to 44 Years | 145 (96.0%) | 6 (4.0%) |
| 45 to 54 Years | 117 (95.9%) | 5 (4.1%) |
| 55 to 64 Years | 185 (89.8%) | 21 (10.2%) |
| 65 to 74 Years | 120 (100.0%) | 0 (0.0%) |
| 75 Years and older | 184 (100.0%) | 0 (0.0%) |
| Total | 1,235 (97.3%) | 34 (2.7%) |
Health Insurance Coverage by Citizenship Status in Lone Pine
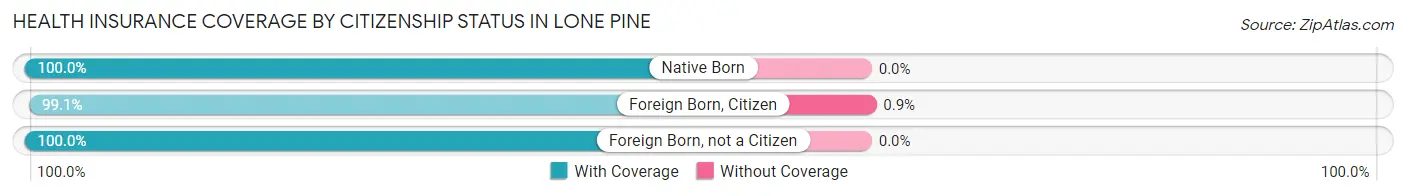
| Citizenship Status | With Coverage | Without Coverage |
| Native Born | 169 (100.0%) | 0 (0.0%) |
| Foreign Born, Citizen | 221 (99.1%) | 2 (0.9%) |
| Foreign Born, not a Citizen | 21 (100.0%) | 0 (0.0%) |
Health Insurance Coverage by Household Income in Lone Pine
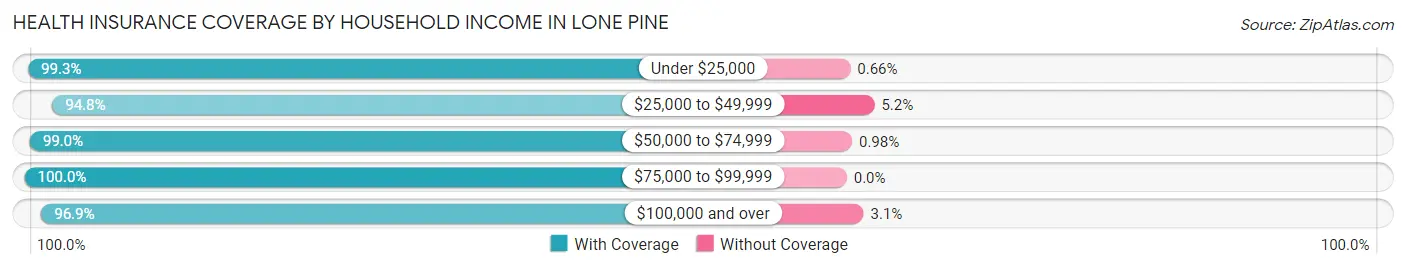
| Household Income | With Coverage | Without Coverage |
| Under $25,000 | 151 (99.3%) | 1 (0.7%) |
| $25,000 to $49,999 | 420 (94.8%) | 23 (5.2%) |
| $50,000 to $74,999 | 202 (99.0%) | 2 (1.0%) |
| $75,000 to $99,999 | 215 (100.0%) | 0 (0.0%) |
| $100,000 and over | 247 (96.9%) | 8 (3.1%) |
Public vs Private Health Insurance Coverage by Age in Lone Pine
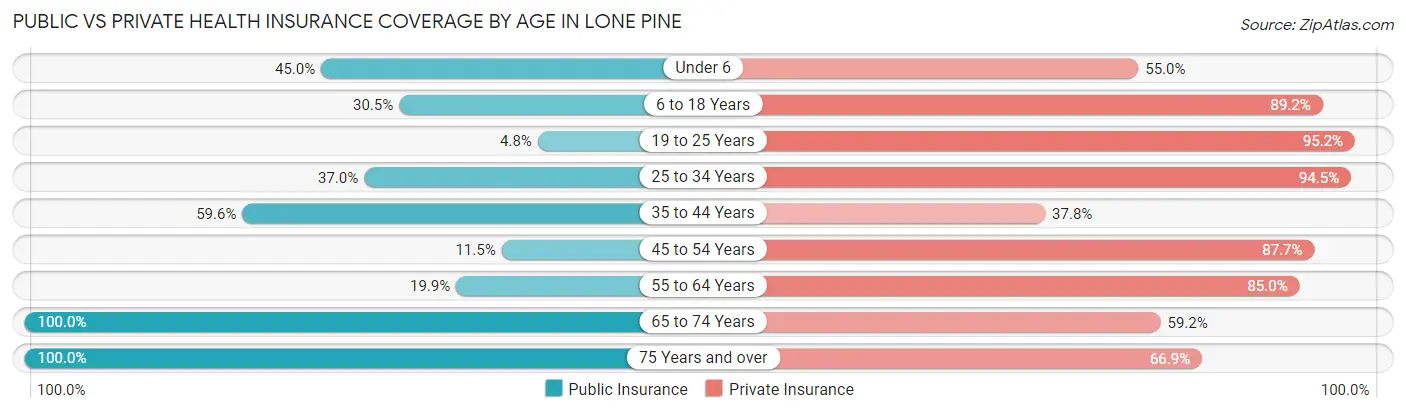
| Age Bracket | Public Insurance | Private Insurance |
| Under 6 | 76 (45.0%) | 93 (55.0%) |
| 6 to 18 Years | 68 (30.5%) | 199 (89.2%) |
| 19 to 25 Years | 1 (4.8%) | 20 (95.2%) |
| 25 to 34 Years | 27 (37.0%) | 69 (94.5%) |
| 35 to 44 Years | 90 (59.6%) | 57 (37.8%) |
| 45 to 54 Years | 14 (11.5%) | 107 (87.7%) |
| 55 to 64 Years | 41 (19.9%) | 175 (85.0%) |
| 65 to 74 Years | 120 (100.0%) | 71 (59.2%) |
| 75 Years and over | 184 (100.0%) | 123 (66.8%) |
| Total | 621 (48.9%) | 914 (72.0%) |
Disability Status by Sex by Age in Lone Pine
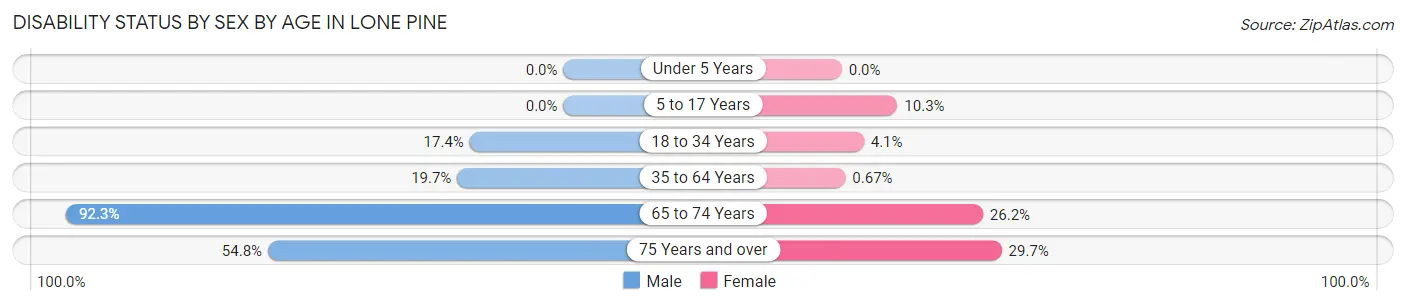
| Age Bracket | Male | Female |
| Under 5 Years | 0 (0.0%) | 0 (0.0%) |
| 5 to 17 Years | 0 (0.0%) | 13 (10.3%) |
| 18 to 34 Years | 8 (17.4%) | 2 (4.1%) |
| 35 to 64 Years | 65 (19.7%) | 1 (0.7%) |
| 65 to 74 Years | 72 (92.3%) | 11 (26.2%) |
| 75 Years and over | 51 (54.8%) | 27 (29.7%) |
Disability Class by Sex by Age in Lone Pine
Disability Class: Hearing Difficulty
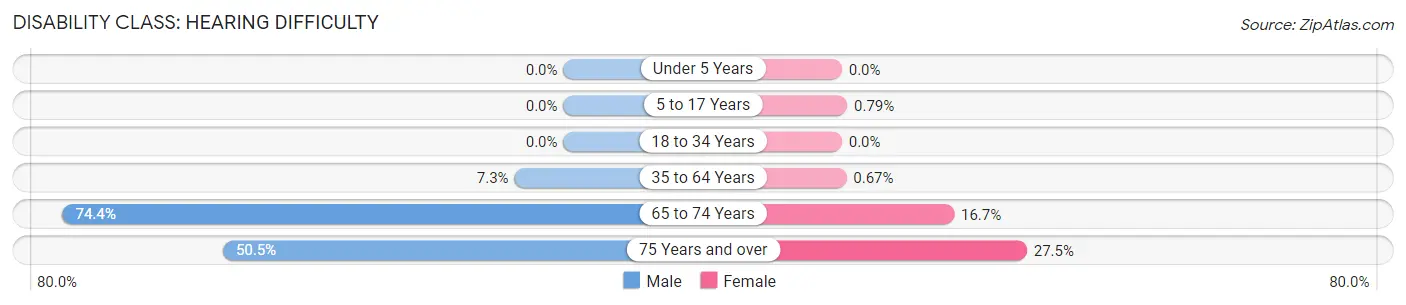
| Age Bracket | Male | Female |
| Under 5 Years | 0 (0.0%) | 0 (0.0%) |
| 5 to 17 Years | 0 (0.0%) | 1 (0.8%) |
| 18 to 34 Years | 0 (0.0%) | 0 (0.0%) |
| 35 to 64 Years | 24 (7.3%) | 1 (0.7%) |
| 65 to 74 Years | 58 (74.4%) | 7 (16.7%) |
| 75 Years and over | 47 (50.5%) | 25 (27.5%) |
Disability Class: Vision Difficulty
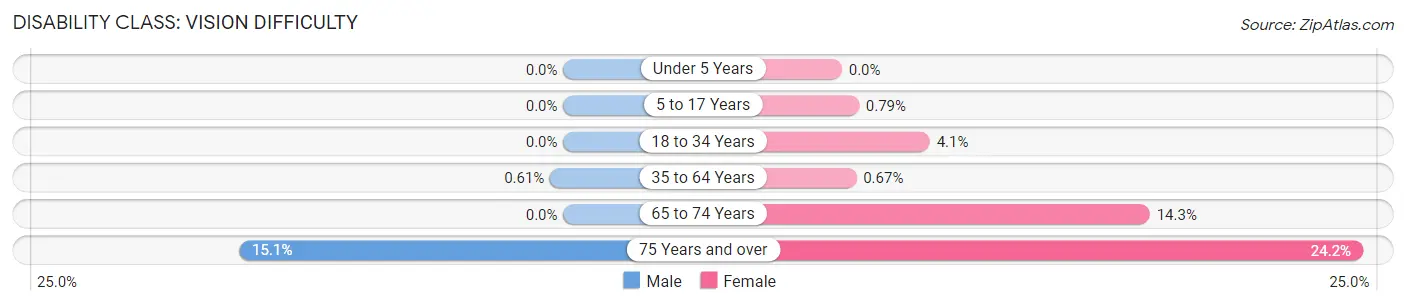
| Age Bracket | Male | Female |
| Under 5 Years | 0 (0.0%) | 0 (0.0%) |
| 5 to 17 Years | 0 (0.0%) | 1 (0.8%) |
| 18 to 34 Years | 0 (0.0%) | 2 (4.1%) |
| 35 to 64 Years | 2 (0.6%) | 1 (0.7%) |
| 65 to 74 Years | 0 (0.0%) | 6 (14.3%) |
| 75 Years and over | 14 (15.0%) | 22 (24.2%) |
Disability Class: Cognitive Difficulty
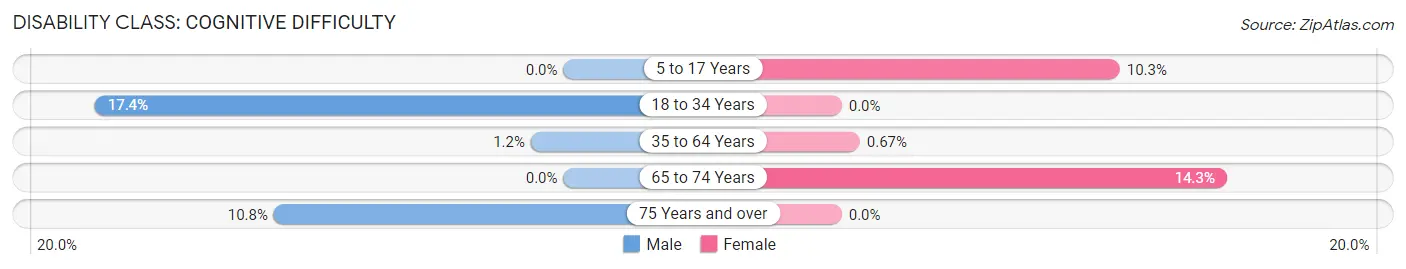
| Age Bracket | Male | Female |
| 5 to 17 Years | 0 (0.0%) | 13 (10.3%) |
| 18 to 34 Years | 8 (17.4%) | 0 (0.0%) |
| 35 to 64 Years | 4 (1.2%) | 1 (0.7%) |
| 65 to 74 Years | 0 (0.0%) | 6 (14.3%) |
| 75 Years and over | 10 (10.7%) | 0 (0.0%) |
Disability Class: Ambulatory Difficulty
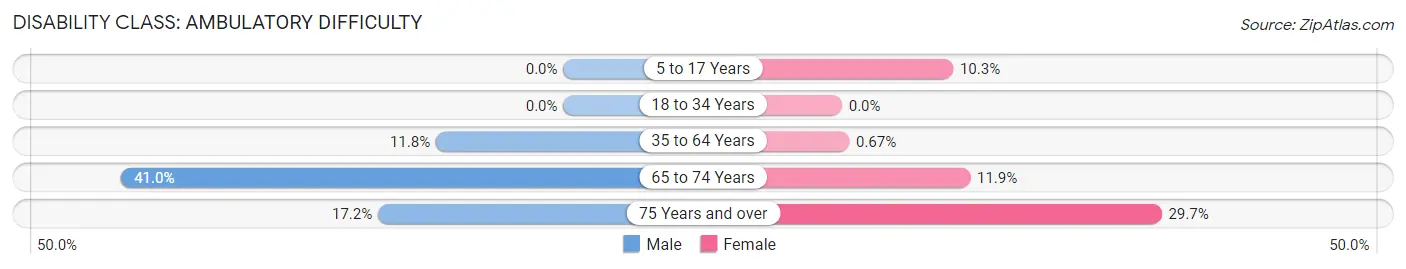
| Age Bracket | Male | Female |
| 5 to 17 Years | 0 (0.0%) | 13 (10.3%) |
| 18 to 34 Years | 0 (0.0%) | 0 (0.0%) |
| 35 to 64 Years | 39 (11.8%) | 1 (0.7%) |
| 65 to 74 Years | 32 (41.0%) | 5 (11.9%) |
| 75 Years and over | 16 (17.2%) | 27 (29.7%) |
Disability Class: Self-Care Difficulty
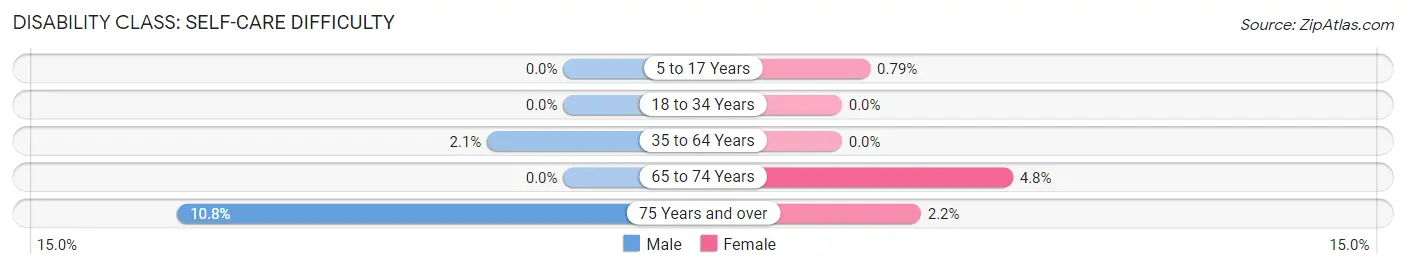
| Age Bracket | Male | Female |
| 5 to 17 Years | 0 (0.0%) | 1 (0.8%) |
| 18 to 34 Years | 0 (0.0%) | 0 (0.0%) |
| 35 to 64 Years | 7 (2.1%) | 0 (0.0%) |
| 65 to 74 Years | 0 (0.0%) | 2 (4.8%) |
| 75 Years and over | 10 (10.7%) | 2 (2.2%) |
Technology Access in Lone Pine
Computing Device Access in Lone Pine
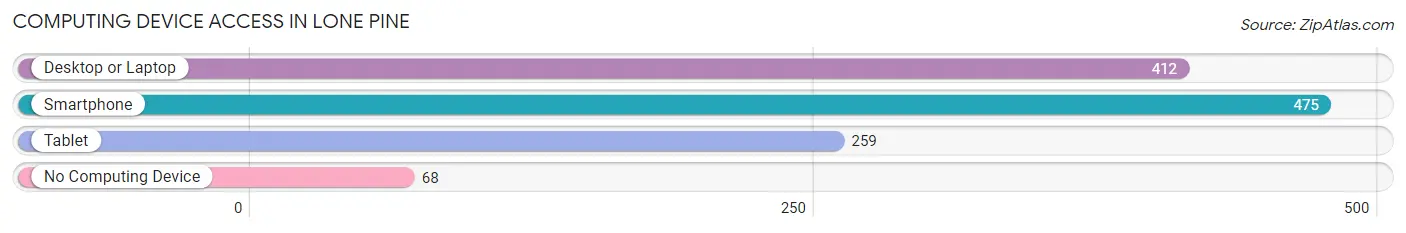
| Device Type | # Households | % Households |
| Desktop or Laptop | 412 | 72.3% |
| Smartphone | 475 | 83.3% |
| Tablet | 259 | 45.4% |
| No Computing Device | 68 | 11.9% |
| Total | 570 | 100.0% |
Internet Access in Lone Pine
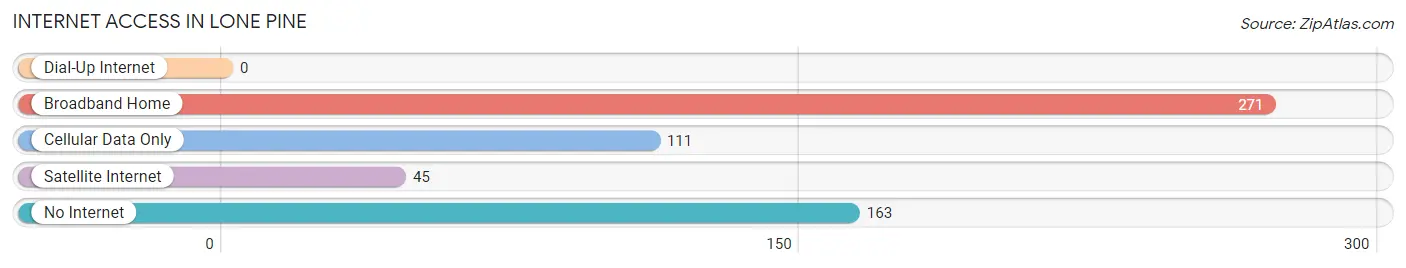
| Internet Type | # Households | % Households |
| Dial-Up Internet | 0 | 0.0% |
| Broadband Home | 271 | 47.5% |
| Cellular Data Only | 111 | 19.5% |
| Satellite Internet | 45 | 7.9% |
| No Internet | 163 | 28.6% |
| Total | 570 | 100.0% |
Lone Pine Summary
Lone Pine is a small town located in the Owens Valley of Inyo County, California. It is situated at the base of the Sierra Nevada mountain range, and is surrounded by the Alabama Hills. The town is located along U.S. Route 395, and is the gateway to the Eastern Sierra region.
History
Lone Pine was founded in 1861 by settlers from the Owens Valley. The town was originally called "Lone Pine Station" due to the single pine tree that stood near the original settlement. The town was later renamed to Lone Pine in 1864.
The town was an important stop along the route of the Butterfield Overland Mail stagecoach line, which ran from St. Louis, Missouri to San Francisco, California. The stagecoach line operated from 1858 to 1861, and was the first overland mail service in the United States.
In the late 19th century, Lone Pine became a popular destination for tourists and adventurers. The town was also a popular filming location for Hollywood westerns, and many of the town's buildings were used as sets for films such as Gunga Din (1939) and How the West Was Won (1962).
Geography
Lone Pine is located in the Owens Valley of Inyo County, California. The town is situated at the base of the Sierra Nevada mountain range, and is surrounded by the Alabama Hills. The town is located along U.S. Route 395, and is the gateway to the Eastern Sierra region.
The town is located at an elevation of 3,700 feet (1,128 m), and has a total area of 2.2 square miles (5.7 km2). The town is located in a semi-arid desert climate, with hot summers and cold winters. The average annual precipitation is 5.5 inches (140 mm).
Economy
Lone Pine's economy is largely based on tourism. The town is a popular destination for outdoor recreation, and is home to several campgrounds, hiking trails, and fishing spots. The town is also a popular filming location for Hollywood westerns, and many of the town's buildings have been used as sets for films such as Gunga Din (1939) and How the West Was Won (1962).
The town is also home to several businesses, including restaurants, hotels, and retail stores. The town is also home to the Lone Pine Film History Museum, which showcases the history of the town's role in Hollywood westerns.
Demographics
As of the 2010 census, the population of Lone Pine was 2,035. The racial makeup of the town was 87.3% White, 0.7% African American, 0.9% Native American, 0.7% Asian, 0.1% Pacific Islander, 8.2% from other races, and 2.1% from two or more races. Hispanic or Latino of any race were 16.2% of the population.
The median household income in Lone Pine was $37,917, and the median family income was $45,625. The per capita income for the town was $20,945. About 11.2% of families and 14.3% of the population were below the poverty line, including 18.2% of those under age 18 and 8.3% of those age 65 or over.
Common Questions
What is Per Capita Income in Lone Pine?
Per Capita income in Lone Pine is $27,933.
What is the Median Family Income in Lone Pine?
Median Family Income in Lone Pine is $64,432.
What is the Median Household income in Lone Pine?
Median Household Income in Lone Pine is $39,881.
What is Income or Wage Gap in Lone Pine?
Income or Wage Gap in Lone Pine is 18.2%.
Women in Lone Pine earn 81.8 cents for every dollar earned by a man.
What is Inequality or Gini Index in Lone Pine?
Inequality or Gini Index in Lone Pine is 0.52.
What is the Total Population of Lone Pine?
Total Population of Lone Pine is 1,323.
What is the Total Male Population of Lone Pine?
Total Male Population of Lone Pine is 778.
What is the Total Female Population of Lone Pine?
Total Female Population of Lone Pine is 545.
What is the Ratio of Males per 100 Females in Lone Pine?
There are 142.75 Males per 100 Females in Lone Pine.
What is the Ratio of Females per 100 Males in Lone Pine?
There are 70.05 Females per 100 Males in Lone Pine.
What is the Median Population Age in Lone Pine?
Median Population Age in Lone Pine is 45.6 Years.
What is the Average Family Size in Lone Pine
Average Family Size in Lone Pine is 3.6 People.
What is the Average Household Size in Lone Pine
Average Household Size in Lone Pine is 2.2 People.
How Large is the Labor Force in Lone Pine?
There are 370 People in the Labor Forcein in Lone Pine.
What is the Percentage of People in the Labor Force in Lone Pine?
38.0% of People are in the Labor Force in Lone Pine.
What is the Unemployment Rate in Lone Pine?
Unemployment Rate in Lone Pine is 5.1%.