Cities with the Highest Percentage of Population with a Degree in Visual and Performing Arts in Minnesota
RELATED REPORTS & OPTIONS
Visual and Performing Arts
Minnesota
Compare Cities
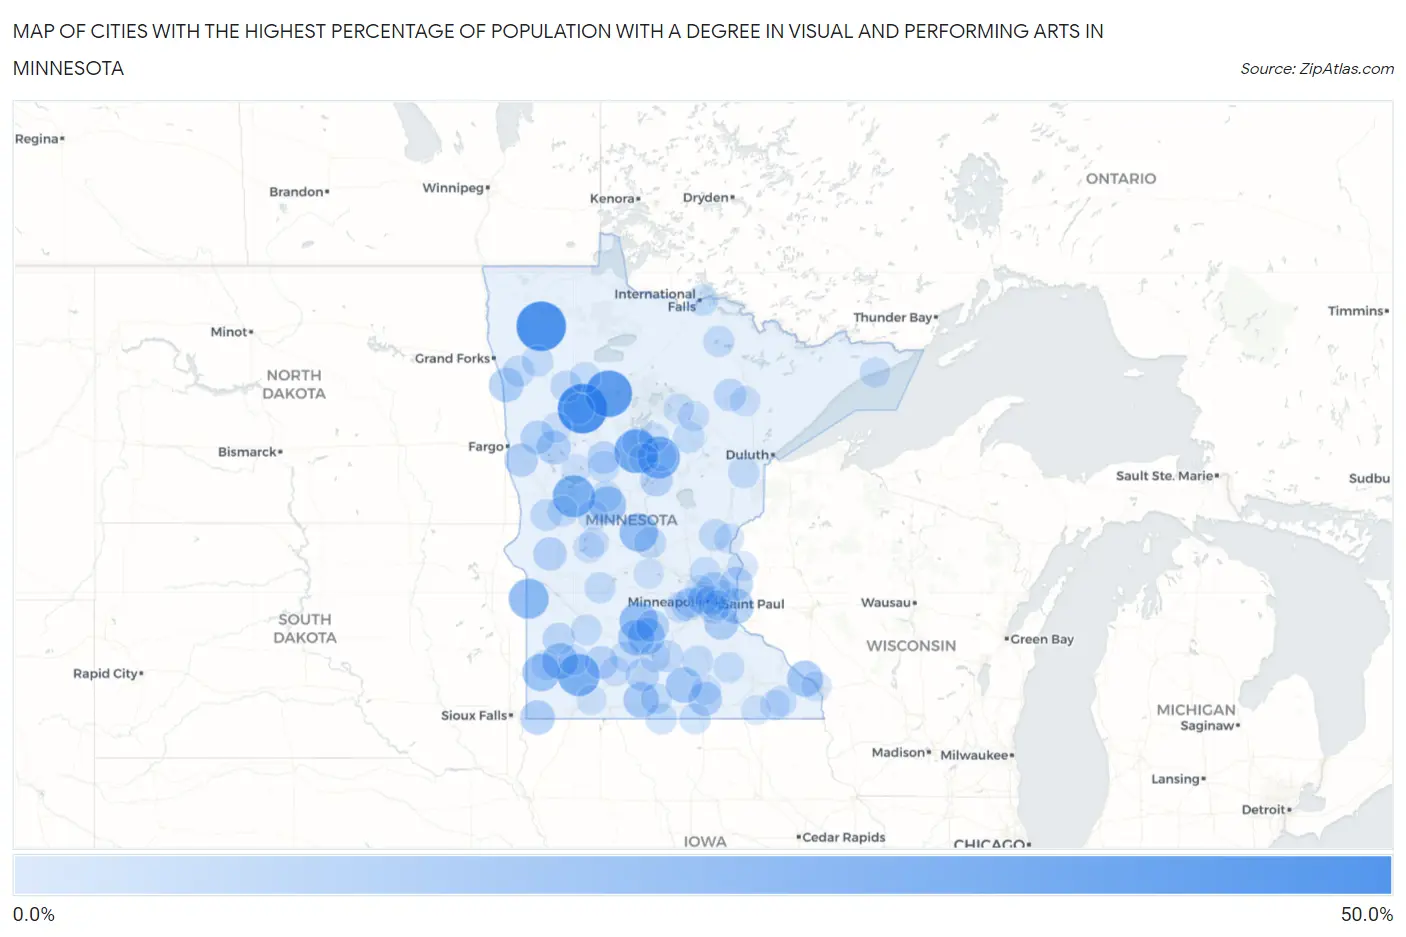
Map of Cities with the Highest Percentage of Population with a Degree in Visual and Performing Arts in Minnesota
0.0%
50.0%
Cities with the Highest Percentage of Population with a Degree in Visual and Performing Arts in Minnesota
| City | % Graduates | vs State | vs National | |
| 1. | Holt | 50.0% | 4.3%(+45.7)#1 | 4.3%(+45.7)#121 |
| 2. | South End | 50.0% | 4.3%(+45.7)#2 | 4.3%(+45.7)#127 |
| 3. | Wilton | 43.5% | 4.3%(+39.2)#3 | 4.3%(+39.2)#157 |
| 4. | Backus | 36.8% | 4.3%(+32.6)#4 | 4.3%(+32.6)#207 |
| 5. | Clitherall | 33.3% | 4.3%(+29.1)#5 | 4.3%(+29.1)#260 |
| 6. | Dovray | 33.3% | 4.3%(+29.1)#6 | 4.3%(+29.1)#272 |
| 7. | Manhattan Beach | 33.3% | 4.3%(+29.1)#7 | 4.3%(+29.1)#273 |
| 8. | Marietta | 28.6% | 4.3%(+24.3)#8 | 4.3%(+24.3)#341 |
| 9. | Stewart | 25.0% | 4.3%(+20.7)#9 | 4.3%(+20.7)#419 |
| 10. | Elmdale | 25.0% | 4.3%(+20.7)#10 | 4.3%(+20.7)#432 |
| 11. | Holland | 23.1% | 4.3%(+18.8)#11 | 4.3%(+18.8)#486 |
| 12. | Eagle Bend | 22.6% | 4.3%(+18.3)#12 | 4.3%(+18.3)#498 |
| 13. | Winthrop | 21.6% | 4.3%(+17.3)#13 | 4.3%(+17.3)#548 |
| 14. | Balaton | 20.5% | 4.3%(+16.3)#14 | 4.3%(+16.3)#597 |
| 15. | Homer | 20.0% | 4.3%(+15.7)#15 | 4.3%(+15.7)#637 |
| 16. | Gibbon | 19.7% | 4.3%(+15.4)#16 | 4.3%(+15.5)#656 |
| 17. | Waldorf | 19.2% | 4.3%(+14.9)#17 | 4.3%(+15.0)#689 |
| 18. | Northrop | 18.8% | 4.3%(+14.5)#18 | 4.3%(+14.5)#731 |
| 19. | St. John's University | 18.6% | 4.3%(+14.3)#19 | 4.3%(+14.3)#741 |
| 20. | St Marys Point | 18.0% | 4.3%(+13.7)#20 | 4.3%(+13.7)#780 |
| 21. | Climax | 16.7% | 4.3%(+12.4)#21 | 4.3%(+12.4)#899 |
| 22. | Coates | 16.7% | 4.3%(+12.4)#22 | 4.3%(+12.4)#901 |
| 23. | Steen | 16.7% | 4.3%(+12.4)#23 | 4.3%(+12.4)#904 |
| 24. | Audubon | 15.6% | 4.3%(+11.3)#24 | 4.3%(+11.4)#994 |
| 25. | Clarks Grove | 15.5% | 4.3%(+11.2)#25 | 4.3%(+11.2)#1,015 |
| 26. | Hitterdal | 15.0% | 4.3%(+10.7)#26 | 4.3%(+10.7)#1,059 |
| 27. | Marine On St Croix | 14.5% | 4.3%(+10.2)#27 | 4.3%(+10.2)#1,119 |
| 28. | Alberta | 14.3% | 4.3%(+10.0)#28 | 4.3%(+10.0)#1,169 |
| 29. | Baker | 14.3% | 4.3%(+10.0)#29 | 4.3%(+10.0)#1,172 |
| 30. | Sanborn | 13.6% | 4.3%(+9.35)#30 | 4.3%(+9.38)#1,247 |
| 31. | Lexington | 13.6% | 4.3%(+9.31)#31 | 4.3%(+9.34)#1,250 |
| 32. | Madelia | 13.5% | 4.3%(+9.20)#32 | 4.3%(+9.23)#1,269 |
| 33. | New Auburn | 13.3% | 4.3%(+9.05)#33 | 4.3%(+9.08)#1,290 |
| 34. | Merrifield | 13.3% | 4.3%(+9.05)#34 | 4.3%(+9.08)#1,303 |
| 35. | Menahga | 12.8% | 4.3%(+8.50)#35 | 4.3%(+8.53)#1,374 |
| 36. | Chisholm | 12.5% | 4.3%(+8.18)#36 | 4.3%(+8.21)#1,437 |
| 37. | Spring Park | 12.0% | 4.3%(+7.70)#37 | 4.3%(+7.73)#1,524 |
| 38. | Ghent | 11.8% | 4.3%(+7.56)#38 | 4.3%(+7.59)#1,555 |
| 39. | Kasota | 11.1% | 4.3%(+6.83)#39 | 4.3%(+6.86)#1,696 |
| 40. | Wendell | 11.1% | 4.3%(+6.83)#40 | 4.3%(+6.86)#1,721 |
| 41. | Grasston | 11.1% | 4.3%(+6.83)#41 | 4.3%(+6.86)#1,725 |
| 42. | St Stephen | 10.9% | 4.3%(+6.64)#42 | 4.3%(+6.67)#1,767 |
| 43. | Fosston | 10.8% | 4.3%(+6.48)#43 | 4.3%(+6.50)#1,815 |
| 44. | Crookston | 10.5% | 4.3%(+6.24)#44 | 4.3%(+6.27)#1,883 |
| 45. | Dresbach | 10.4% | 4.3%(+6.10)#45 | 4.3%(+6.13)#1,937 |
| 46. | Morristown | 10.3% | 4.3%(+6.06)#46 | 4.3%(+6.09)#1,949 |
| 47. | Mahtowa | 10.3% | 4.3%(+6.01)#47 | 4.3%(+6.04)#1,961 |
| 48. | Red Lake Falls | 10.3% | 4.3%(+5.98)#48 | 4.3%(+6.00)#1,974 |
| 49. | Ranier | 10.3% | 4.3%(+5.98)#49 | 4.3%(+6.00)#1,975 |
| 50. | Elmore | 10.3% | 4.3%(+5.98)#50 | 4.3%(+6.00)#1,977 |
| 51. | Sebeka | 10.2% | 4.3%(+5.89)#51 | 4.3%(+5.92)#2,009 |
| 52. | Bertha | 10.1% | 4.3%(+5.86)#52 | 4.3%(+5.89)#2,016 |
| 53. | Hill City | 10.0% | 4.3%(+5.72)#53 | 4.3%(+5.75)#2,060 |
| 54. | Pennock | 10.0% | 4.3%(+5.72)#54 | 4.3%(+5.75)#2,061 |
| 55. | Nett Lake | 10.0% | 4.3%(+5.72)#55 | 4.3%(+5.75)#2,075 |
| 56. | Robbinsdale | 10.0% | 4.3%(+5.67)#56 | 4.3%(+5.70)#2,090 |
| 57. | Winnebago | 9.8% | 4.3%(+5.49)#57 | 4.3%(+5.52)#2,143 |
| 58. | Emmons | 9.7% | 4.3%(+5.40)#58 | 4.3%(+5.43)#2,184 |
| 59. | Oak Grove | 9.5% | 4.3%(+5.25)#59 | 4.3%(+5.27)#2,227 |
| 60. | Clearbrook | 9.3% | 4.3%(+5.06)#60 | 4.3%(+5.09)#2,306 |
| 61. | Hackensack | 9.3% | 4.3%(+5.02)#61 | 4.3%(+5.05)#2,324 |
| 62. | West Concord | 9.3% | 4.3%(+5.00)#62 | 4.3%(+5.03)#2,333 |
| 63. | Ashby | 9.1% | 4.3%(+4.81)#63 | 4.3%(+4.84)#2,402 |
| 64. | Echo | 9.1% | 4.3%(+4.81)#64 | 4.3%(+4.84)#2,412 |
| 65. | Roy Lake | 9.1% | 4.3%(+4.81)#65 | 4.3%(+4.84)#2,427 |
| 66. | Lanesboro | 9.1% | 4.3%(+4.78)#66 | 4.3%(+4.81)#2,433 |
| 67. | Glenwood | 8.9% | 4.3%(+4.61)#67 | 4.3%(+4.64)#2,508 |
| 68. | Minneapolis | 8.8% | 4.3%(+4.47)#68 | 4.3%(+4.50)#2,571 |
| 69. | Grand Rapids | 8.7% | 4.3%(+4.46)#69 | 4.3%(+4.49)#2,575 |
| 70. | St Bonifacius | 8.7% | 4.3%(+4.41)#70 | 4.3%(+4.44)#2,600 |
| 71. | Miltona | 8.5% | 4.3%(+4.23)#71 | 4.3%(+4.26)#2,695 |
| 72. | Sleepy Eye | 8.4% | 4.3%(+4.15)#72 | 4.3%(+4.18)#2,728 |
| 73. | Grand Marais | 8.3% | 4.3%(+4.06)#73 | 4.3%(+4.09)#2,768 |
| 74. | Ruthton | 8.3% | 4.3%(+4.05)#74 | 4.3%(+4.08)#2,793 |
| 75. | Mendota | 8.3% | 4.3%(+4.05)#75 | 4.3%(+4.08)#2,800 |
| 76. | Zemple | 8.3% | 4.3%(+4.05)#76 | 4.3%(+4.08)#2,801 |
| 77. | Iron Junction | 8.3% | 4.3%(+4.05)#77 | 4.3%(+4.08)#2,802 |
| 78. | Tracy | 8.3% | 4.3%(+4.01)#78 | 4.3%(+4.04)#2,816 |
| 79. | Fifty Lakes | 8.2% | 4.3%(+3.95)#79 | 4.3%(+3.98)#2,851 |
| 80. | Taylors Falls | 8.1% | 4.3%(+3.80)#80 | 4.3%(+3.83)#2,919 |
| 81. | Birchwood Village | 8.1% | 4.3%(+3.80)#81 | 4.3%(+3.82)#2,922 |
| 82. | Dakota | 8.1% | 4.3%(+3.78)#82 | 4.3%(+3.81)#2,933 |
| 83. | Orono | 8.0% | 4.3%(+3.74)#83 | 4.3%(+3.77)#2,951 |
| 84. | Ogema | 8.0% | 4.3%(+3.72)#84 | 4.3%(+3.75)#2,976 |
| 85. | Preston | 7.9% | 4.3%(+3.60)#85 | 4.3%(+3.63)#3,037 |
| 86. | Golden Valley | 7.8% | 4.3%(+3.51)#86 | 4.3%(+3.54)#3,089 |
| 87. | Nicollet | 7.8% | 4.3%(+3.50)#87 | 4.3%(+3.53)#3,105 |
| 88. | Comfrey | 7.7% | 4.3%(+3.41)#88 | 4.3%(+3.44)#3,158 |
| 89. | Villard | 7.7% | 4.3%(+3.41)#89 | 4.3%(+3.44)#3,163 |
| 90. | Longville | 7.7% | 4.3%(+3.41)#90 | 4.3%(+3.44)#3,165 |
| 91. | Rock Creek | 7.7% | 4.3%(+3.37)#91 | 4.3%(+3.40)#3,190 |
| 92. | Pine River | 7.6% | 4.3%(+3.33)#92 | 4.3%(+3.36)#3,223 |
| 93. | Kimball | 7.6% | 4.3%(+3.31)#93 | 4.3%(+3.34)#3,238 |
| 94. | Osseo | 7.6% | 4.3%(+3.27)#94 | 4.3%(+3.30)#3,258 |
| 95. | Lauderdale | 7.4% | 4.3%(+3.13)#95 | 4.3%(+3.16)#3,347 |
| 96. | St Paul | 7.4% | 4.3%(+3.12)#96 | 4.3%(+3.15)#3,369 |
| 97. | Perham | 7.3% | 4.3%(+3.06)#97 | 4.3%(+3.09)#3,405 |
| 98. | Ellendale | 7.3% | 4.3%(+3.06)#98 | 4.3%(+3.09)#3,408 |
| 99. | Ostrander | 7.3% | 4.3%(+3.04)#99 | 4.3%(+3.06)#3,433 |
| 100. | Okabena | 7.3% | 4.3%(+2.99)#100 | 4.3%(+3.02)#3,475 |
Common Questions
What are the Top 10 Cities with the Highest Percentage of Population with a Degree in Visual and Performing Arts in Minnesota?
Top 10 Cities with the Highest Percentage of Population with a Degree in Visual and Performing Arts in Minnesota are:
#1
50.0%
#2
50.0%
#3
43.5%
#4
36.8%
#5
33.3%
#6
33.3%
#7
33.3%
#8
28.6%
#9
25.0%
#10
25.0%
What city has the Highest Percentage of Population with a Degree in Visual and Performing Arts in Minnesota?
Holt has the Highest Percentage of Population with a Degree in Visual and Performing Arts in Minnesota with 50.0%.
What is the Percentage of Population with a Degree in Visual and Performing Arts in the State of Minnesota?
Percentage of Population with a Degree in Visual and Performing Arts in Minnesota is 4.3%.
What is the Percentage of Population with a Degree in Visual and Performing Arts in the United States?
Percentage of Population with a Degree in Visual and Performing Arts in the United States is 4.3%.