Zip Codes with the Highest Percentage of Population with a Degree in Visual and Performing Arts in Inglewood, CA
RELATED REPORTS & OPTIONS
Visual and Performing Arts
Inglewood
Compare Zip Codes
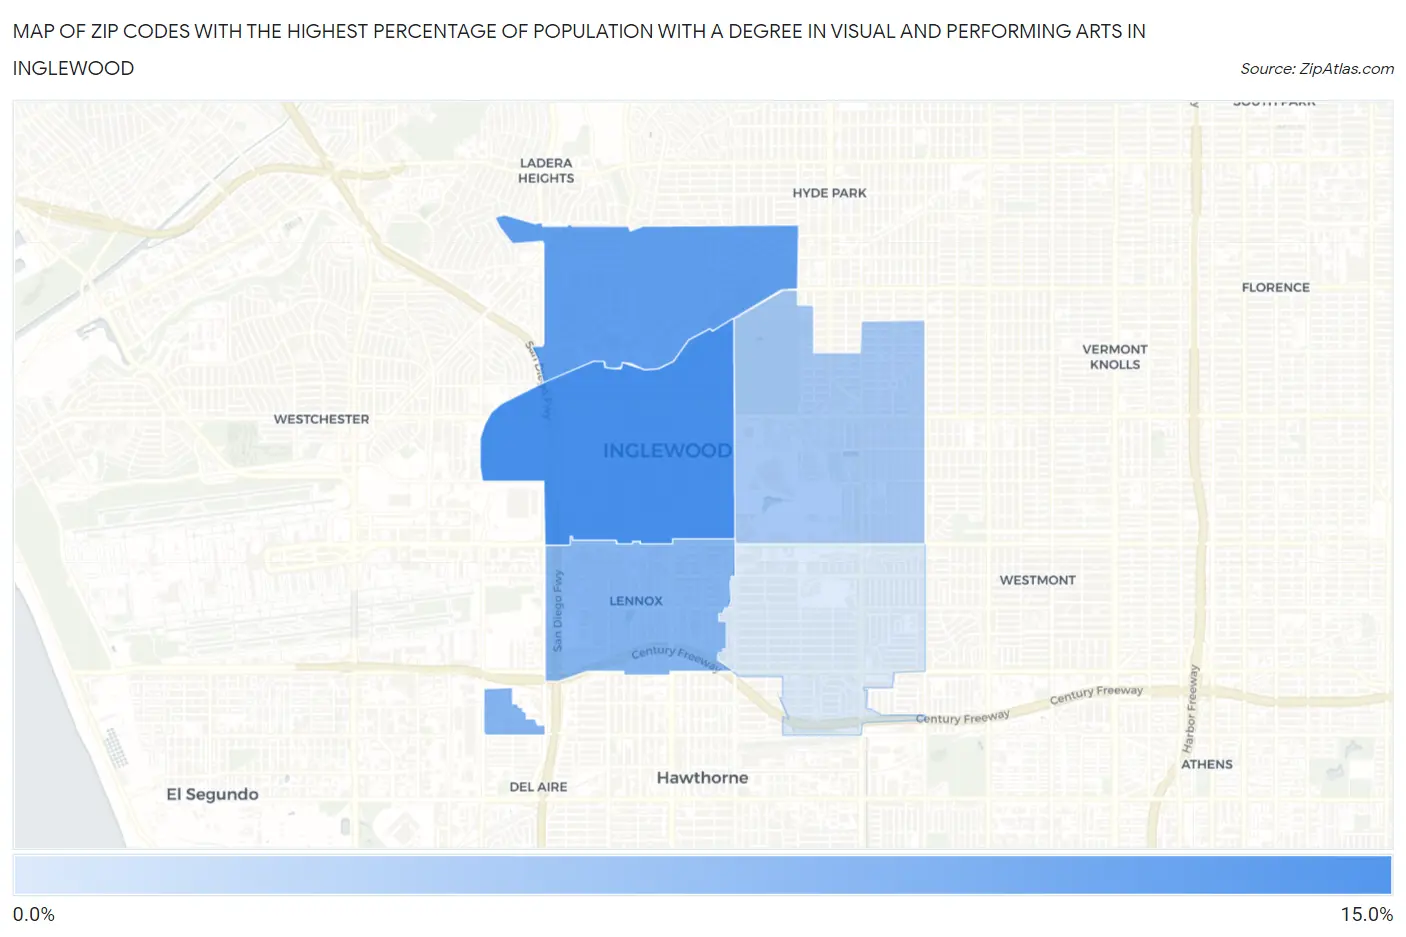
Map of Zip Codes with the Highest Percentage of Population with a Degree in Visual and Performing Arts in Inglewood
3.3%
10.0%
Zip Codes with the Highest Percentage of Population with a Degree in Visual and Performing Arts in Inglewood, CA
| Zip Code | % Graduates | vs State | vs National | |
| 1. | 90301 | 10.0% | 5.7%(+4.27)#198 | 4.3%(+5.75)#1,822 |
| 2. | 90302 | 8.8% | 5.7%(+3.08)#258 | 4.3%(+4.57)#2,346 |
| 3. | 90304 | 7.2% | 5.7%(+1.44)#391 | 4.3%(+2.92)#3,482 |
| 4. | 90305 | 5.7% | 5.7%(-0.055)#546 | 4.3%(+1.43)#5,353 |
| 5. | 90303 | 3.3% | 5.7%(-2.46)#1,038 | 4.3%(-0.969)#11,684 |
1
Common Questions
What are the Top 3 Zip Codes with the Highest Percentage of Population with a Degree in Visual and Performing Arts in Inglewood, CA?
Top 3 Zip Codes with the Highest Percentage of Population with a Degree in Visual and Performing Arts in Inglewood, CA are:
What zip code has the Highest Percentage of Population with a Degree in Visual and Performing Arts in Inglewood, CA?
90301 has the Highest Percentage of Population with a Degree in Visual and Performing Arts in Inglewood, CA with 10.0%.
What is the Percentage of Population with a Degree in Visual and Performing Arts in Inglewood, CA?
Percentage of Population with a Degree in Visual and Performing Arts in Inglewood is 7.7%.
What is the Percentage of Population with a Degree in Visual and Performing Arts in California?
Percentage of Population with a Degree in Visual and Performing Arts in California is 5.7%.
What is the Percentage of Population with a Degree in Visual and Performing Arts in the United States?
Percentage of Population with a Degree in Visual and Performing Arts in the United States is 4.3%.