Zip Codes with the Highest Percentage of Population with a Degree in Visual and Performing Arts in Carson, CA
RELATED REPORTS & OPTIONS
Visual and Performing Arts
Carson
Compare Zip Codes
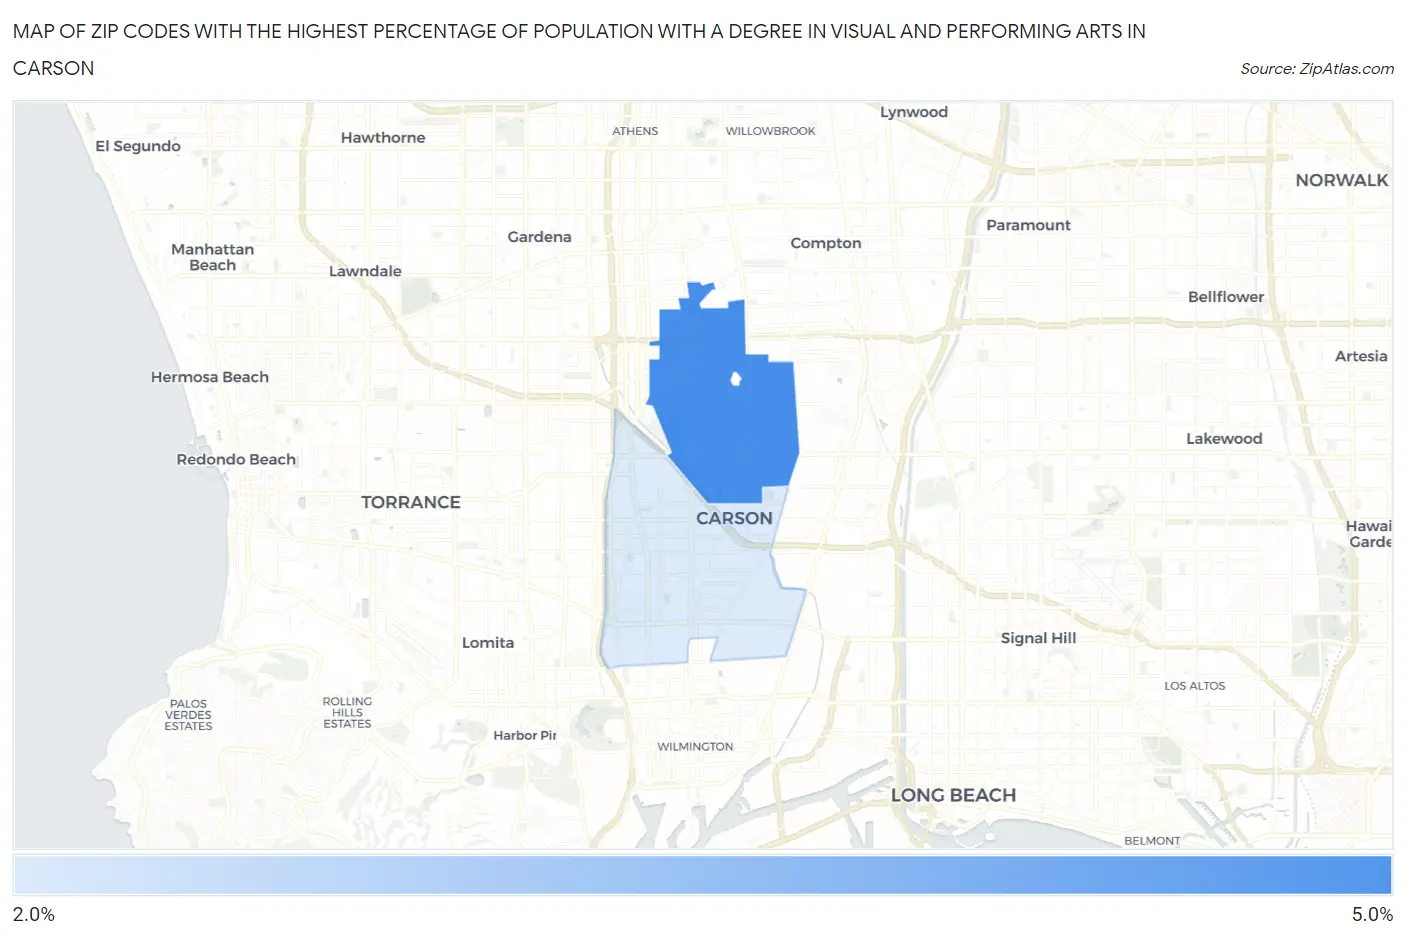
Map of Zip Codes with the Highest Percentage of Population with a Degree in Visual and Performing Arts in Carson
2.9%
4.0%
Zip Codes with the Highest Percentage of Population with a Degree in Visual and Performing Arts in Carson, CA
| Zip Code | % Graduates | vs State | vs National | |
| 1. | 90746 | 4.0% | 5.7%(-1.71)#871 | 4.3%(-0.223)#9,156 |
| 2. | 90745 | 2.9% | 5.7%(-2.87)#1,125 | 4.3%(-1.39)#13,234 |
1
Common Questions
What are the Top Zip Codes with the Highest Percentage of Population with a Degree in Visual and Performing Arts in Carson, CA?
Top Zip Codes with the Highest Percentage of Population with a Degree in Visual and Performing Arts in Carson, CA are:
What zip code has the Highest Percentage of Population with a Degree in Visual and Performing Arts in Carson, CA?
90746 has the Highest Percentage of Population with a Degree in Visual and Performing Arts in Carson, CA with 4.0%.
What is the Percentage of Population with a Degree in Visual and Performing Arts in Carson, CA?
Percentage of Population with a Degree in Visual and Performing Arts in Carson is 3.1%.
What is the Percentage of Population with a Degree in Visual and Performing Arts in California?
Percentage of Population with a Degree in Visual and Performing Arts in California is 5.7%.
What is the Percentage of Population with a Degree in Visual and Performing Arts in the United States?
Percentage of Population with a Degree in Visual and Performing Arts in the United States is 4.3%.