New Cuyama, CA Map & Demographics
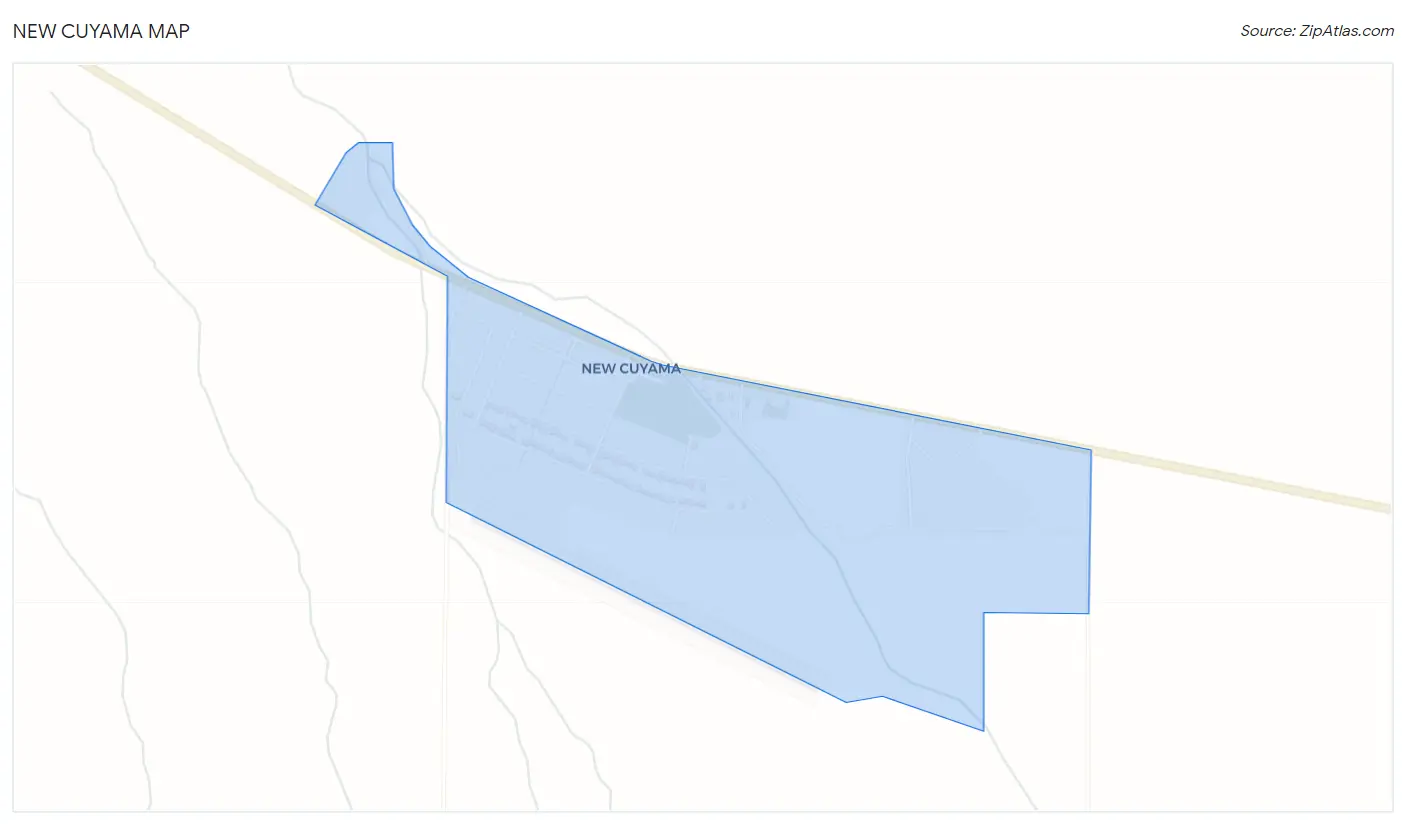
New Cuyama Map
New Cuyama Overview
$23,719
PER CAPITA INCOME
$68,438
AVG FAMILY INCOME
$55,104
AVG HOUSEHOLD INCOME
41.3%
WAGE / INCOME GAP [ % ]
58.7¢/ $1
WAGE / INCOME GAP [ $ ]
0.39
INEQUALITY / GINI INDEX
669
TOTAL POPULATION
320
MALE POPULATION
349
FEMALE POPULATION
91.69
MALES / 100 FEMALES
109.06
FEMALES / 100 MALES
41.3
MEDIAN AGE
3.4
AVG FAMILY SIZE
2.6
AVG HOUSEHOLD SIZE
255
LABOR FORCE [ PEOPLE ]
50.5%
PERCENT IN LABOR FORCE
9.0%
UNEMPLOYMENT RATE
New Cuyama Zip Codes
New Cuyama Area Codes
Income in New Cuyama
Income Overview in New Cuyama
Per Capita Income in New Cuyama is $23,719, while median incomes of families and households are $68,438 and $55,104 respectively.
| Characteristic | Number | Measure |
| Per Capita Income | 669 | $23,719 |
| Median Family Income | 153 | $68,438 |
| Mean Family Income | 153 | $68,725 |
| Median Household Income | 255 | $55,104 |
| Mean Household Income | 255 | $61,995 |
| Income Deficit | 153 | $0 |
| Wage / Income Gap (%) | 669 | 41.27% |
| Wage / Income Gap ($) | 669 | 58.73¢ per $1 |
| Gini / Inequality Index | 669 | 0.39 |
Earnings by Sex in New Cuyama
Average Earnings in New Cuyama are $22,857, $29,444 for men and $17,292 for women, a difference of 41.3%.
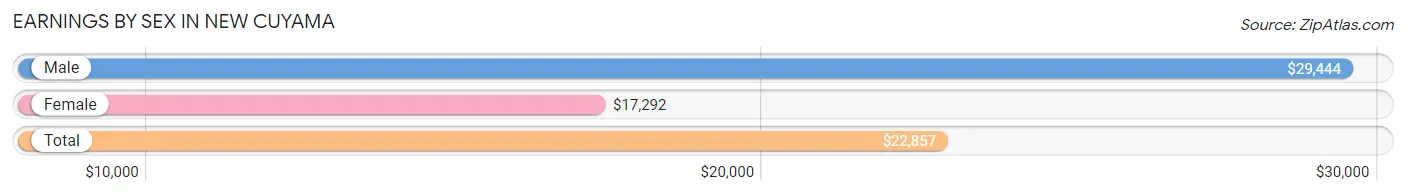
| Sex | Number | Average Earnings |
| Male | 192 (62.7%) | $29,444 |
| Female | 114 (37.2%) | $17,292 |
| Total | 306 (100.0%) | $22,857 |
Earnings by Sex by Income Bracket in New Cuyama
The most common earnings brackets in New Cuyama are $5,000 to $7,499 for men (33 | 17.2%) and $15,000 to $17,499 for women (24 | 21.0%).
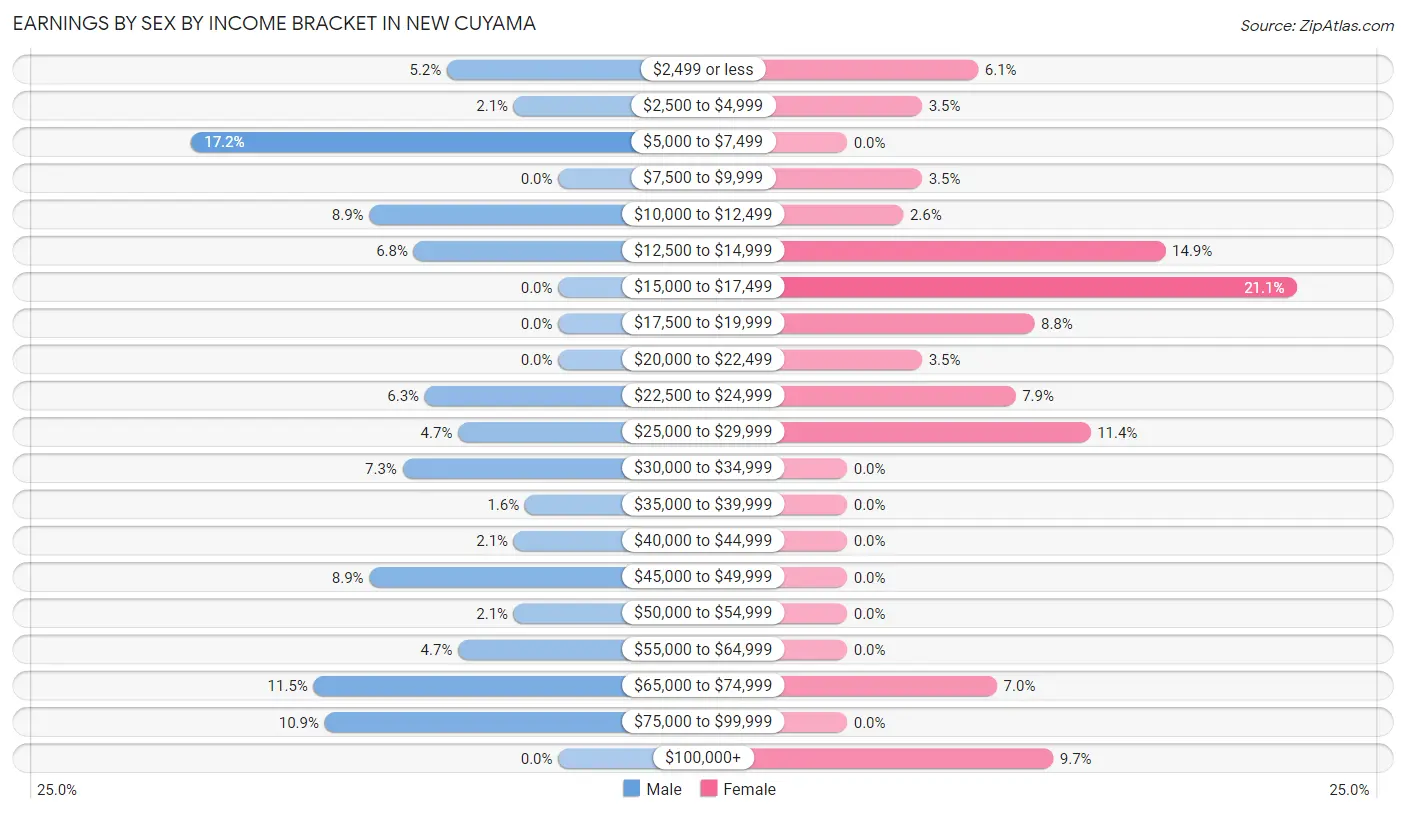
| Income | Male | Female |
| $2,499 or less | 10 (5.2%) | 7 (6.1%) |
| $2,500 to $4,999 | 4 (2.1%) | 4 (3.5%) |
| $5,000 to $7,499 | 33 (17.2%) | 0 (0.0%) |
| $7,500 to $9,999 | 0 (0.0%) | 4 (3.5%) |
| $10,000 to $12,499 | 17 (8.8%) | 3 (2.6%) |
| $12,500 to $14,999 | 13 (6.8%) | 17 (14.9%) |
| $15,000 to $17,499 | 0 (0.0%) | 24 (21.0%) |
| $17,500 to $19,999 | 0 (0.0%) | 10 (8.8%) |
| $20,000 to $22,499 | 0 (0.0%) | 4 (3.5%) |
| $22,500 to $24,999 | 12 (6.2%) | 9 (7.9%) |
| $25,000 to $29,999 | 9 (4.7%) | 13 (11.4%) |
| $30,000 to $34,999 | 14 (7.3%) | 0 (0.0%) |
| $35,000 to $39,999 | 3 (1.6%) | 0 (0.0%) |
| $40,000 to $44,999 | 4 (2.1%) | 0 (0.0%) |
| $45,000 to $49,999 | 17 (8.8%) | 0 (0.0%) |
| $50,000 to $54,999 | 4 (2.1%) | 0 (0.0%) |
| $55,000 to $64,999 | 9 (4.7%) | 0 (0.0%) |
| $65,000 to $74,999 | 22 (11.5%) | 8 (7.0%) |
| $75,000 to $99,999 | 21 (10.9%) | 0 (0.0%) |
| $100,000+ | 0 (0.0%) | 11 (9.7%) |
| Total | 192 (100.0%) | 114 (100.0%) |
Earnings by Sex by Educational Attainment in New Cuyama
Average earnings in New Cuyama are $45,192 for men and $17,292 for women, a difference of 61.7%. Men with an educational attainment of high school diploma enjoy the highest average annual earnings of $50,938, while those with high school diploma education earn the least with $50,938. Women with an educational attainment of high school diploma earn the most with the average annual earnings of $13,654, while those with high school diploma education have the smallest earnings of $13,654.
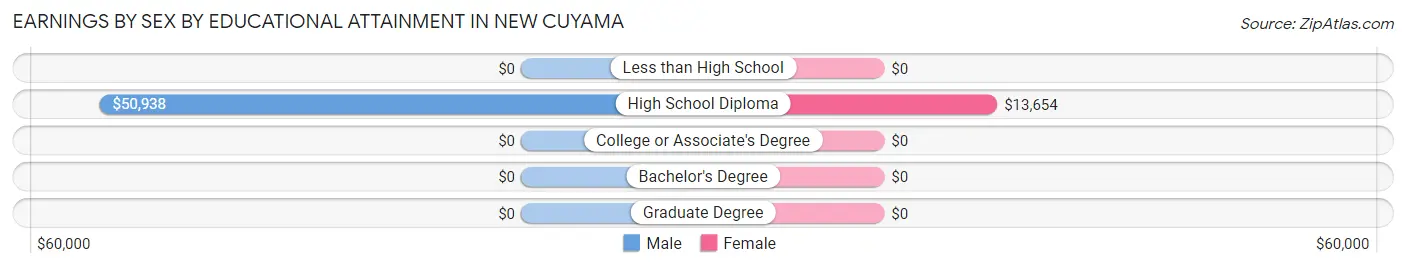
| Educational Attainment | Male Income | Female Income |
| Less than High School | - | - |
| High School Diploma | $50,938 | $13,654 |
| College or Associate's Degree | - | - |
| Bachelor's Degree | - | - |
| Graduate Degree | - | - |
| Total | $45,192 | $17,292 |
Family Income in New Cuyama
Family Income Brackets in New Cuyama
According to the New Cuyama family income data, there are 48 families falling into the $50,000 to $74,999 income range, which is the most common income bracket and makes up 31.4% of all families.
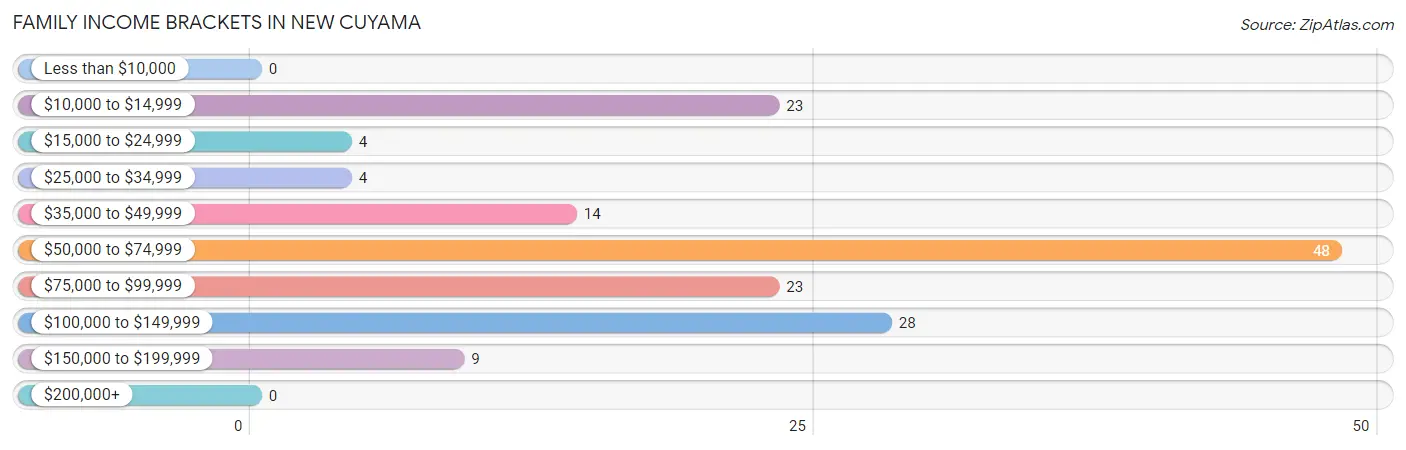
| Income Bracket | # Families | % Families |
| Less than $10,000 | 0 | 0.0% |
| $10,000 to $14,999 | 23 | 15.0% |
| $15,000 to $24,999 | 4 | 2.6% |
| $25,000 to $34,999 | 4 | 2.6% |
| $35,000 to $49,999 | 14 | 9.2% |
| $50,000 to $74,999 | 48 | 31.4% |
| $75,000 to $99,999 | 23 | 15.0% |
| $100,000 to $149,999 | 28 | 18.3% |
| $150,000 to $199,999 | 9 | 5.9% |
| $200,000+ | 0 | 0.0% |
Family Income by Famaliy Size in New Cuyama
3-person families (22 | 14.4%) account for the highest median family income in New Cuyama with $109,500 per family, while 3-person families (22 | 14.4%) have the highest median income of $36,500 per family member.
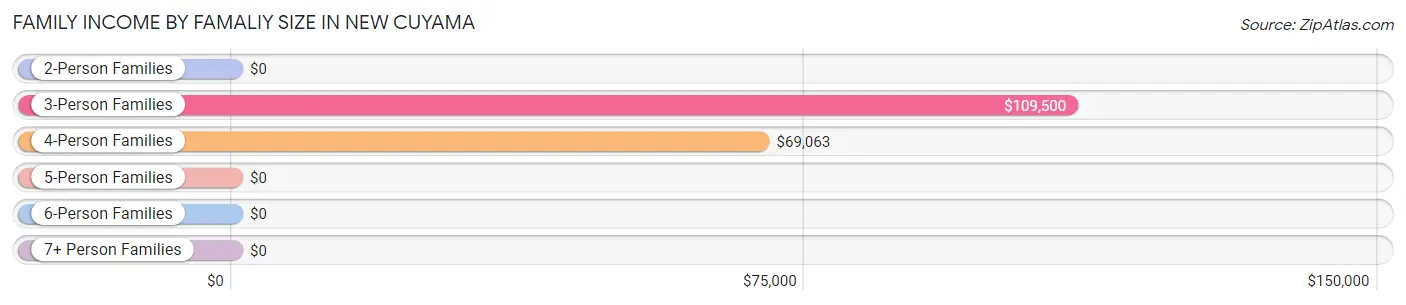
| Income Bracket | # Families | Median Income |
| 2-Person Families | 65 (42.5%) | $0 |
| 3-Person Families | 22 (14.4%) | $109,500 |
| 4-Person Families | 31 (20.3%) | $69,063 |
| 5-Person Families | 26 (17.0%) | $0 |
| 6-Person Families | 9 (5.9%) | $0 |
| 7+ Person Families | 0 (0.0%) | $0 |
| Total | 153 (100.0%) | $68,438 |
Family Income by Number of Earners in New Cuyama
The median family income in New Cuyama is $68,438, with families comprising 2 earners (67) having the highest median family income of $103,375, while families with no earners (27) have the lowest median family income of $11,688, accounting for 43.8% and 17.6% of families, respectively.
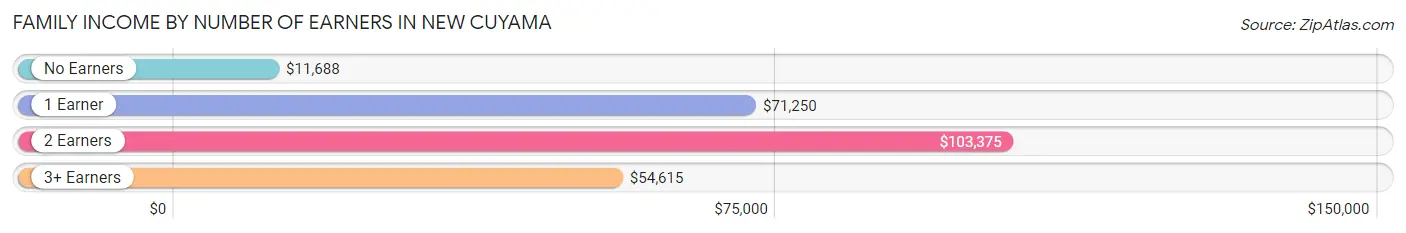
| Number of Earners | # Families | Median Income |
| No Earners | 27 (17.6%) | $11,688 |
| 1 Earner | 37 (24.2%) | $71,250 |
| 2 Earners | 67 (43.8%) | $103,375 |
| 3+ Earners | 22 (14.4%) | $54,615 |
| Total | 153 (100.0%) | $68,438 |
Household Income in New Cuyama
Household Income Brackets in New Cuyama
With 85 households falling in the category, the $50,000 to $74,999 income range is the most frequent in New Cuyama, accounting for 33.3% of all households.
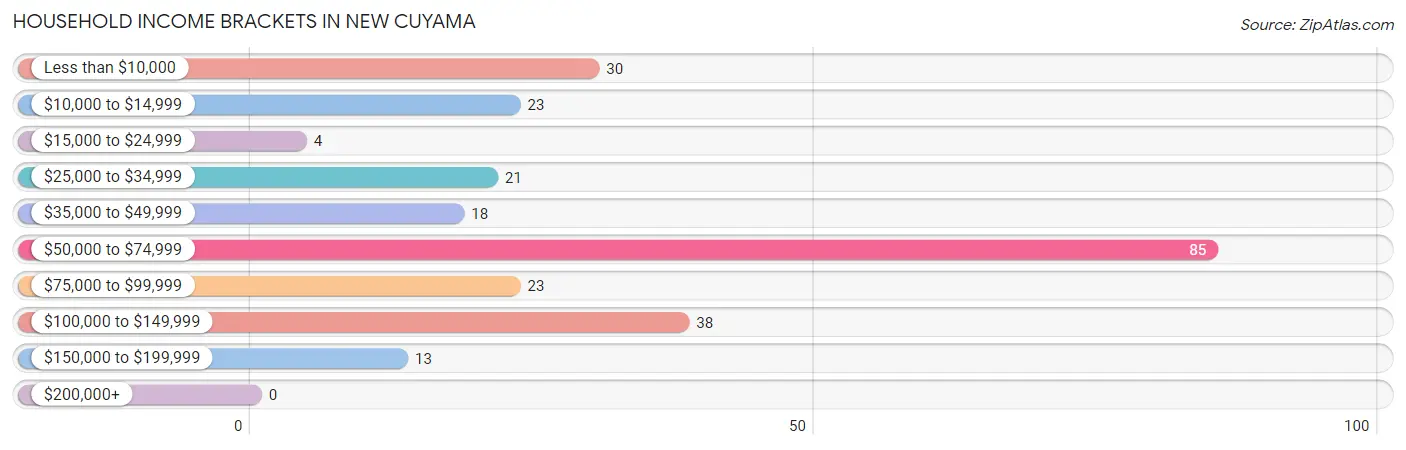
| Income Bracket | # Households | % Households |
| Less than $10,000 | 30 | 11.8% |
| $10,000 to $14,999 | 23 | 9.0% |
| $15,000 to $24,999 | 4 | 1.6% |
| $25,000 to $34,999 | 21 | 8.2% |
| $35,000 to $49,999 | 18 | 7.1% |
| $50,000 to $74,999 | 85 | 33.3% |
| $75,000 to $99,999 | 23 | 9.0% |
| $100,000 to $149,999 | 38 | 14.9% |
| $150,000 to $199,999 | 13 | 5.1% |
| $200,000+ | 0 | 0.0% |
Household Income by Householder Age in New Cuyama
The median household income in New Cuyama is $55,104, with the highest median household income of $64,688 found in the 45 to 64 years age bracket for the primary householder. A total of 131 households (51.4%) fall into this category. Meanwhile, the 15 to 24 years age bracket for the primary householder has the lowest median household income of $0, with 13 households (5.1%) in this group.
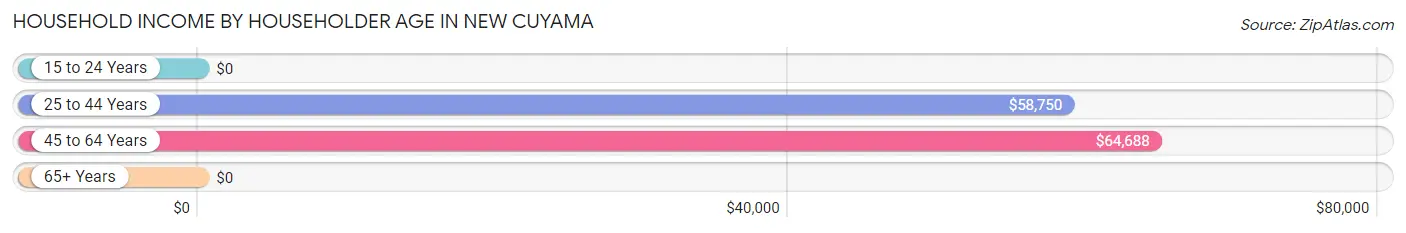
| Income Bracket | # Households | Median Income |
| 15 to 24 Years | 13 (5.1%) | $0 |
| 25 to 44 Years | 34 (13.3%) | $58,750 |
| 45 to 64 Years | 131 (51.4%) | $64,688 |
| 65+ Years | 77 (30.2%) | $0 |
| Total | 255 (100.0%) | $55,104 |
Poverty in New Cuyama
Income Below Poverty by Sex and Age in New Cuyama
With 15.3% poverty level for males and 18.3% for females among the residents of New Cuyama, 65 to 74 year old males and 65 to 74 year old females are the most vulnerable to poverty, with 32 males (59.3%) and 32 females (56.1%) in their respective age groups living below the poverty level.
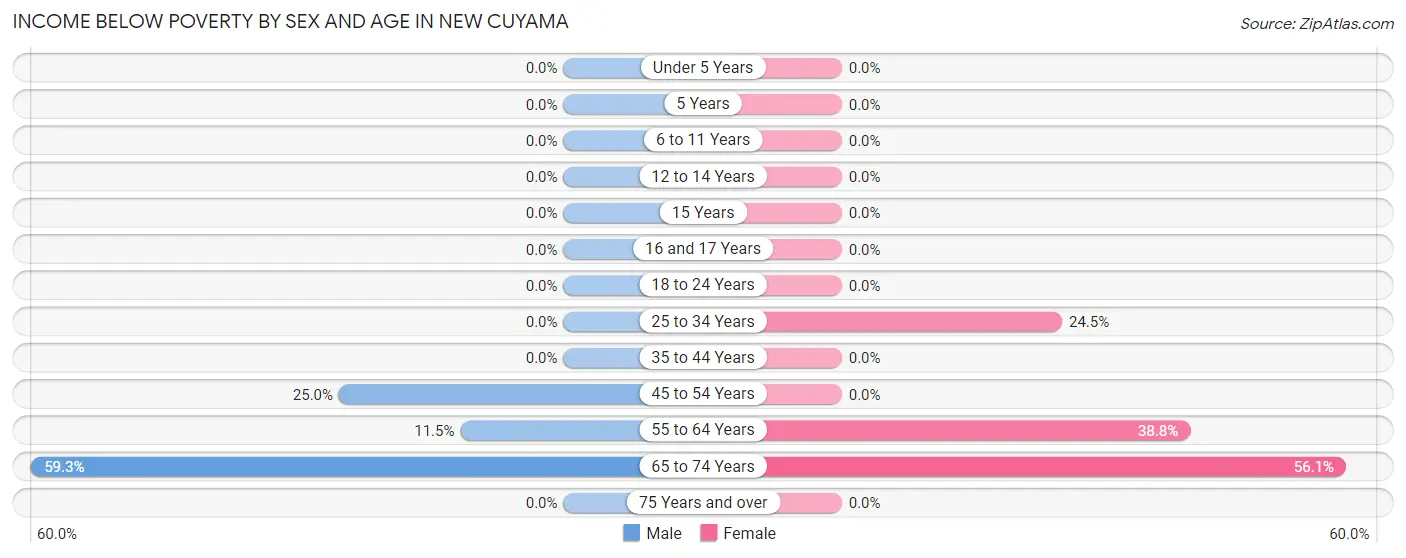
| Age Bracket | Male | Female |
| Under 5 Years | 0 (0.0%) | 0 (0.0%) |
| 5 Years | 0 (0.0%) | 0 (0.0%) |
| 6 to 11 Years | 0 (0.0%) | 0 (0.0%) |
| 12 to 14 Years | 0 (0.0%) | 0 (0.0%) |
| 15 Years | 0 (0.0%) | 0 (0.0%) |
| 16 and 17 Years | 0 (0.0%) | 0 (0.0%) |
| 18 to 24 Years | 0 (0.0%) | 0 (0.0%) |
| 25 to 34 Years | 0 (0.0%) | 13 (24.5%) |
| 35 to 44 Years | 0 (0.0%) | 0 (0.0%) |
| 45 to 54 Years | 10 (25.0%) | 0 (0.0%) |
| 55 to 64 Years | 7 (11.5%) | 19 (38.8%) |
| 65 to 74 Years | 32 (59.3%) | 32 (56.1%) |
| 75 Years and over | 0 (0.0%) | 0 (0.0%) |
| Total | 49 (15.3%) | 64 (18.3%) |
Income Above Poverty by Sex and Age in New Cuyama
According to the poverty statistics in New Cuyama, males aged under 5 years and females aged under 5 years are the age groups that are most secure financially, with 100.0% of males and 100.0% of females in these age groups living above the poverty line.
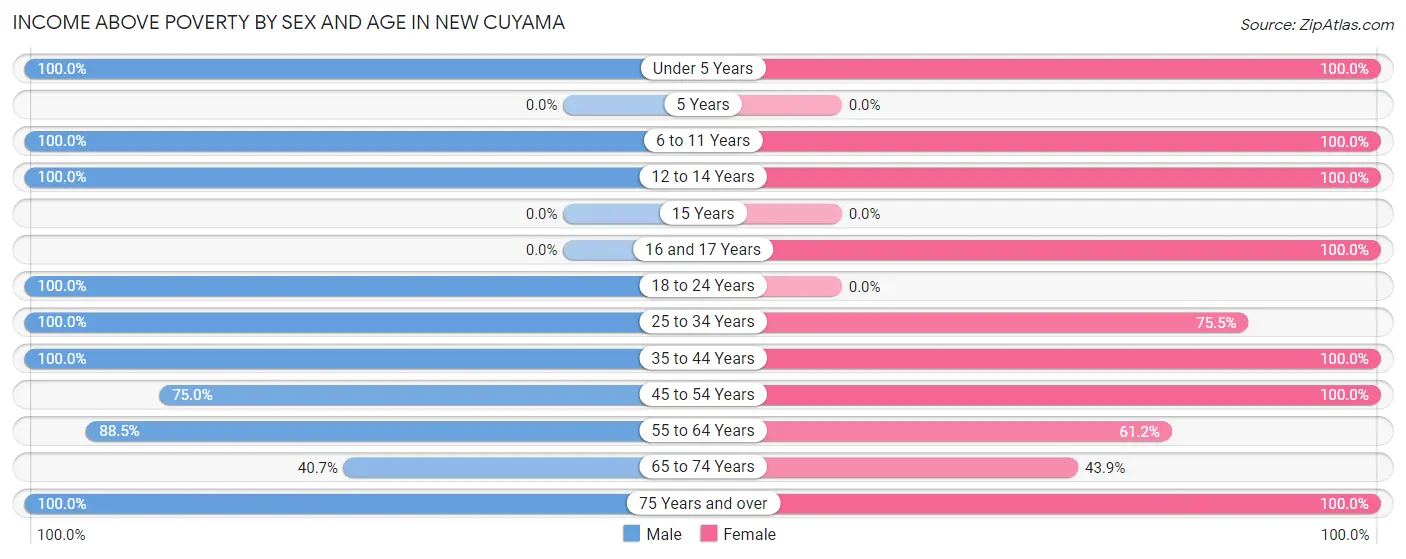
| Age Bracket | Male | Female |
| Under 5 Years | 16 (100.0%) | 57 (100.0%) |
| 5 Years | 0 (0.0%) | 0 (0.0%) |
| 6 to 11 Years | 18 (100.0%) | 34 (100.0%) |
| 12 to 14 Years | 13 (100.0%) | 26 (100.0%) |
| 15 Years | 0 (0.0%) | 0 (0.0%) |
| 16 and 17 Years | 0 (0.0%) | 4 (100.0%) |
| 18 to 24 Years | 61 (100.0%) | 0 (0.0%) |
| 25 to 34 Years | 17 (100.0%) | 40 (75.5%) |
| 35 to 44 Years | 33 (100.0%) | 8 (100.0%) |
| 45 to 54 Years | 30 (75.0%) | 44 (100.0%) |
| 55 to 64 Years | 54 (88.5%) | 30 (61.2%) |
| 65 to 74 Years | 22 (40.7%) | 25 (43.9%) |
| 75 Years and over | 7 (100.0%) | 17 (100.0%) |
| Total | 271 (84.7%) | 285 (81.7%) |
Income Below Poverty Among Married-Couple Families in New Cuyama
The poverty statistics for married-couple families in New Cuyama show that 3.3% or 3 of the total 92 families live below the poverty line. Families with no children have the highest poverty rate of 5.7%, comprising of 3 families. On the other hand, families with 1 or 2 children have the lowest poverty rate of 0.0%, which includes 0 families.
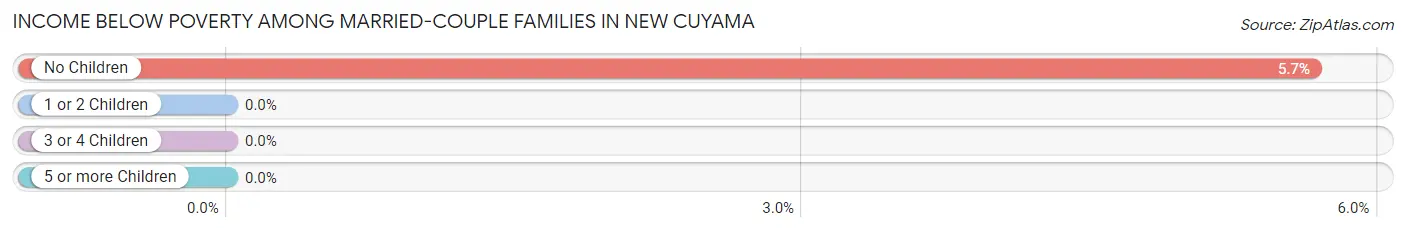
| Children | Above Poverty | Below Poverty |
| No Children | 50 (94.3%) | 3 (5.7%) |
| 1 or 2 Children | 12 (100.0%) | 0 (0.0%) |
| 3 or 4 Children | 27 (100.0%) | 0 (0.0%) |
| 5 or more Children | 0 (0.0%) | 0 (0.0%) |
| Total | 89 (96.7%) | 3 (3.3%) |
Income Below Poverty Among Single-Parent Households in New Cuyama
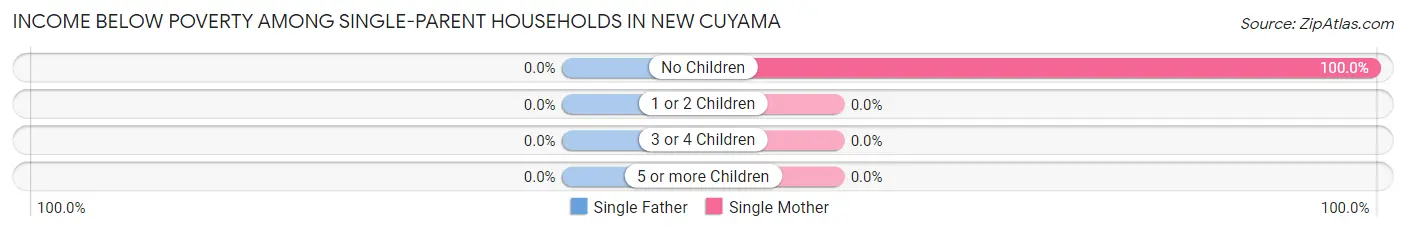
| Children | Single Father | Single Mother |
| No Children | 0 (0.0%) | 20 (100.0%) |
| 1 or 2 Children | 0 (0.0%) | 0 (0.0%) |
| 3 or 4 Children | 0 (0.0%) | 0 (0.0%) |
| 5 or more Children | 0 (0.0%) | 0 (0.0%) |
| Total | 0 (0.0%) | 20 (71.4%) |
Income Below Poverty Among Married-Couple vs Single-Parent Households in New Cuyama
The poverty data for New Cuyama shows that 3 of the married-couple family households (3.3%) and 20 of the single-parent households (32.8%) are living below the poverty level. Within the married-couple family households, those with no children have the highest poverty rate, with 3 households (5.7%) falling below the poverty line. Among the single-parent households, those with no children have the highest poverty rate, with 20 household (100.0%) living below poverty.
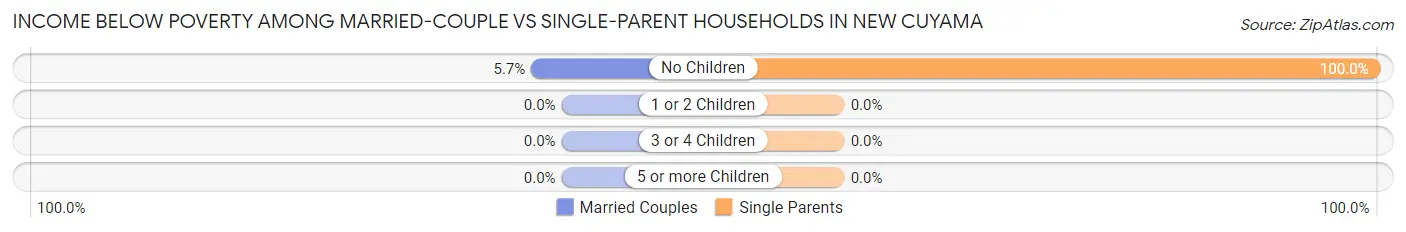
| Children | Married-Couple Families | Single-Parent Households |
| No Children | 3 (5.7%) | 20 (100.0%) |
| 1 or 2 Children | 0 (0.0%) | 0 (0.0%) |
| 3 or 4 Children | 0 (0.0%) | 0 (0.0%) |
| 5 or more Children | 0 (0.0%) | 0 (0.0%) |
| Total | 3 (3.3%) | 20 (32.8%) |
Race in New Cuyama
The most populous races in New Cuyama are White / Caucasian (402 | 60.1%), Hispanic or Latino (348 | 52.0%), and Two or more Races (119 | 17.8%).
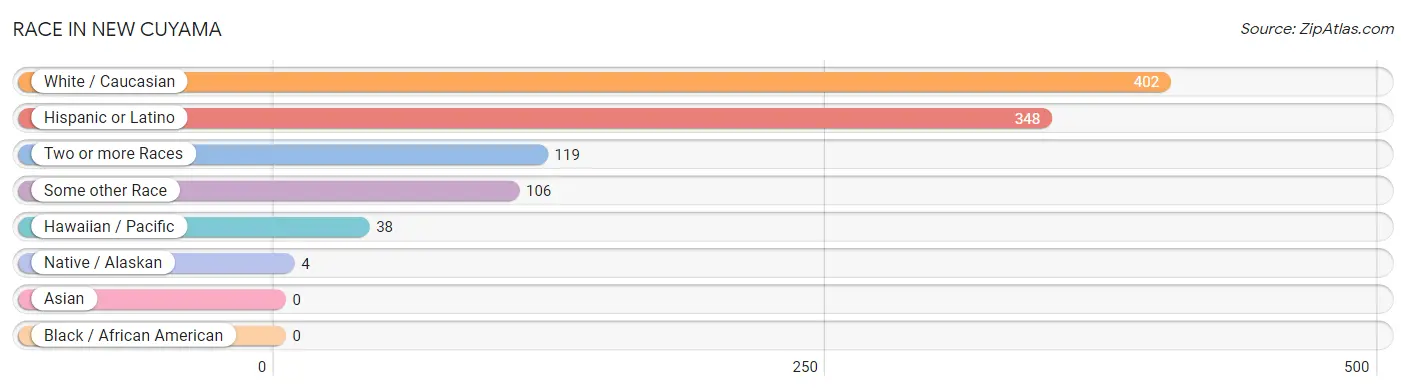
| Race | # Population | % Population |
| Asian | 0 | 0.0% |
| Black / African American | 0 | 0.0% |
| Hawaiian / Pacific | 38 | 5.7% |
| Hispanic or Latino | 348 | 52.0% |
| Native / Alaskan | 4 | 0.6% |
| White / Caucasian | 402 | 60.1% |
| Two or more Races | 119 | 17.8% |
| Some other Race | 106 | 15.8% |
| Total | 669 | 100.0% |
Ancestry in New Cuyama
The most populous ancestries reported in New Cuyama are Mexican (306 | 45.7%), German (48 | 7.2%), Puerto Rican (42 | 6.3%), English (40 | 6.0%), and Irish (38 | 5.7%), together accounting for 70.8% of all New Cuyama residents.
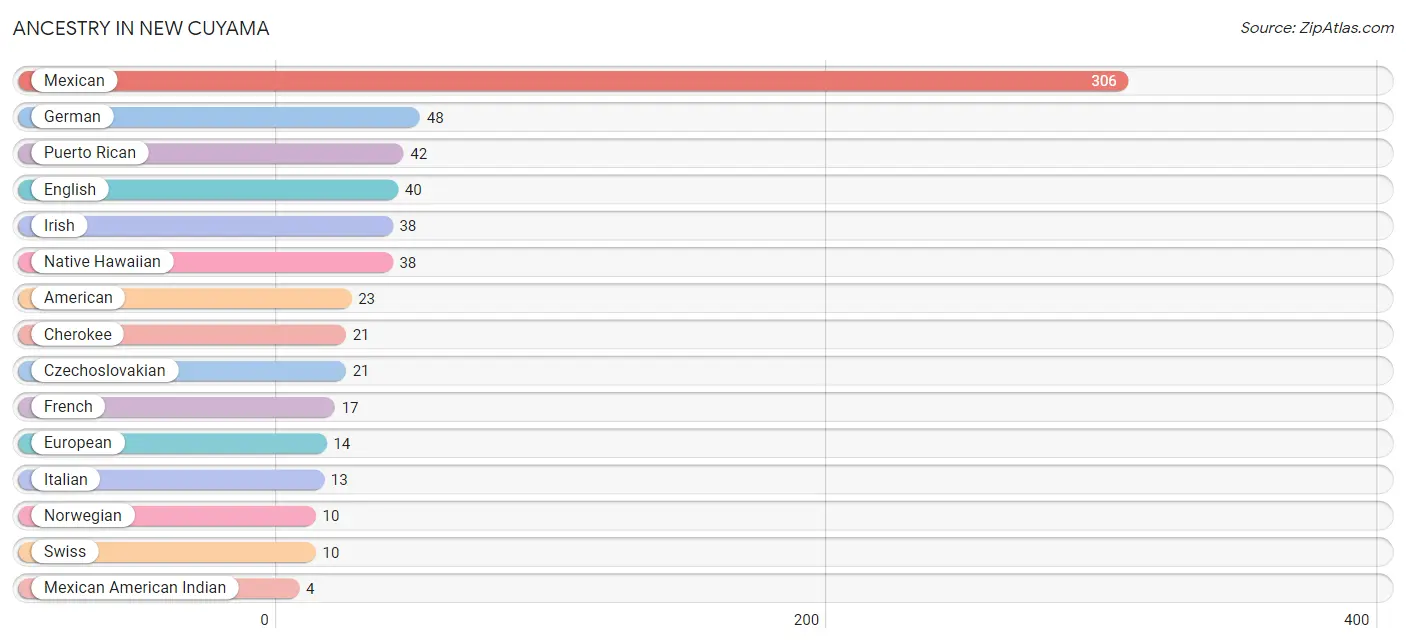
| Ancestry | # Population | % Population |
| American | 23 | 3.4% |
| Cherokee | 21 | 3.1% |
| Czechoslovakian | 21 | 3.1% |
| Dutch | 3 | 0.4% |
| English | 40 | 6.0% |
| European | 14 | 2.1% |
| French | 17 | 2.5% |
| German | 48 | 7.2% |
| Irish | 38 | 5.7% |
| Italian | 13 | 1.9% |
| Mexican | 306 | 45.7% |
| Mexican American Indian | 4 | 0.6% |
| Native Hawaiian | 38 | 5.7% |
| Norwegian | 10 | 1.5% |
| Puerto Rican | 42 | 6.3% |
| Romanian | 4 | 0.6% |
| Swiss | 10 | 1.5% | View All 17 Rows |
Immigrants in New Cuyama
The most numerous immigrant groups reported in New Cuyama came from Central America (85 | 12.7%), Latin America (85 | 12.7%), and Mexico (85 | 12.7%), together accounting for 38.1% of all New Cuyama residents.
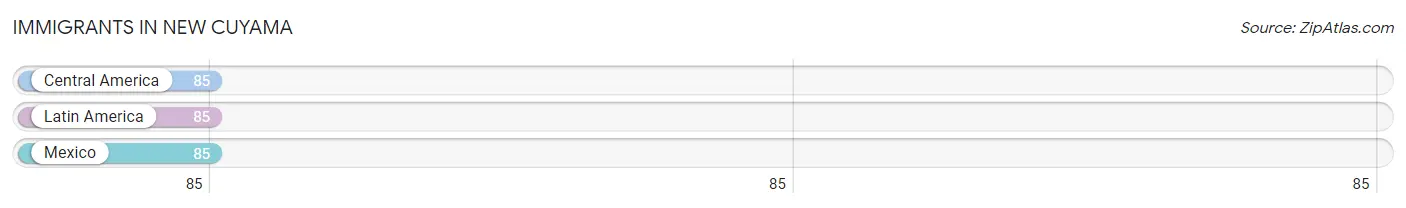
| Immigration Origin | # Population | % Population |
| Central America | 85 | 12.7% |
| Latin America | 85 | 12.7% |
| Mexico | 85 | 12.7% | View All 3 Rows |
Sex and Age in New Cuyama
Sex and Age in New Cuyama
The most populous age groups in New Cuyama are 20 to 24 Years (38 | 11.9%) for men and Under 5 Years (57 | 16.3%) for women.
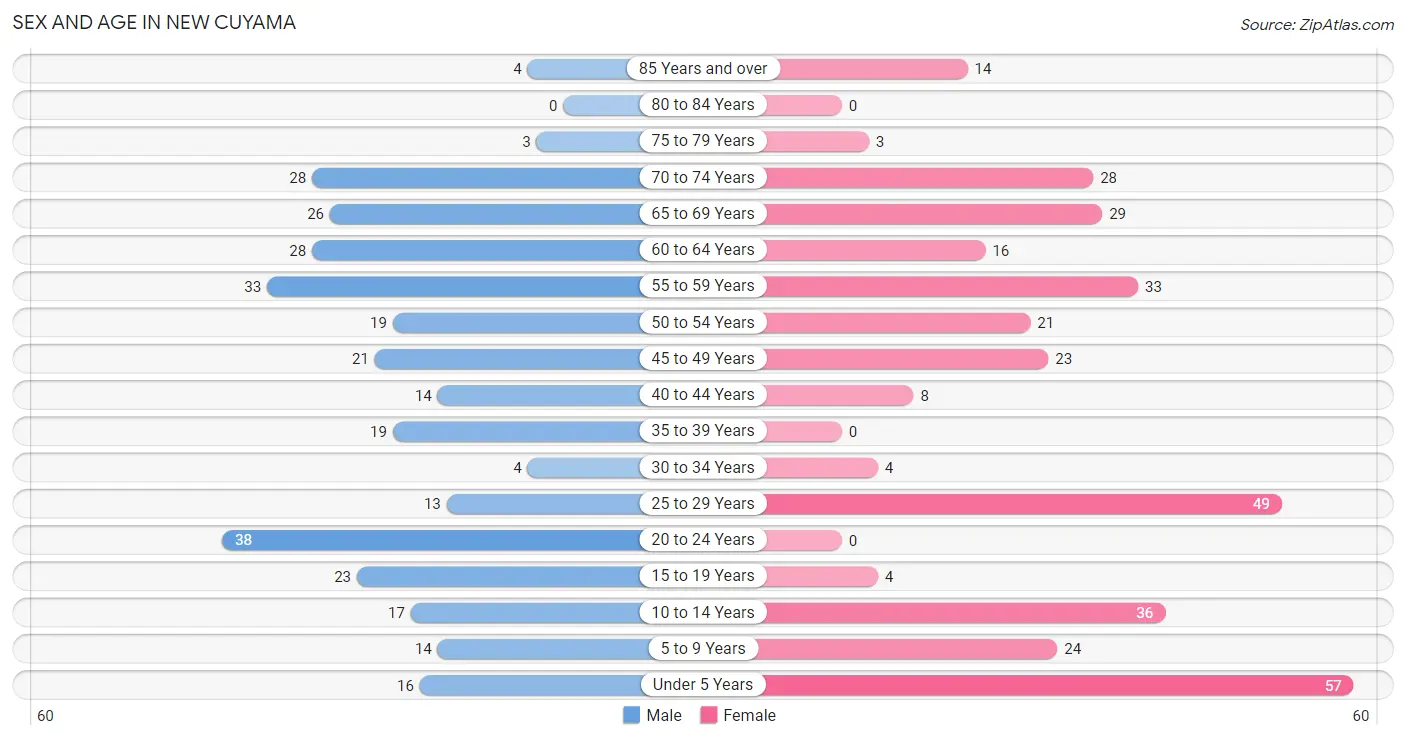
| Age Bracket | Male | Female |
| Under 5 Years | 16 (5.0%) | 57 (16.3%) |
| 5 to 9 Years | 14 (4.4%) | 24 (6.9%) |
| 10 to 14 Years | 17 (5.3%) | 36 (10.3%) |
| 15 to 19 Years | 23 (7.2%) | 4 (1.1%) |
| 20 to 24 Years | 38 (11.9%) | 0 (0.0%) |
| 25 to 29 Years | 13 (4.1%) | 49 (14.0%) |
| 30 to 34 Years | 4 (1.3%) | 4 (1.1%) |
| 35 to 39 Years | 19 (5.9%) | 0 (0.0%) |
| 40 to 44 Years | 14 (4.4%) | 8 (2.3%) |
| 45 to 49 Years | 21 (6.6%) | 23 (6.6%) |
| 50 to 54 Years | 19 (5.9%) | 21 (6.0%) |
| 55 to 59 Years | 33 (10.3%) | 33 (9.5%) |
| 60 to 64 Years | 28 (8.7%) | 16 (4.6%) |
| 65 to 69 Years | 26 (8.1%) | 29 (8.3%) |
| 70 to 74 Years | 28 (8.7%) | 28 (8.0%) |
| 75 to 79 Years | 3 (0.9%) | 3 (0.9%) |
| 80 to 84 Years | 0 (0.0%) | 0 (0.0%) |
| 85 Years and over | 4 (1.3%) | 14 (4.0%) |
| Total | 320 (100.0%) | 349 (100.0%) |
Families and Households in New Cuyama
Median Family Size in New Cuyama
The median family size in New Cuyama is 3.39 persons per family, with married-couple families (92 | 60.1%) accounting for the largest median family size of 3.53 persons per family. On the other hand, single male/father families (33 | 21.6%) represent the smallest median family size with 3.18 persons per family.
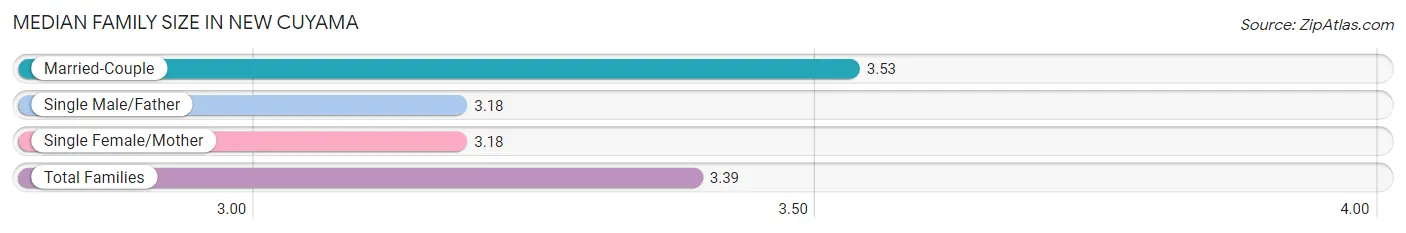
| Family Type | # Families | Family Size |
| Married-Couple | 92 (60.1%) | 3.53 |
| Single Male/Father | 33 (21.6%) | 3.18 |
| Single Female/Mother | 28 (18.3%) | 3.18 |
| Total Families | 153 (100.0%) | 3.39 |
Median Household Size in New Cuyama
The median household size in New Cuyama is 2.62 persons per household, with single female/mother households (28 | 11.0%) accounting for the largest median household size of 3.54 persons per household. non-family households (102 | 40.0%) represent the smallest median household size with 1.37 persons per household.
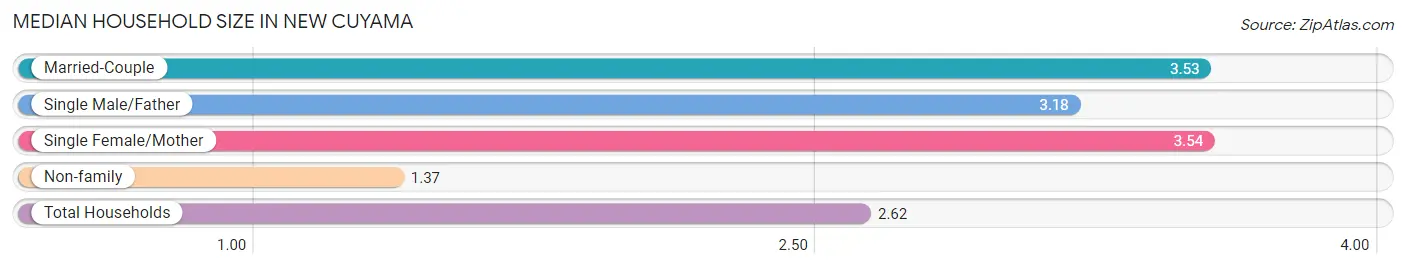
| Household Type | # Households | Household Size |
| Married-Couple | 92 (36.1%) | 3.53 |
| Single Male/Father | 33 (12.9%) | 3.18 |
| Single Female/Mother | 28 (11.0%) | 3.54 |
| Non-family | 102 (40.0%) | 1.37 |
| Total Households | 255 (100.0%) | 2.62 |
Household Size by Marriage Status in New Cuyama
Out of a total of 255 households in New Cuyama, 153 (60.0%) are family households, while 102 (40.0%) are nonfamily households. The most numerous type of family households are 2-person households, comprising 65, and the most common type of nonfamily households are 1-person households, comprising 68.
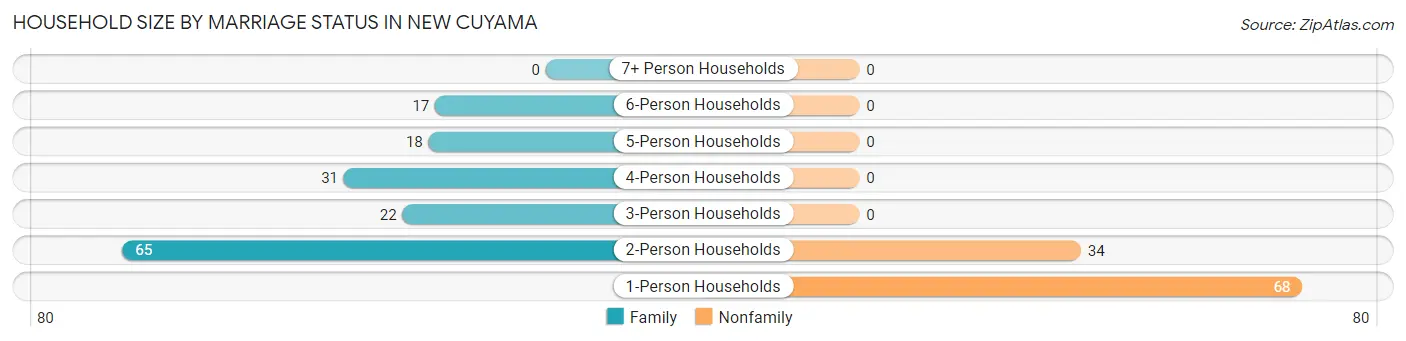
| Household Size | Family Households | Nonfamily Households |
| 1-Person Households | - | 68 (26.7%) |
| 2-Person Households | 65 (25.5%) | 34 (13.3%) |
| 3-Person Households | 22 (8.6%) | 0 (0.0%) |
| 4-Person Households | 31 (12.2%) | 0 (0.0%) |
| 5-Person Households | 18 (7.1%) | 0 (0.0%) |
| 6-Person Households | 17 (6.7%) | 0 (0.0%) |
| 7+ Person Households | 0 (0.0%) | 0 (0.0%) |
| Total | 153 (60.0%) | 102 (40.0%) |
Female Fertility in New Cuyama
Fertility by Age in New Cuyama
Average fertility rate in New Cuyama is 114.0 births per 1,000 women. Women in the age bracket of 20 to 34 years have the highest fertility rate with 189.0 births per 1,000 women. Women in the age bracket of 20 to 34 years acount for 100.0% of all women with births.
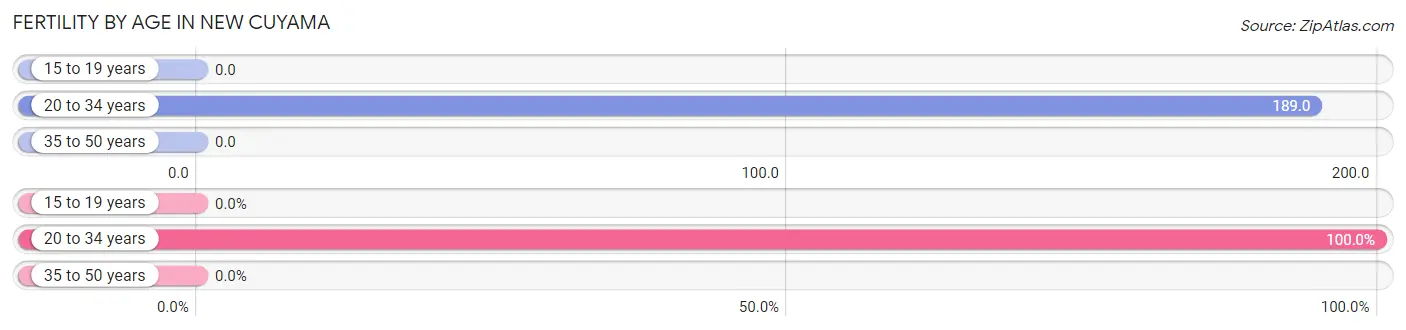
| Age Bracket | Women with Births | Births / 1,000 Women |
| 15 to 19 years | 0 (0.0%) | 0.0 |
| 20 to 34 years | 10 (100.0%) | 189.0 |
| 35 to 50 years | 0 (0.0%) | 0.0 |
| Total | 10 (100.0%) | 114.0 |
Fertility by Age by Marriage Status in New Cuyama
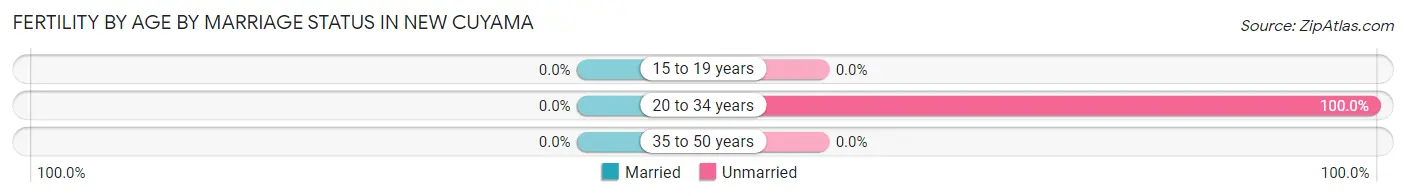
| Age Bracket | Married | Unmarried |
| 15 to 19 years | 0 (0.0%) | 0 (0.0%) |
| 20 to 34 years | 0 (0.0%) | 10 (100.0%) |
| 35 to 50 years | 0 (0.0%) | 0 (0.0%) |
| Total | 0 (0.0%) | 10 (100.0%) |
Fertility by Education in New Cuyama
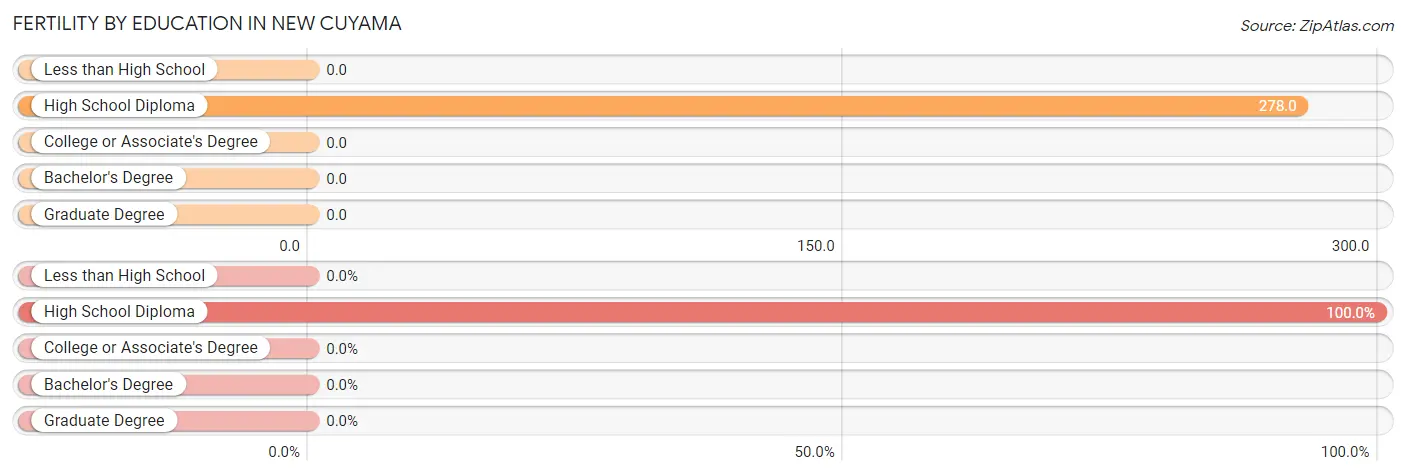
| Educational Attainment | Women with Births | Births / 1,000 Women |
| Less than High School | 0 (0.0%) | 0.0 |
| High School Diploma | 10 (100.0%) | 278.0 |
| College or Associate's Degree | 0 (0.0%) | 0.0 |
| Bachelor's Degree | 0 (0.0%) | 0.0 |
| Graduate Degree | 0 (0.0%) | 0.0 |
| Total | 10 (100.0%) | 114.0 |
Fertility by Education by Marriage Status in New Cuyama
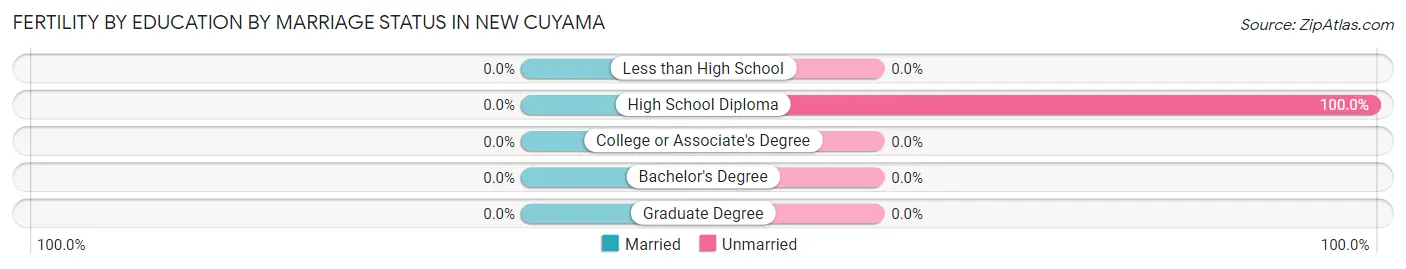
| Educational Attainment | Married | Unmarried |
| Less than High School | 0 (0.0%) | 0 (0.0%) |
| High School Diploma | 0 (0.0%) | 10 (100.0%) |
| College or Associate's Degree | 0 (0.0%) | 0 (0.0%) |
| Bachelor's Degree | 0 (0.0%) | 0 (0.0%) |
| Graduate Degree | 0 (0.0%) | 0 (0.0%) |
| Total | 0 (0.0%) | 10 (100.0%) |
Employment Characteristics in New Cuyama
Employment by Class of Employer in New Cuyama
Among the 214 employed individuals in New Cuyama, private company employees (126 | 58.9%), local government employees (30 | 14.0%), and self-employed (not incorporated) (26 | 12.1%) make up the most common classes of employment.
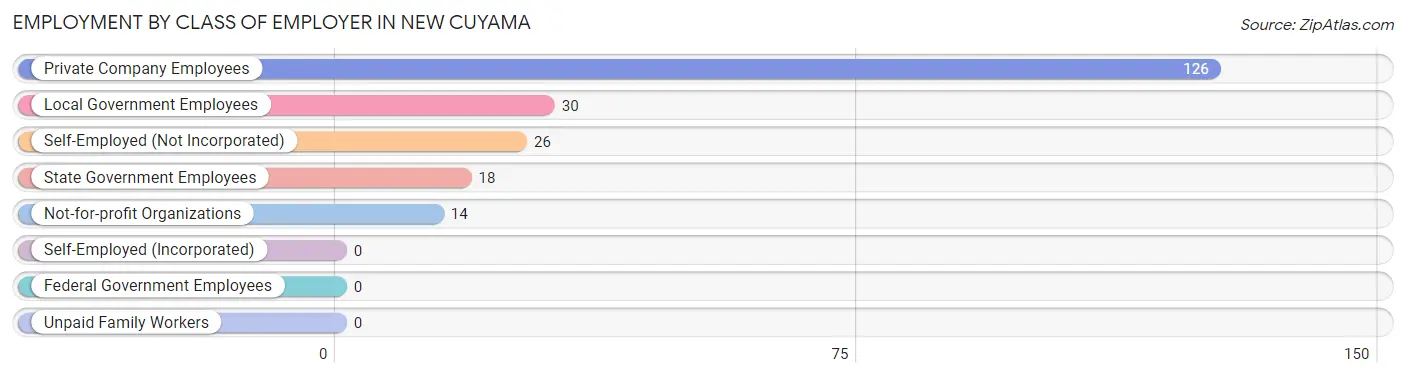
| Employer Class | # Employees | % Employees |
| Private Company Employees | 126 | 58.9% |
| Self-Employed (Incorporated) | 0 | 0.0% |
| Self-Employed (Not Incorporated) | 26 | 12.1% |
| Not-for-profit Organizations | 14 | 6.5% |
| Local Government Employees | 30 | 14.0% |
| State Government Employees | 18 | 8.4% |
| Federal Government Employees | 0 | 0.0% |
| Unpaid Family Workers | 0 | 0.0% |
| Total | 214 | 100.0% |
Employment Status by Age in New Cuyama
According to the labor force statistics for New Cuyama, out of the total population over 16 years of age (505), 50.5% or 255 individuals are in the labor force, with 9.0% or 23 of them unemployed. The age group with the highest labor force participation rate is 25 to 29 years, with 85.5% or 53 individuals in the labor force. Within the labor force, the 45 to 54 years age range has the highest percentage of unemployed individuals, with 41.8% or 23 of them being unemployed.
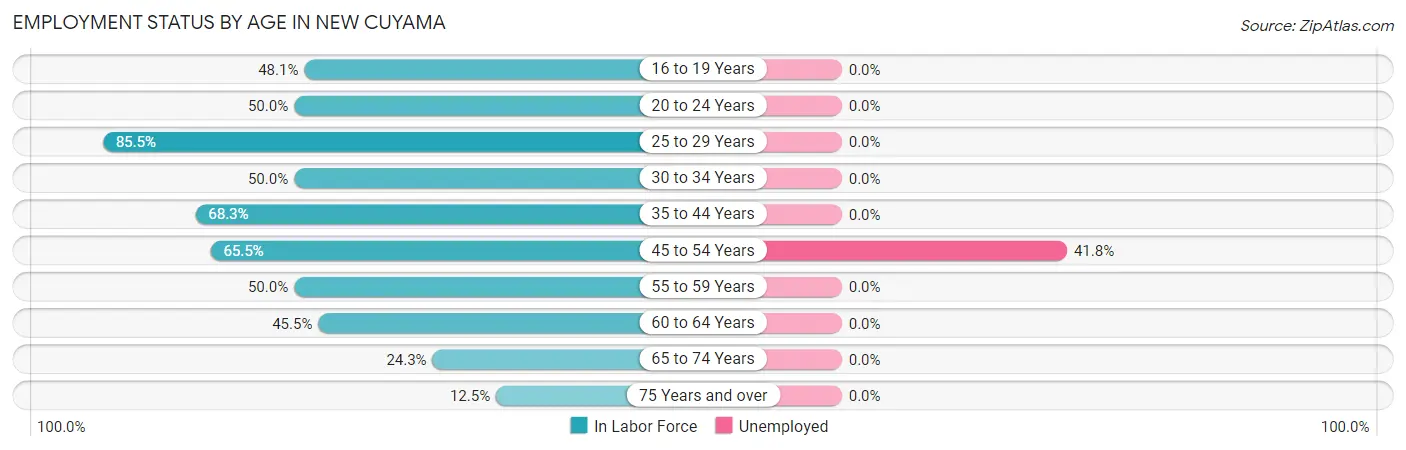
| Age Bracket | In Labor Force | Unemployed |
| 16 to 19 Years | 13 (48.1%) | 0 (0.0%) |
| 20 to 24 Years | 19 (50.0%) | 0 (0.0%) |
| 25 to 29 Years | 53 (85.5%) | 0 (0.0%) |
| 30 to 34 Years | 4 (50.0%) | 0 (0.0%) |
| 35 to 44 Years | 28 (68.3%) | 0 (0.0%) |
| 45 to 54 Years | 55 (65.5%) | 23 (41.8%) |
| 55 to 59 Years | 33 (50.0%) | 0 (0.0%) |
| 60 to 64 Years | 20 (45.5%) | 0 (0.0%) |
| 65 to 74 Years | 27 (24.3%) | 0 (0.0%) |
| 75 Years and over | 3 (12.5%) | 0 (0.0%) |
| Total | 255 (50.5%) | 23 (9.0%) |
Employment Status by Educational Attainment in New Cuyama
According to labor force statistics for New Cuyama, 63.3% of individuals (193) out of the total population between 25 and 64 years of age (305) are in the labor force, with 11.9% or 23 of them being unemployed. The group with the highest labor force participation rate are those with the educational attainment of less than high school, with 76.2% or 32 individuals in the labor force. Within the labor force, individuals with less than high school education have the highest percentage of unemployment, with 43.8% or 14 of them being unemployed.
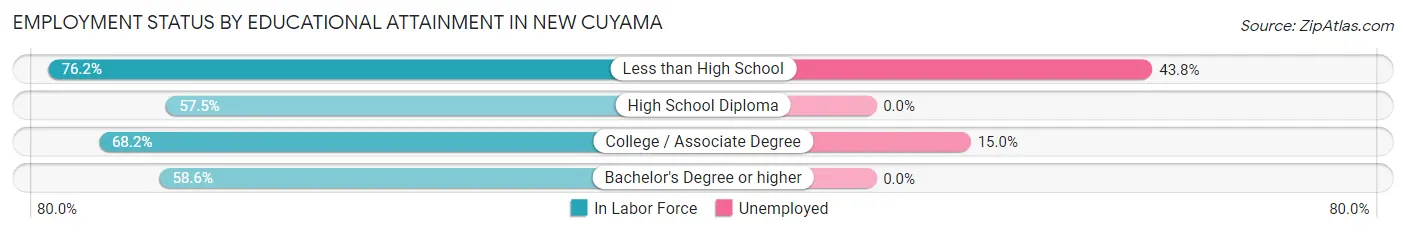
| Educational Attainment | In Labor Force | Unemployed |
| Less than High School | 32 (76.2%) | 18 (43.8%) |
| High School Diploma | 84 (57.5%) | 0 (0.0%) |
| College / Associate Degree | 60 (68.2%) | 13 (15.0%) |
| Bachelor's Degree or higher | 17 (58.6%) | 0 (0.0%) |
| Total | 193 (63.3%) | 36 (11.9%) |
Employment Occupations by Sex in New Cuyama
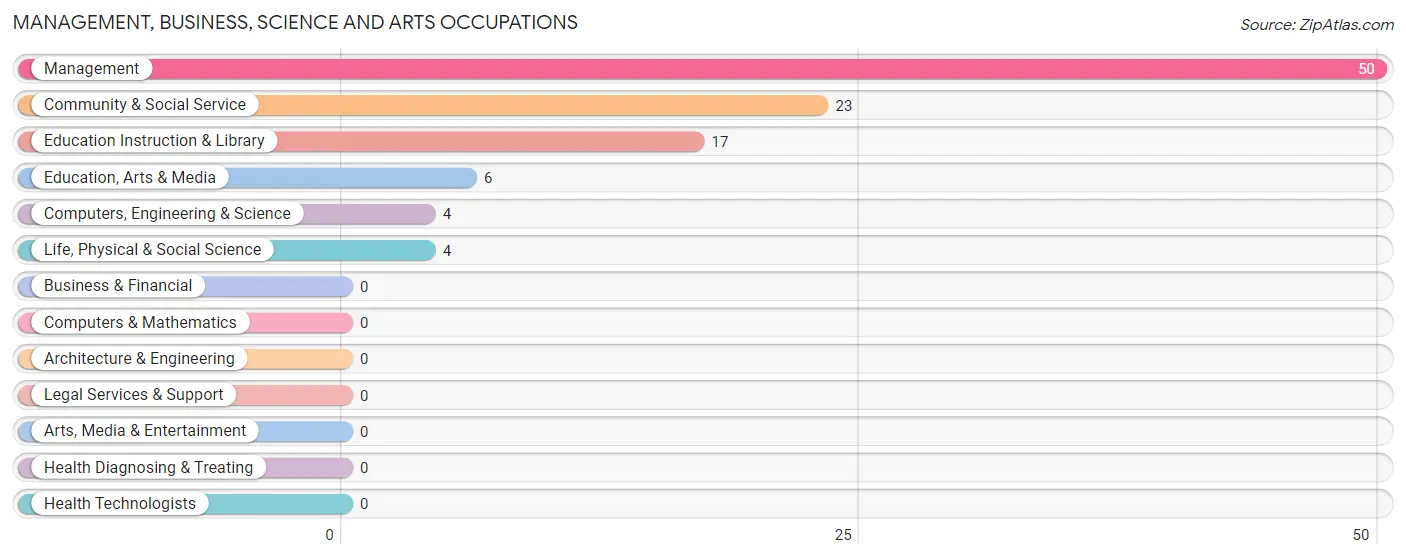
Management, Business, Science and Arts Occupations
The most common Management, Business, Science and Arts occupations in New Cuyama are Management (50 | 21.5%), Community & Social Service (23 | 9.9%), Education Instruction & Library (17 | 7.3%), Education, Arts & Media (6 | 2.6%), and Computers, Engineering & Science (4 | 1.7%).
Management, Business, Science and Arts Occupations by Sex
Within the Management, Business, Science and Arts occupations in New Cuyama, the most male-oriented occupations are Education, Arts & Media (100.0%), Community & Social Service (69.6%), and Education Instruction & Library (58.8%), while the most female-oriented occupations are Computers, Engineering & Science (100.0%), Life, Physical & Social Science (100.0%), and Management (70.0%).
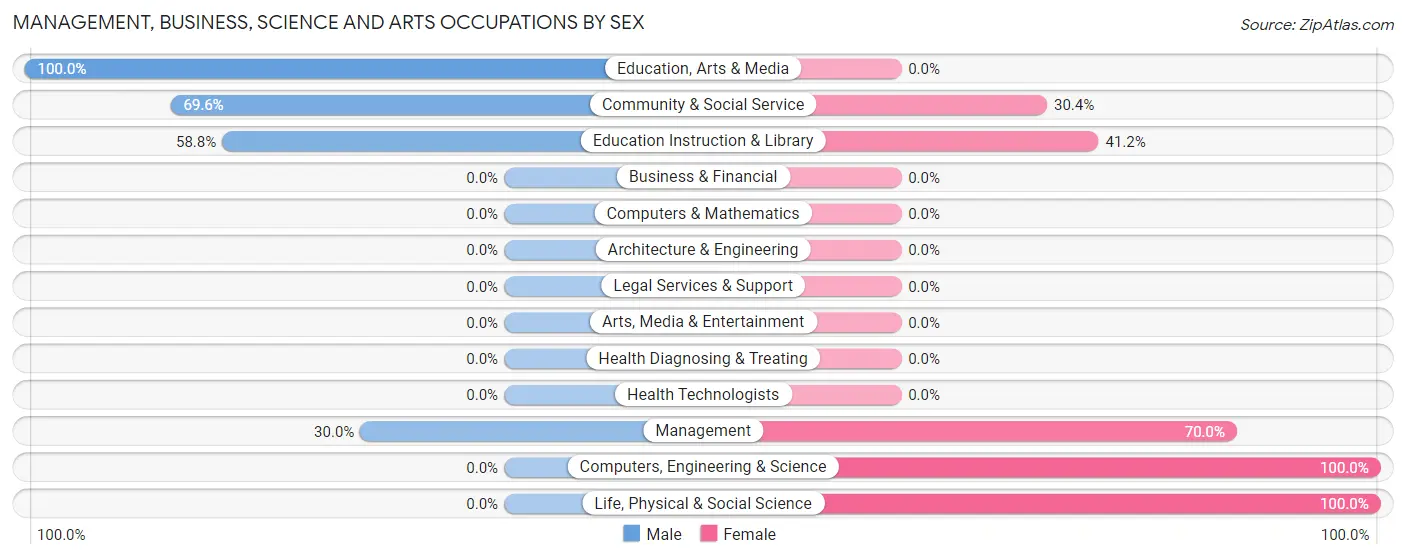
| Occupation | Male | Female |
| Management | 15 (30.0%) | 35 (70.0%) |
| Business & Financial | 0 (0.0%) | 0 (0.0%) |
| Computers, Engineering & Science | 0 (0.0%) | 4 (100.0%) |
| Computers & Mathematics | 0 (0.0%) | 0 (0.0%) |
| Architecture & Engineering | 0 (0.0%) | 0 (0.0%) |
| Life, Physical & Social Science | 0 (0.0%) | 4 (100.0%) |
| Community & Social Service | 16 (69.6%) | 7 (30.4%) |
| Education, Arts & Media | 6 (100.0%) | 0 (0.0%) |
| Legal Services & Support | 0 (0.0%) | 0 (0.0%) |
| Education Instruction & Library | 10 (58.8%) | 7 (41.2%) |
| Arts, Media & Entertainment | 0 (0.0%) | 0 (0.0%) |
| Health Diagnosing & Treating | 0 (0.0%) | 0 (0.0%) |
| Health Technologists | 0 (0.0%) | 0 (0.0%) |
| Total (Category) | 31 (40.3%) | 46 (59.7%) |
| Total (Overall) | 146 (62.9%) | 86 (37.1%) |
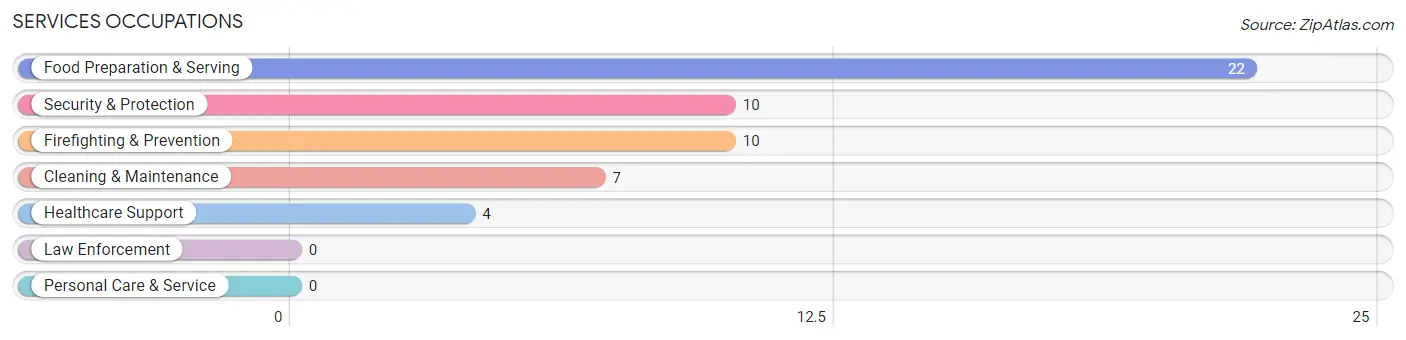
Services Occupations
The most common Services occupations in New Cuyama are Food Preparation & Serving (22 | 9.5%), Security & Protection (10 | 4.3%), Firefighting & Prevention (10 | 4.3%), Cleaning & Maintenance (7 | 3.0%), and Healthcare Support (4 | 1.7%).
Services Occupations by Sex
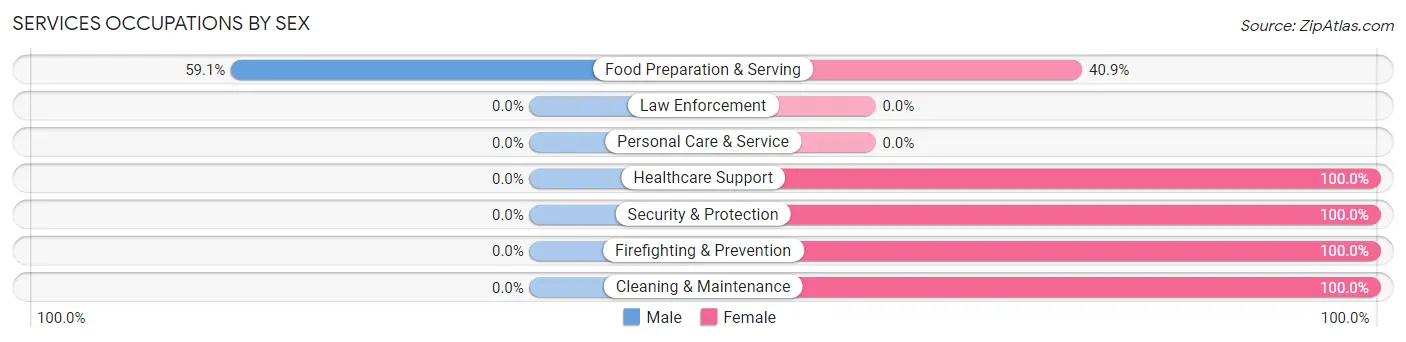
| Occupation | Male | Female |
| Healthcare Support | 0 (0.0%) | 4 (100.0%) |
| Security & Protection | 0 (0.0%) | 10 (100.0%) |
| Firefighting & Prevention | 0 (0.0%) | 10 (100.0%) |
| Law Enforcement | 0 (0.0%) | 0 (0.0%) |
| Food Preparation & Serving | 13 (59.1%) | 9 (40.9%) |
| Cleaning & Maintenance | 0 (0.0%) | 7 (100.0%) |
| Personal Care & Service | 0 (0.0%) | 0 (0.0%) |
| Total (Category) | 13 (30.2%) | 30 (69.8%) |
| Total (Overall) | 146 (62.9%) | 86 (37.1%) |
Sales and Office Occupations
The most common Sales and Office occupations in New Cuyama are , and Sales & Related (10 | 4.3%).
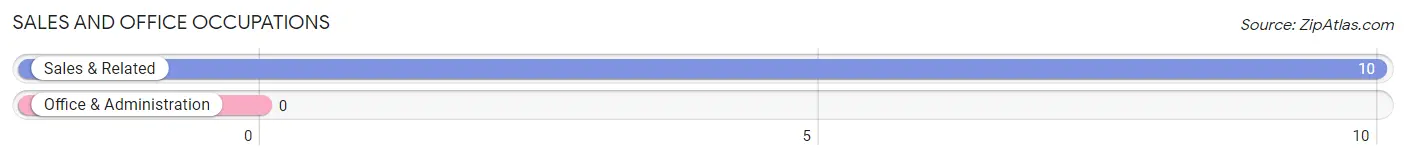
Sales and Office Occupations by Sex

| Occupation | Male | Female |
| Sales & Related | 10 (100.0%) | 0 (0.0%) |
| Office & Administration | 0 (0.0%) | 0 (0.0%) |
| Total (Category) | 10 (100.0%) | 0 (0.0%) |
| Total (Overall) | 146 (62.9%) | 86 (37.1%) |
Natural Resources, Construction and Maintenance Occupations
The most common Natural Resources, Construction and Maintenance occupations in New Cuyama are Construction & Extraction (39 | 16.8%), Farming, Fishing & Forestry (23 | 9.9%), and Installation, Maintenance & Repair (10 | 4.3%).
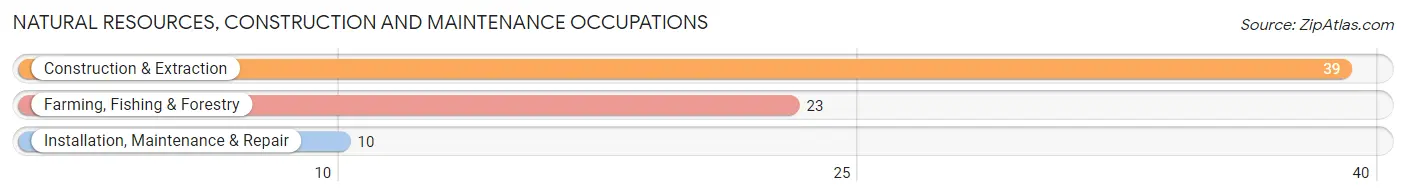
Natural Resources, Construction and Maintenance Occupations by Sex
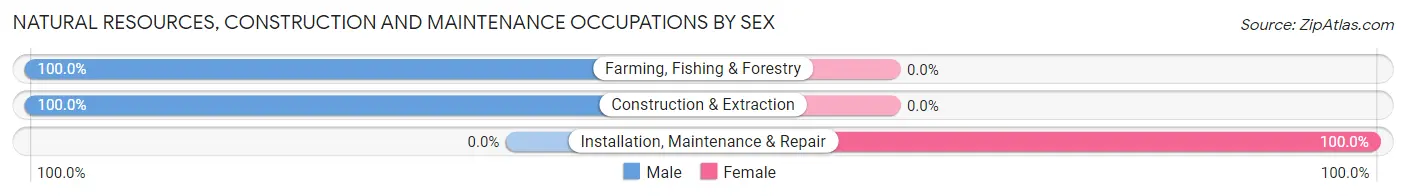
| Occupation | Male | Female |
| Farming, Fishing & Forestry | 23 (100.0%) | 0 (0.0%) |
| Construction & Extraction | 39 (100.0%) | 0 (0.0%) |
| Installation, Maintenance & Repair | 0 (0.0%) | 10 (100.0%) |
| Total (Category) | 62 (86.1%) | 10 (13.9%) |
| Total (Overall) | 146 (62.9%) | 86 (37.1%) |
Production, Transportation and Moving Occupations
The most common Production, Transportation and Moving occupations in New Cuyama are Production (17 | 7.3%), and Material Moving (13 | 5.6%).
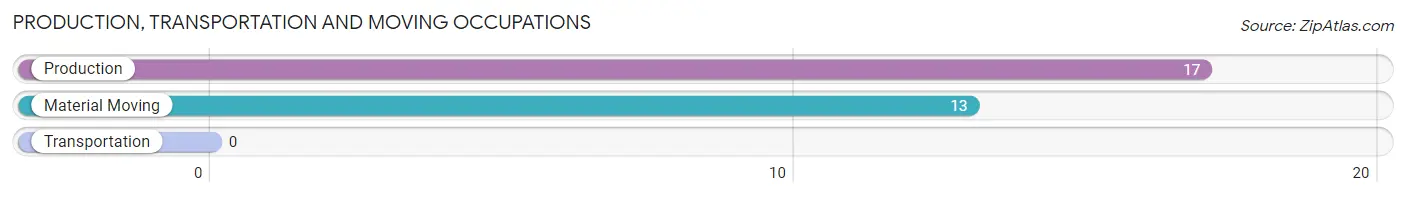
Production, Transportation and Moving Occupations by Sex
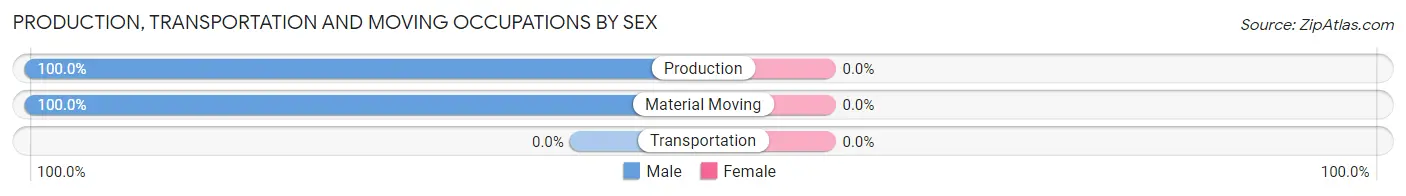
| Occupation | Male | Female |
| Production | 17 (100.0%) | 0 (0.0%) |
| Transportation | 0 (0.0%) | 0 (0.0%) |
| Material Moving | 13 (100.0%) | 0 (0.0%) |
| Total (Category) | 30 (100.0%) | 0 (0.0%) |
| Total (Overall) | 146 (62.9%) | 86 (37.1%) |
Employment Industries by Sex in New Cuyama
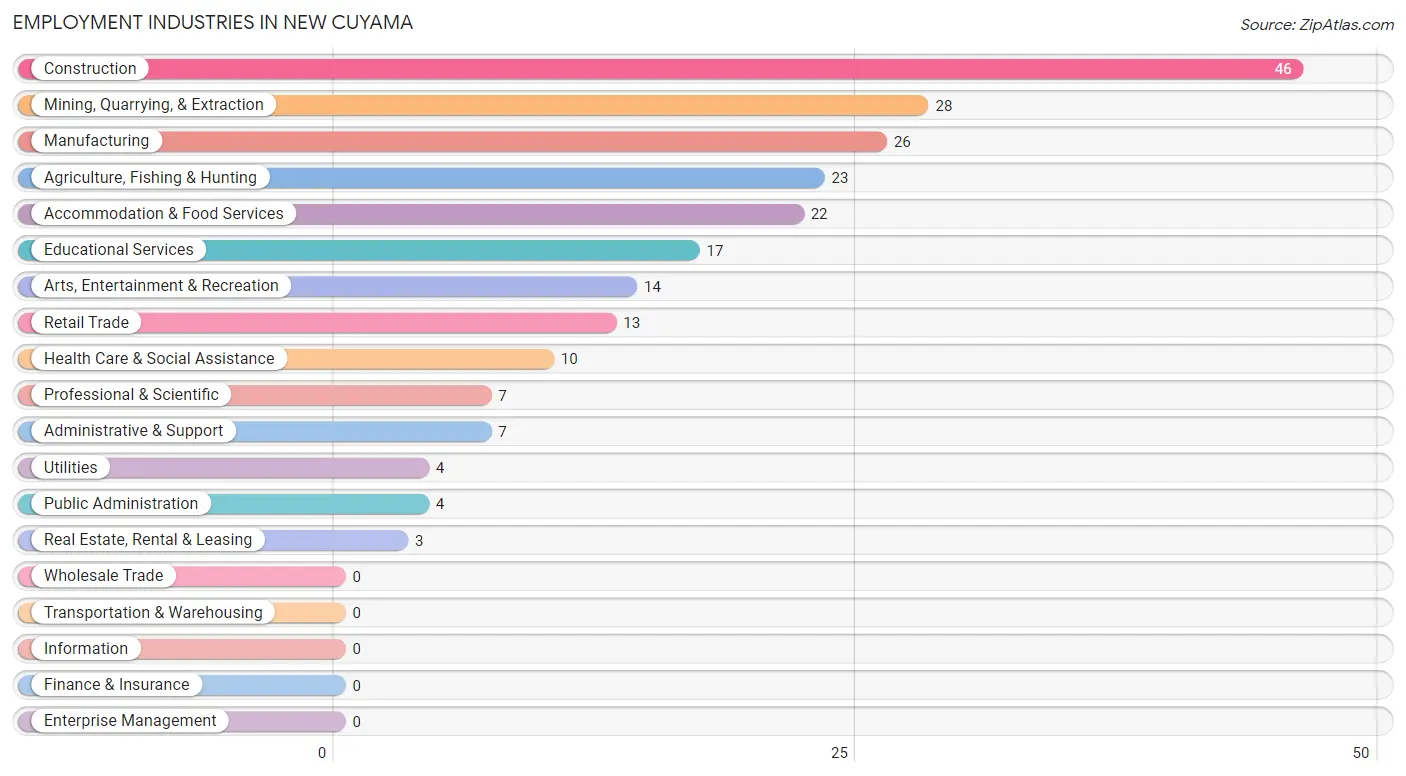
Employment Industries in New Cuyama
The major employment industries in New Cuyama include Construction (46 | 19.8%), Mining, Quarrying, & Extraction (28 | 12.1%), Manufacturing (26 | 11.2%), Agriculture, Fishing & Hunting (23 | 9.9%), and Accommodation & Food Services (22 | 9.5%).
Employment Industries by Sex in New Cuyama
The New Cuyama industries that see more men than women are Agriculture, Fishing & Hunting (100.0%), Retail Trade (100.0%), and Utilities (100.0%), whereas the industries that tend to have a higher number of women are Real Estate, Rental & Leasing (100.0%), Administrative & Support (100.0%), and Arts, Entertainment & Recreation (100.0%).
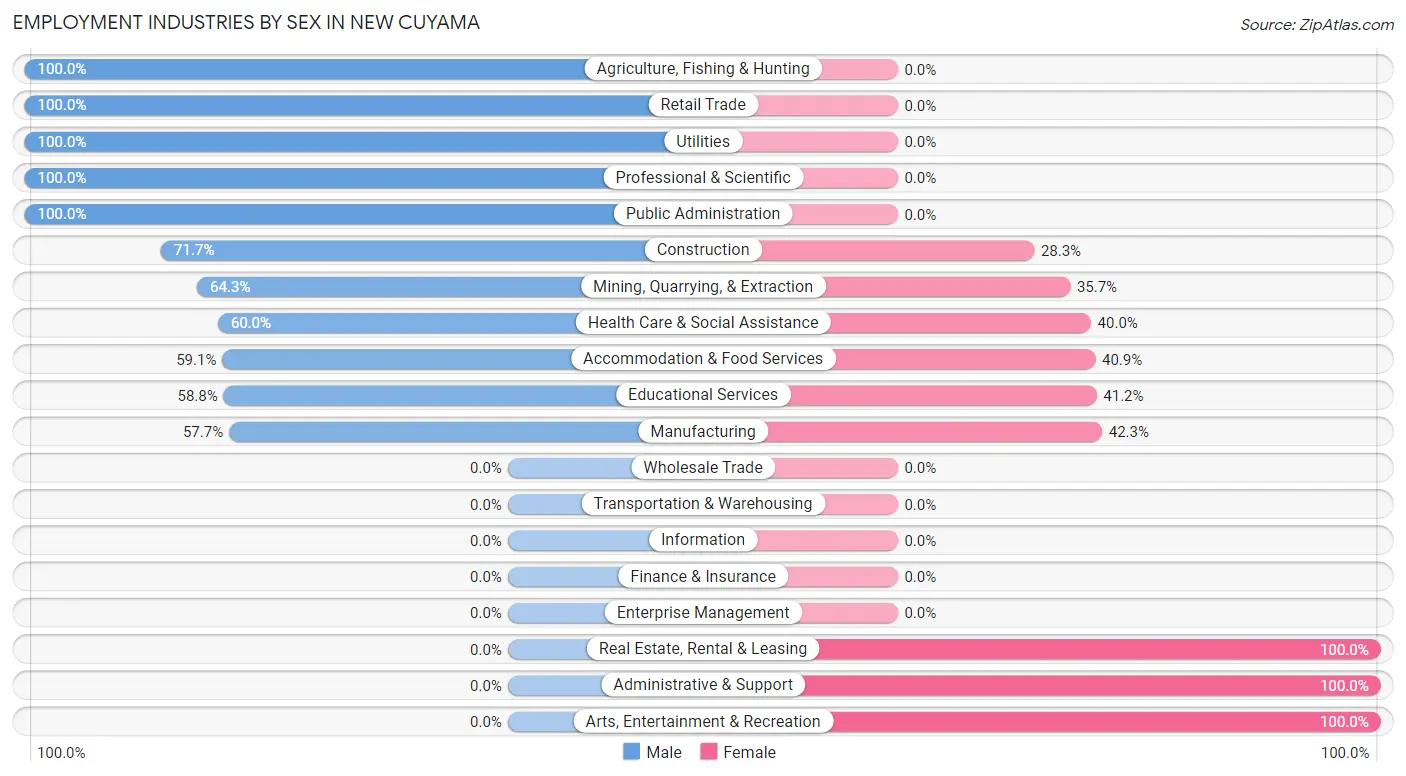
| Industry | Male | Female |
| Agriculture, Fishing & Hunting | 23 (100.0%) | 0 (0.0%) |
| Mining, Quarrying, & Extraction | 18 (64.3%) | 10 (35.7%) |
| Construction | 33 (71.7%) | 13 (28.3%) |
| Manufacturing | 15 (57.7%) | 11 (42.3%) |
| Wholesale Trade | 0 (0.0%) | 0 (0.0%) |
| Retail Trade | 13 (100.0%) | 0 (0.0%) |
| Transportation & Warehousing | 0 (0.0%) | 0 (0.0%) |
| Utilities | 4 (100.0%) | 0 (0.0%) |
| Information | 0 (0.0%) | 0 (0.0%) |
| Finance & Insurance | 0 (0.0%) | 0 (0.0%) |
| Real Estate, Rental & Leasing | 0 (0.0%) | 3 (100.0%) |
| Professional & Scientific | 7 (100.0%) | 0 (0.0%) |
| Enterprise Management | 0 (0.0%) | 0 (0.0%) |
| Administrative & Support | 0 (0.0%) | 7 (100.0%) |
| Educational Services | 10 (58.8%) | 7 (41.2%) |
| Health Care & Social Assistance | 6 (60.0%) | 4 (40.0%) |
| Arts, Entertainment & Recreation | 0 (0.0%) | 14 (100.0%) |
| Accommodation & Food Services | 13 (59.1%) | 9 (40.9%) |
| Public Administration | 4 (100.0%) | 0 (0.0%) |
| Total | 146 (62.9%) | 86 (37.1%) |
Education in New Cuyama
School Enrollment in New Cuyama
The most common levels of schooling among the 136 students in New Cuyama are elementary school (38 | 27.9%), middle school (30 | 22.1%), and college / undergraduate (27 | 19.9%).
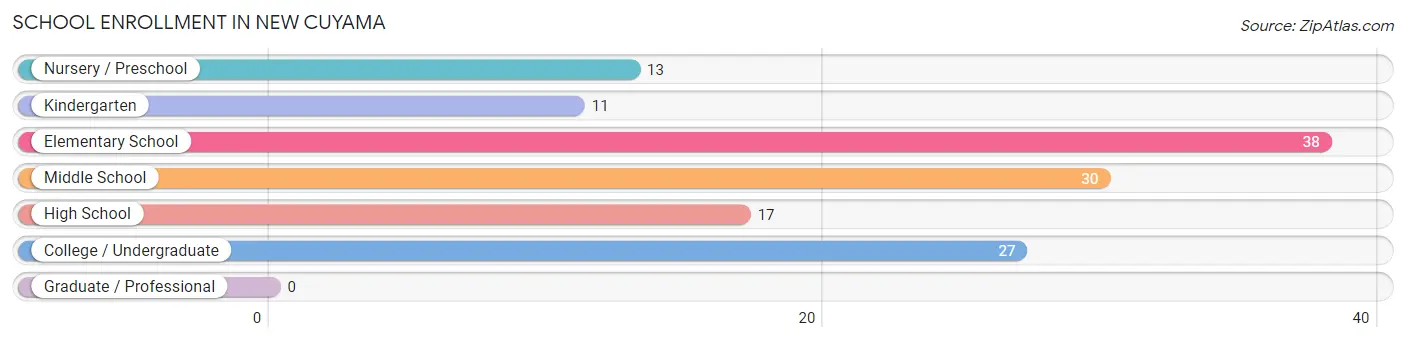
| School Level | # Students | % Students |
| Nursery / Preschool | 13 | 9.6% |
| Kindergarten | 11 | 8.1% |
| Elementary School | 38 | 27.9% |
| Middle School | 30 | 22.1% |
| High School | 17 | 12.5% |
| College / Undergraduate | 27 | 19.9% |
| Graduate / Professional | 0 | 0.0% |
| Total | 136 | 100.0% |
School Enrollment by Age by Funding Source in New Cuyama
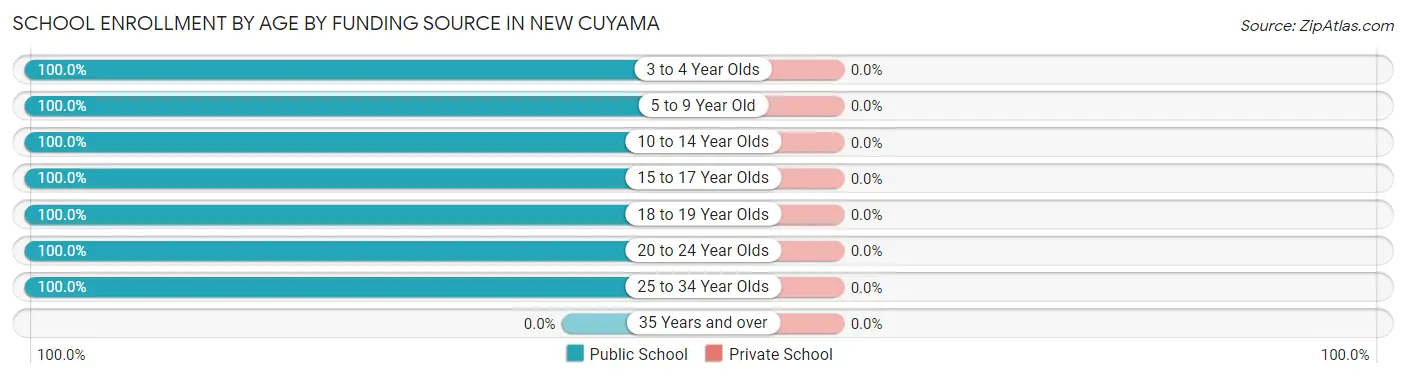
| Age Bracket | Public School | Private School |
| 3 to 4 Year Olds | 24 (100.0%) | 0 (0.0%) |
| 5 to 9 Year Old | 38 (100.0%) | 0 (0.0%) |
| 10 to 14 Year Olds | 43 (100.0%) | 0 (0.0%) |
| 15 to 17 Year Olds | 4 (100.0%) | 0 (0.0%) |
| 18 to 19 Year Olds | 13 (100.0%) | 0 (0.0%) |
| 20 to 24 Year Olds | 6 (100.0%) | 0 (0.0%) |
| 25 to 34 Year Olds | 8 (100.0%) | 0 (0.0%) |
| 35 Years and over | 0 (0.0%) | 0 (0.0%) |
| Total | 136 (100.0%) | 0 (0.0%) |
Educational Attainment by Field of Study in New Cuyama
Business (34 | 30.1%), bio, nature & agricultural (20 | 17.7%), visual & performing arts (18 | 15.9%), education (16 | 14.2%), and psychology (9 | 8.0%) are the most common fields of study among 113 individuals in New Cuyama who have obtained a bachelor's degree or higher.
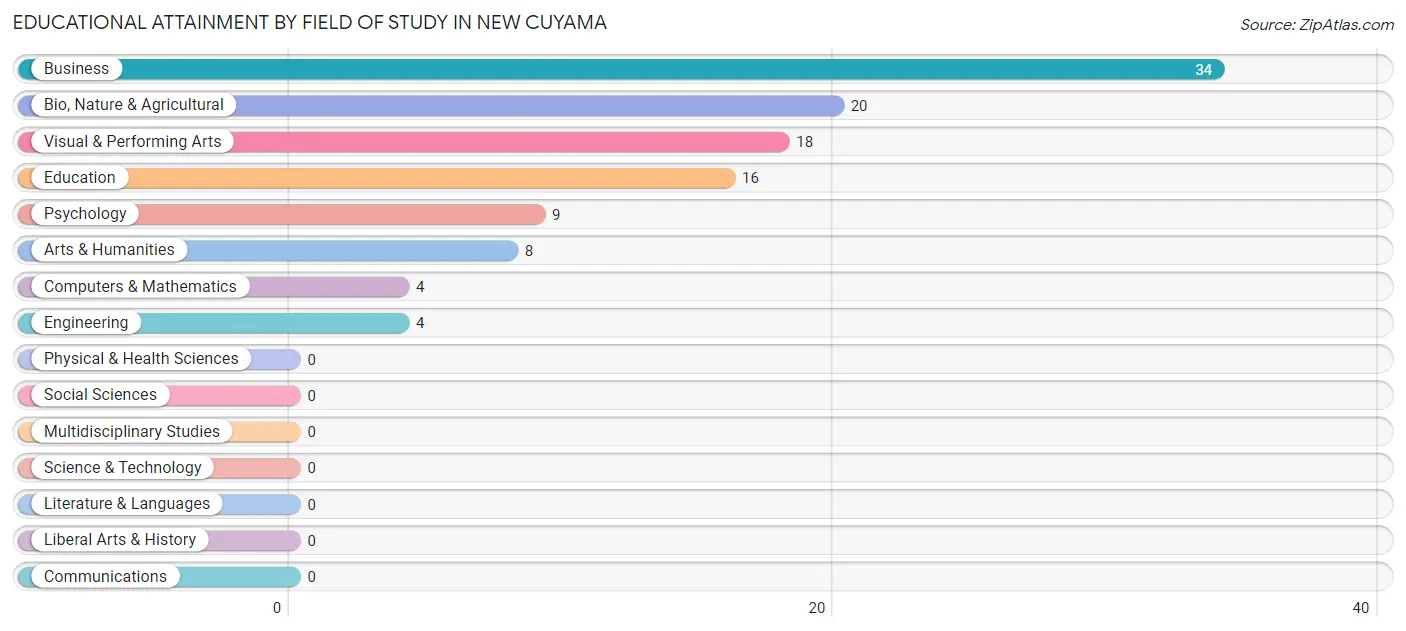
| Field of Study | # Graduates | % Graduates |
| Computers & Mathematics | 4 | 3.5% |
| Bio, Nature & Agricultural | 20 | 17.7% |
| Physical & Health Sciences | 0 | 0.0% |
| Psychology | 9 | 8.0% |
| Social Sciences | 0 | 0.0% |
| Engineering | 4 | 3.5% |
| Multidisciplinary Studies | 0 | 0.0% |
| Science & Technology | 0 | 0.0% |
| Business | 34 | 30.1% |
| Education | 16 | 14.2% |
| Literature & Languages | 0 | 0.0% |
| Liberal Arts & History | 0 | 0.0% |
| Visual & Performing Arts | 18 | 15.9% |
| Communications | 0 | 0.0% |
| Arts & Humanities | 8 | 7.1% |
| Total | 113 | 100.0% |
Transportation & Commute in New Cuyama
Vehicle Availability by Sex in New Cuyama
The most prevalent vehicle ownership categories in New Cuyama are males with 2 vehicles (57, accounting for 44.5%) and females with 2 vehicles (23, making up 66.3%).
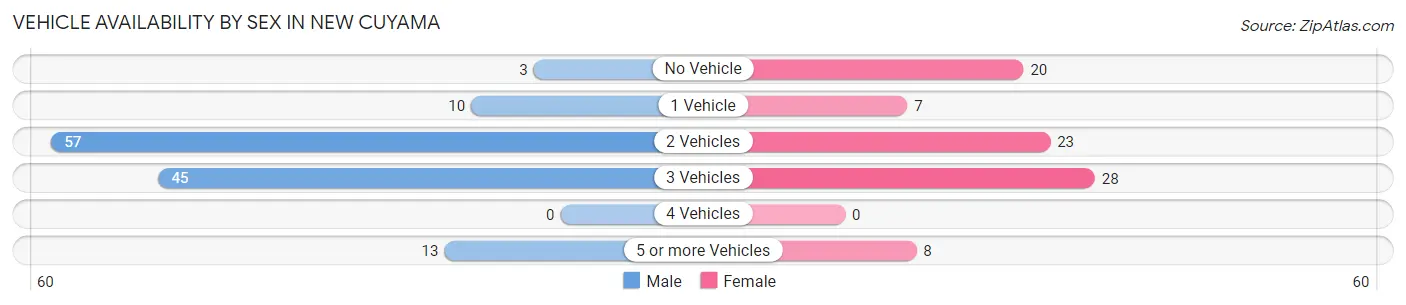
| Vehicles Available | Male | Female |
| No Vehicle | 3 (2.3%) | 20 (23.3%) |
| 1 Vehicle | 10 (7.8%) | 7 (8.1%) |
| 2 Vehicles | 57 (44.5%) | 23 (26.7%) |
| 3 Vehicles | 45 (35.2%) | 28 (32.6%) |
| 4 Vehicles | 0 (0.0%) | 0 (0.0%) |
| 5 or more Vehicles | 13 (10.2%) | 8 (9.3%) |
| Total | 128 (100.0%) | 86 (100.0%) |
Commute Time in New Cuyama
The most frequently occuring commute durations in New Cuyama are 60 to 89 minutes (61 commuters, 31.9%), 10 to 14 minutes (40 commuters, 20.9%), and 5 to 9 minutes (30 commuters, 15.7%).
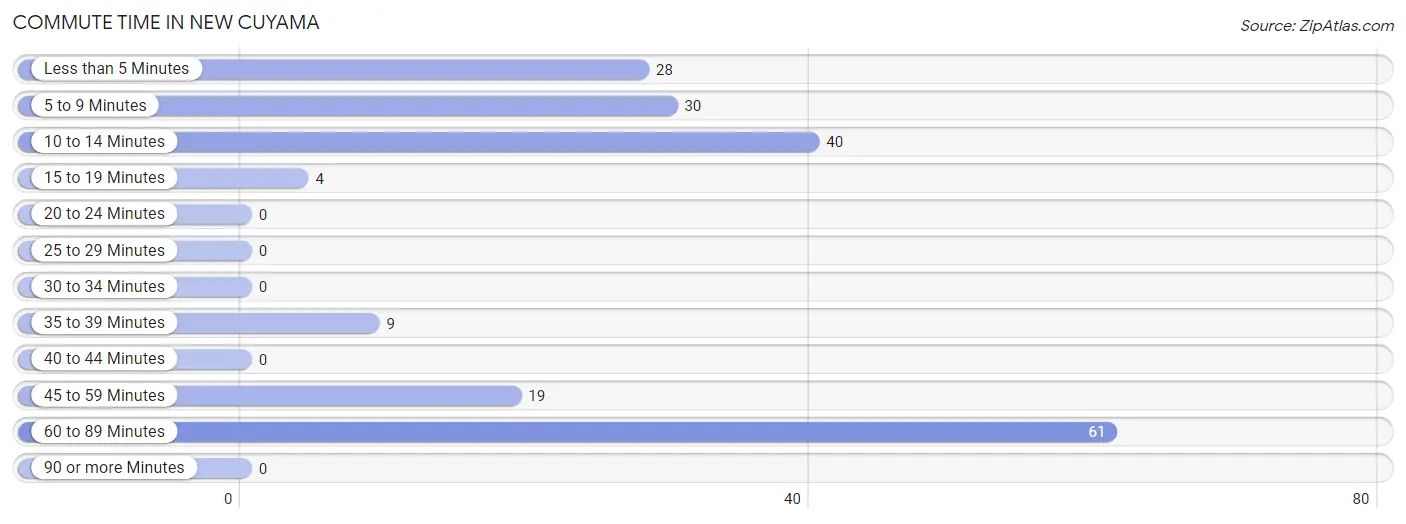
| Commute Time | # Commuters | % Commuters |
| Less than 5 Minutes | 28 | 14.7% |
| 5 to 9 Minutes | 30 | 15.7% |
| 10 to 14 Minutes | 40 | 20.9% |
| 15 to 19 Minutes | 4 | 2.1% |
| 20 to 24 Minutes | 0 | 0.0% |
| 25 to 29 Minutes | 0 | 0.0% |
| 30 to 34 Minutes | 0 | 0.0% |
| 35 to 39 Minutes | 9 | 4.7% |
| 40 to 44 Minutes | 0 | 0.0% |
| 45 to 59 Minutes | 19 | 10.0% |
| 60 to 89 Minutes | 61 | 31.9% |
| 90 or more Minutes | 0 | 0.0% |
Commute Time by Sex in New Cuyama
The most common commute times in New Cuyama are 60 to 89 minutes (35 commuters, 32.4%) for males and 60 to 89 minutes (26 commuters, 31.3%) for females.
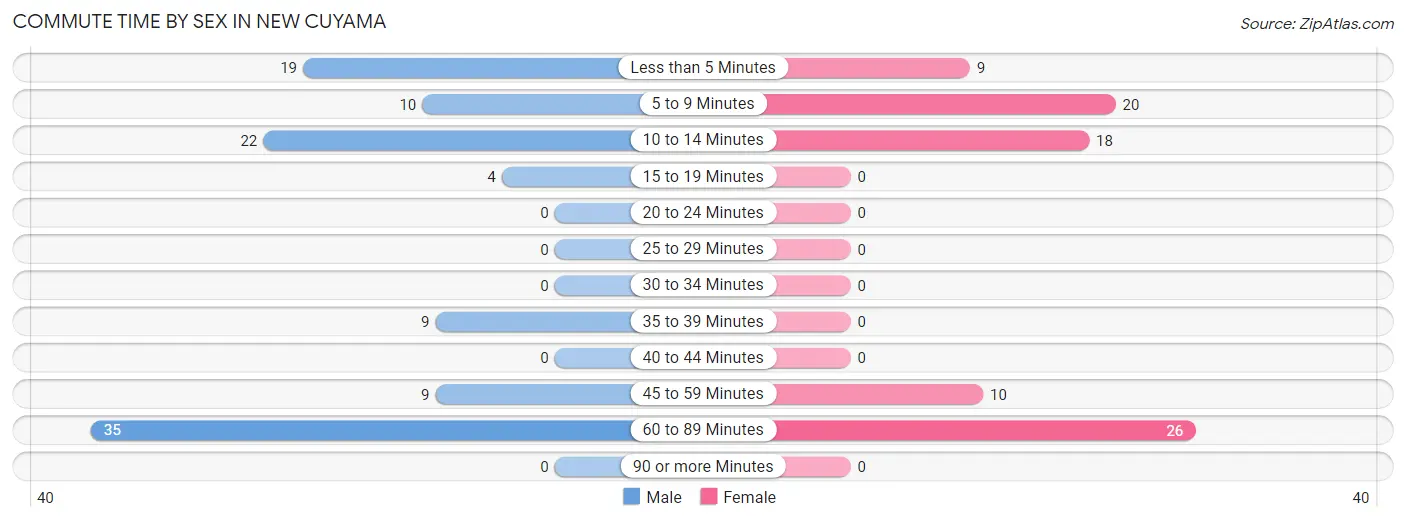
| Commute Time | Male | Female |
| Less than 5 Minutes | 19 (17.6%) | 9 (10.8%) |
| 5 to 9 Minutes | 10 (9.3%) | 20 (24.1%) |
| 10 to 14 Minutes | 22 (20.4%) | 18 (21.7%) |
| 15 to 19 Minutes | 4 (3.7%) | 0 (0.0%) |
| 20 to 24 Minutes | 0 (0.0%) | 0 (0.0%) |
| 25 to 29 Minutes | 0 (0.0%) | 0 (0.0%) |
| 30 to 34 Minutes | 0 (0.0%) | 0 (0.0%) |
| 35 to 39 Minutes | 9 (8.3%) | 0 (0.0%) |
| 40 to 44 Minutes | 0 (0.0%) | 0 (0.0%) |
| 45 to 59 Minutes | 9 (8.3%) | 10 (12.0%) |
| 60 to 89 Minutes | 35 (32.4%) | 26 (31.3%) |
| 90 or more Minutes | 0 (0.0%) | 0 (0.0%) |
Time of Departure to Work by Sex in New Cuyama
The most frequent times of departure to work in New Cuyama are 6:30 AM to 6:59 AM (28, 25.9%) for males and 8:00 AM to 8:29 AM (27, 32.5%) for females.
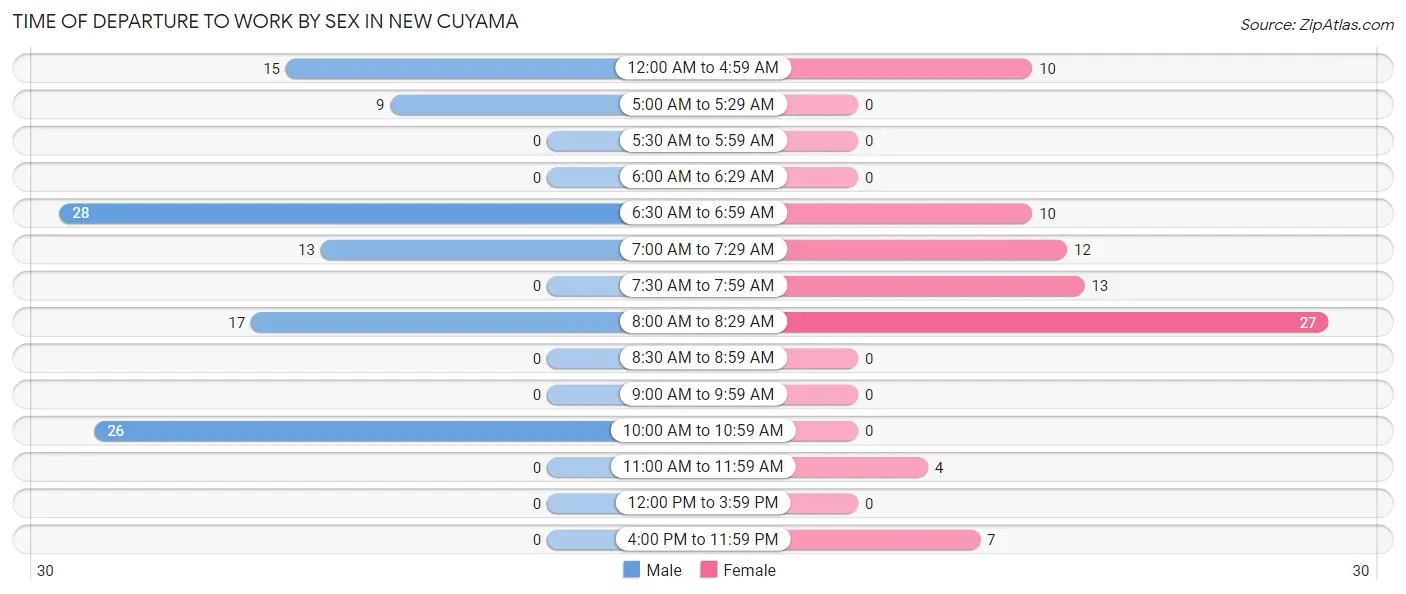
| Time of Departure | Male | Female |
| 12:00 AM to 4:59 AM | 15 (13.9%) | 10 (12.0%) |
| 5:00 AM to 5:29 AM | 9 (8.3%) | 0 (0.0%) |
| 5:30 AM to 5:59 AM | 0 (0.0%) | 0 (0.0%) |
| 6:00 AM to 6:29 AM | 0 (0.0%) | 0 (0.0%) |
| 6:30 AM to 6:59 AM | 28 (25.9%) | 10 (12.0%) |
| 7:00 AM to 7:29 AM | 13 (12.0%) | 12 (14.5%) |
| 7:30 AM to 7:59 AM | 0 (0.0%) | 13 (15.7%) |
| 8:00 AM to 8:29 AM | 17 (15.7%) | 27 (32.5%) |
| 8:30 AM to 8:59 AM | 0 (0.0%) | 0 (0.0%) |
| 9:00 AM to 9:59 AM | 0 (0.0%) | 0 (0.0%) |
| 10:00 AM to 10:59 AM | 26 (24.1%) | 0 (0.0%) |
| 11:00 AM to 11:59 AM | 0 (0.0%) | 4 (4.8%) |
| 12:00 PM to 3:59 PM | 0 (0.0%) | 0 (0.0%) |
| 4:00 PM to 11:59 PM | 0 (0.0%) | 7 (8.4%) |
| Total | 108 (100.0%) | 83 (100.0%) |
Housing Occupancy in New Cuyama
Occupancy by Ownership in New Cuyama
Of the total 255 dwellings in New Cuyama, owner-occupied units account for 218 (85.5%), while renter-occupied units make up 37 (14.5%).
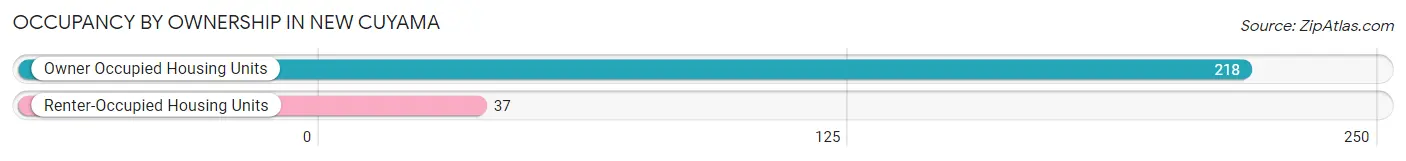
| Occupancy | # Housing Units | % Housing Units |
| Owner Occupied Housing Units | 218 | 85.5% |
| Renter-Occupied Housing Units | 37 | 14.5% |
| Total Occupied Housing Units | 255 | 100.0% |
Occupancy by Household Size in New Cuyama
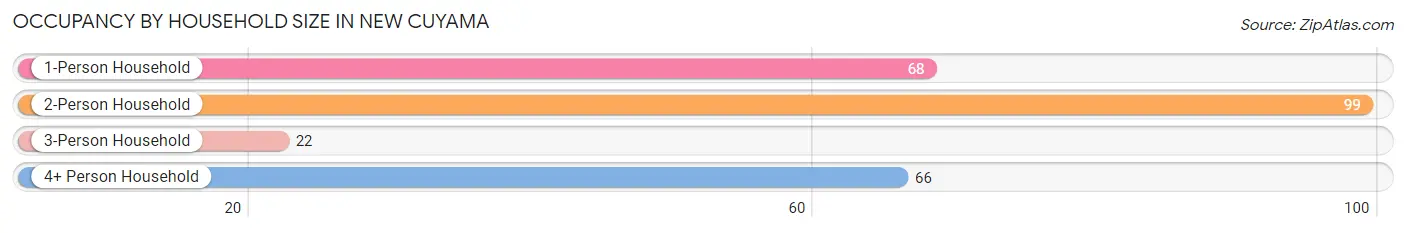
| Household Size | # Housing Units | % Housing Units |
| 1-Person Household | 68 | 26.7% |
| 2-Person Household | 99 | 38.8% |
| 3-Person Household | 22 | 8.6% |
| 4+ Person Household | 66 | 25.9% |
| Total Housing Units | 255 | 100.0% |
Occupancy by Ownership by Household Size in New Cuyama
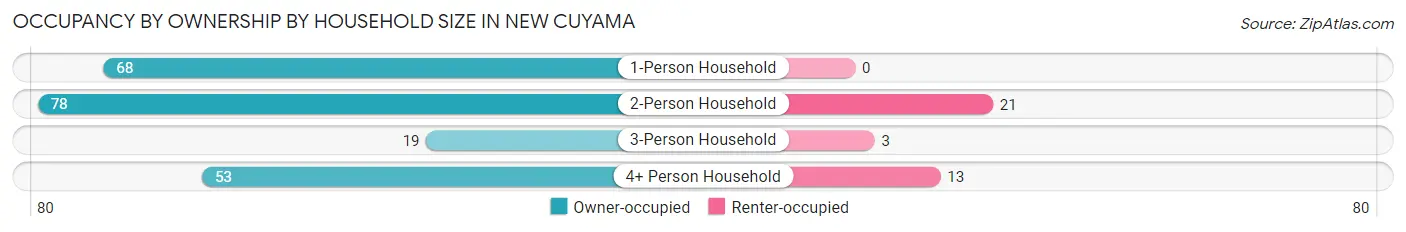
| Household Size | Owner-occupied | Renter-occupied |
| 1-Person Household | 68 (100.0%) | 0 (0.0%) |
| 2-Person Household | 78 (78.8%) | 21 (21.2%) |
| 3-Person Household | 19 (86.4%) | 3 (13.6%) |
| 4+ Person Household | 53 (80.3%) | 13 (19.7%) |
| Total Housing Units | 218 (85.5%) | 37 (14.5%) |
Occupancy by Educational Attainment in New Cuyama
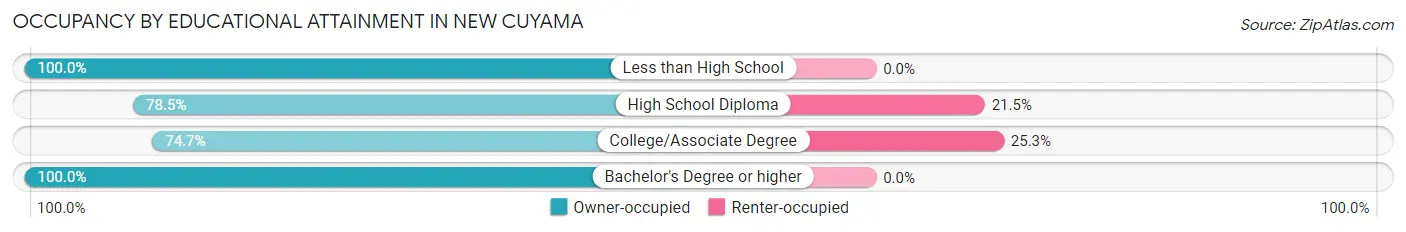
| Household Size | Owner-occupied | Renter-occupied |
| Less than High School | 18 (100.0%) | 0 (0.0%) |
| High School Diploma | 62 (78.5%) | 17 (21.5%) |
| College/Associate Degree | 59 (74.7%) | 20 (25.3%) |
| Bachelor's Degree or higher | 79 (100.0%) | 0 (0.0%) |
Occupancy by Age of Householder in New Cuyama
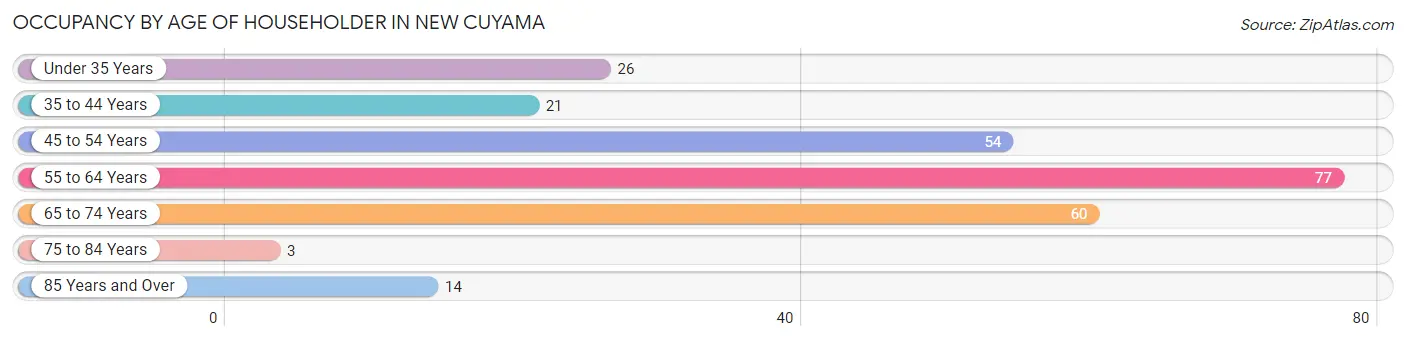
| Age Bracket | # Households | % Households |
| Under 35 Years | 26 | 10.2% |
| 35 to 44 Years | 21 | 8.2% |
| 45 to 54 Years | 54 | 21.2% |
| 55 to 64 Years | 77 | 30.2% |
| 65 to 74 Years | 60 | 23.5% |
| 75 to 84 Years | 3 | 1.2% |
| 85 Years and Over | 14 | 5.5% |
| Total | 255 | 100.0% |
Housing Finances in New Cuyama
Median Income by Occupancy in New Cuyama
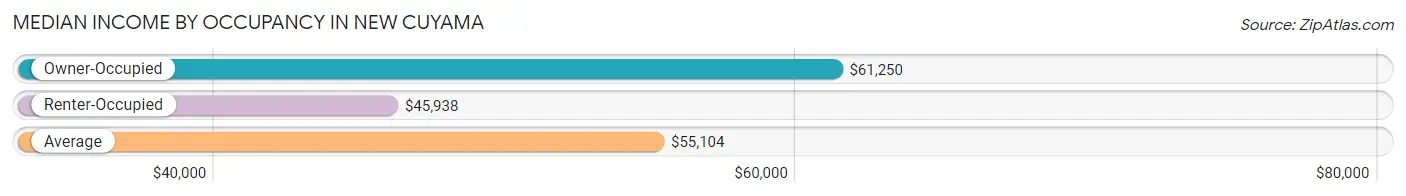
| Occupancy Type | # Households | Median Income |
| Owner-Occupied | 218 (85.5%) | $61,250 |
| Renter-Occupied | 37 (14.5%) | $45,938 |
| Average | 255 (100.0%) | $55,104 |
Occupancy by Householder Income Bracket in New Cuyama
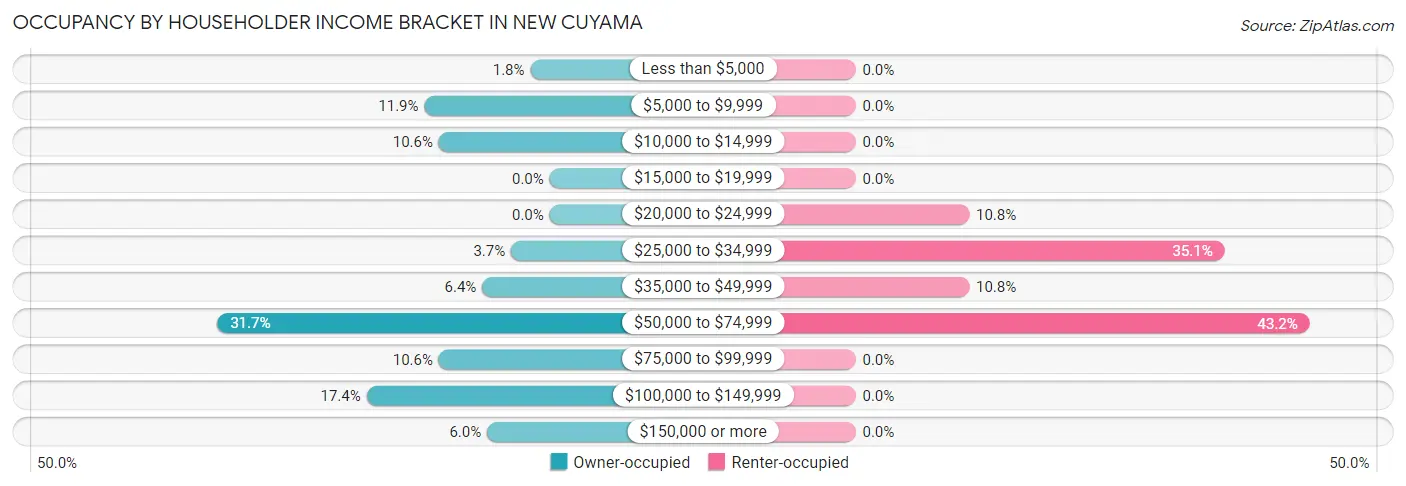
| Income Bracket | Owner-occupied | Renter-occupied |
| Less than $5,000 | 4 (1.8%) | 0 (0.0%) |
| $5,000 to $9,999 | 26 (11.9%) | 0 (0.0%) |
| $10,000 to $14,999 | 23 (10.5%) | 0 (0.0%) |
| $15,000 to $19,999 | 0 (0.0%) | 0 (0.0%) |
| $20,000 to $24,999 | 0 (0.0%) | 4 (10.8%) |
| $25,000 to $34,999 | 8 (3.7%) | 13 (35.1%) |
| $35,000 to $49,999 | 14 (6.4%) | 4 (10.8%) |
| $50,000 to $74,999 | 69 (31.7%) | 16 (43.2%) |
| $75,000 to $99,999 | 23 (10.5%) | 0 (0.0%) |
| $100,000 to $149,999 | 38 (17.4%) | 0 (0.0%) |
| $150,000 or more | 13 (6.0%) | 0 (0.0%) |
| Total | 218 (100.0%) | 37 (100.0%) |
Monthly Housing Cost Tiers in New Cuyama
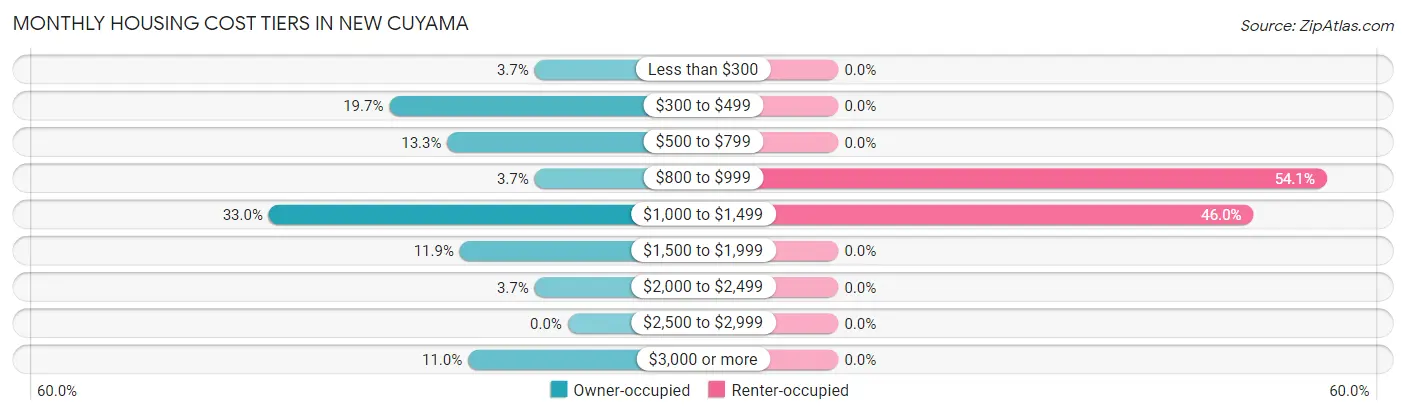
| Monthly Cost | Owner-occupied | Renter-occupied |
| Less than $300 | 8 (3.7%) | 0 (0.0%) |
| $300 to $499 | 43 (19.7%) | 0 (0.0%) |
| $500 to $799 | 29 (13.3%) | 0 (0.0%) |
| $800 to $999 | 8 (3.7%) | 20 (54.0%) |
| $1,000 to $1,499 | 72 (33.0%) | 17 (46.0%) |
| $1,500 to $1,999 | 26 (11.9%) | 0 (0.0%) |
| $2,000 to $2,499 | 8 (3.7%) | 0 (0.0%) |
| $2,500 to $2,999 | 0 (0.0%) | 0 (0.0%) |
| $3,000 or more | 24 (11.0%) | 0 (0.0%) |
| Total | 218 (100.0%) | 37 (100.0%) |
Physical Housing Characteristics in New Cuyama
Housing Structures in New Cuyama
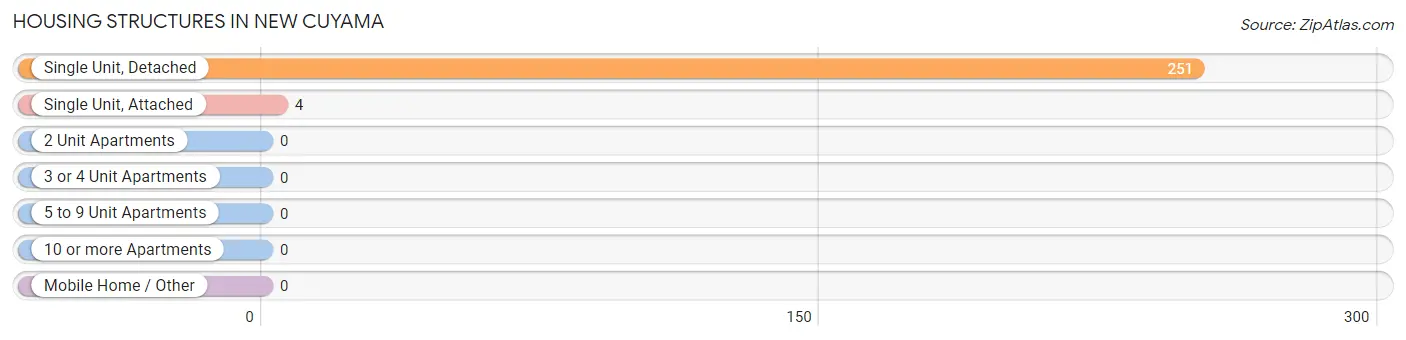
| Structure Type | # Housing Units | % Housing Units |
| Single Unit, Detached | 251 | 98.4% |
| Single Unit, Attached | 4 | 1.6% |
| 2 Unit Apartments | 0 | 0.0% |
| 3 or 4 Unit Apartments | 0 | 0.0% |
| 5 to 9 Unit Apartments | 0 | 0.0% |
| 10 or more Apartments | 0 | 0.0% |
| Mobile Home / Other | 0 | 0.0% |
| Total | 255 | 100.0% |
Housing Structures by Occupancy in New Cuyama
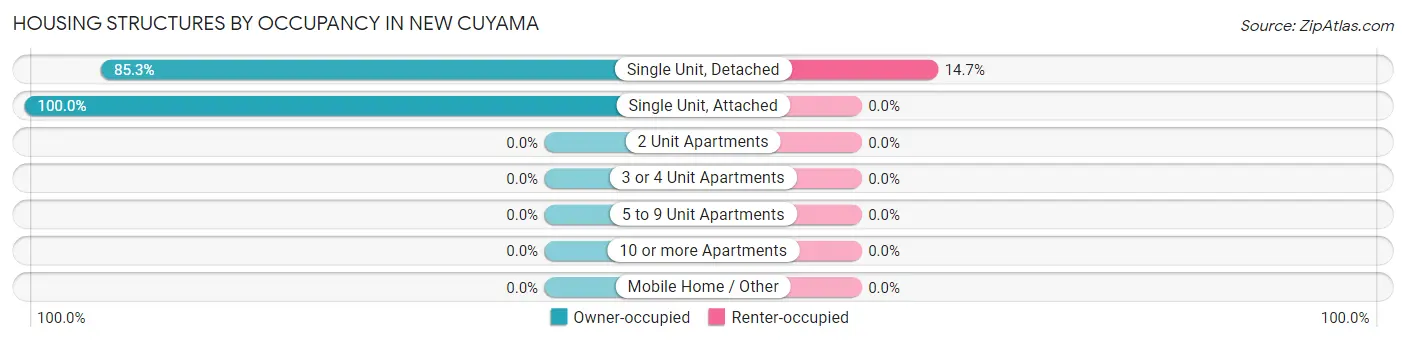
| Structure Type | Owner-occupied | Renter-occupied |
| Single Unit, Detached | 214 (85.3%) | 37 (14.7%) |
| Single Unit, Attached | 4 (100.0%) | 0 (0.0%) |
| 2 Unit Apartments | 0 (0.0%) | 0 (0.0%) |
| 3 or 4 Unit Apartments | 0 (0.0%) | 0 (0.0%) |
| 5 to 9 Unit Apartments | 0 (0.0%) | 0 (0.0%) |
| 10 or more Apartments | 0 (0.0%) | 0 (0.0%) |
| Mobile Home / Other | 0 (0.0%) | 0 (0.0%) |
| Total | 218 (85.5%) | 37 (14.5%) |
Housing Structures by Number of Rooms in New Cuyama
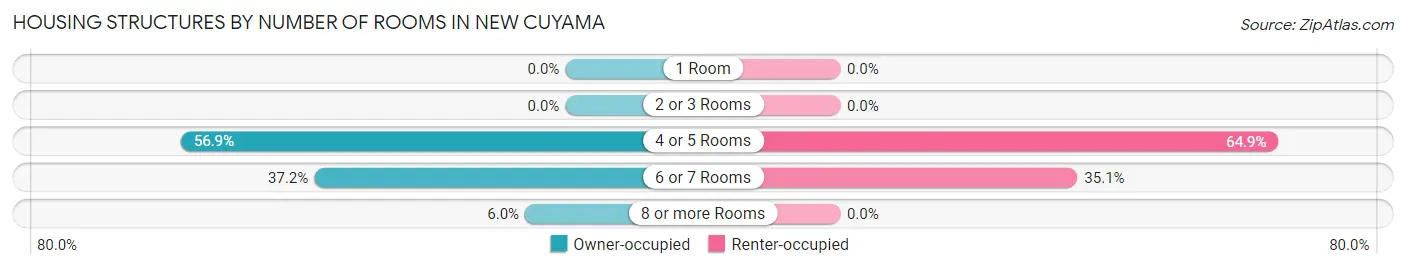
| Number of Rooms | Owner-occupied | Renter-occupied |
| 1 Room | 0 (0.0%) | 0 (0.0%) |
| 2 or 3 Rooms | 0 (0.0%) | 0 (0.0%) |
| 4 or 5 Rooms | 124 (56.9%) | 24 (64.9%) |
| 6 or 7 Rooms | 81 (37.2%) | 13 (35.1%) |
| 8 or more Rooms | 13 (6.0%) | 0 (0.0%) |
| Total | 218 (100.0%) | 37 (100.0%) |
Housing Structure by Heating Type in New Cuyama
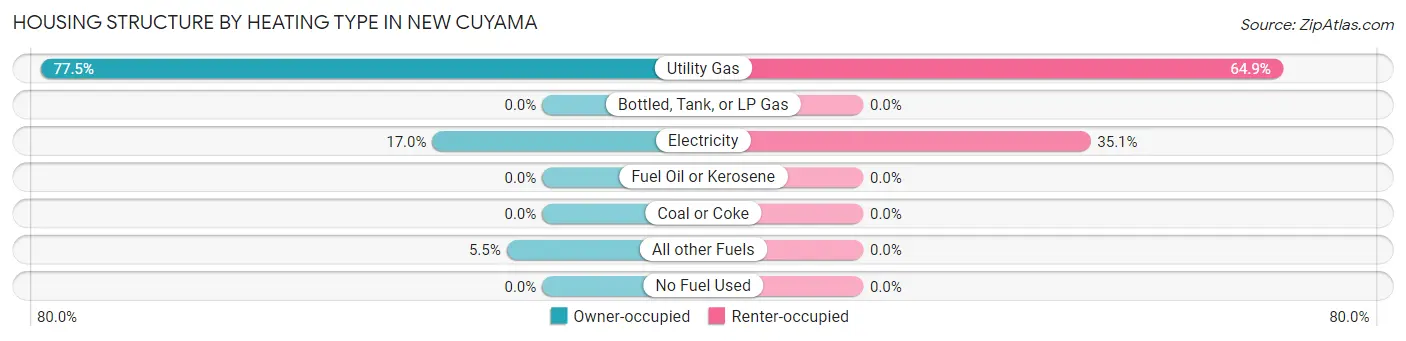
| Heating Type | Owner-occupied | Renter-occupied |
| Utility Gas | 169 (77.5%) | 24 (64.9%) |
| Bottled, Tank, or LP Gas | 0 (0.0%) | 0 (0.0%) |
| Electricity | 37 (17.0%) | 13 (35.1%) |
| Fuel Oil or Kerosene | 0 (0.0%) | 0 (0.0%) |
| Coal or Coke | 0 (0.0%) | 0 (0.0%) |
| All other Fuels | 12 (5.5%) | 0 (0.0%) |
| No Fuel Used | 0 (0.0%) | 0 (0.0%) |
| Total | 218 (100.0%) | 37 (100.0%) |
Household Vehicle Usage in New Cuyama
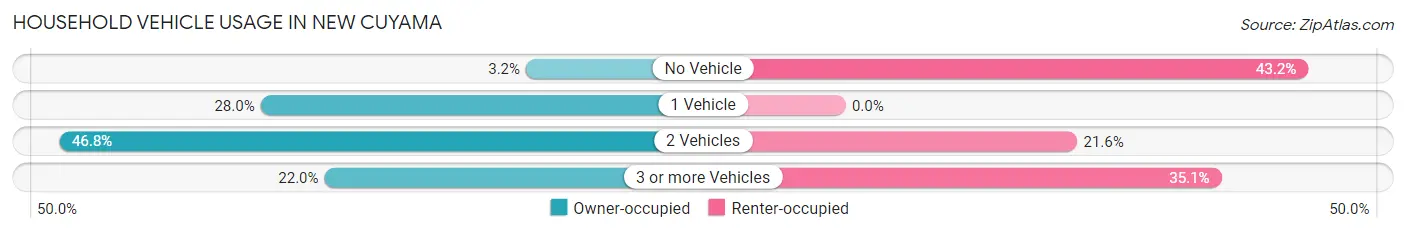
| Vehicles per Household | Owner-occupied | Renter-occupied |
| No Vehicle | 7 (3.2%) | 16 (43.2%) |
| 1 Vehicle | 61 (28.0%) | 0 (0.0%) |
| 2 Vehicles | 102 (46.8%) | 8 (21.6%) |
| 3 or more Vehicles | 48 (22.0%) | 13 (35.1%) |
| Total | 218 (100.0%) | 37 (100.0%) |
Real Estate & Mortgages in New Cuyama
Real Estate and Mortgage Overview in New Cuyama
| Characteristic | Without Mortgage | With Mortgage |
| Housing Units | 79 | 139 |
| Median Property Value | $190,600 | $177,800 |
| Median Household Income | $45,313 | $13 |
| Monthly Housing Costs | $443 | $20 |
| Real Estate Taxes | $827 | $0 |
Property Value by Mortgage Status in New Cuyama
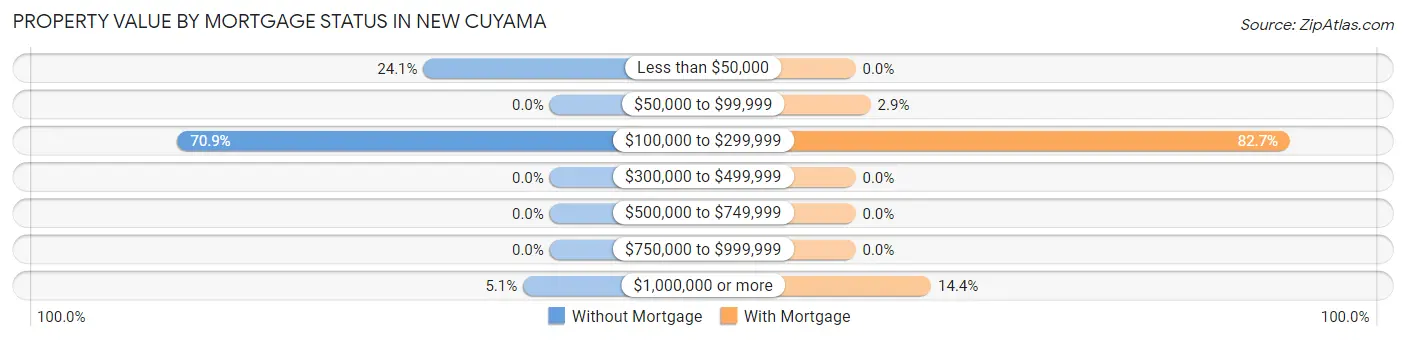
| Property Value | Without Mortgage | With Mortgage |
| Less than $50,000 | 19 (24.0%) | 0 (0.0%) |
| $50,000 to $99,999 | 0 (0.0%) | 4 (2.9%) |
| $100,000 to $299,999 | 56 (70.9%) | 115 (82.7%) |
| $300,000 to $499,999 | 0 (0.0%) | 0 (0.0%) |
| $500,000 to $749,999 | 0 (0.0%) | 0 (0.0%) |
| $750,000 to $999,999 | 0 (0.0%) | 0 (0.0%) |
| $1,000,000 or more | 4 (5.1%) | 20 (14.4%) |
| Total | 79 (100.0%) | 139 (100.0%) |
Household Income by Mortgage Status in New Cuyama
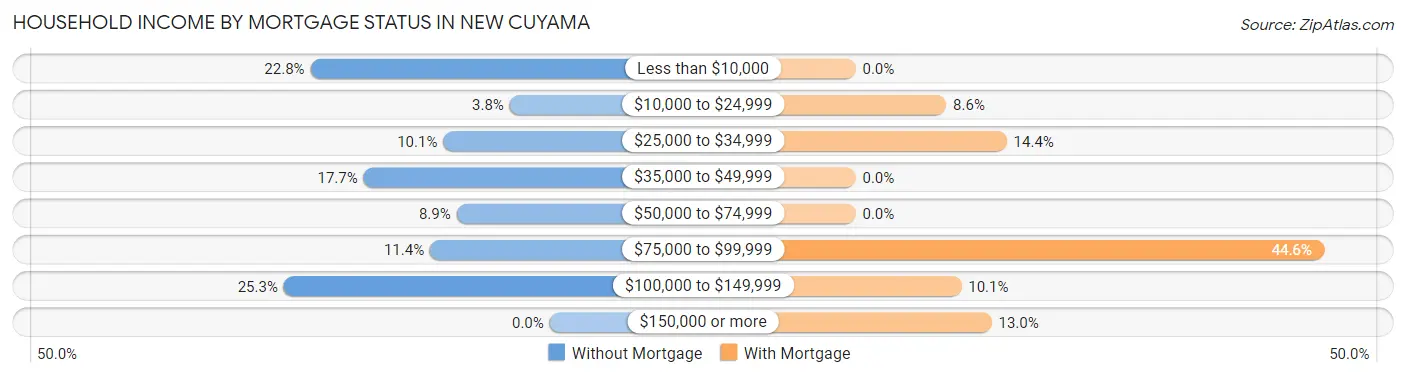
| Household Income | Without Mortgage | With Mortgage |
| Less than $10,000 | 18 (22.8%) | 0 (0.0%) |
| $10,000 to $24,999 | 3 (3.8%) | 12 (8.6%) |
| $25,000 to $34,999 | 8 (10.1%) | 20 (14.4%) |
| $35,000 to $49,999 | 14 (17.7%) | 0 (0.0%) |
| $50,000 to $74,999 | 7 (8.9%) | 0 (0.0%) |
| $75,000 to $99,999 | 9 (11.4%) | 62 (44.6%) |
| $100,000 to $149,999 | 20 (25.3%) | 14 (10.1%) |
| $150,000 or more | 0 (0.0%) | 18 (13.0%) |
| Total | 79 (100.0%) | 139 (100.0%) |
Property Value to Household Income Ratio in New Cuyama
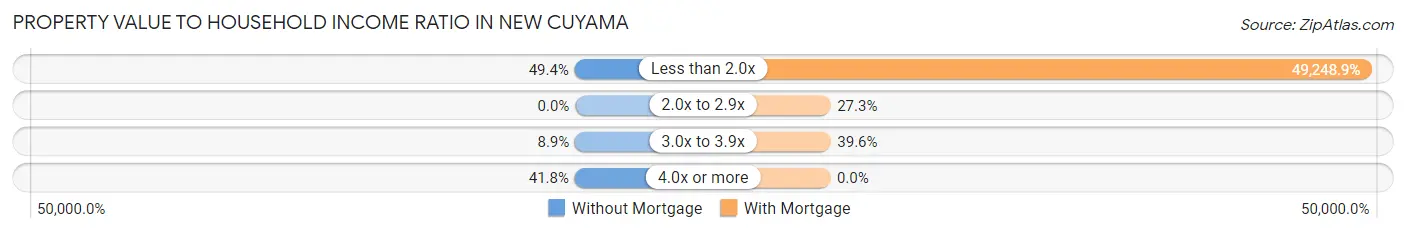
| Value-to-Income Ratio | Without Mortgage | With Mortgage |
| Less than 2.0x | 39 (49.4%) | 68,456 (49,248.9%) |
| 2.0x to 2.9x | 0 (0.0%) | 38 (27.3%) |
| 3.0x to 3.9x | 7 (8.9%) | 55 (39.6%) |
| 4.0x or more | 33 (41.8%) | 0 (0.0%) |
| Total | 79 (100.0%) | 139 (100.0%) |
Real Estate Taxes by Mortgage Status in New Cuyama
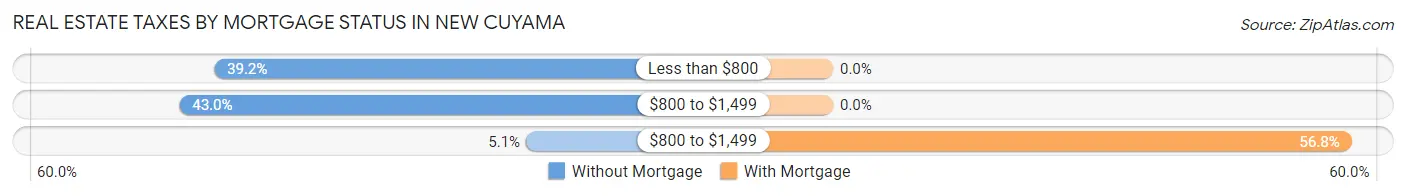
| Property Taxes | Without Mortgage | With Mortgage |
| Less than $800 | 31 (39.2%) | 0 (0.0%) |
| $800 to $1,499 | 34 (43.0%) | 0 (0.0%) |
| $800 to $1,499 | 4 (5.1%) | 79 (56.8%) |
| Total | 79 (100.0%) | 139 (100.0%) |
Health & Disability in New Cuyama
Health Insurance Coverage by Age in New Cuyama
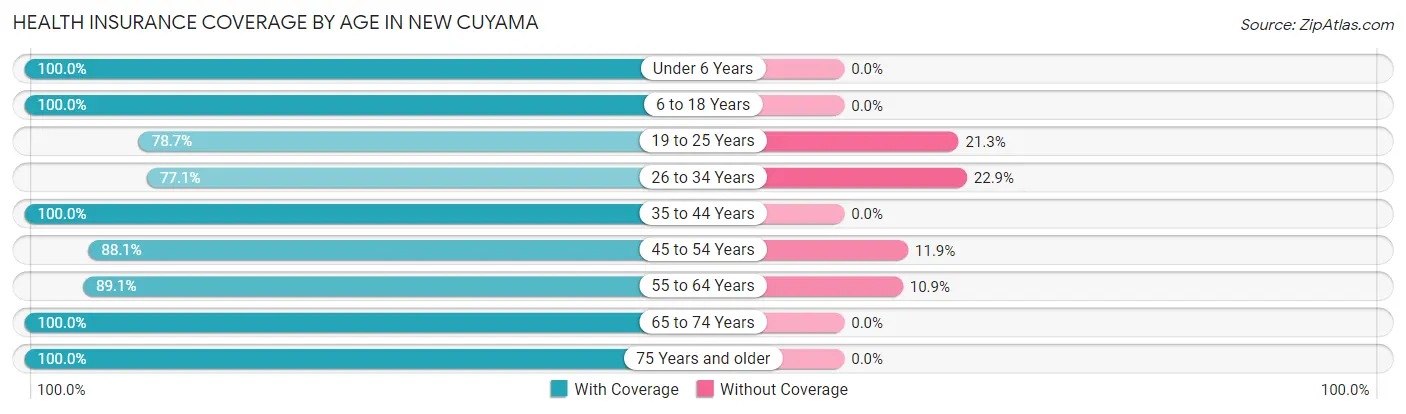
| Age Bracket | With Coverage | Without Coverage |
| Under 6 Years | 73 (100.0%) | 0 (0.0%) |
| 6 to 18 Years | 95 (100.0%) | 0 (0.0%) |
| 19 to 25 Years | 48 (78.7%) | 13 (21.3%) |
| 26 to 34 Years | 54 (77.1%) | 16 (22.9%) |
| 35 to 44 Years | 41 (100.0%) | 0 (0.0%) |
| 45 to 54 Years | 74 (88.1%) | 10 (11.9%) |
| 55 to 64 Years | 98 (89.1%) | 12 (10.9%) |
| 65 to 74 Years | 111 (100.0%) | 0 (0.0%) |
| 75 Years and older | 24 (100.0%) | 0 (0.0%) |
| Total | 618 (92.4%) | 51 (7.6%) |
Health Insurance Coverage by Citizenship Status in New Cuyama
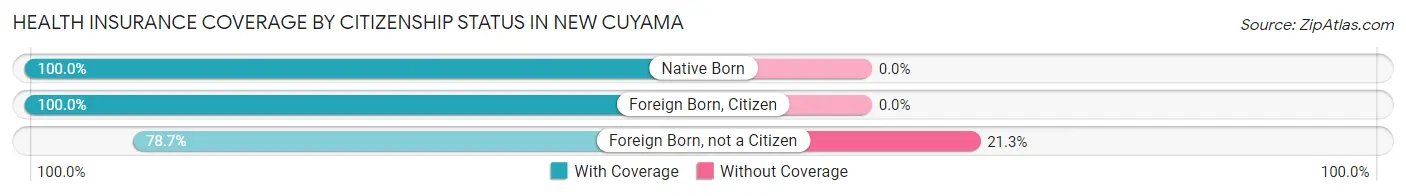
| Citizenship Status | With Coverage | Without Coverage |
| Native Born | 73 (100.0%) | 0 (0.0%) |
| Foreign Born, Citizen | 95 (100.0%) | 0 (0.0%) |
| Foreign Born, not a Citizen | 48 (78.7%) | 13 (21.3%) |
Health Insurance Coverage by Household Income in New Cuyama
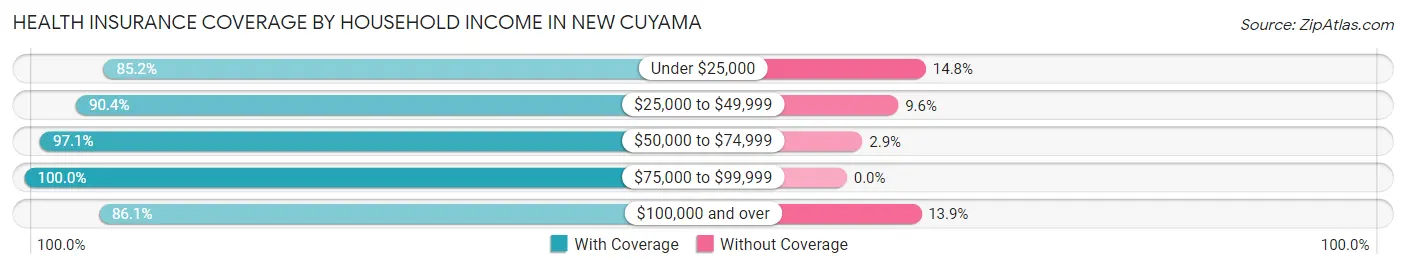
| Household Income | With Coverage | Without Coverage |
| Under $25,000 | 69 (85.2%) | 12 (14.8%) |
| $25,000 to $49,999 | 75 (90.4%) | 8 (9.6%) |
| $50,000 to $74,999 | 266 (97.1%) | 8 (2.9%) |
| $75,000 to $99,999 | 66 (100.0%) | 0 (0.0%) |
| $100,000 and over | 142 (86.1%) | 23 (13.9%) |
Public vs Private Health Insurance Coverage by Age in New Cuyama
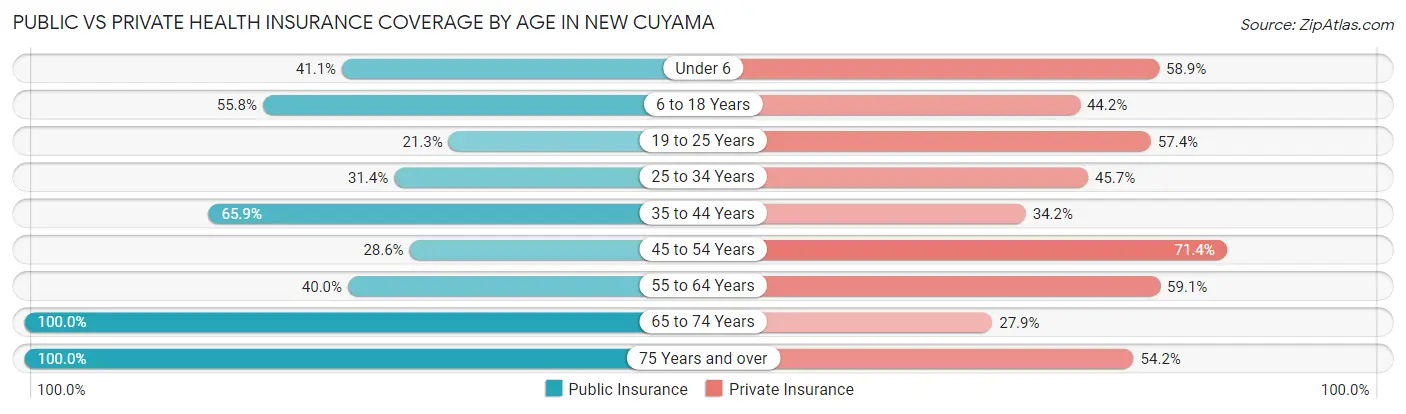
| Age Bracket | Public Insurance | Private Insurance |
| Under 6 | 30 (41.1%) | 43 (58.9%) |
| 6 to 18 Years | 53 (55.8%) | 42 (44.2%) |
| 19 to 25 Years | 13 (21.3%) | 35 (57.4%) |
| 25 to 34 Years | 22 (31.4%) | 32 (45.7%) |
| 35 to 44 Years | 27 (65.8%) | 14 (34.2%) |
| 45 to 54 Years | 24 (28.6%) | 60 (71.4%) |
| 55 to 64 Years | 44 (40.0%) | 65 (59.1%) |
| 65 to 74 Years | 111 (100.0%) | 31 (27.9%) |
| 75 Years and over | 24 (100.0%) | 13 (54.2%) |
| Total | 348 (52.0%) | 335 (50.1%) |
Disability Status by Sex by Age in New Cuyama
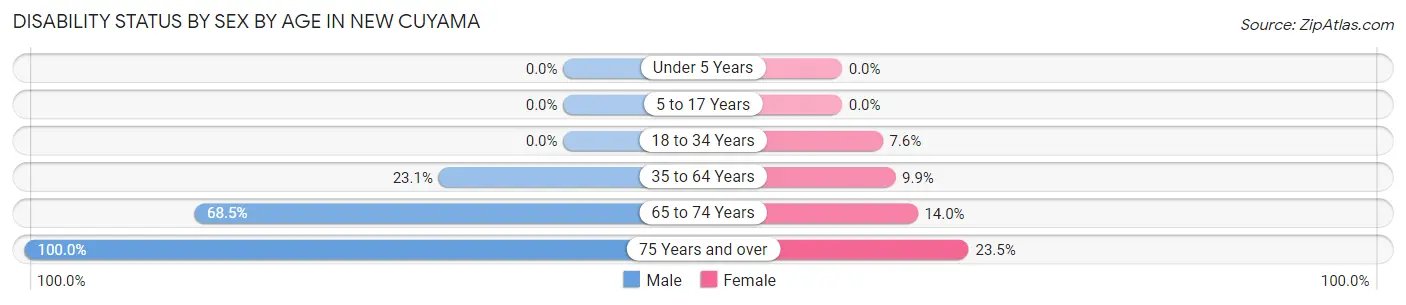
| Age Bracket | Male | Female |
| Under 5 Years | 0 (0.0%) | 0 (0.0%) |
| 5 to 17 Years | 0 (0.0%) | 0 (0.0%) |
| 18 to 34 Years | 0 (0.0%) | 4 (7.5%) |
| 35 to 64 Years | 31 (23.1%) | 10 (9.9%) |
| 65 to 74 Years | 37 (68.5%) | 8 (14.0%) |
| 75 Years and over | 7 (100.0%) | 4 (23.5%) |
Disability Class by Sex by Age in New Cuyama
Disability Class: Hearing Difficulty
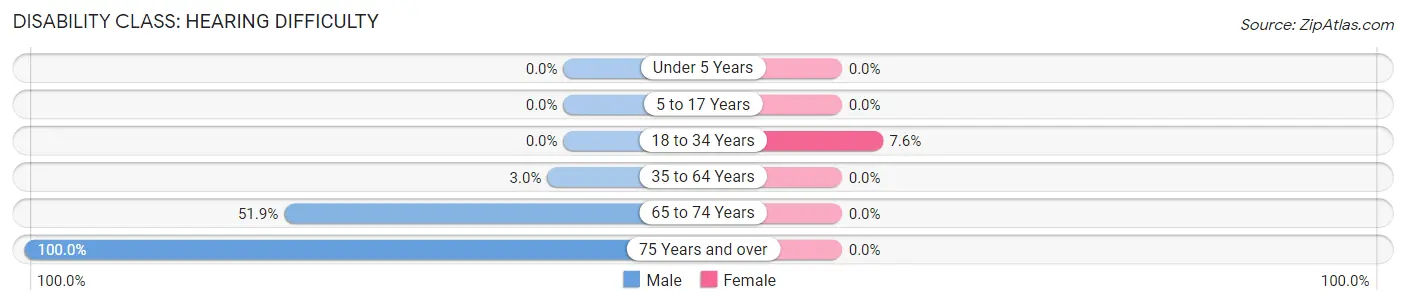
| Age Bracket | Male | Female |
| Under 5 Years | 0 (0.0%) | 0 (0.0%) |
| 5 to 17 Years | 0 (0.0%) | 0 (0.0%) |
| 18 to 34 Years | 0 (0.0%) | 4 (7.5%) |
| 35 to 64 Years | 4 (3.0%) | 0 (0.0%) |
| 65 to 74 Years | 28 (51.8%) | 0 (0.0%) |
| 75 Years and over | 7 (100.0%) | 0 (0.0%) |
Disability Class: Vision Difficulty
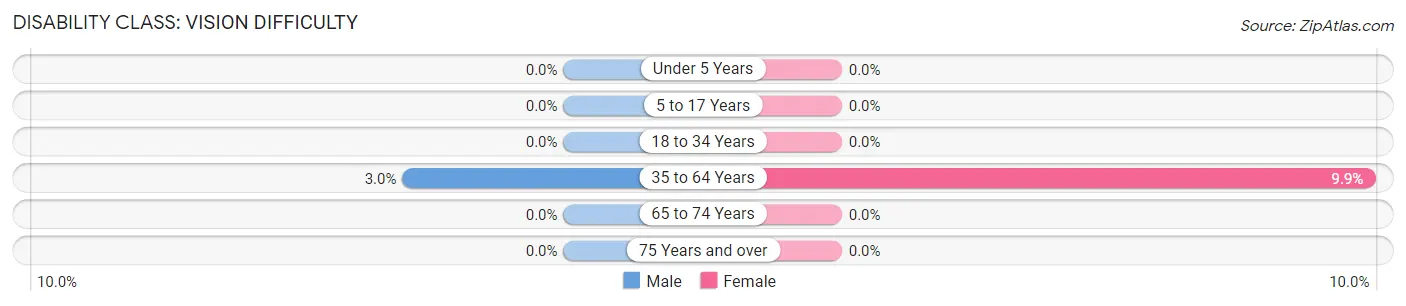
| Age Bracket | Male | Female |
| Under 5 Years | 0 (0.0%) | 0 (0.0%) |
| 5 to 17 Years | 0 (0.0%) | 0 (0.0%) |
| 18 to 34 Years | 0 (0.0%) | 0 (0.0%) |
| 35 to 64 Years | 4 (3.0%) | 10 (9.9%) |
| 65 to 74 Years | 0 (0.0%) | 0 (0.0%) |
| 75 Years and over | 0 (0.0%) | 0 (0.0%) |
Disability Class: Cognitive Difficulty
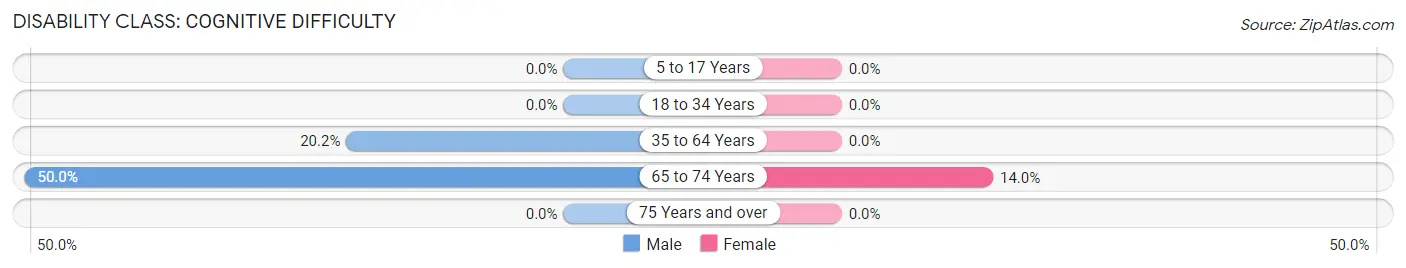
| Age Bracket | Male | Female |
| 5 to 17 Years | 0 (0.0%) | 0 (0.0%) |
| 18 to 34 Years | 0 (0.0%) | 0 (0.0%) |
| 35 to 64 Years | 27 (20.2%) | 0 (0.0%) |
| 65 to 74 Years | 27 (50.0%) | 8 (14.0%) |
| 75 Years and over | 0 (0.0%) | 0 (0.0%) |
Disability Class: Ambulatory Difficulty
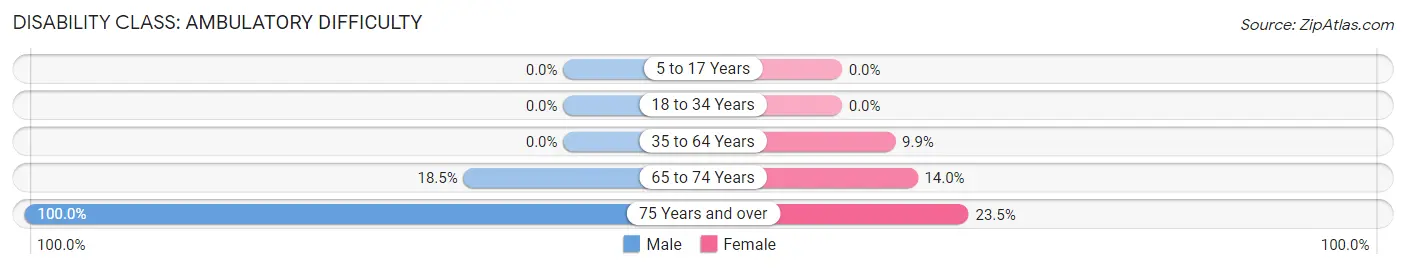
| Age Bracket | Male | Female |
| 5 to 17 Years | 0 (0.0%) | 0 (0.0%) |
| 18 to 34 Years | 0 (0.0%) | 0 (0.0%) |
| 35 to 64 Years | 0 (0.0%) | 10 (9.9%) |
| 65 to 74 Years | 10 (18.5%) | 8 (14.0%) |
| 75 Years and over | 7 (100.0%) | 4 (23.5%) |
Disability Class: Self-Care Difficulty
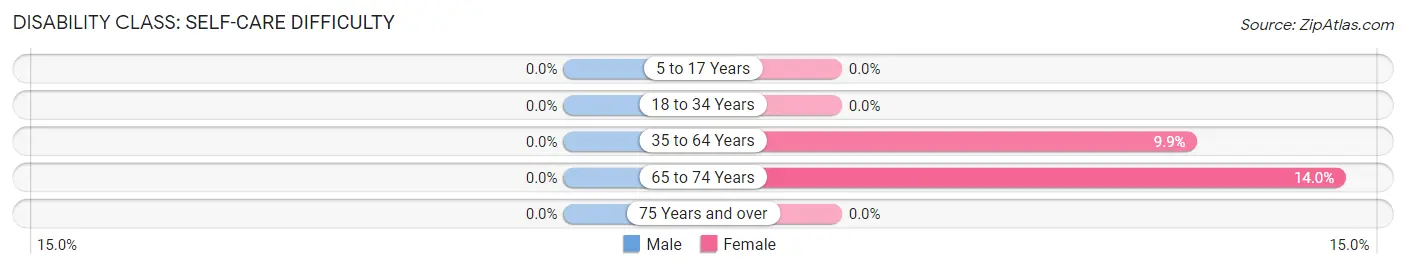
| Age Bracket | Male | Female |
| 5 to 17 Years | 0 (0.0%) | 0 (0.0%) |
| 18 to 34 Years | 0 (0.0%) | 0 (0.0%) |
| 35 to 64 Years | 0 (0.0%) | 10 (9.9%) |
| 65 to 74 Years | 0 (0.0%) | 8 (14.0%) |
| 75 Years and over | 0 (0.0%) | 0 (0.0%) |
Technology Access in New Cuyama
Computing Device Access in New Cuyama
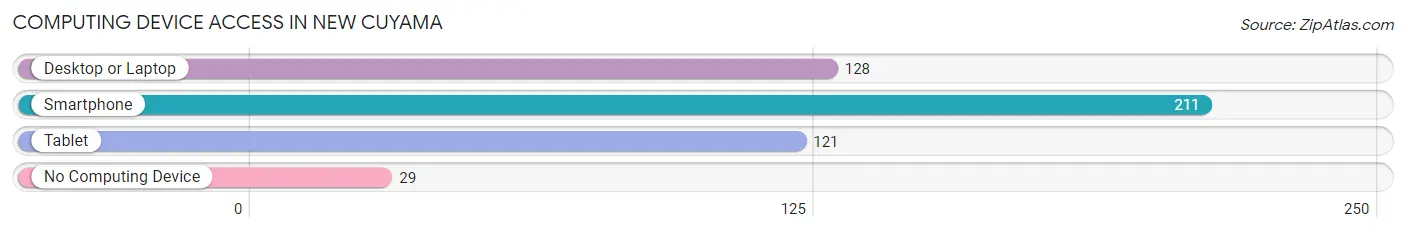
| Device Type | # Households | % Households |
| Desktop or Laptop | 128 | 50.2% |
| Smartphone | 211 | 82.8% |
| Tablet | 121 | 47.4% |
| No Computing Device | 29 | 11.4% |
| Total | 255 | 100.0% |
Internet Access in New Cuyama
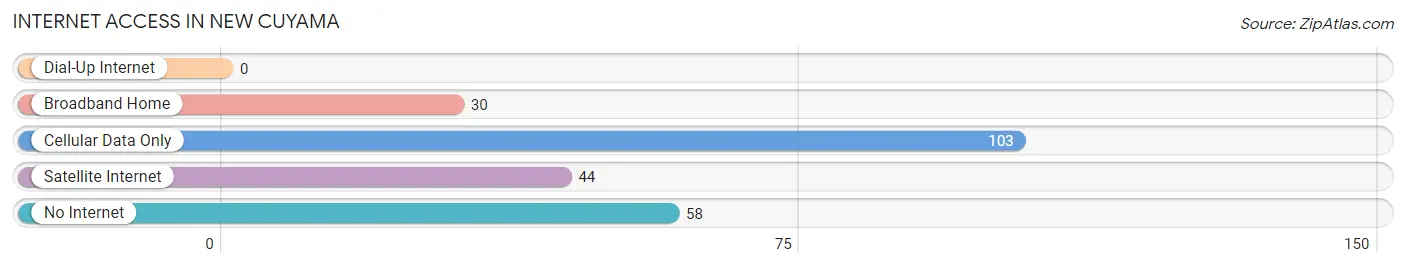
| Internet Type | # Households | % Households |
| Dial-Up Internet | 0 | 0.0% |
| Broadband Home | 30 | 11.8% |
| Cellular Data Only | 103 | 40.4% |
| Satellite Internet | 44 | 17.2% |
| No Internet | 58 | 22.8% |
| Total | 255 | 100.0% |
New Cuyama Summary
Cuyama is a small unincorporated community located in the northern part of Santa Barbara County, California. It is situated in the Cuyama Valley, which is part of the larger San Joaquin Valley. The population of Cuyama was estimated to be 1,073 in 2019.
History
The Cuyama Valley was originally inhabited by the Chumash people, who lived in the area for thousands of years before the arrival of Europeans. The first Europeans to explore the area were Spanish missionaries, who arrived in the late 18th century. The area was later settled by ranchers, who established large cattle ranches in the valley.
In the early 20th century, the Cuyama Valley was developed for oil production. The first oil well was drilled in the valley in 1921, and by the 1930s, the valley was producing more than 10,000 barrels of oil per day. The oil industry in the valley declined in the 1950s, and the area has since become primarily agricultural.
Geography
Cuyama is located in the northern part of Santa Barbara County, in the Cuyama Valley. The valley is part of the larger San Joaquin Valley, and is bordered by the Sierra Madre Mountains to the north and the San Rafael Mountains to the south. The valley is approximately 40 miles long and 10 miles wide, and is characterized by rolling hills and flat plains.
The climate in Cuyama is semi-arid, with hot summers and mild winters. The average annual temperature is 64°F, and the average annual precipitation is 8.5 inches.
Economy
The economy of Cuyama is primarily agricultural. The main crops grown in the valley are grapes, citrus, and vegetables. The area is also known for its cattle ranches, which produce beef, dairy, and wool.
In addition to agriculture, Cuyama is home to several small businesses, including restaurants, gas stations, and convenience stores. The area is also home to a few small manufacturing companies, which produce furniture, clothing, and other goods.
Demographics
As of 2019, the population of Cuyama was estimated to be 1,073. The racial makeup of the town was 79.3% White, 0.7% African American, 0.3% Native American, 0.2% Asian, 0.1% Pacific Islander, 16.2% from other races, and 3.4% from two or more races. Hispanic or Latino of any race were 33.2% of the population.
The median household income in Cuyama was $41,250 in 2019, and the median home value was $220,000. The unemployment rate in the town was 8.2%. The poverty rate was 22.3%.
Common Questions
What is Per Capita Income in New Cuyama?
Per Capita income in New Cuyama is $23,719.
What is the Median Family Income in New Cuyama?
Median Family Income in New Cuyama is $68,438.
What is the Median Household income in New Cuyama?
Median Household Income in New Cuyama is $55,104.
What is Income or Wage Gap in New Cuyama?
Income or Wage Gap in New Cuyama is 41.3%.
Women in New Cuyama earn 58.7 cents for every dollar earned by a man.
What is Inequality or Gini Index in New Cuyama?
Inequality or Gini Index in New Cuyama is 0.39.
What is the Total Population of New Cuyama?
Total Population of New Cuyama is 669.
What is the Total Male Population of New Cuyama?
Total Male Population of New Cuyama is 320.
What is the Total Female Population of New Cuyama?
Total Female Population of New Cuyama is 349.
What is the Ratio of Males per 100 Females in New Cuyama?
There are 91.69 Males per 100 Females in New Cuyama.
What is the Ratio of Females per 100 Males in New Cuyama?
There are 109.06 Females per 100 Males in New Cuyama.
What is the Median Population Age in New Cuyama?
Median Population Age in New Cuyama is 41.3 Years.
What is the Average Family Size in New Cuyama
Average Family Size in New Cuyama is 3.4 People.
What is the Average Household Size in New Cuyama
Average Household Size in New Cuyama is 2.6 People.
How Large is the Labor Force in New Cuyama?
There are 255 People in the Labor Forcein in New Cuyama.
What is the Percentage of People in the Labor Force in New Cuyama?
50.5% of People are in the Labor Force in New Cuyama.
What is the Unemployment Rate in New Cuyama?
Unemployment Rate in New Cuyama is 9.0%.