Cities with the Highest Percentage of Population with a Degree in Visual and Performing Arts in South Dakota
RELATED REPORTS & OPTIONS
Visual and Performing Arts
South Dakota
Compare Cities
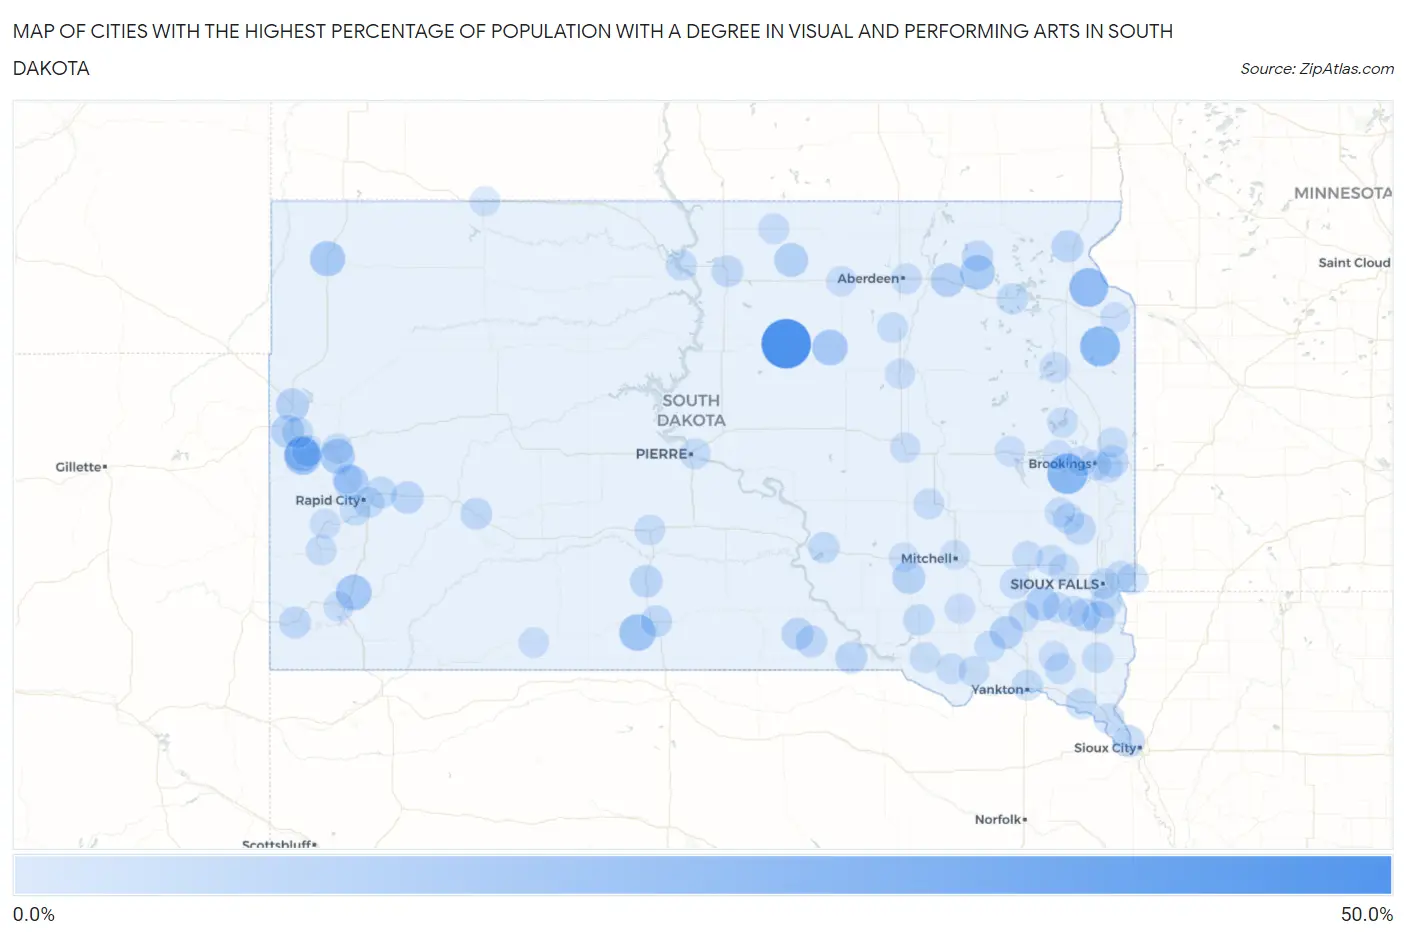
Map of Cities with the Highest Percentage of Population with a Degree in Visual and Performing Arts in South Dakota
0.0%
50.0%
Cities with the Highest Percentage of Population with a Degree in Visual and Performing Arts in South Dakota
| City | % Graduates | vs State | vs National | |
| 1. | West Brule | 50.0% | 2.7%(+47.3)#1 | 4.3%(+45.7)#109 |
| 2. | Seneca | 50.0% | 2.7%(+47.3)#2 | 4.3%(+45.7)#123 |
| 3. | Kenel | 30.3% | 2.7%(+27.6)#3 | 4.3%(+26.1)#307 |
| 4. | Sinai | 26.3% | 2.7%(+23.6)#4 | 4.3%(+22.1)#395 |
| 5. | Strandburg | 25.0% | 2.7%(+22.3)#5 | 4.3%(+20.7)#443 |
| 6. | Wilmot | 22.1% | 2.7%(+19.4)#6 | 4.3%(+17.8)#526 |
| 7. | Lead | 17.8% | 2.7%(+15.1)#7 | 4.3%(+13.5)#795 |
| 8. | Rosebud | 16.7% | 2.7%(+14.0)#8 | 4.3%(+12.4)#865 |
| 9. | Central City | 14.3% | 2.7%(+11.6)#9 | 4.3%(+10.0)#1,166 |
| 10. | Buffalo Gap | 14.3% | 2.7%(+11.6)#10 | 4.3%(+10.0)#1,167 |
| 11. | Faulkton | 14.1% | 2.7%(+11.4)#11 | 4.3%(+9.89)#1,181 |
| 12. | Oahe Acres | 13.9% | 2.7%(+11.1)#12 | 4.3%(+9.61)#1,217 |
| 13. | Buffalo | 13.1% | 2.7%(+10.4)#13 | 4.3%(+8.86)#1,332 |
| 14. | Pierpont | 12.5% | 2.7%(+9.78)#14 | 4.3%(+8.25)#1,431 |
| 15. | Blucksberg Mountain | 12.2% | 2.7%(+9.45)#15 | 4.3%(+7.92)#1,493 |
| 16. | Summerset | 11.8% | 2.7%(+9.03)#16 | 4.3%(+7.50)#1,583 |
| 17. | Marion | 10.4% | 2.7%(+7.66)#17 | 4.3%(+6.13)#1,936 |
| 18. | Hosmer | 9.9% | 2.7%(+7.16)#18 | 4.3%(+5.62)#2,111 |
| 19. | Groton | 9.3% | 2.7%(+6.60)#19 | 4.3%(+5.06)#2,316 |
| 20. | Belle Fourche | 8.2% | 2.7%(+5.47)#20 | 4.3%(+3.94)#2,877 |
| 21. | North Spearfish | 8.1% | 2.7%(+5.42)#21 | 4.3%(+3.89)#2,897 |
| 22. | Stickney | 8.1% | 2.7%(+5.39)#22 | 4.3%(+3.86)#2,913 |
| 23. | Menno | 7.9% | 2.7%(+5.14)#23 | 4.3%(+3.61)#3,052 |
| 24. | Worthing | 7.2% | 2.7%(+4.53)#24 | 4.3%(+2.99)#3,493 |
| 25. | White River | 6.8% | 2.7%(+4.10)#25 | 4.3%(+2.57)#3,876 |
| 26. | North Sioux City | 6.4% | 2.7%(+3.68)#26 | 4.3%(+2.15)#4,295 |
| 27. | New Underwood | 6.2% | 2.7%(+3.53)#27 | 4.3%(+2.00)#4,439 |
| 28. | Lennox | 6.1% | 2.7%(+3.42)#28 | 4.3%(+1.88)#4,559 |
| 29. | Sisseton | 5.8% | 2.7%(+3.10)#29 | 4.3%(+1.57)#4,923 |
| 30. | Gregory | 5.8% | 2.7%(+3.08)#30 | 4.3%(+1.54)#4,951 |
| 31. | Bonesteel | 5.4% | 2.7%(+2.69)#31 | 4.3%(+1.15)#5,438 |
| 32. | Bushnell | 5.3% | 2.7%(+2.55)#32 | 4.3%(+1.01)#5,642 |
| 33. | Edgemont | 5.2% | 2.7%(+2.50)#33 | 4.3%(+0.965)#5,689 |
| 34. | Burke | 5.1% | 2.7%(+2.35)#34 | 4.3%(+0.811)#5,908 |
| 35. | Wall | 5.0% | 2.7%(+2.24)#35 | 4.3%(+0.707)#6,069 |
| 36. | Mission | 4.9% | 2.7%(+2.22)#36 | 4.3%(+0.686)#6,100 |
| 37. | Selby | 4.8% | 2.7%(+2.10)#37 | 4.3%(+0.567)#6,321 |
| 38. | Chester | 4.8% | 2.7%(+2.05)#38 | 4.3%(+0.510)#6,430 |
| 39. | Langford | 4.5% | 2.7%(+1.79)#39 | 4.3%(+0.252)#6,900 |
| 40. | Webster | 4.2% | 2.7%(+1.51)#40 | 4.3%(-0.027)#7,455 |
| 41. | Box Elder | 4.2% | 2.7%(+1.50)#41 | 4.3%(-0.041)#7,484 |
| 42. | Armour | 4.1% | 2.7%(+1.38)#42 | 4.3%(-0.154)#7,728 |
| 43. | Deadwood | 3.9% | 2.7%(+1.22)#43 | 4.3%(-0.320)#8,068 |
| 44. | Pukwana | 3.9% | 2.7%(+1.21)#44 | 4.3%(-0.331)#8,108 |
| 45. | Spearfish | 3.9% | 2.7%(+1.14)#45 | 4.3%(-0.400)#8,262 |
| 46. | Vermillion | 3.8% | 2.7%(+1.13)#46 | 4.3%(-0.404)#8,266 |
| 47. | Harrisburg | 3.8% | 2.7%(+1.13)#47 | 4.3%(-0.406)#8,269 |
| 48. | Sioux Falls | 3.7% | 2.7%(+0.957)#48 | 4.3%(-0.578)#8,650 |
| 49. | Rapid City | 3.3% | 2.7%(+0.547)#49 | 4.3%(-0.989)#9,688 |
| 50. | Valley Springs | 3.1% | 2.7%(+0.409)#50 | 4.3%(-1.13)#10,024 |
| 51. | Lake Madison | 3.1% | 2.7%(+0.386)#51 | 4.3%(-1.15)#10,081 |
| 52. | Colonial Pine Hills | 3.0% | 2.7%(+0.319)#52 | 4.3%(-1.22)#10,248 |
| 53. | Scotland | 3.0% | 2.7%(+0.314)#53 | 4.3%(-1.22)#10,266 |
| 54. | Wakonda | 3.0% | 2.7%(+0.314)#54 | 4.3%(-1.22)#10,278 |
| 55. | Yankton | 3.0% | 2.7%(+0.310)#55 | 4.3%(-1.23)#10,292 |
| 56. | Mobridge | 3.0% | 2.7%(+0.301)#56 | 4.3%(-1.23)#10,319 |
| 57. | Beresford | 2.9% | 2.7%(+0.196)#57 | 4.3%(-1.34)#10,578 |
| 58. | Woonsocket | 2.9% | 2.7%(+0.141)#58 | 4.3%(-1.39)#10,726 |
| 59. | Brandon | 2.9% | 2.7%(+0.134)#59 | 4.3%(-1.40)#10,750 |
| 60. | Pierre | 2.8% | 2.7%(+0.113)#60 | 4.3%(-1.42)#10,798 |
| 61. | Eureka | 2.8% | 2.7%(+0.061)#61 | 4.3%(-1.47)#10,934 |
| 62. | Aberdeen | 2.7% | 2.7%(+0.024)#62 | 4.3%(-1.51)#11,037 |
| 63. | Chancellor | 2.7% | 2.7%(-0.014)#63 | 4.3%(-1.55)#11,122 |
| 64. | Watertown | 2.7% | 2.7%(-0.018)#64 | 4.3%(-1.55)#11,137 |
| 65. | Sturgis | 2.7% | 2.7%(-0.059)#65 | 4.3%(-1.59)#11,241 |
| 66. | Aurora | 2.6% | 2.7%(-0.099)#66 | 4.3%(-1.63)#11,342 |
| 67. | Mina | 2.6% | 2.7%(-0.136)#67 | 4.3%(-1.67)#11,432 |
| 68. | Wagner | 2.5% | 2.7%(-0.174)#68 | 4.3%(-1.71)#11,536 |
| 69. | Salem | 2.5% | 2.7%(-0.191)#69 | 4.3%(-1.73)#11,583 |
| 70. | Montrose | 2.4% | 2.7%(-0.363)#70 | 4.3%(-1.90)#12,026 |
| 71. | Freeman | 2.3% | 2.7%(-0.380)#71 | 4.3%(-1.92)#12,060 |
| 72. | Avon | 2.2% | 2.7%(-0.469)#72 | 4.3%(-2.00)#12,288 |
| 73. | Murdo | 2.2% | 2.7%(-0.478)#73 | 4.3%(-2.01)#12,307 |
| 74. | Custer | 2.2% | 2.7%(-0.490)#74 | 4.3%(-2.03)#12,327 |
| 75. | Elk Point | 2.2% | 2.7%(-0.564)#75 | 4.3%(-2.10)#12,510 |
| 76. | Tyndall | 2.1% | 2.7%(-0.580)#76 | 4.3%(-2.12)#12,548 |
| 77. | Bridgewater | 2.1% | 2.7%(-0.633)#77 | 4.3%(-2.17)#12,697 |
| 78. | Northville | 2.1% | 2.7%(-0.633)#78 | 4.3%(-2.17)#12,699 |
| 79. | Wolsey | 2.0% | 2.7%(-0.716)#79 | 4.3%(-2.25)#12,910 |
| 80. | Madison | 1.9% | 2.7%(-0.831)#80 | 4.3%(-2.37)#13,173 |
| 81. | Lake Poinsett | 1.8% | 2.7%(-0.898)#81 | 4.3%(-2.43)#13,339 |
| 82. | Parker | 1.8% | 2.7%(-0.941)#82 | 4.3%(-2.48)#13,438 |
| 83. | Brookings | 1.8% | 2.7%(-0.951)#83 | 4.3%(-2.49)#13,465 |
| 84. | Piedmont | 1.8% | 2.7%(-0.962)#84 | 4.3%(-2.50)#13,497 |
| 85. | Martin | 1.7% | 2.7%(-0.985)#85 | 4.3%(-2.52)#13,545 |
| 86. | Irene | 1.7% | 2.7%(-0.992)#86 | 4.3%(-2.53)#13,563 |
| 87. | Hot Springs | 1.6% | 2.7%(-1.07)#87 | 4.3%(-2.61)#13,731 |
| 88. | Hill City | 1.6% | 2.7%(-1.09)#88 | 4.3%(-2.63)#13,775 |
| 89. | Ipswich | 1.6% | 2.7%(-1.13)#89 | 4.3%(-2.66)#13,867 |
| 90. | White | 1.6% | 2.7%(-1.13)#90 | 4.3%(-2.66)#13,872 |
| 91. | Volga | 1.5% | 2.7%(-1.18)#91 | 4.3%(-2.72)#13,983 |
| 92. | Redfield | 1.5% | 2.7%(-1.20)#92 | 4.3%(-2.74)#14,025 |
| 93. | Milbank | 1.5% | 2.7%(-1.24)#93 | 4.3%(-2.77)#14,104 |
| 94. | Parkston | 1.5% | 2.7%(-1.25)#94 | 4.3%(-2.79)#14,128 |
| 95. | Humboldt | 1.5% | 2.7%(-1.26)#95 | 4.3%(-2.79)#14,139 |
| 96. | De Smet | 1.3% | 2.7%(-1.43)#96 | 4.3%(-2.97)#14,521 |
| 97. | Arlington | 1.3% | 2.7%(-1.46)#97 | 4.3%(-2.99)#14,563 |
| 98. | Lemmon | 1.2% | 2.7%(-1.55)#98 | 4.3%(-3.09)#14,741 |
| 99. | Plankinton | 0.93% | 2.7%(-1.78)#99 | 4.3%(-3.32)#15,117 |
| 100. | Mitchell | 0.81% | 2.7%(-1.91)#100 | 4.3%(-3.44)#15,307 |
Common Questions
What are the Top 10 Cities with the Highest Percentage of Population with a Degree in Visual and Performing Arts in South Dakota?
Top 10 Cities with the Highest Percentage of Population with a Degree in Visual and Performing Arts in South Dakota are:
#1
50.0%
#2
26.3%
#3
25.0%
#4
22.1%
#5
17.8%
#6
16.7%
#7
14.3%
#8
14.3%
#9
14.1%
#10
13.1%
What city has the Highest Percentage of Population with a Degree in Visual and Performing Arts in South Dakota?
Seneca has the Highest Percentage of Population with a Degree in Visual and Performing Arts in South Dakota with 50.0%.
What is the Percentage of Population with a Degree in Visual and Performing Arts in the State of South Dakota?
Percentage of Population with a Degree in Visual and Performing Arts in South Dakota is 2.7%.
What is the Percentage of Population with a Degree in Visual and Performing Arts in the United States?
Percentage of Population with a Degree in Visual and Performing Arts in the United States is 4.3%.