Cities with the Highest Percentage of Population with a Degree in Visual and Performing Arts in Connecticut
RELATED REPORTS & OPTIONS
Visual and Performing Arts
Connecticut
Compare Cities
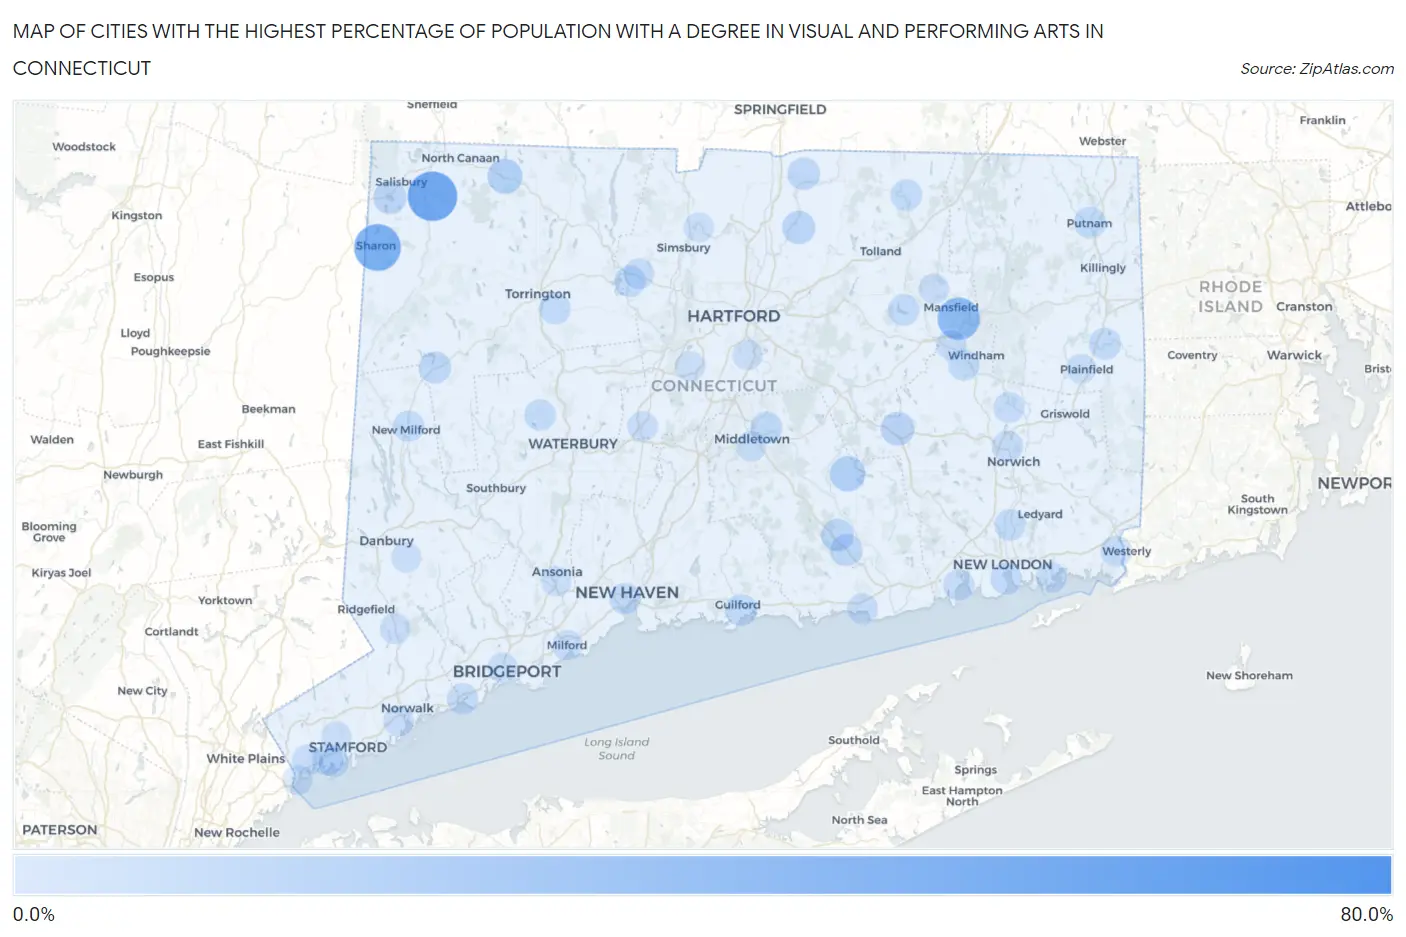
Map of Cities with the Highest Percentage of Population with a Degree in Visual and Performing Arts in Connecticut
0.0%
80.0%
Cities with the Highest Percentage of Population with a Degree in Visual and Performing Arts in Connecticut
| City | % Graduates | vs State | vs National | |
| 1. | Lake Chaffee | 60.5% | 4.7%(+55.8)#1 | 4.3%(+56.3)#79 |
| 2. | Falls Village | 44.9% | 4.7%(+40.1)#2 | 4.3%(+40.6)#150 |
| 3. | Sharon | 39.2% | 4.7%(+34.5)#3 | 4.3%(+35.0)#179 |
| 4. | Cornwall | 35.7% | 4.7%(+31.0)#4 | 4.3%(+31.5)#219 |
| 5. | Candlewood Knolls | 34.1% | 4.7%(+29.4)#5 | 4.3%(+29.9)#238 |
| 6. | Bridgewater | 33.8% | 4.7%(+29.0)#6 | 4.3%(+29.5)#240 |
| 7. | West Cornwall | 33.3% | 4.7%(+28.6)#7 | 4.3%(+29.1)#269 |
| 8. | Topstone | 32.6% | 4.7%(+27.9)#8 | 4.3%(+28.3)#277 |
| 9. | Mansfield Center | 29.8% | 4.7%(+25.1)#9 | 4.3%(+25.5)#315 |
| 10. | Inglenook | 27.8% | 4.7%(+23.0)#10 | 4.3%(+23.5)#361 |
| 11. | Jewett City Borough | 23.5% | 4.7%(+18.8)#11 | 4.3%(+19.2)#476 |
| 12. | Cornwall Bridge | 21.0% | 4.7%(+16.2)#12 | 4.3%(+16.7)#577 |
| 13. | Redding Center | 19.1% | 4.7%(+14.4)#13 | 4.3%(+14.9)#700 |
| 14. | Moodus | 15.4% | 4.7%(+10.7)#14 | 4.3%(+11.2)#1,018 |
| 15. | Stratford Downtown | 15.3% | 4.7%(+10.6)#15 | 4.3%(+11.1)#1,032 |
| 16. | Dayville | 15.0% | 4.7%(+10.3)#16 | 4.3%(+10.7)#1,060 |
| 17. | Norfolk | 14.6% | 4.7%(+9.86)#17 | 4.3%(+10.3)#1,112 |
| 18. | Lakes West | 13.9% | 4.7%(+9.21)#18 | 4.3%(+9.68)#1,209 |
| 19. | Staples | 12.8% | 4.7%(+8.09)#19 | 4.3%(+8.56)#1,372 |
| 20. | Poplar Plains | 12.0% | 4.7%(+7.33)#20 | 4.3%(+7.79)#1,514 |
| 21. | Colchester | 11.9% | 4.7%(+7.22)#21 | 4.3%(+7.69)#1,532 |
| 22. | Taylor Corners | 11.0% | 4.7%(+6.28)#22 | 4.3%(+6.75)#1,751 |
| 23. | Broad Brook | 11.0% | 4.7%(+6.25)#23 | 4.3%(+6.72)#1,754 |
| 24. | Lakeville | 10.6% | 4.7%(+5.90)#24 | 4.3%(+6.36)#1,867 |
| 25. | Chester Center | 10.0% | 4.7%(+5.28)#25 | 4.3%(+5.75)#2,051 |
| 26. | Indian Field | 9.7% | 4.7%(+5.03)#26 | 4.3%(+5.50)#2,155 |
| 27. | Hazardville | 9.7% | 4.7%(+5.01)#27 | 4.3%(+5.47)#2,164 |
| 28. | Deep River Center | 9.5% | 4.7%(+4.77)#28 | 4.3%(+5.24)#2,253 |
| 29. | Trumbull Center | 9.2% | 4.7%(+4.43)#29 | 4.3%(+4.90)#2,380 |
| 30. | New Preston | 9.0% | 4.7%(+4.28)#30 | 4.3%(+4.75)#2,450 |
| 31. | Weston | 8.7% | 4.7%(+3.98)#31 | 4.3%(+4.44)#2,602 |
| 32. | Ball Pond | 8.7% | 4.7%(+3.95)#32 | 4.3%(+4.42)#2,618 |
| 33. | Moosup | 8.5% | 4.7%(+3.81)#33 | 4.3%(+4.27)#2,688 |
| 34. | Northford | 8.5% | 4.7%(+3.74)#34 | 4.3%(+4.20)#2,720 |
| 35. | Gaylordsville | 8.4% | 4.7%(+3.71)#35 | 4.3%(+4.17)#2,733 |
| 36. | Putnam | 8.4% | 4.7%(+3.69)#36 | 4.3%(+4.16)#2,739 |
| 37. | Guilford Center | 8.4% | 4.7%(+3.68)#37 | 4.3%(+4.14)#2,744 |
| 38. | Portland | 8.4% | 4.7%(+3.64)#38 | 4.3%(+4.11)#2,765 |
| 39. | Mill Plain | 8.3% | 4.7%(+3.60)#39 | 4.3%(+4.06)#2,806 |
| 40. | Bantam Borough | 8.3% | 4.7%(+3.55)#40 | 4.3%(+4.01)#2,833 |
| 41. | Sacred Heart University | 7.9% | 4.7%(+3.22)#41 | 4.3%(+3.68)#3,009 |
| 42. | New London | 7.9% | 4.7%(+3.14)#42 | 4.3%(+3.61)#3,050 |
| 43. | Stepney | 7.8% | 4.7%(+3.08)#43 | 4.3%(+3.54)#3,090 |
| 44. | Gales Ferry | 7.8% | 4.7%(+3.05)#44 | 4.3%(+3.52)#3,113 |
| 45. | Tokeneke | 7.6% | 4.7%(+2.93)#45 | 4.3%(+3.39)#3,200 |
| 46. | Stafford Springs | 7.6% | 4.7%(+2.90)#46 | 4.3%(+3.37)#3,214 |
| 47. | Candlewood Isle | 7.4% | 4.7%(+2.73)#47 | 4.3%(+3.19)#3,325 |
| 48. | Watertown | 7.4% | 4.7%(+2.71)#48 | 4.3%(+3.17)#3,338 |
| 49. | Northwest Harwinton | 7.4% | 4.7%(+2.68)#49 | 4.3%(+3.15)#3,371 |
| 50. | New Haven | 7.3% | 4.7%(+2.62)#50 | 4.3%(+3.08)#3,411 |
| 51. | Plattsville | 7.3% | 4.7%(+2.59)#51 | 4.3%(+3.06)#3,441 |
| 52. | Collinsville | 7.3% | 4.7%(+2.56)#52 | 4.3%(+3.03)#3,465 |
| 53. | Mamanasco Lake | 7.3% | 4.7%(+2.55)#53 | 4.3%(+3.02)#3,471 |
| 54. | Newtown Borough | 7.2% | 4.7%(+2.53)#54 | 4.3%(+2.99)#3,491 |
| 55. | South Windham | 7.2% | 4.7%(+2.47)#55 | 4.3%(+2.93)#3,530 |
| 56. | South Coventry | 7.2% | 4.7%(+2.46)#56 | 4.3%(+2.92)#3,540 |
| 57. | New Milford | 7.1% | 4.7%(+2.41)#57 | 4.3%(+2.88)#3,609 |
| 58. | Norwich | 7.1% | 4.7%(+2.36)#58 | 4.3%(+2.83)#3,639 |
| 59. | Candlewood Orchards | 7.1% | 4.7%(+2.35)#59 | 4.3%(+2.82)#3,652 |
| 60. | Southport | 7.0% | 4.7%(+2.33)#60 | 4.3%(+2.79)#3,669 |
| 61. | Pawcatuck | 7.0% | 4.7%(+2.31)#61 | 4.3%(+2.77)#3,683 |
| 62. | Lakes East | 6.9% | 4.7%(+2.17)#62 | 4.3%(+2.64)#3,799 |
| 63. | Baltic | 6.8% | 4.7%(+2.13)#63 | 4.3%(+2.60)#3,836 |
| 64. | Riverside | 6.8% | 4.7%(+2.10)#64 | 4.3%(+2.57)#3,861 |
| 65. | Niantic | 6.8% | 4.7%(+2.08)#65 | 4.3%(+2.54)#3,897 |
| 66. | South Wilton | 6.8% | 4.7%(+2.07)#66 | 4.3%(+2.53)#3,911 |
| 67. | Greens Farms | 6.5% | 4.7%(+1.82)#67 | 4.3%(+2.29)#4,160 |
| 68. | Noroton Heights | 6.4% | 4.7%(+1.68)#68 | 4.3%(+2.15)#4,289 |
| 69. | Compo | 6.2% | 4.7%(+1.53)#69 | 4.3%(+1.99)#4,464 |
| 70. | Canton Valley | 6.2% | 4.7%(+1.50)#70 | 4.3%(+1.96)#4,486 |
| 71. | Saybrook Manor | 6.2% | 4.7%(+1.49)#71 | 4.3%(+1.96)#4,498 |
| 72. | Norwalk | 6.1% | 4.7%(+1.42)#72 | 4.3%(+1.89)#4,547 |
| 73. | Noank | 6.1% | 4.7%(+1.37)#73 | 4.3%(+1.84)#4,606 |
| 74. | Darien Downtown | 6.1% | 4.7%(+1.36)#74 | 4.3%(+1.83)#4,626 |
| 75. | Westport | 6.0% | 4.7%(+1.29)#75 | 4.3%(+1.76)#4,714 |
| 76. | Georgetown | 6.0% | 4.7%(+1.28)#76 | 4.3%(+1.75)#4,722 |
| 77. | Naugatuck Borough | 5.9% | 4.7%(+1.20)#77 | 4.3%(+1.66)#4,799 |
| 78. | Sandy Hook | 5.6% | 4.7%(+0.922)#78 | 4.3%(+1.39)#5,131 |
| 79. | West Mountain | 5.6% | 4.7%(+0.882)#79 | 4.3%(+1.35)#5,182 |
| 80. | Oronoque | 5.6% | 4.7%(+0.858)#80 | 4.3%(+1.32)#5,203 |
| 81. | Milford City Balance | 5.6% | 4.7%(+0.855)#81 | 4.3%(+1.32)#5,205 |
| 82. | Plantsville | 5.5% | 4.7%(+0.770)#82 | 4.3%(+1.24)#5,322 |
| 83. | Willimantic | 5.4% | 4.7%(+0.682)#83 | 4.3%(+1.15)#5,449 |
| 84. | Storrs | 5.3% | 4.7%(+0.627)#84 | 4.3%(+1.09)#5,520 |
| 85. | Middletown | 5.3% | 4.7%(+0.607)#85 | 4.3%(+1.07)#5,542 |
| 86. | Greenwich | 5.3% | 4.7%(+0.560)#86 | 4.3%(+1.03)#5,598 |
| 87. | Stonington Borough | 5.2% | 4.7%(+0.518)#87 | 4.3%(+0.983)#5,672 |
| 88. | Derby | 5.2% | 4.7%(+0.460)#88 | 4.3%(+0.926)#5,736 |
| 89. | New Britain | 5.2% | 4.7%(+0.436)#89 | 4.3%(+0.902)#5,773 |
| 90. | Bethel | 5.1% | 4.7%(+0.389)#90 | 4.3%(+0.855)#5,835 |
| 91. | Lordship | 5.1% | 4.7%(+0.348)#91 | 4.3%(+0.814)#5,901 |
| 92. | Old Greenwich | 5.0% | 4.7%(+0.328)#92 | 4.3%(+0.794)#5,931 |
| 93. | Wethersfield | 5.0% | 4.7%(+0.304)#93 | 4.3%(+0.770)#5,960 |
| 94. | Noroton | 5.0% | 4.7%(+0.270)#94 | 4.3%(+0.736)#6,019 |
| 95. | Stamford | 4.9% | 4.7%(+0.227)#95 | 4.3%(+0.693)#6,088 |
| 96. | Bridgeport | 4.9% | 4.7%(+0.225)#96 | 4.3%(+0.691)#6,091 |
| 97. | Byram | 4.9% | 4.7%(+0.186)#97 | 4.3%(+0.652)#6,160 |
| 98. | Tariffville | 4.8% | 4.7%(+0.106)#98 | 4.3%(+0.572)#6,311 |
| 99. | Plainfield Village | 4.8% | 4.7%(+0.074)#99 | 4.3%(+0.540)#6,365 |
| 100. | Old Hill | 4.8% | 4.7%(+0.060)#100 | 4.3%(+0.526)#6,385 |
Common Questions
What are the Top 10 Cities with the Highest Percentage of Population with a Degree in Visual and Performing Arts in Connecticut?
Top 10 Cities with the Highest Percentage of Population with a Degree in Visual and Performing Arts in Connecticut are:
#1
44.9%
#2
39.2%
#3
29.8%
#4
15.4%
#5
14.6%
#6
11.9%
#7
11.0%
#8
10.6%
#9
10.0%
#10
9.7%
What city has the Highest Percentage of Population with a Degree in Visual and Performing Arts in Connecticut?
Falls Village has the Highest Percentage of Population with a Degree in Visual and Performing Arts in Connecticut with 44.9%.
What is the Percentage of Population with a Degree in Visual and Performing Arts in the State of Connecticut?
Percentage of Population with a Degree in Visual and Performing Arts in Connecticut is 4.7%.
What is the Percentage of Population with a Degree in Visual and Performing Arts in the United States?
Percentage of Population with a Degree in Visual and Performing Arts in the United States is 4.3%.