Whitewater, CA Map & Demographics
Whitewater Map
Whitewater Overview
$22,707
PER CAPITA INCOME
$81,125
AVG FAMILY INCOME
$74,602
AVG HOUSEHOLD INCOME
20.3%
WAGE / INCOME GAP [ % ]
79.7¢/ $1
WAGE / INCOME GAP [ $ ]
$11,339
FAMILY INCOME DEFICIT
0.33
INEQUALITY / GINI INDEX
1,194
TOTAL POPULATION
635
MALE POPULATION
559
FEMALE POPULATION
113.60
MALES / 100 FEMALES
88.03
FEMALES / 100 MALES
39.1
MEDIAN AGE
3.8
AVG FAMILY SIZE
3.3
AVG HOUSEHOLD SIZE
597
LABOR FORCE [ PEOPLE ]
62.2%
PERCENT IN LABOR FORCE
9.9%
UNEMPLOYMENT RATE
Whitewater Zip Codes
Income in Whitewater
Income Overview in Whitewater
Per Capita Income in Whitewater is $22,707, while median incomes of families and households are $81,125 and $74,602 respectively.
| Characteristic | Number | Measure |
| Per Capita Income | 1,194 | $22,707 |
| Median Family Income | 263 | $81,125 |
| Mean Family Income | 263 | $77,680 |
| Median Household Income | 355 | $74,602 |
| Mean Household Income | 355 | $70,770 |
| Income Deficit | 263 | $11,339 |
| Wage / Income Gap (%) | 1,194 | 20.29% |
| Wage / Income Gap ($) | 1,194 | 79.71¢ per $1 |
| Gini / Inequality Index | 1,194 | 0.33 |
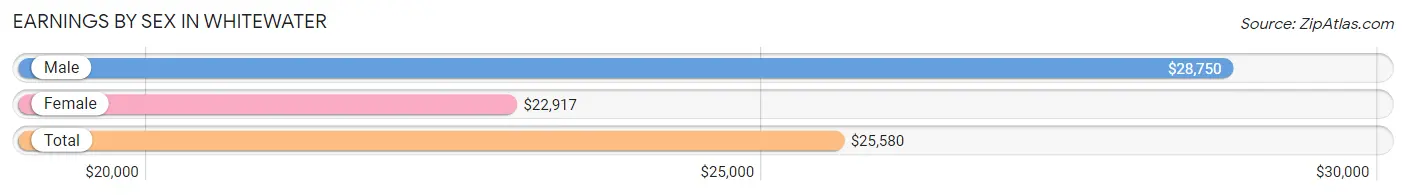
Earnings by Sex in Whitewater
Average Earnings in Whitewater are $25,580, $28,750 for men and $22,917 for women, a difference of 20.3%.
| Sex | Number | Average Earnings |
| Male | 387 (68.0%) | $28,750 |
| Female | 182 (32.0%) | $22,917 |
| Total | 569 (100.0%) | $25,580 |
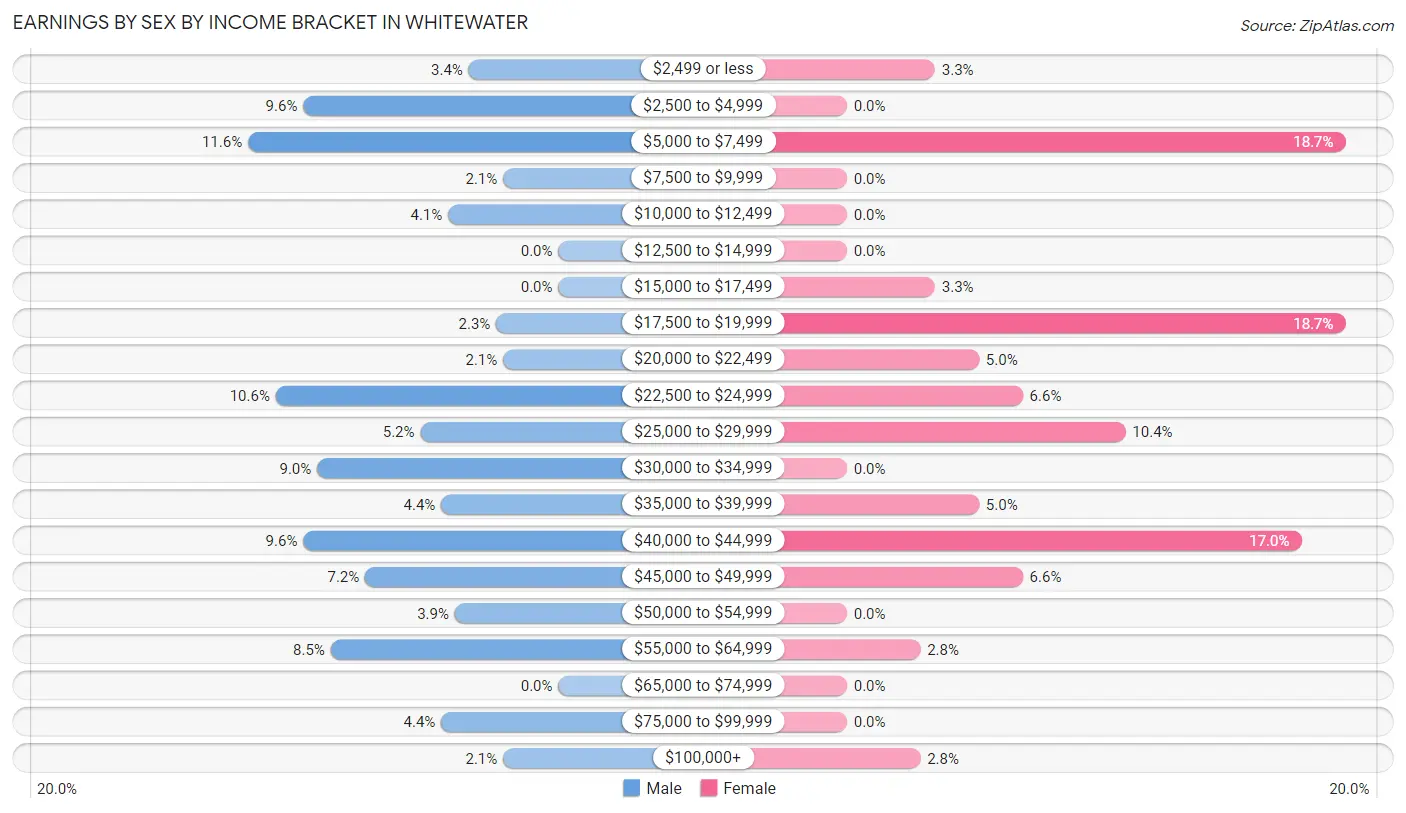
Earnings by Sex by Income Bracket in Whitewater
The most common earnings brackets in Whitewater are $5,000 to $7,499 for men (45 | 11.6%) and $5,000 to $7,499 for women (34 | 18.7%).
| Income | Male | Female |
| $2,499 or less | 13 (3.4%) | 6 (3.3%) |
| $2,500 to $4,999 | 37 (9.6%) | 0 (0.0%) |
| $5,000 to $7,499 | 45 (11.6%) | 34 (18.7%) |
| $7,500 to $9,999 | 8 (2.1%) | 0 (0.0%) |
| $10,000 to $12,499 | 16 (4.1%) | 0 (0.0%) |
| $12,500 to $14,999 | 0 (0.0%) | 0 (0.0%) |
| $15,000 to $17,499 | 0 (0.0%) | 6 (3.3%) |
| $17,500 to $19,999 | 9 (2.3%) | 34 (18.7%) |
| $20,000 to $22,499 | 8 (2.1%) | 9 (5.0%) |
| $22,500 to $24,999 | 41 (10.6%) | 12 (6.6%) |
| $25,000 to $29,999 | 20 (5.2%) | 19 (10.4%) |
| $30,000 to $34,999 | 35 (9.0%) | 0 (0.0%) |
| $35,000 to $39,999 | 17 (4.4%) | 9 (5.0%) |
| $40,000 to $44,999 | 37 (9.6%) | 31 (17.0%) |
| $45,000 to $49,999 | 28 (7.2%) | 12 (6.6%) |
| $50,000 to $54,999 | 15 (3.9%) | 0 (0.0%) |
| $55,000 to $64,999 | 33 (8.5%) | 5 (2.8%) |
| $65,000 to $74,999 | 0 (0.0%) | 0 (0.0%) |
| $75,000 to $99,999 | 17 (4.4%) | 0 (0.0%) |
| $100,000+ | 8 (2.1%) | 5 (2.8%) |
| Total | 387 (100.0%) | 182 (100.0%) |
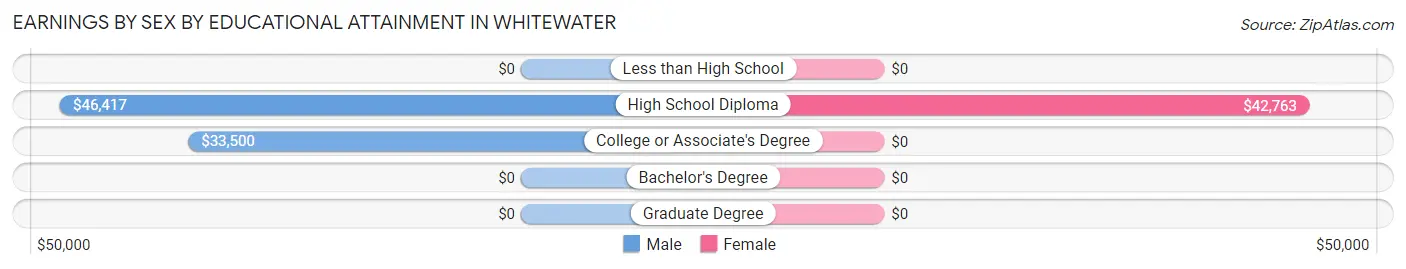
Earnings by Sex by Educational Attainment in Whitewater
Average earnings in Whitewater are $37,721 for men and $33,750 for women, a difference of 10.5%. Men with an educational attainment of high school diploma enjoy the highest average annual earnings of $46,417, while those with college or associate's degree education earn the least with $33,500. Women with an educational attainment of high school diploma earn the most with the average annual earnings of $42,763, while those with high school diploma education have the smallest earnings of $42,763.
| Educational Attainment | Male Income | Female Income |
| Less than High School | - | - |
| High School Diploma | $46,417 | $42,763 |
| College or Associate's Degree | $33,500 | $0 |
| Bachelor's Degree | - | - |
| Graduate Degree | - | - |
| Total | $37,721 | $33,750 |
Family Income in Whitewater
Family Income Brackets in Whitewater
According to the Whitewater family income data, there are 76 families falling into the $100,000 to $149,999 income range, which is the most common income bracket and makes up 28.9% of all families.
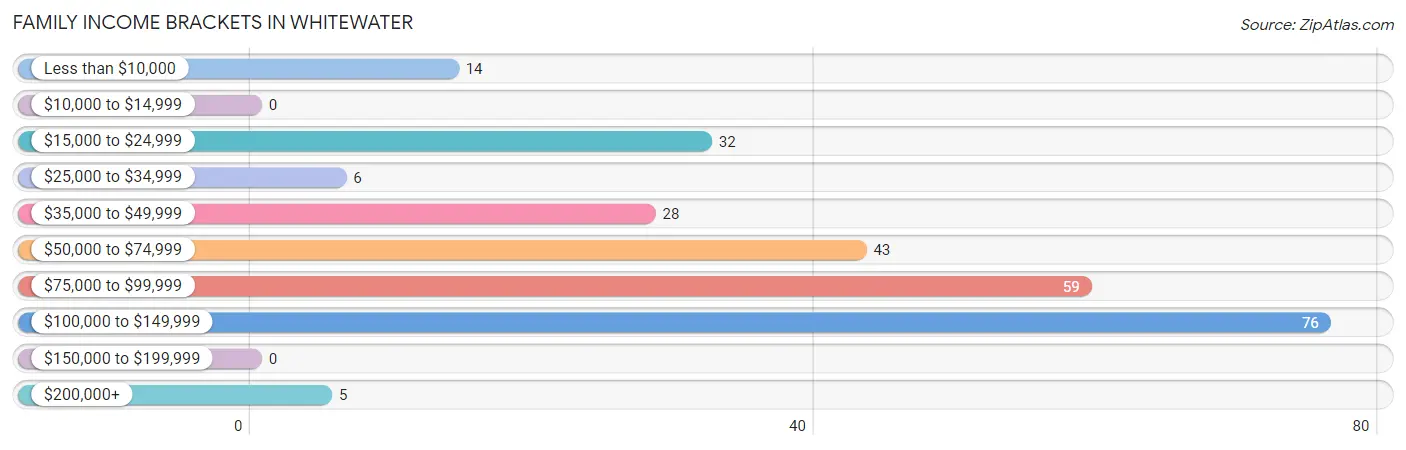
| Income Bracket | # Families | % Families |
| Less than $10,000 | 14 | 5.3% |
| $10,000 to $14,999 | 0 | 0.0% |
| $15,000 to $24,999 | 32 | 12.2% |
| $25,000 to $34,999 | 6 | 2.3% |
| $35,000 to $49,999 | 28 | 10.6% |
| $50,000 to $74,999 | 43 | 16.3% |
| $75,000 to $99,999 | 59 | 22.4% |
| $100,000 to $149,999 | 76 | 28.9% |
| $150,000 to $199,999 | 0 | 0.0% |
| $200,000+ | 5 | 1.9% |
Family Income by Famaliy Size in Whitewater
2-person families (93 | 35.4%) account for the highest median family income in Whitewater with $97,656 per family, while 2-person families (93 | 35.4%) have the highest median income of $48,828 per family member.
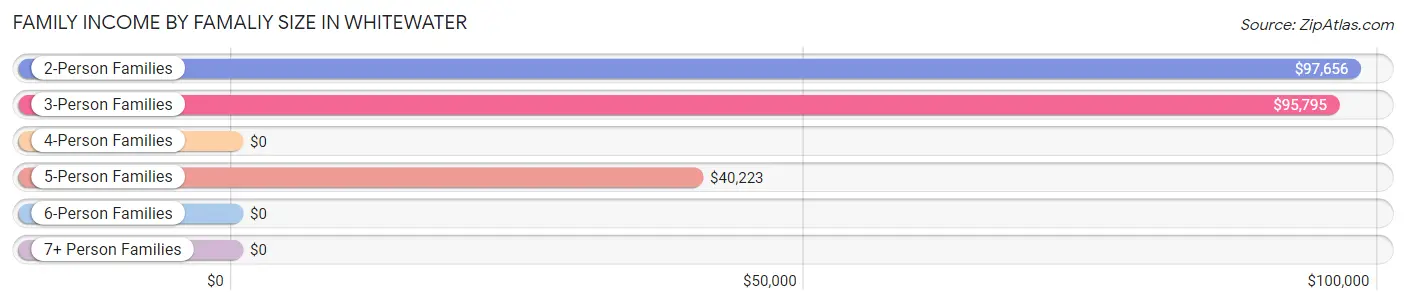
| Income Bracket | # Families | Median Income |
| 2-Person Families | 93 (35.4%) | $97,656 |
| 3-Person Families | 61 (23.2%) | $95,795 |
| 4-Person Families | 17 (6.5%) | $0 |
| 5-Person Families | 69 (26.2%) | $40,223 |
| 6-Person Families | 19 (7.2%) | $0 |
| 7+ Person Families | 4 (1.5%) | $0 |
| Total | 263 (100.0%) | $81,125 |
Family Income by Number of Earners in Whitewater
The median family income in Whitewater is $81,125, with families comprising 3+ earners (54) having the highest median family income of $109,474, while families with 1 earner (107) have the lowest median family income of $40,670, accounting for 20.5% and 40.7% of families, respectively.
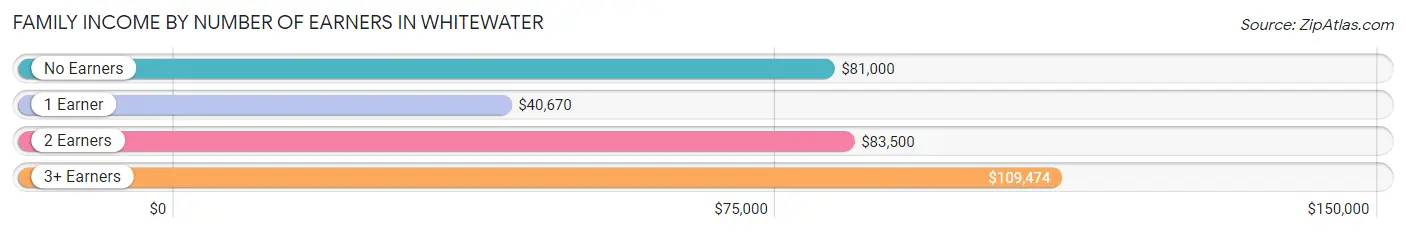
| Number of Earners | # Families | Median Income |
| No Earners | 34 (12.9%) | $81,000 |
| 1 Earner | 107 (40.7%) | $40,670 |
| 2 Earners | 68 (25.9%) | $83,500 |
| 3+ Earners | 54 (20.5%) | $109,474 |
| Total | 263 (100.0%) | $81,125 |
Household Income in Whitewater
Household Income Brackets in Whitewater
With 85 households falling in the category, the $100,000 to $149,999 income range is the most frequent in Whitewater, accounting for 23.9% of all households.
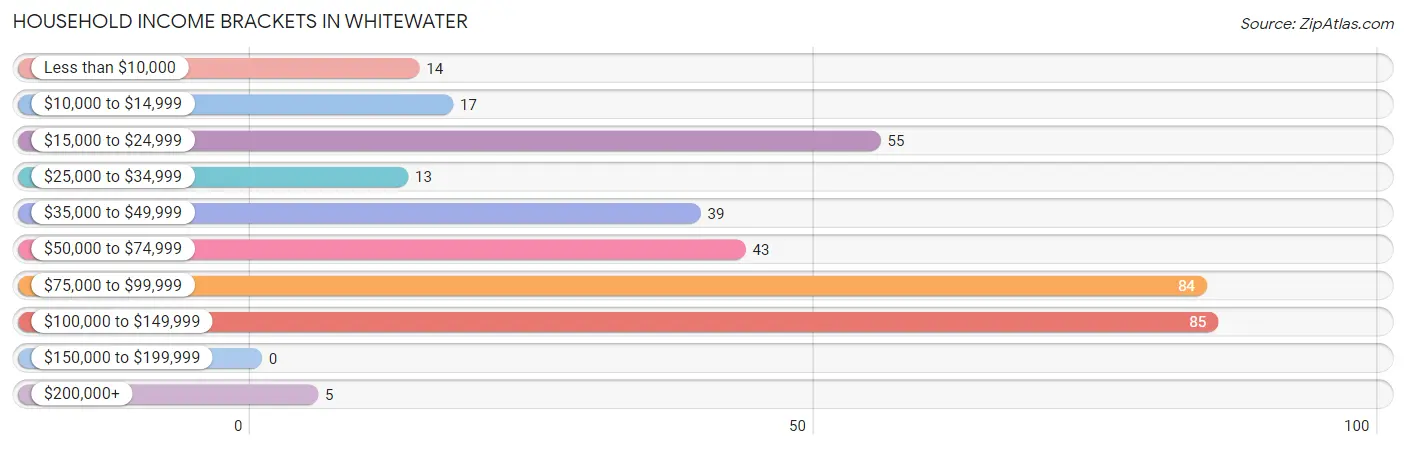
| Income Bracket | # Households | % Households |
| Less than $10,000 | 14 | 3.9% |
| $10,000 to $14,999 | 17 | 4.8% |
| $15,000 to $24,999 | 55 | 15.5% |
| $25,000 to $34,999 | 13 | 3.7% |
| $35,000 to $49,999 | 39 | 11.0% |
| $50,000 to $74,999 | 43 | 12.1% |
| $75,000 to $99,999 | 84 | 23.7% |
| $100,000 to $149,999 | 85 | 23.9% |
| $150,000 to $199,999 | 0 | 0.0% |
| $200,000+ | 5 | 1.4% |
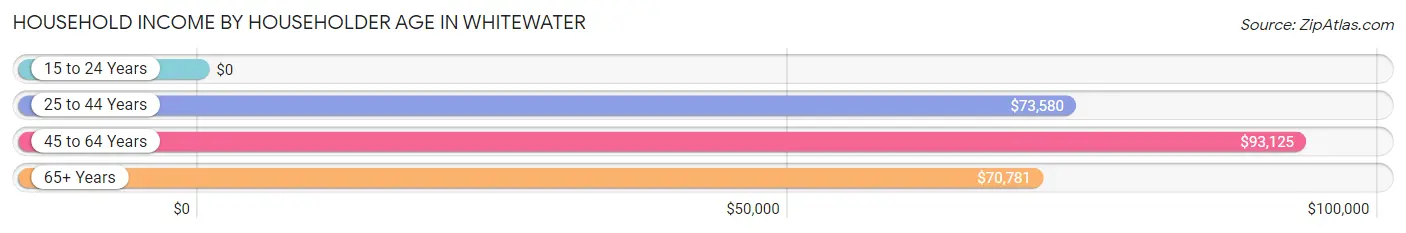
Household Income by Householder Age in Whitewater
The median household income in Whitewater is $74,602, with the highest median household income of $93,125 found in the 45 to 64 years age bracket for the primary householder. A total of 185 households (52.1%) fall into this category. Meanwhile, the 15 to 24 years age bracket for the primary householder has the lowest median household income of $0, with 32 households (9.0%) in this group.
| Income Bracket | # Households | Median Income |
| 15 to 24 Years | 32 (9.0%) | $0 |
| 25 to 44 Years | 89 (25.1%) | $73,580 |
| 45 to 64 Years | 185 (52.1%) | $93,125 |
| 65+ Years | 49 (13.8%) | $70,781 |
| Total | 355 (100.0%) | $74,602 |
Poverty in Whitewater
Income Below Poverty by Sex and Age in Whitewater
With 30.8% poverty level for males and 13.1% for females among the residents of Whitewater, 75 year old and over males and 16 and 17 year old females are the most vulnerable to poverty, with 9 males (100.0%) and 13 females (76.5%) in their respective age groups living below the poverty level.
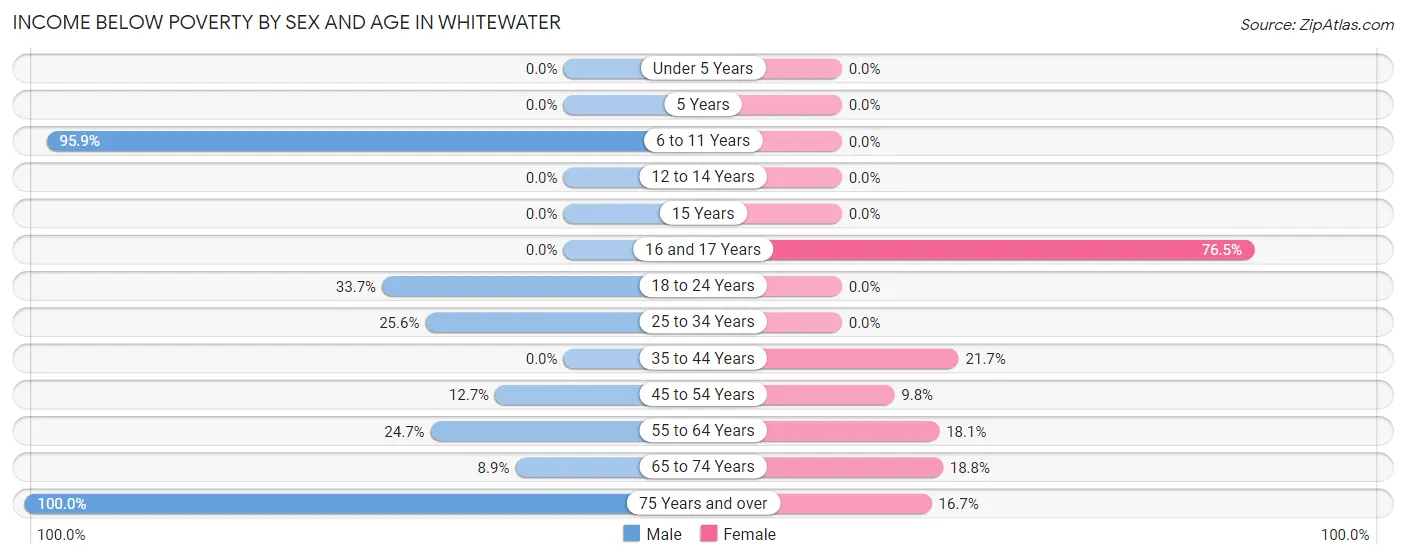
| Age Bracket | Male | Female |
| Under 5 Years | 0 (0.0%) | 0 (0.0%) |
| 5 Years | 0 (0.0%) | 0 (0.0%) |
| 6 to 11 Years | 94 (95.9%) | 0 (0.0%) |
| 12 to 14 Years | 0 (0.0%) | 0 (0.0%) |
| 15 Years | 0 (0.0%) | 0 (0.0%) |
| 16 and 17 Years | 0 (0.0%) | 13 (76.5%) |
| 18 to 24 Years | 32 (33.7%) | 0 (0.0%) |
| 25 to 34 Years | 20 (25.6%) | 0 (0.0%) |
| 35 to 44 Years | 0 (0.0%) | 31 (21.7%) |
| 45 to 54 Years | 16 (12.7%) | 4 (9.8%) |
| 55 to 64 Years | 19 (24.7%) | 17 (18.1%) |
| 65 to 74 Years | 5 (8.9%) | 6 (18.8%) |
| 75 Years and over | 9 (100.0%) | 2 (16.7%) |
| Total | 195 (30.8%) | 73 (13.1%) |
Income Above Poverty by Sex and Age in Whitewater
According to the poverty statistics in Whitewater, males aged under 5 years and females aged under 5 years are the age groups that are most secure financially, with 100.0% of males and 100.0% of females in these age groups living above the poverty line.
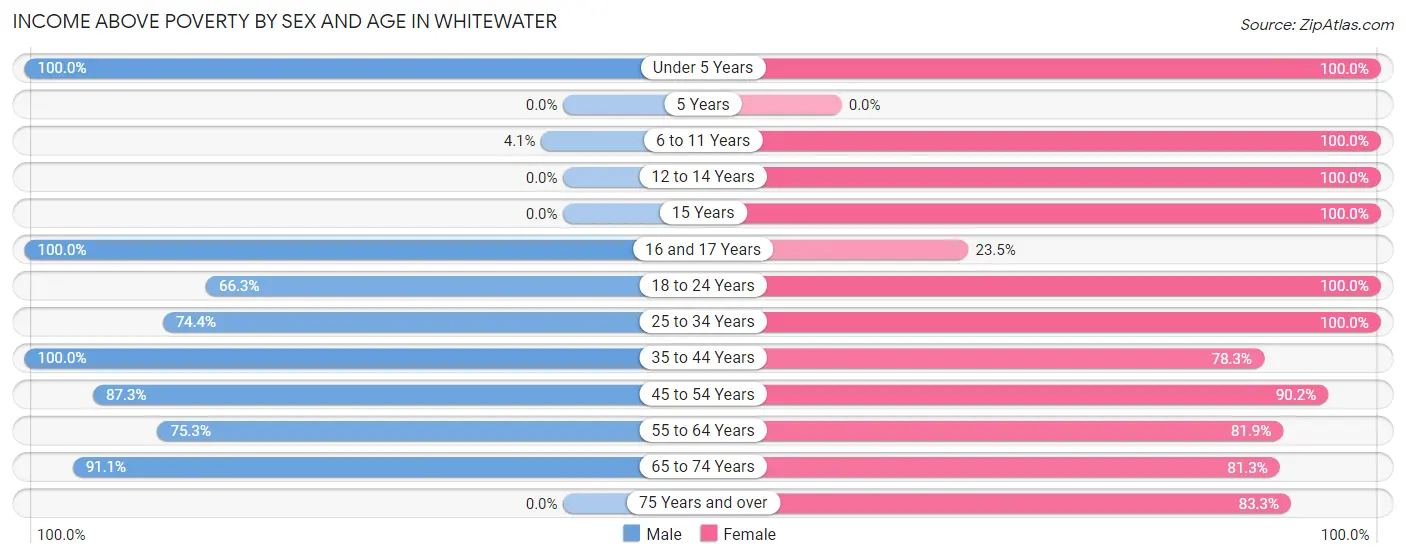
| Age Bracket | Male | Female |
| Under 5 Years | 14 (100.0%) | 43 (100.0%) |
| 5 Years | 0 (0.0%) | 0 (0.0%) |
| 6 to 11 Years | 4 (4.1%) | 19 (100.0%) |
| 12 to 14 Years | 0 (0.0%) | 30 (100.0%) |
| 15 Years | 0 (0.0%) | 30 (100.0%) |
| 16 and 17 Years | 4 (100.0%) | 4 (23.5%) |
| 18 to 24 Years | 63 (66.3%) | 58 (100.0%) |
| 25 to 34 Years | 58 (74.4%) | 40 (100.0%) |
| 35 to 44 Years | 77 (100.0%) | 112 (78.3%) |
| 45 to 54 Years | 110 (87.3%) | 37 (90.2%) |
| 55 to 64 Years | 58 (75.3%) | 77 (81.9%) |
| 65 to 74 Years | 51 (91.1%) | 26 (81.2%) |
| 75 Years and over | 0 (0.0%) | 10 (83.3%) |
| Total | 439 (69.2%) | 486 (86.9%) |
Income Below Poverty Among Married-Couple Families in Whitewater
The poverty statistics for married-couple families in Whitewater show that 22.1% or 46 of the total 208 families live below the poverty line. Families with 3 or 4 children have the highest poverty rate of 100.0%, comprising of 32 families. On the other hand, families with 1 or 2 children have the lowest poverty rate of 0.0%, which includes 0 families.
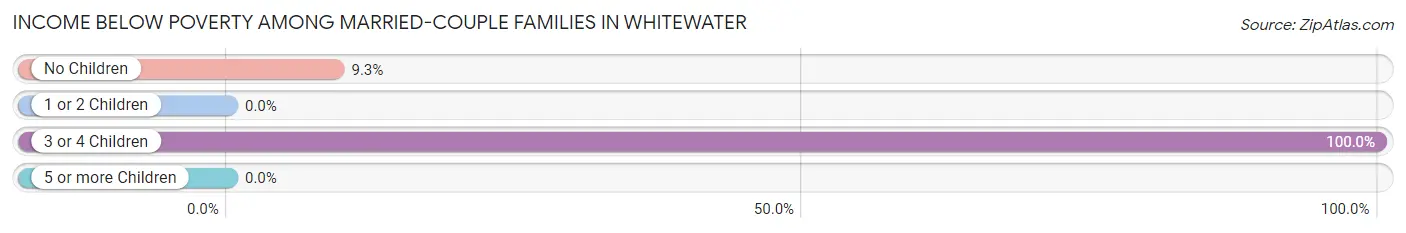
| Children | Above Poverty | Below Poverty |
| No Children | 137 (90.7%) | 14 (9.3%) |
| 1 or 2 Children | 25 (100.0%) | 0 (0.0%) |
| 3 or 4 Children | 0 (0.0%) | 32 (100.0%) |
| 5 or more Children | 0 (0.0%) | 0 (0.0%) |
| Total | 162 (77.9%) | 46 (22.1%) |
Income Below Poverty Among Single-Parent Households in Whitewater
| Children | Single Father | Single Mother |
| No Children | 0 (0.0%) | 0 (0.0%) |
| 1 or 2 Children | 0 (0.0%) | 0 (0.0%) |
| 3 or 4 Children | 0 (0.0%) | 0 (0.0%) |
| 5 or more Children | 0 (0.0%) | 0 (0.0%) |
| Total | 0 (0.0%) | 0 (0.0%) |
Income Below Poverty Among Married-Couple vs Single-Parent Households in Whitewater
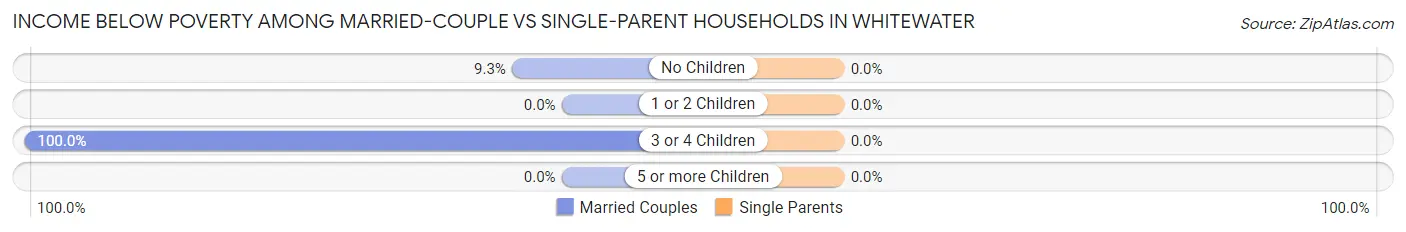
| Children | Married-Couple Families | Single-Parent Households |
| No Children | 14 (9.3%) | 0 (0.0%) |
| 1 or 2 Children | 0 (0.0%) | 0 (0.0%) |
| 3 or 4 Children | 32 (100.0%) | 0 (0.0%) |
| 5 or more Children | 0 (0.0%) | 0 (0.0%) |
| Total | 46 (22.1%) | 0 (0.0%) |
Race in Whitewater
The most populous races in Whitewater are Hispanic or Latino (668 | 55.9%), White / Caucasian (499 | 41.8%), and Two or more Races (447 | 37.4%).
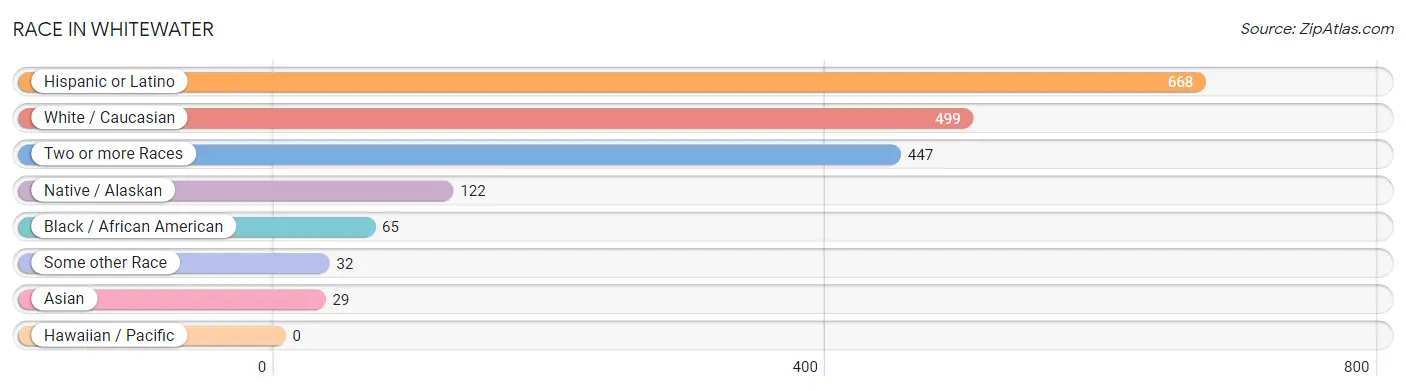
| Race | # Population | % Population |
| Asian | 29 | 2.4% |
| Black / African American | 65 | 5.4% |
| Hawaiian / Pacific | 0 | 0.0% |
| Hispanic or Latino | 668 | 55.9% |
| Native / Alaskan | 122 | 10.2% |
| White / Caucasian | 499 | 41.8% |
| Two or more Races | 447 | 37.4% |
| Some other Race | 32 | 2.7% |
| Total | 1,194 | 100.0% |
Ancestry in Whitewater
The most populous ancestries reported in Whitewater are Mexican (633 | 53.0%), Cherokee (122 | 10.2%), English (62 | 5.2%), American (60 | 5.0%), and Irish (57 | 4.8%), together accounting for 78.2% of all Whitewater residents.
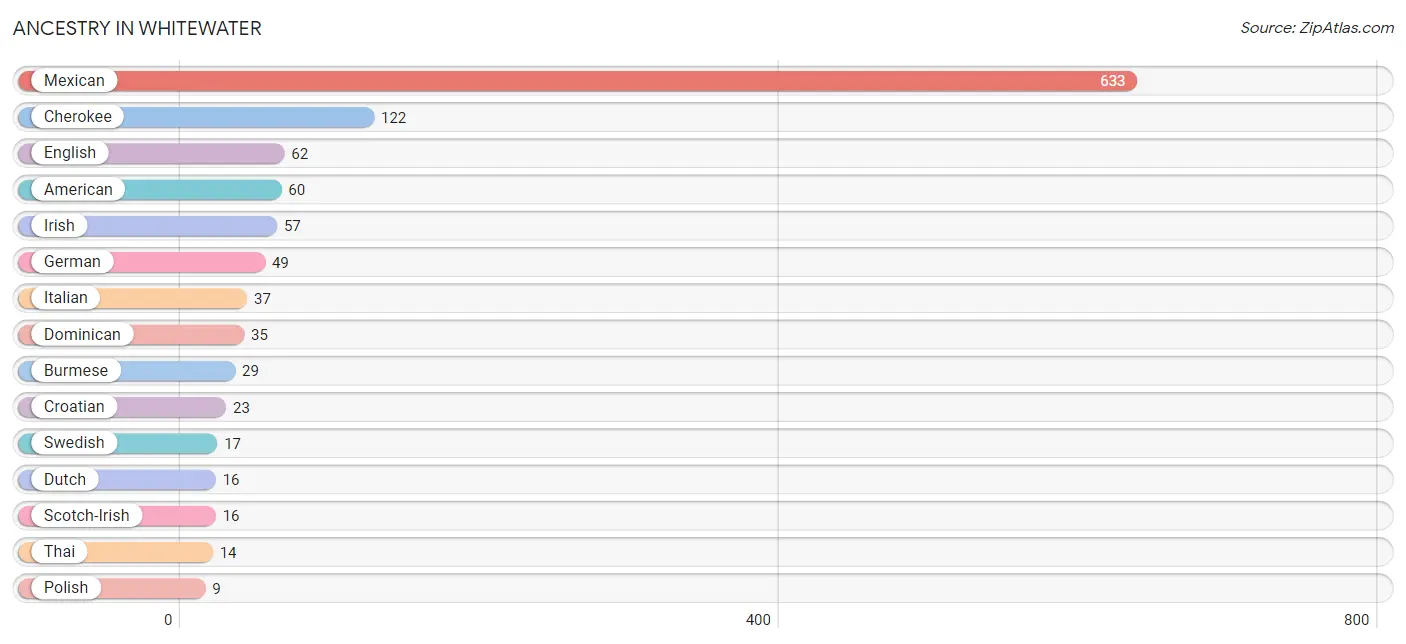
| Ancestry | # Population | % Population |
| American | 60 | 5.0% |
| Armenian | 8 | 0.7% |
| Austrian | 7 | 0.6% |
| Burmese | 29 | 2.4% |
| Cherokee | 122 | 10.2% |
| Chippewa | 7 | 0.6% |
| Croatian | 23 | 1.9% |
| Dominican | 35 | 2.9% |
| Dutch | 16 | 1.3% |
| English | 62 | 5.2% |
| European | 6 | 0.5% |
| French | 2 | 0.2% |
| German | 49 | 4.1% |
| Irish | 57 | 4.8% |
| Italian | 37 | 3.1% |
| Mexican | 633 | 53.0% |
| Polish | 9 | 0.7% |
| Russian | 9 | 0.7% |
| Scotch-Irish | 16 | 1.3% |
| Swedish | 17 | 1.4% |
| Thai | 14 | 1.2% | View All 21 Rows |
Immigrants in Whitewater
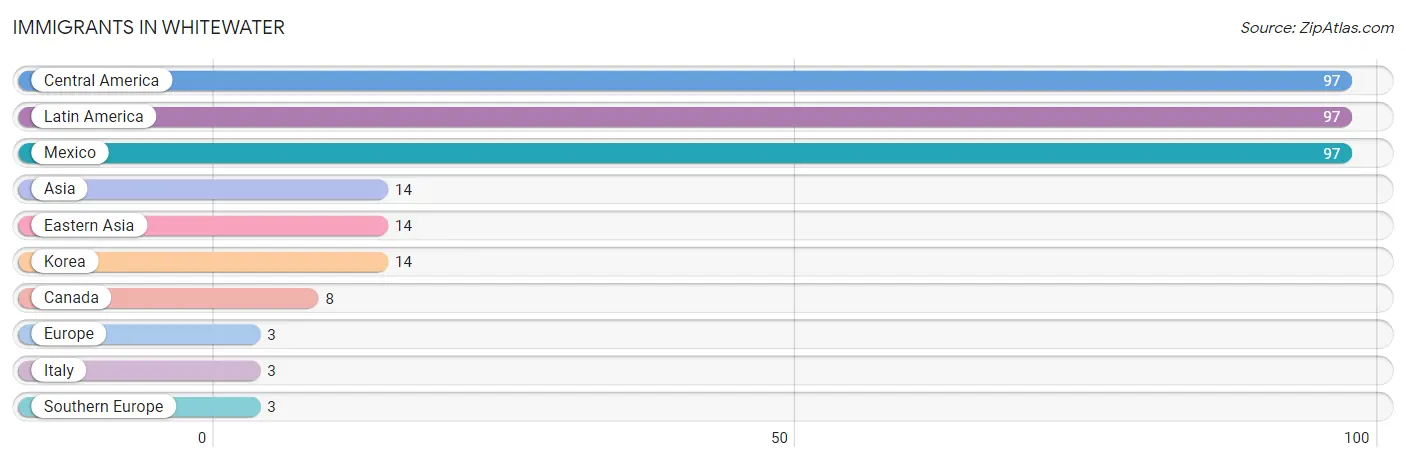
The most numerous immigrant groups reported in Whitewater came from Central America (97 | 8.1%), Latin America (97 | 8.1%), Mexico (97 | 8.1%), Asia (14 | 1.2%), and Eastern Asia (14 | 1.2%), together accounting for 26.7% of all Whitewater residents.
| Immigration Origin | # Population | % Population |
| Asia | 14 | 1.2% |
| Canada | 8 | 0.7% |
| Central America | 97 | 8.1% |
| Eastern Asia | 14 | 1.2% |
| Europe | 3 | 0.3% |
| Italy | 3 | 0.3% |
| Korea | 14 | 1.2% |
| Latin America | 97 | 8.1% |
| Mexico | 97 | 8.1% |
| Southern Europe | 3 | 0.3% | View All 10 Rows |
Sex and Age in Whitewater
Sex and Age in Whitewater
The most populous age groups in Whitewater are 20 to 24 Years (78 | 12.3%) for men and 40 to 44 Years (109 | 19.5%) for women.
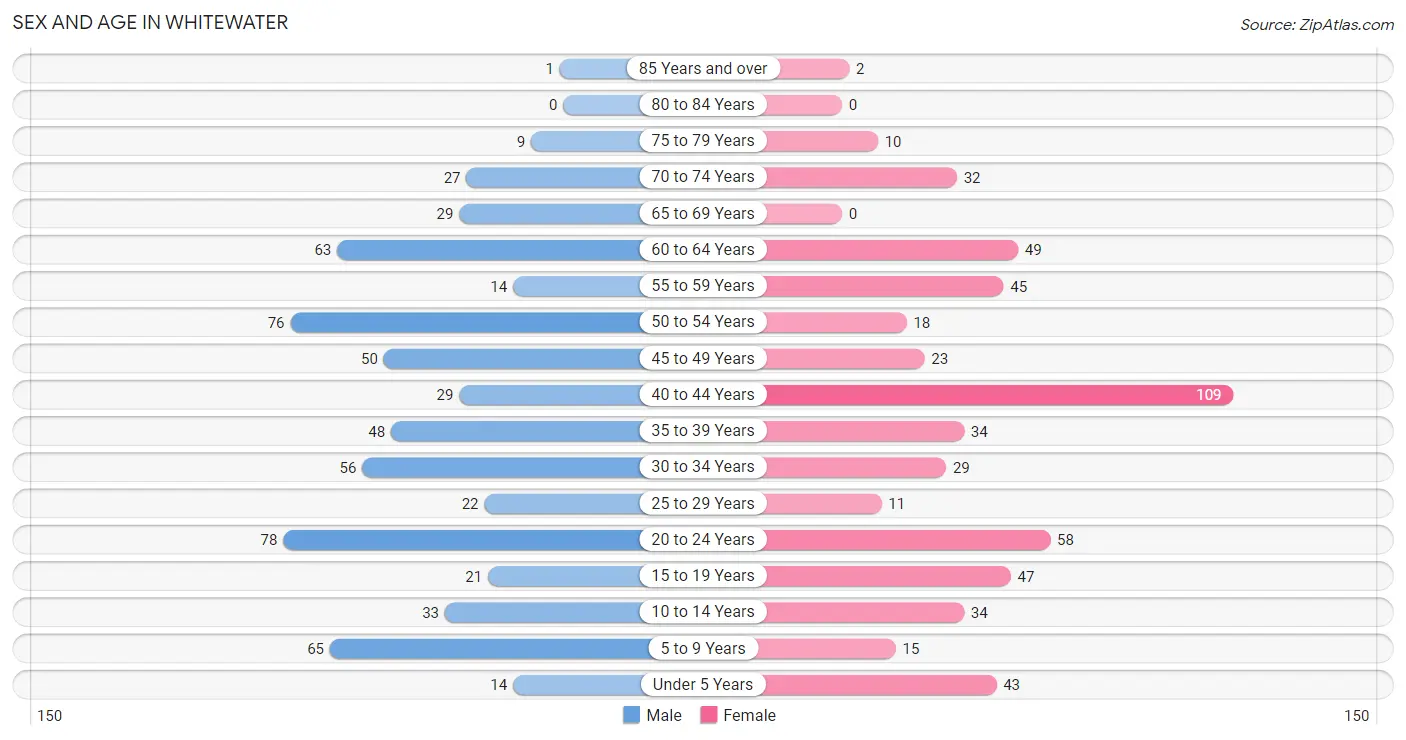
| Age Bracket | Male | Female |
| Under 5 Years | 14 (2.2%) | 43 (7.7%) |
| 5 to 9 Years | 65 (10.2%) | 15 (2.7%) |
| 10 to 14 Years | 33 (5.2%) | 34 (6.1%) |
| 15 to 19 Years | 21 (3.3%) | 47 (8.4%) |
| 20 to 24 Years | 78 (12.3%) | 58 (10.4%) |
| 25 to 29 Years | 22 (3.5%) | 11 (2.0%) |
| 30 to 34 Years | 56 (8.8%) | 29 (5.2%) |
| 35 to 39 Years | 48 (7.6%) | 34 (6.1%) |
| 40 to 44 Years | 29 (4.6%) | 109 (19.5%) |
| 45 to 49 Years | 50 (7.9%) | 23 (4.1%) |
| 50 to 54 Years | 76 (12.0%) | 18 (3.2%) |
| 55 to 59 Years | 14 (2.2%) | 45 (8.1%) |
| 60 to 64 Years | 63 (9.9%) | 49 (8.8%) |
| 65 to 69 Years | 29 (4.6%) | 0 (0.0%) |
| 70 to 74 Years | 27 (4.3%) | 32 (5.7%) |
| 75 to 79 Years | 9 (1.4%) | 10 (1.8%) |
| 80 to 84 Years | 0 (0.0%) | 0 (0.0%) |
| 85 Years and over | 1 (0.2%) | 2 (0.4%) |
| Total | 635 (100.0%) | 559 (100.0%) |
Families and Households in Whitewater
Median Family Size in Whitewater
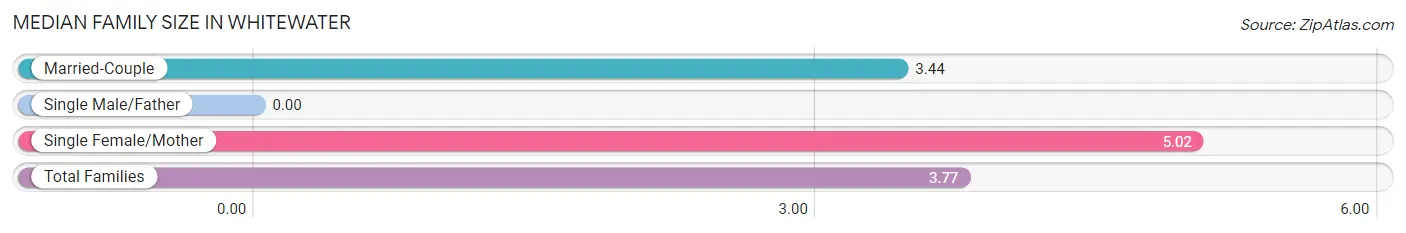
| Family Type | # Families | Family Size |
| Married-Couple | 208 (79.1%) | 3.44 |
| Single Male/Father | 0 (0.0%) | - |
| Single Female/Mother | 55 (20.9%) | 5.02 |
| Total Families | 263 (100.0%) | 3.77 |
Median Household Size in Whitewater
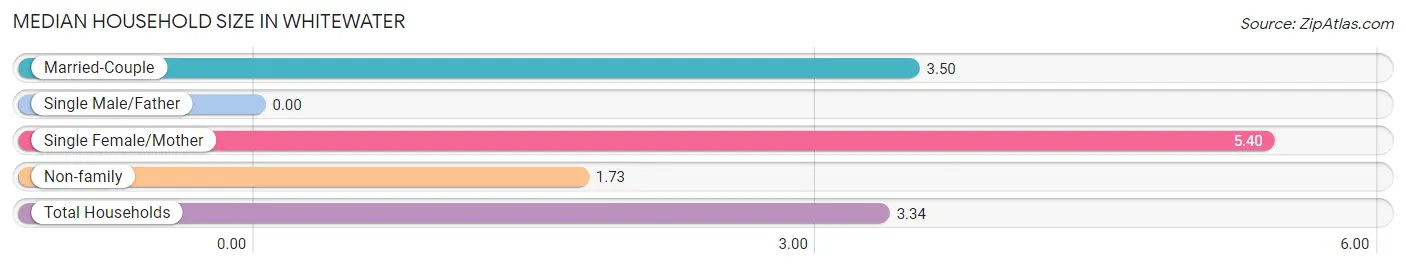
| Household Type | # Households | Household Size |
| Married-Couple | 208 (58.6%) | 3.50 |
| Single Male/Father | 0 (0.0%) | - |
| Single Female/Mother | 55 (15.5%) | 5.40 |
| Non-family | 92 (25.9%) | 1.73 |
| Total Households | 355 (100.0%) | 3.34 |
Household Size by Marriage Status in Whitewater
Out of a total of 355 households in Whitewater, 263 (74.1%) are family households, while 92 (25.9%) are nonfamily households. The most numerous type of family households are 2-person households, comprising 88, and the most common type of nonfamily households are 1-person households, comprising 64.
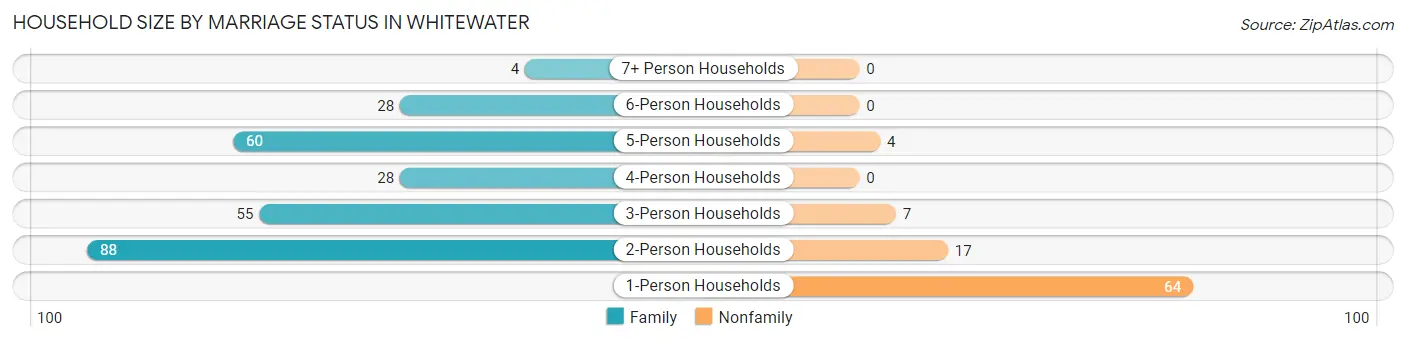
| Household Size | Family Households | Nonfamily Households |
| 1-Person Households | - | 64 (18.0%) |
| 2-Person Households | 88 (24.8%) | 17 (4.8%) |
| 3-Person Households | 55 (15.5%) | 7 (2.0%) |
| 4-Person Households | 28 (7.9%) | 0 (0.0%) |
| 5-Person Households | 60 (16.9%) | 4 (1.1%) |
| 6-Person Households | 28 (7.9%) | 0 (0.0%) |
| 7+ Person Households | 4 (1.1%) | 0 (0.0%) |
| Total | 263 (74.1%) | 92 (25.9%) |
Female Fertility in Whitewater
Fertility by Age in Whitewater
Average fertility rate in Whitewater is 37.0 births per 1,000 women. Women in the age bracket of 35 to 50 years have the highest fertility rate with 67.0 births per 1,000 women. Women in the age bracket of 35 to 50 years acount for 100.0% of all women with births.
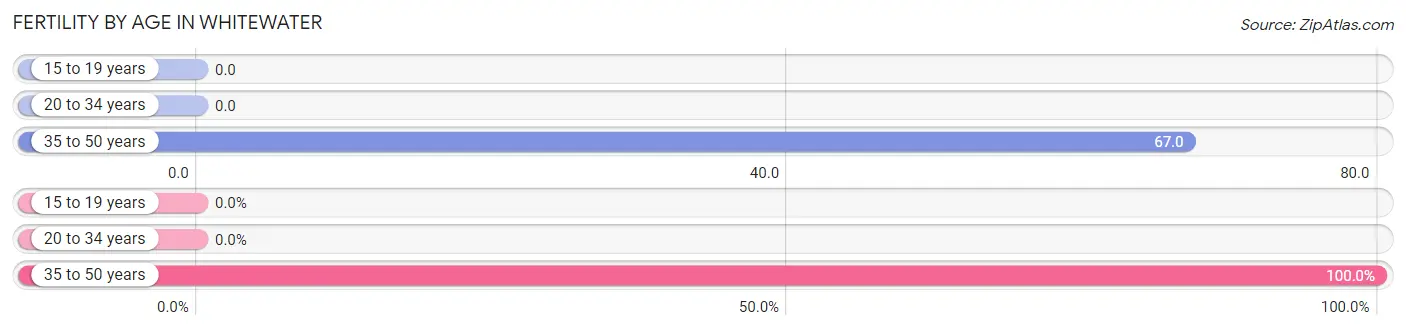
| Age Bracket | Women with Births | Births / 1,000 Women |
| 15 to 19 years | 0 (0.0%) | 0.0 |
| 20 to 34 years | 0 (0.0%) | 0.0 |
| 35 to 50 years | 12 (100.0%) | 67.0 |
| Total | 12 (100.0%) | 37.0 |
Fertility by Age by Marriage Status in Whitewater
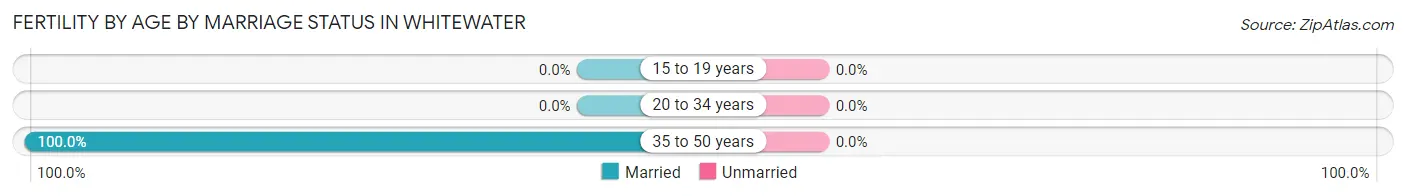
| Age Bracket | Married | Unmarried |
| 15 to 19 years | 0 (0.0%) | 0 (0.0%) |
| 20 to 34 years | 0 (0.0%) | 0 (0.0%) |
| 35 to 50 years | 12 (100.0%) | 0 (0.0%) |
| Total | 12 (100.0%) | 0 (0.0%) |
Fertility by Education in Whitewater
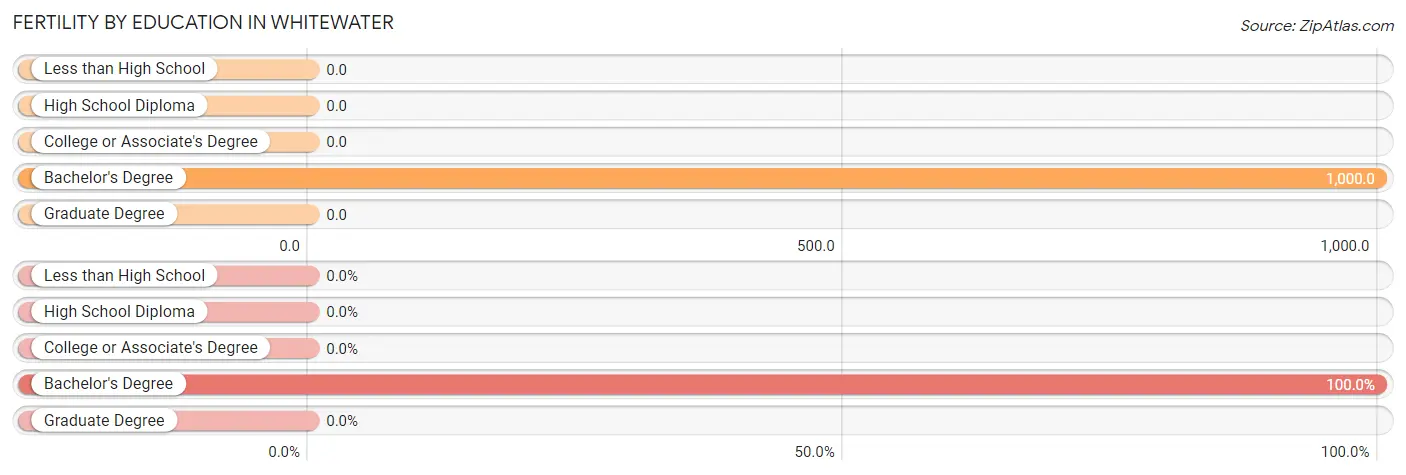
| Educational Attainment | Women with Births | Births / 1,000 Women |
| Less than High School | 0 (0.0%) | 0.0 |
| High School Diploma | 0 (0.0%) | 0.0 |
| College or Associate's Degree | 0 (0.0%) | 0.0 |
| Bachelor's Degree | 12 (100.0%) | 1,000.0 |
| Graduate Degree | 0 (0.0%) | 0.0 |
| Total | 12 (100.0%) | 37.0 |
Fertility by Education by Marriage Status in Whitewater
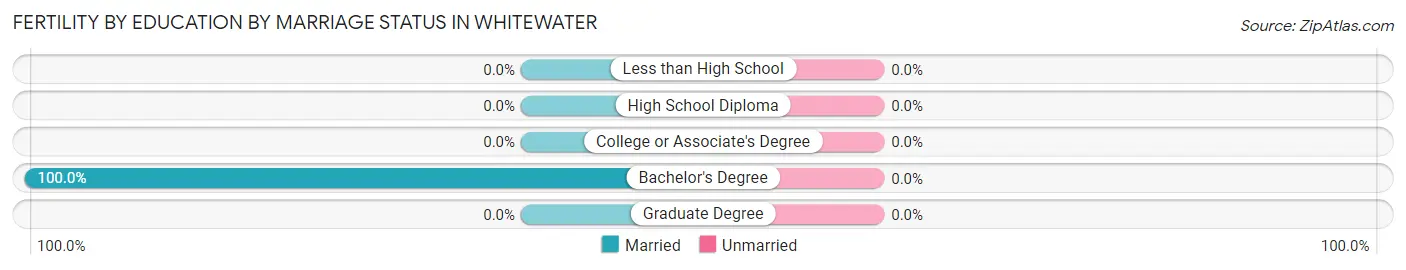
| Educational Attainment | Married | Unmarried |
| Less than High School | 0 (0.0%) | 0 (0.0%) |
| High School Diploma | 0 (0.0%) | 0 (0.0%) |
| College or Associate's Degree | 0 (0.0%) | 0 (0.0%) |
| Bachelor's Degree | 12 (100.0%) | 0 (0.0%) |
| Graduate Degree | 0 (0.0%) | 0 (0.0%) |
| Total | 12 (100.0%) | 0 (0.0%) |
Employment Characteristics in Whitewater
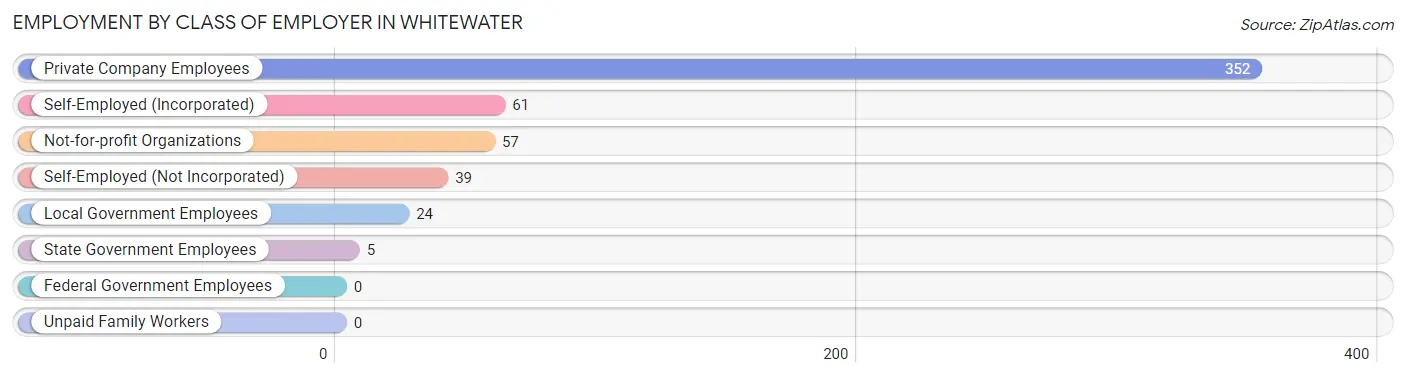
Employment by Class of Employer in Whitewater
Among the 538 employed individuals in Whitewater, private company employees (352 | 65.4%), self-employed (incorporated) (61 | 11.3%), and not-for-profit organizations (57 | 10.6%) make up the most common classes of employment.
| Employer Class | # Employees | % Employees |
| Private Company Employees | 352 | 65.4% |
| Self-Employed (Incorporated) | 61 | 11.3% |
| Self-Employed (Not Incorporated) | 39 | 7.2% |
| Not-for-profit Organizations | 57 | 10.6% |
| Local Government Employees | 24 | 4.5% |
| State Government Employees | 5 | 0.9% |
| Federal Government Employees | 0 | 0.0% |
| Unpaid Family Workers | 0 | 0.0% |
| Total | 538 | 100.0% |
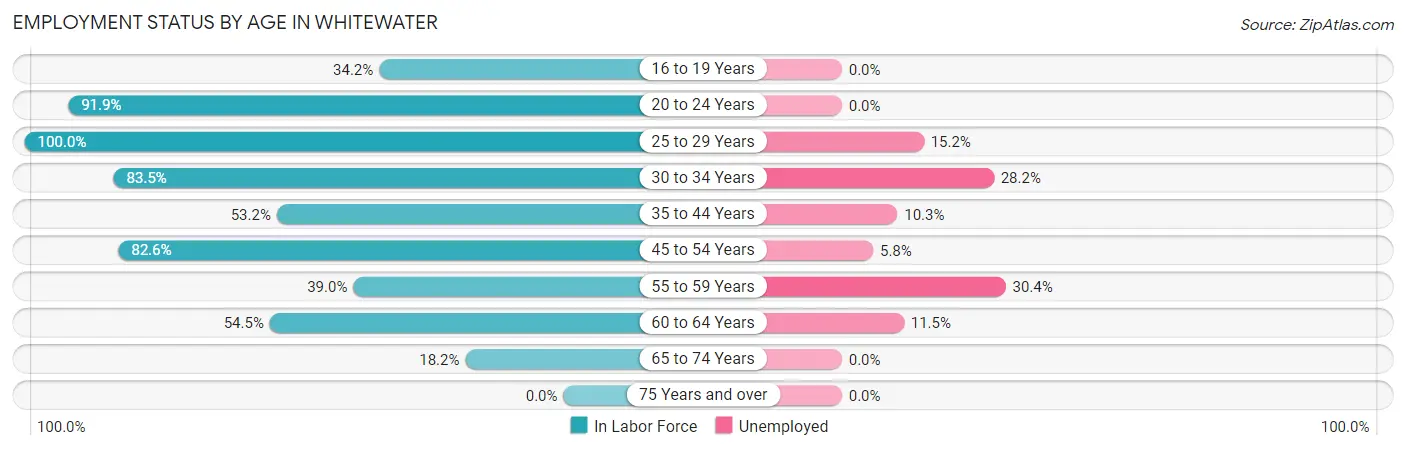
Employment Status by Age in Whitewater
According to the labor force statistics for Whitewater, out of the total population over 16 years of age (960), 62.2% or 597 individuals are in the labor force, with 9.9% or 59 of them unemployed. The age group with the highest labor force participation rate is 25 to 29 years, with 100.0% or 33 individuals in the labor force. Within the labor force, the 55 to 59 years age range has the highest percentage of unemployed individuals, with 30.4% or 7 of them being unemployed.
| Age Bracket | In Labor Force | Unemployed |
| 16 to 19 Years | 13 (34.2%) | 0 (0.0%) |
| 20 to 24 Years | 125 (91.9%) | 0 (0.0%) |
| 25 to 29 Years | 33 (100.0%) | 5 (15.2%) |
| 30 to 34 Years | 71 (83.5%) | 20 (28.2%) |
| 35 to 44 Years | 117 (53.2%) | 12 (10.3%) |
| 45 to 54 Years | 138 (82.6%) | 8 (5.8%) |
| 55 to 59 Years | 23 (39.0%) | 7 (30.4%) |
| 60 to 64 Years | 61 (54.5%) | 7 (11.5%) |
| 65 to 74 Years | 16 (18.2%) | 0 (0.0%) |
| 75 Years and over | 0 (0.0%) | 0 (0.0%) |
| Total | 597 (62.2%) | 59 (9.9%) |
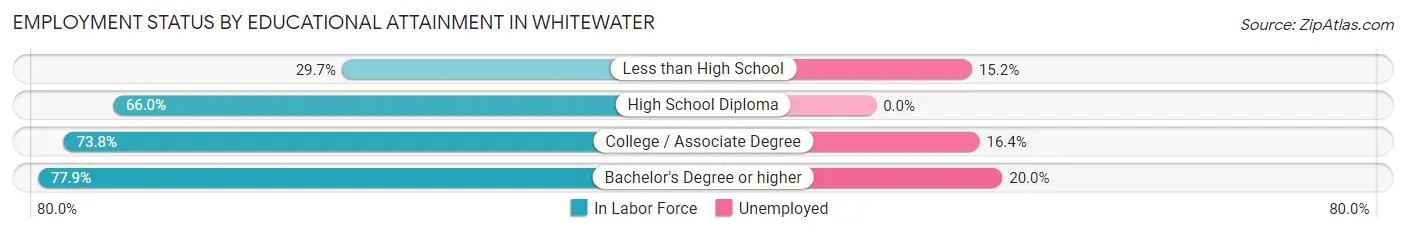
Employment Status by Educational Attainment in Whitewater
According to labor force statistics for Whitewater, 65.5% of individuals (443) out of the total population between 25 and 64 years of age (676) are in the labor force, with 13.3% or 59 of them being unemployed. The group with the highest labor force participation rate are those with the educational attainment of bachelor's degree or higher, with 77.9% or 95 individuals in the labor force. Within the labor force, individuals with bachelor's degree or higher education have the highest percentage of unemployment, with 20.0% or 19 of them being unemployed.
| Educational Attainment | In Labor Force | Unemployed |
| Less than High School | 33 (29.7%) | 17 (15.2%) |
| High School Diploma | 101 (66.0%) | 0 (0.0%) |
| College / Associate Degree | 214 (73.8%) | 48 (16.4%) |
| Bachelor's Degree or higher | 95 (77.9%) | 24 (20.0%) |
| Total | 443 (65.5%) | 90 (13.3%) |
Employment Occupations by Sex in Whitewater
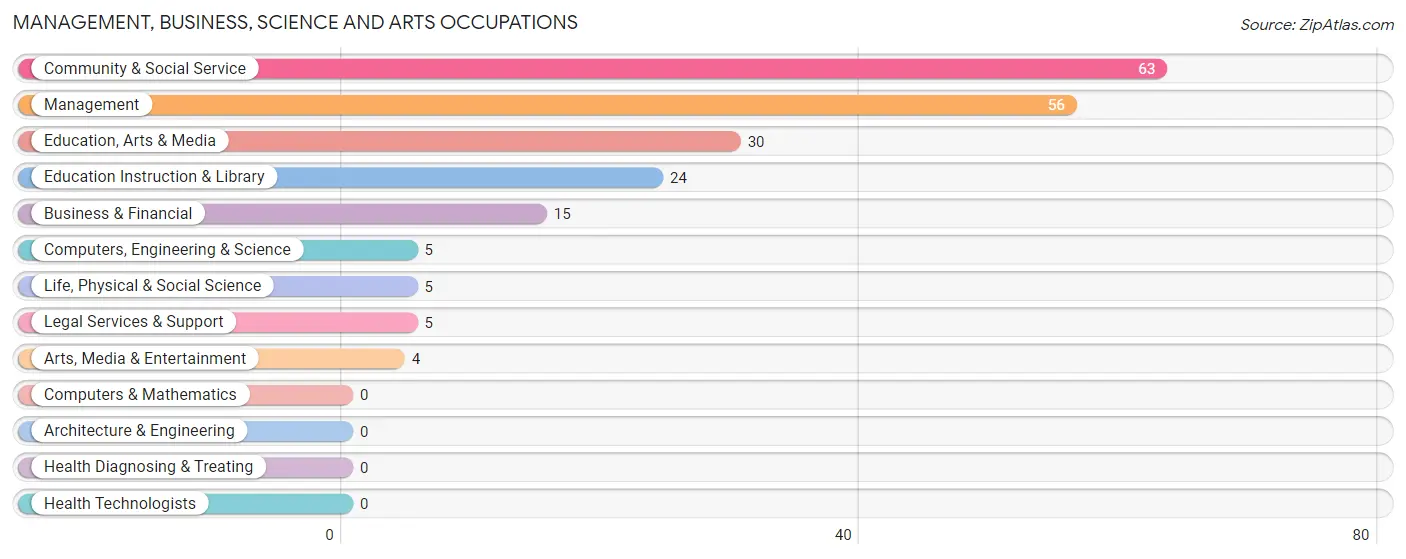
Management, Business, Science and Arts Occupations
The most common Management, Business, Science and Arts occupations in Whitewater are Community & Social Service (63 | 11.7%), Management (56 | 10.4%), Education, Arts & Media (30 | 5.6%), Education Instruction & Library (24 | 4.5%), and Business & Financial (15 | 2.8%).
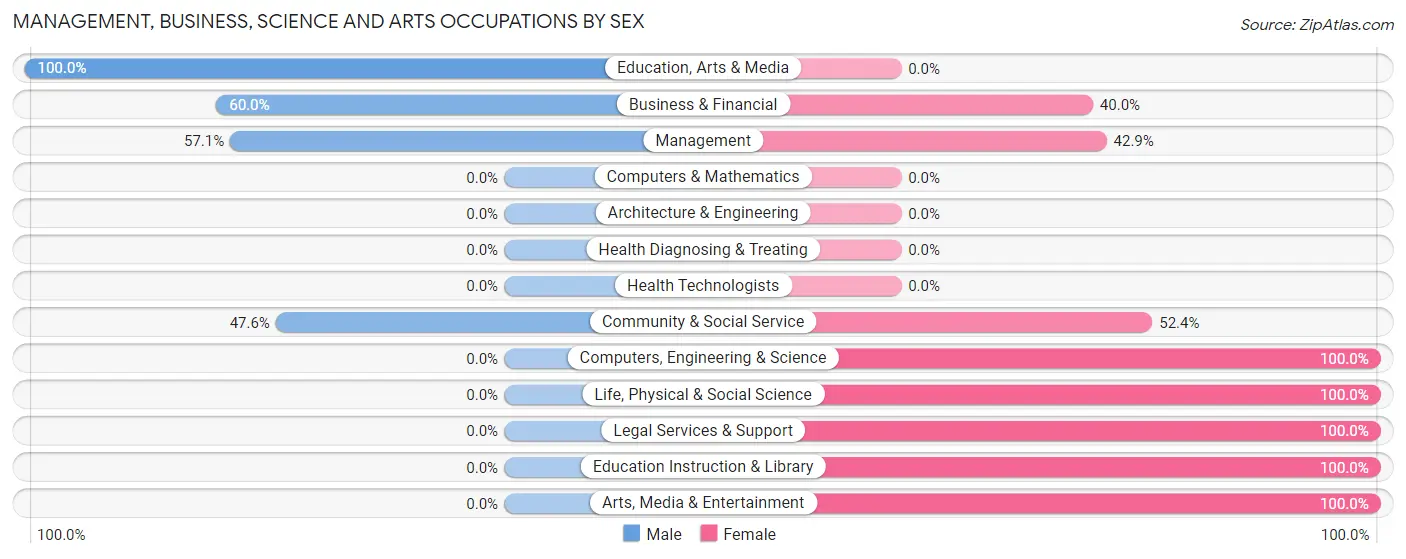
Management, Business, Science and Arts Occupations by Sex
Within the Management, Business, Science and Arts occupations in Whitewater, the most male-oriented occupations are Education, Arts & Media (100.0%), Business & Financial (60.0%), and Management (57.1%), while the most female-oriented occupations are Computers, Engineering & Science (100.0%), Life, Physical & Social Science (100.0%), and Legal Services & Support (100.0%).
| Occupation | Male | Female |
| Management | 32 (57.1%) | 24 (42.9%) |
| Business & Financial | 9 (60.0%) | 6 (40.0%) |
| Computers, Engineering & Science | 0 (0.0%) | 5 (100.0%) |
| Computers & Mathematics | 0 (0.0%) | 0 (0.0%) |
| Architecture & Engineering | 0 (0.0%) | 0 (0.0%) |
| Life, Physical & Social Science | 0 (0.0%) | 5 (100.0%) |
| Community & Social Service | 30 (47.6%) | 33 (52.4%) |
| Education, Arts & Media | 30 (100.0%) | 0 (0.0%) |
| Legal Services & Support | 0 (0.0%) | 5 (100.0%) |
| Education Instruction & Library | 0 (0.0%) | 24 (100.0%) |
| Arts, Media & Entertainment | 0 (0.0%) | 4 (100.0%) |
| Health Diagnosing & Treating | 0 (0.0%) | 0 (0.0%) |
| Health Technologists | 0 (0.0%) | 0 (0.0%) |
| Total (Category) | 71 (51.1%) | 68 (48.9%) |
| Total (Overall) | 366 (68.0%) | 172 (32.0%) |
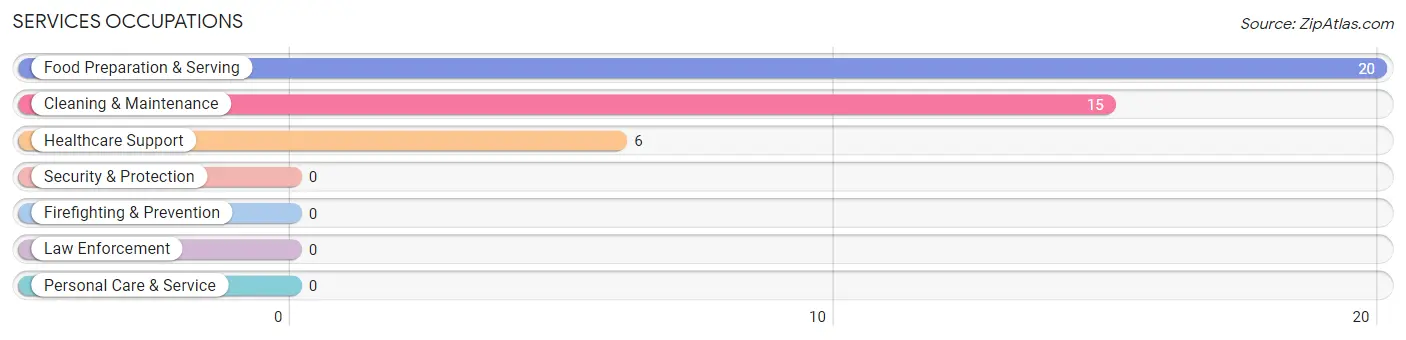
Services Occupations
The most common Services occupations in Whitewater are Food Preparation & Serving (20 | 3.7%), Cleaning & Maintenance (15 | 2.8%), and Healthcare Support (6 | 1.1%).
Services Occupations by Sex
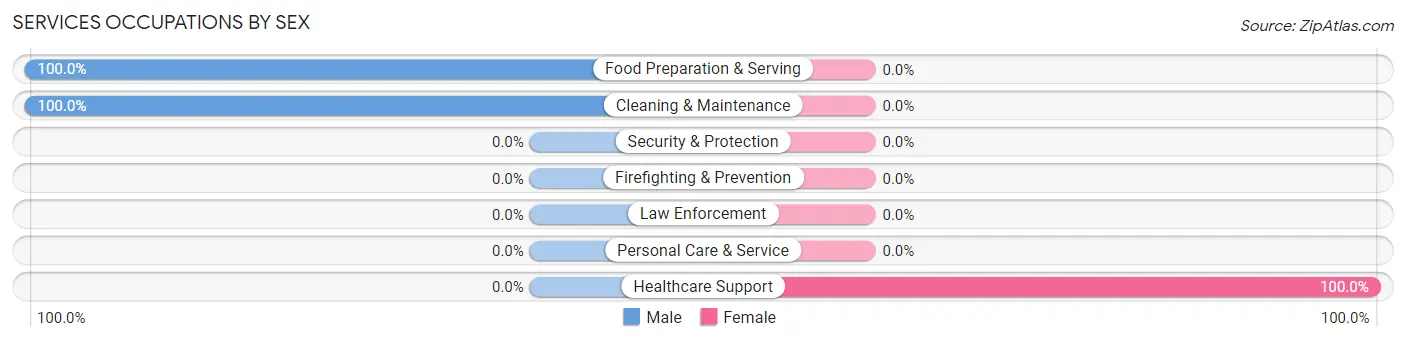
| Occupation | Male | Female |
| Healthcare Support | 0 (0.0%) | 6 (100.0%) |
| Security & Protection | 0 (0.0%) | 0 (0.0%) |
| Firefighting & Prevention | 0 (0.0%) | 0 (0.0%) |
| Law Enforcement | 0 (0.0%) | 0 (0.0%) |
| Food Preparation & Serving | 20 (100.0%) | 0 (0.0%) |
| Cleaning & Maintenance | 15 (100.0%) | 0 (0.0%) |
| Personal Care & Service | 0 (0.0%) | 0 (0.0%) |
| Total (Category) | 35 (85.4%) | 6 (14.6%) |
| Total (Overall) | 366 (68.0%) | 172 (32.0%) |
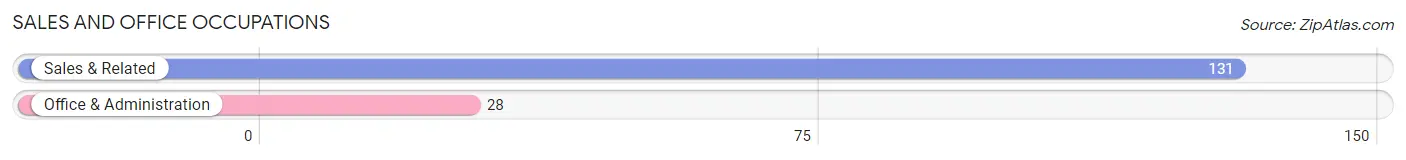
Sales and Office Occupations
The most common Sales and Office occupations in Whitewater are Sales & Related (131 | 24.3%), and Office & Administration (28 | 5.2%).
Sales and Office Occupations by Sex
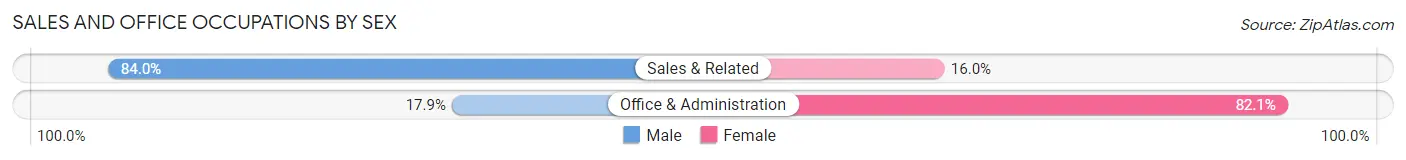
| Occupation | Male | Female |
| Sales & Related | 110 (84.0%) | 21 (16.0%) |
| Office & Administration | 5 (17.9%) | 23 (82.1%) |
| Total (Category) | 115 (72.3%) | 44 (27.7%) |
| Total (Overall) | 366 (68.0%) | 172 (32.0%) |
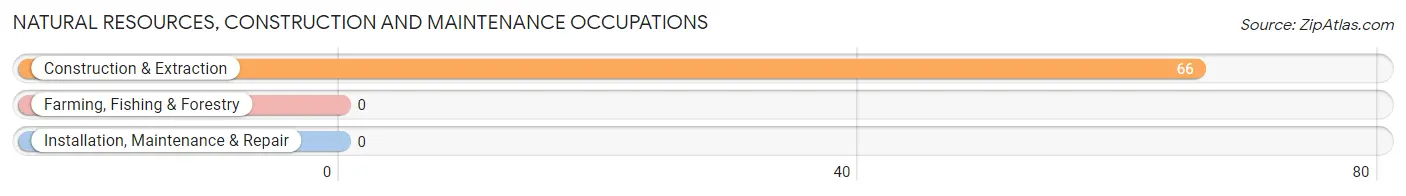
Natural Resources, Construction and Maintenance Occupations
The most common Natural Resources, Construction and Maintenance occupations in Whitewater are , and Construction & Extraction (66 | 12.3%).
Natural Resources, Construction and Maintenance Occupations by Sex
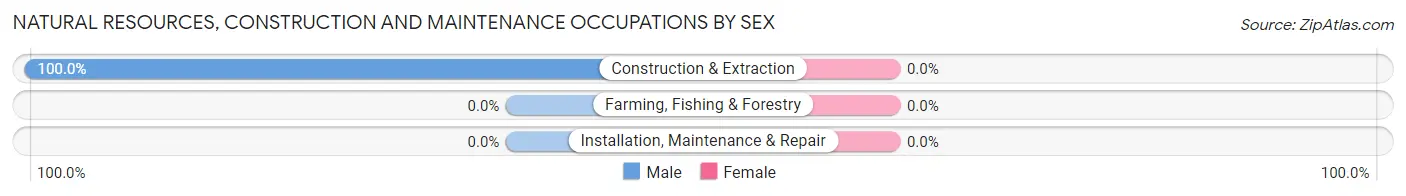
| Occupation | Male | Female |
| Farming, Fishing & Forestry | 0 (0.0%) | 0 (0.0%) |
| Construction & Extraction | 66 (100.0%) | 0 (0.0%) |
| Installation, Maintenance & Repair | 0 (0.0%) | 0 (0.0%) |
| Total (Category) | 66 (100.0%) | 0 (0.0%) |
| Total (Overall) | 366 (68.0%) | 172 (32.0%) |
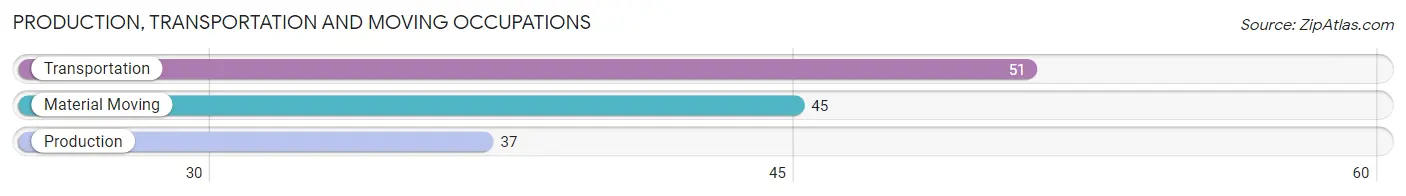
Production, Transportation and Moving Occupations
The most common Production, Transportation and Moving occupations in Whitewater are Transportation (51 | 9.5%), Material Moving (45 | 8.4%), and Production (37 | 6.9%).
Production, Transportation and Moving Occupations by Sex
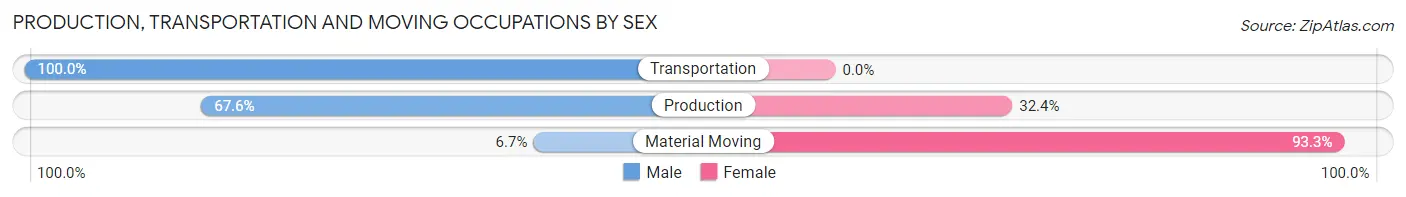
| Occupation | Male | Female |
| Production | 25 (67.6%) | 12 (32.4%) |
| Transportation | 51 (100.0%) | 0 (0.0%) |
| Material Moving | 3 (6.7%) | 42 (93.3%) |
| Total (Category) | 79 (59.4%) | 54 (40.6%) |
| Total (Overall) | 366 (68.0%) | 172 (32.0%) |
Employment Industries by Sex in Whitewater
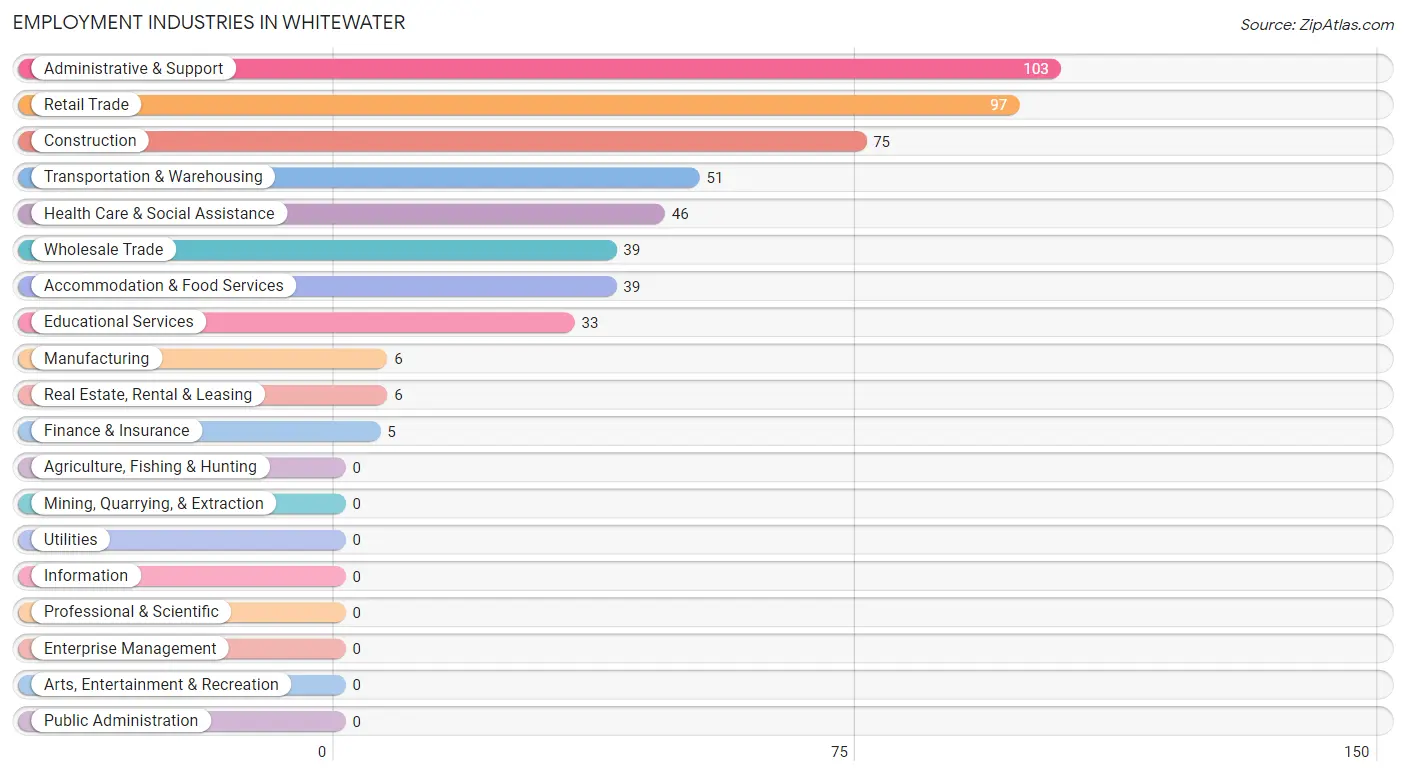
Employment Industries in Whitewater
The major employment industries in Whitewater include Administrative & Support (103 | 19.1%), Retail Trade (97 | 18.0%), Construction (75 | 13.9%), Transportation & Warehousing (51 | 9.5%), and Health Care & Social Assistance (46 | 8.6%).
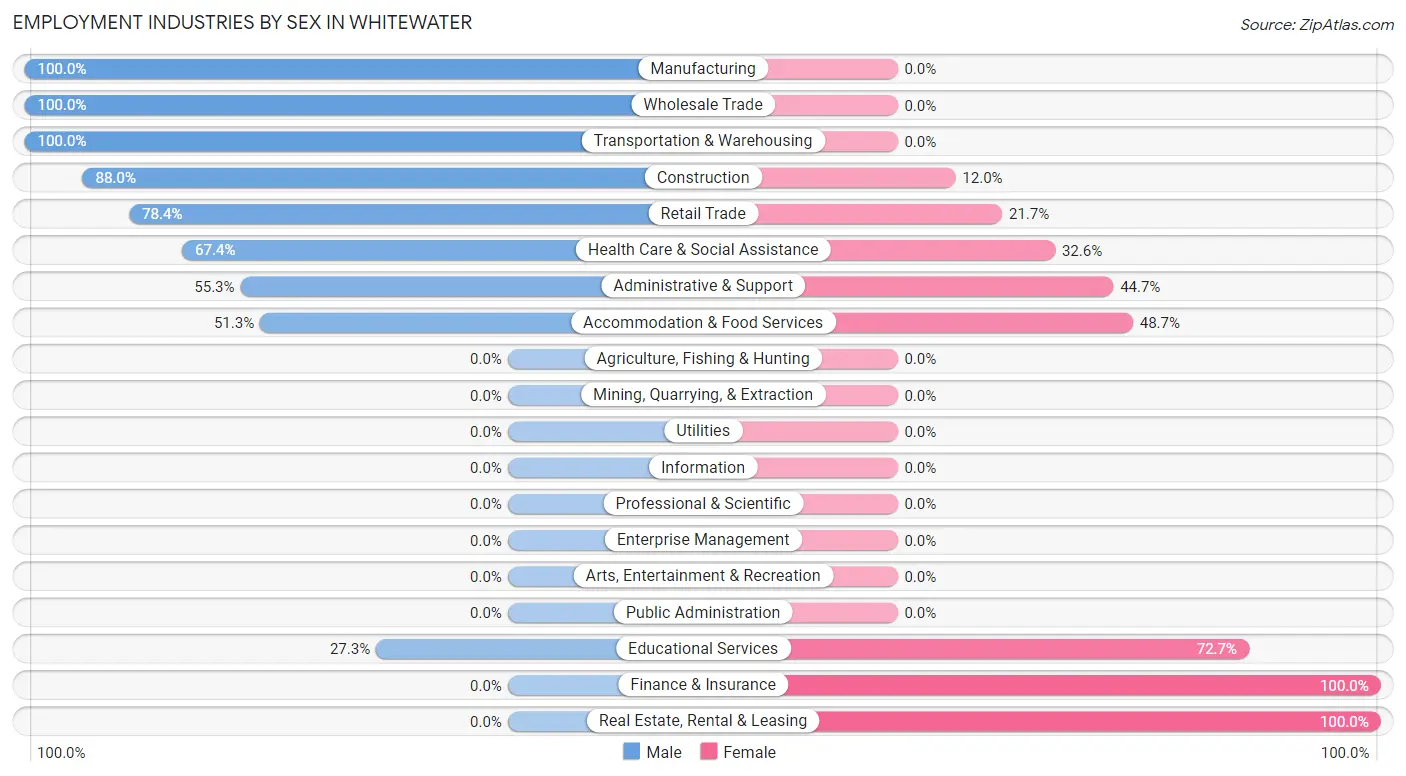
Employment Industries by Sex in Whitewater
The Whitewater industries that see more men than women are Manufacturing (100.0%), Wholesale Trade (100.0%), and Transportation & Warehousing (100.0%), whereas the industries that tend to have a higher number of women are Finance & Insurance (100.0%), Real Estate, Rental & Leasing (100.0%), and Educational Services (72.7%).
| Industry | Male | Female |
| Agriculture, Fishing & Hunting | 0 (0.0%) | 0 (0.0%) |
| Mining, Quarrying, & Extraction | 0 (0.0%) | 0 (0.0%) |
| Construction | 66 (88.0%) | 9 (12.0%) |
| Manufacturing | 6 (100.0%) | 0 (0.0%) |
| Wholesale Trade | 39 (100.0%) | 0 (0.0%) |
| Retail Trade | 76 (78.3%) | 21 (21.6%) |
| Transportation & Warehousing | 51 (100.0%) | 0 (0.0%) |
| Utilities | 0 (0.0%) | 0 (0.0%) |
| Information | 0 (0.0%) | 0 (0.0%) |
| Finance & Insurance | 0 (0.0%) | 5 (100.0%) |
| Real Estate, Rental & Leasing | 0 (0.0%) | 6 (100.0%) |
| Professional & Scientific | 0 (0.0%) | 0 (0.0%) |
| Enterprise Management | 0 (0.0%) | 0 (0.0%) |
| Administrative & Support | 57 (55.3%) | 46 (44.7%) |
| Educational Services | 9 (27.3%) | 24 (72.7%) |
| Health Care & Social Assistance | 31 (67.4%) | 15 (32.6%) |
| Arts, Entertainment & Recreation | 0 (0.0%) | 0 (0.0%) |
| Accommodation & Food Services | 20 (51.3%) | 19 (48.7%) |
| Public Administration | 0 (0.0%) | 0 (0.0%) |
| Total | 366 (68.0%) | 172 (32.0%) |
Education in Whitewater
School Enrollment in Whitewater
The most common levels of schooling among the 230 students in Whitewater are elementary school (80 | 34.8%), high school (76 | 33.0%), and college / undergraduate (40 | 17.4%).
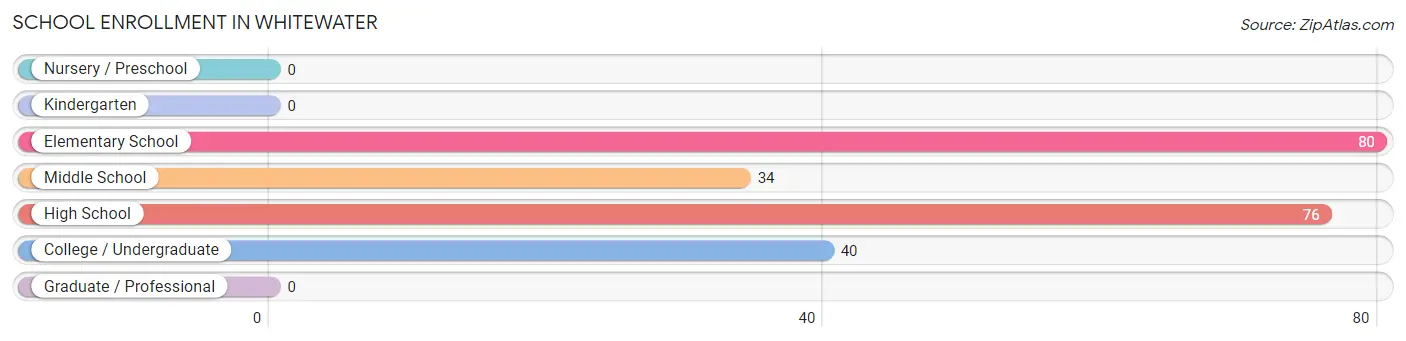
| School Level | # Students | % Students |
| Nursery / Preschool | 0 | 0.0% |
| Kindergarten | 0 | 0.0% |
| Elementary School | 80 | 34.8% |
| Middle School | 34 | 14.8% |
| High School | 76 | 33.0% |
| College / Undergraduate | 40 | 17.4% |
| Graduate / Professional | 0 | 0.0% |
| Total | 230 | 100.0% |
School Enrollment by Age by Funding Source in Whitewater
Out of a total of 230 students who are enrolled in schools in Whitewater, 7 (3.0%) attend a private institution, while the remaining 223 (97.0%) are enrolled in public schools. The age group of 35 years and over has the highest likelihood of being enrolled in private schools, with 7 (18.9% in the age bracket) enrolled. Conversely, the age group of 5 to 9 year old has the lowest likelihood of being enrolled in a private school, with 47 (100.0% in the age bracket) attending a public institution.

| Age Bracket | Public School | Private School |
| 3 to 4 Year Olds | 0 (0.0%) | 0 (0.0%) |
| 5 to 9 Year Old | 47 (100.0%) | 0 (0.0%) |
| 10 to 14 Year Olds | 67 (100.0%) | 0 (0.0%) |
| 15 to 17 Year Olds | 51 (100.0%) | 0 (0.0%) |
| 18 to 19 Year Olds | 4 (100.0%) | 0 (0.0%) |
| 20 to 24 Year Olds | 24 (100.0%) | 0 (0.0%) |
| 25 to 34 Year Olds | 0 (0.0%) | 0 (0.0%) |
| 35 Years and over | 30 (81.1%) | 7 (18.9%) |
| Total | 223 (97.0%) | 7 (3.0%) |
Educational Attainment by Field of Study in Whitewater
Engineering (43 | 27.6%), visual & performing arts (20 | 12.8%), communications (20 | 12.8%), business (16 | 10.3%), and arts & humanities (13 | 8.3%) are the most common fields of study among 156 individuals in Whitewater who have obtained a bachelor's degree or higher.
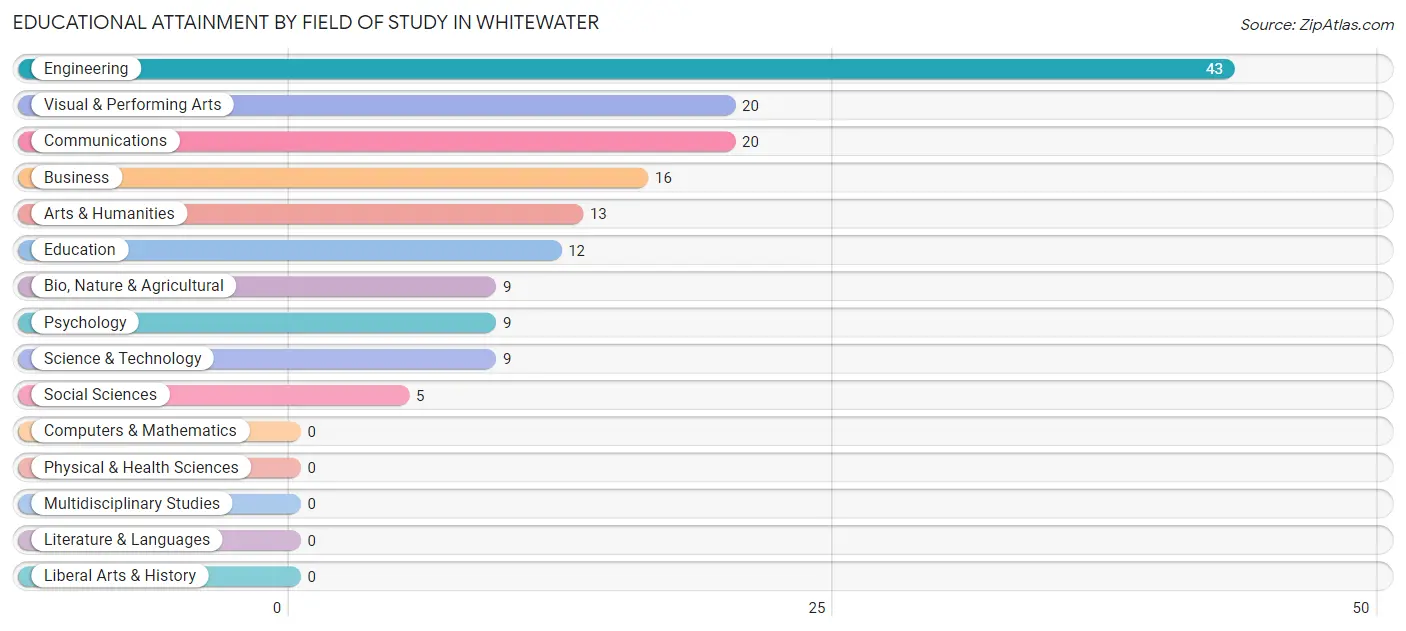
| Field of Study | # Graduates | % Graduates |
| Computers & Mathematics | 0 | 0.0% |
| Bio, Nature & Agricultural | 9 | 5.8% |
| Physical & Health Sciences | 0 | 0.0% |
| Psychology | 9 | 5.8% |
| Social Sciences | 5 | 3.2% |
| Engineering | 43 | 27.6% |
| Multidisciplinary Studies | 0 | 0.0% |
| Science & Technology | 9 | 5.8% |
| Business | 16 | 10.3% |
| Education | 12 | 7.7% |
| Literature & Languages | 0 | 0.0% |
| Liberal Arts & History | 0 | 0.0% |
| Visual & Performing Arts | 20 | 12.8% |
| Communications | 20 | 12.8% |
| Arts & Humanities | 13 | 8.3% |
| Total | 156 | 100.0% |
Transportation & Commute in Whitewater
Vehicle Availability by Sex in Whitewater
The most prevalent vehicle ownership categories in Whitewater are males with 4 vehicles (127, accounting for 35.0%) and females with 4 vehicles (70, making up 75.6%).
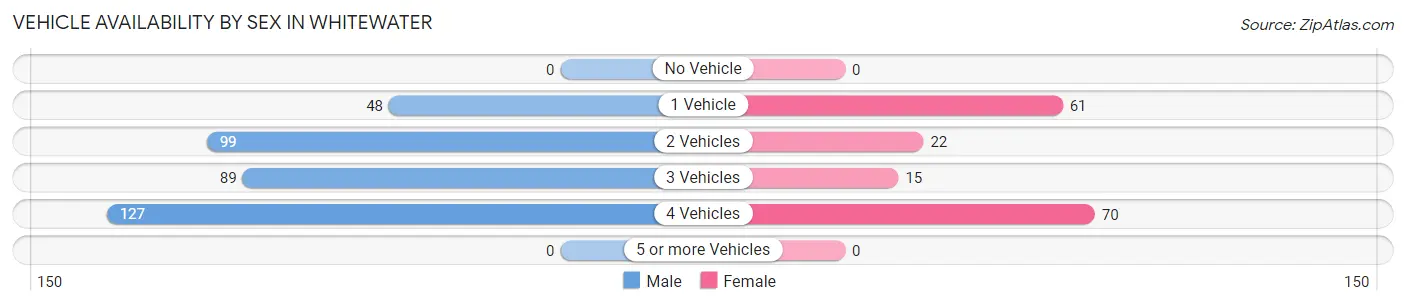
| Vehicles Available | Male | Female |
| No Vehicle | 0 (0.0%) | 0 (0.0%) |
| 1 Vehicle | 48 (13.2%) | 61 (36.3%) |
| 2 Vehicles | 99 (27.3%) | 22 (13.1%) |
| 3 Vehicles | 89 (24.5%) | 15 (8.9%) |
| 4 Vehicles | 127 (35.0%) | 70 (41.7%) |
| 5 or more Vehicles | 0 (0.0%) | 0 (0.0%) |
| Total | 363 (100.0%) | 168 (100.0%) |
Commute Time in Whitewater
The most frequently occuring commute durations in Whitewater are 20 to 24 minutes (80 commuters, 16.3%), 15 to 19 minutes (76 commuters, 15.5%), and 25 to 29 minutes (62 commuters, 12.6%).
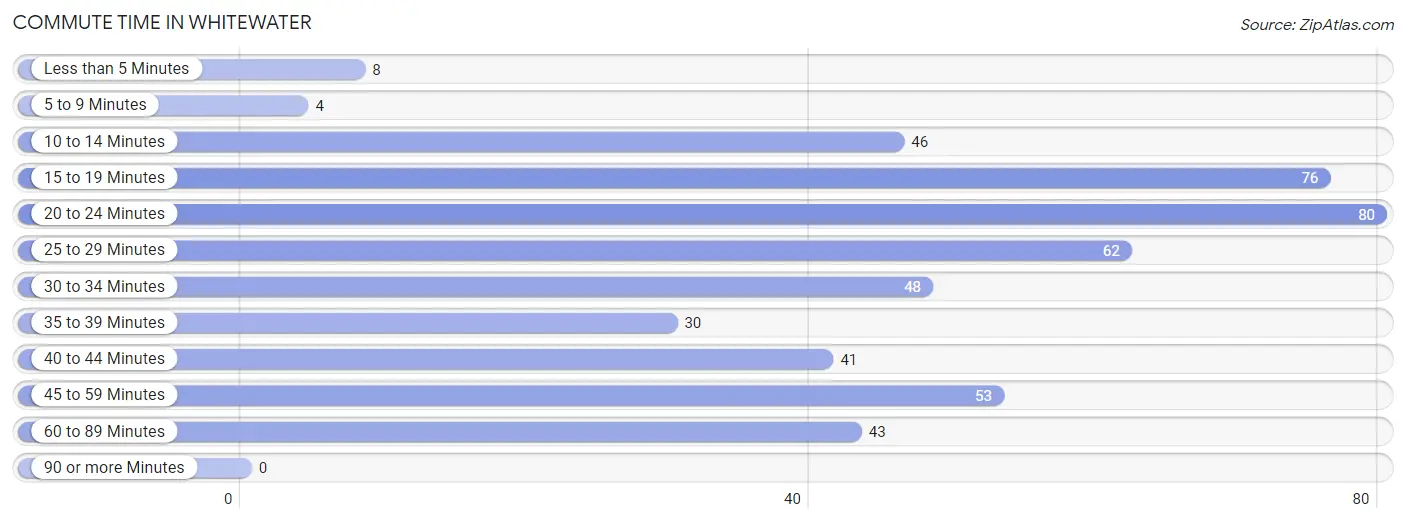
| Commute Time | # Commuters | % Commuters |
| Less than 5 Minutes | 8 | 1.6% |
| 5 to 9 Minutes | 4 | 0.8% |
| 10 to 14 Minutes | 46 | 9.4% |
| 15 to 19 Minutes | 76 | 15.5% |
| 20 to 24 Minutes | 80 | 16.3% |
| 25 to 29 Minutes | 62 | 12.6% |
| 30 to 34 Minutes | 48 | 9.8% |
| 35 to 39 Minutes | 30 | 6.1% |
| 40 to 44 Minutes | 41 | 8.4% |
| 45 to 59 Minutes | 53 | 10.8% |
| 60 to 89 Minutes | 43 | 8.8% |
| 90 or more Minutes | 0 | 0.0% |
Commute Time by Sex in Whitewater
The most common commute times in Whitewater are 20 to 24 minutes (80 commuters, 22.2%) for males and 25 to 29 minutes (49 commuters, 37.4%) for females.
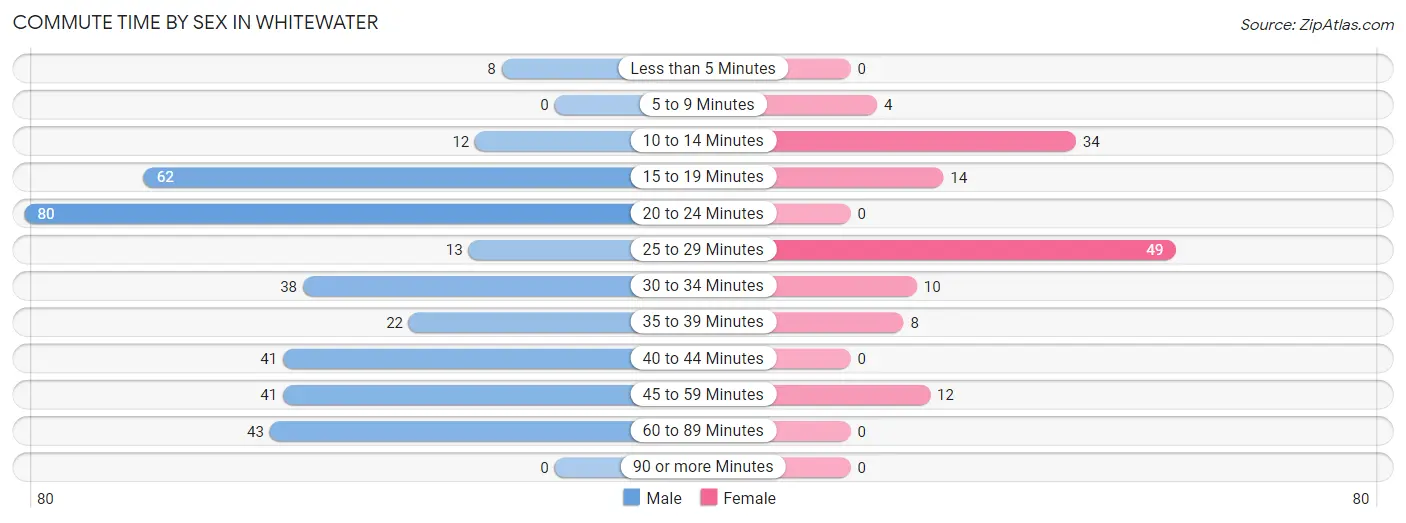
| Commute Time | Male | Female |
| Less than 5 Minutes | 8 (2.2%) | 0 (0.0%) |
| 5 to 9 Minutes | 0 (0.0%) | 4 (3.0%) |
| 10 to 14 Minutes | 12 (3.3%) | 34 (26.0%) |
| 15 to 19 Minutes | 62 (17.2%) | 14 (10.7%) |
| 20 to 24 Minutes | 80 (22.2%) | 0 (0.0%) |
| 25 to 29 Minutes | 13 (3.6%) | 49 (37.4%) |
| 30 to 34 Minutes | 38 (10.6%) | 10 (7.6%) |
| 35 to 39 Minutes | 22 (6.1%) | 8 (6.1%) |
| 40 to 44 Minutes | 41 (11.4%) | 0 (0.0%) |
| 45 to 59 Minutes | 41 (11.4%) | 12 (9.2%) |
| 60 to 89 Minutes | 43 (11.9%) | 0 (0.0%) |
| 90 or more Minutes | 0 (0.0%) | 0 (0.0%) |
Time of Departure to Work by Sex in Whitewater
The most frequent times of departure to work in Whitewater are 8:00 AM to 8:29 AM (90, 25.0%) for males and 9:00 AM to 9:59 AM (34, 26.0%) for females.
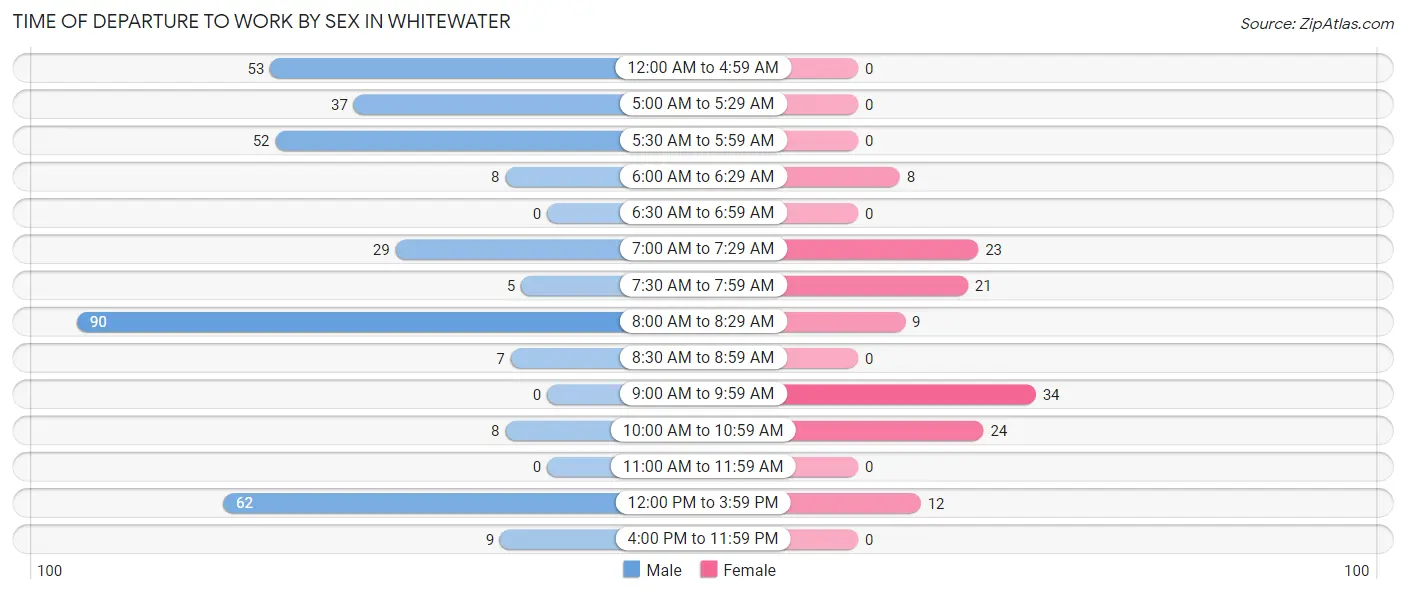
| Time of Departure | Male | Female |
| 12:00 AM to 4:59 AM | 53 (14.7%) | 0 (0.0%) |
| 5:00 AM to 5:29 AM | 37 (10.3%) | 0 (0.0%) |
| 5:30 AM to 5:59 AM | 52 (14.4%) | 0 (0.0%) |
| 6:00 AM to 6:29 AM | 8 (2.2%) | 8 (6.1%) |
| 6:30 AM to 6:59 AM | 0 (0.0%) | 0 (0.0%) |
| 7:00 AM to 7:29 AM | 29 (8.1%) | 23 (17.6%) |
| 7:30 AM to 7:59 AM | 5 (1.4%) | 21 (16.0%) |
| 8:00 AM to 8:29 AM | 90 (25.0%) | 9 (6.9%) |
| 8:30 AM to 8:59 AM | 7 (1.9%) | 0 (0.0%) |
| 9:00 AM to 9:59 AM | 0 (0.0%) | 34 (26.0%) |
| 10:00 AM to 10:59 AM | 8 (2.2%) | 24 (18.3%) |
| 11:00 AM to 11:59 AM | 0 (0.0%) | 0 (0.0%) |
| 12:00 PM to 3:59 PM | 62 (17.2%) | 12 (9.2%) |
| 4:00 PM to 11:59 PM | 9 (2.5%) | 0 (0.0%) |
| Total | 360 (100.0%) | 131 (100.0%) |
Housing Occupancy in Whitewater
Occupancy by Ownership in Whitewater
Of the total 355 dwellings in Whitewater, owner-occupied units account for 283 (79.7%), while renter-occupied units make up 72 (20.3%).
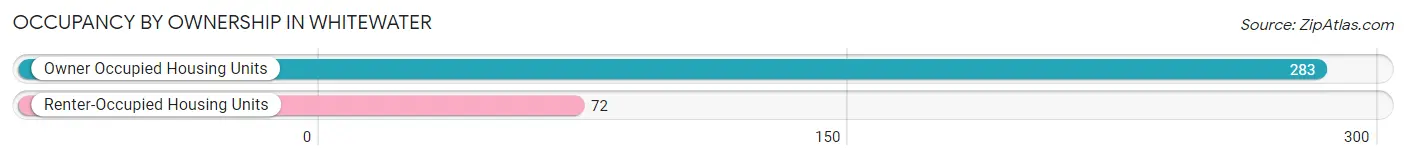
| Occupancy | # Housing Units | % Housing Units |
| Owner Occupied Housing Units | 283 | 79.7% |
| Renter-Occupied Housing Units | 72 | 20.3% |
| Total Occupied Housing Units | 355 | 100.0% |
Occupancy by Household Size in Whitewater
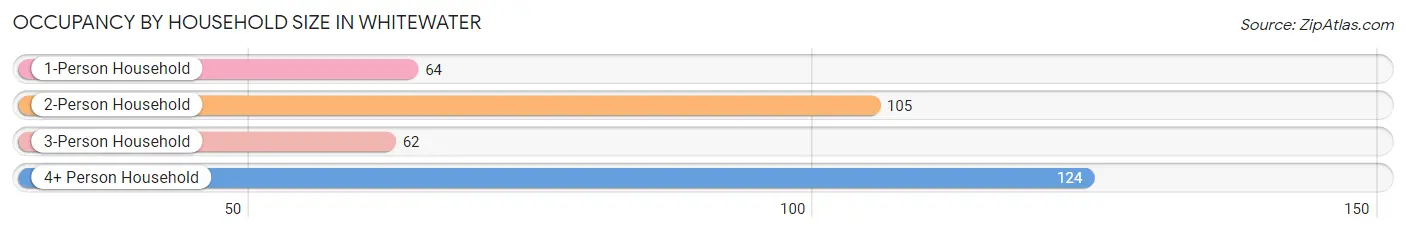
| Household Size | # Housing Units | % Housing Units |
| 1-Person Household | 64 | 18.0% |
| 2-Person Household | 105 | 29.6% |
| 3-Person Household | 62 | 17.5% |
| 4+ Person Household | 124 | 34.9% |
| Total Housing Units | 355 | 100.0% |
Occupancy by Ownership by Household Size in Whitewater
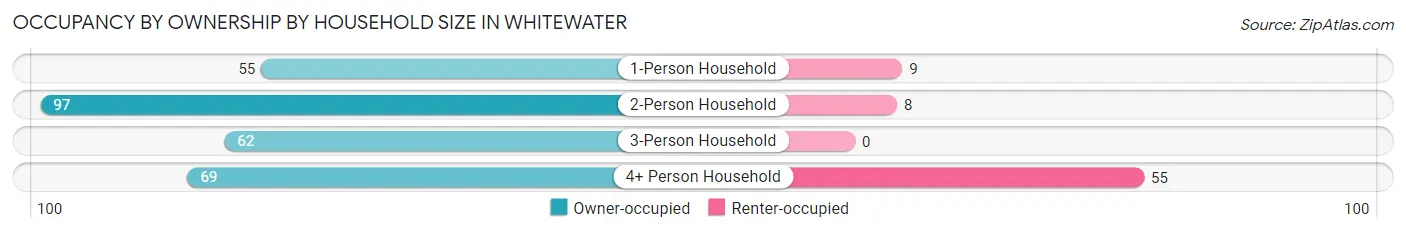
| Household Size | Owner-occupied | Renter-occupied |
| 1-Person Household | 55 (85.9%) | 9 (14.1%) |
| 2-Person Household | 97 (92.4%) | 8 (7.6%) |
| 3-Person Household | 62 (100.0%) | 0 (0.0%) |
| 4+ Person Household | 69 (55.6%) | 55 (44.4%) |
| Total Housing Units | 283 (79.7%) | 72 (20.3%) |
Occupancy by Educational Attainment in Whitewater
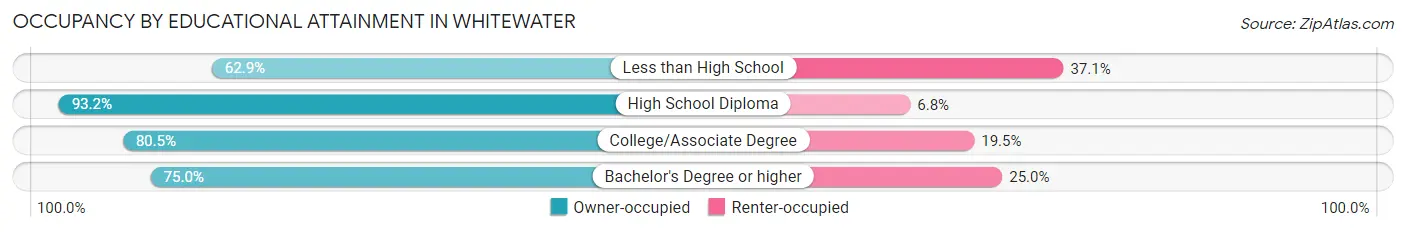
| Household Size | Owner-occupied | Renter-occupied |
| Less than High School | 22 (62.9%) | 13 (37.1%) |
| High School Diploma | 55 (93.2%) | 4 (6.8%) |
| College/Associate Degree | 149 (80.5%) | 36 (19.5%) |
| Bachelor's Degree or higher | 57 (75.0%) | 19 (25.0%) |
Occupancy by Age of Householder in Whitewater
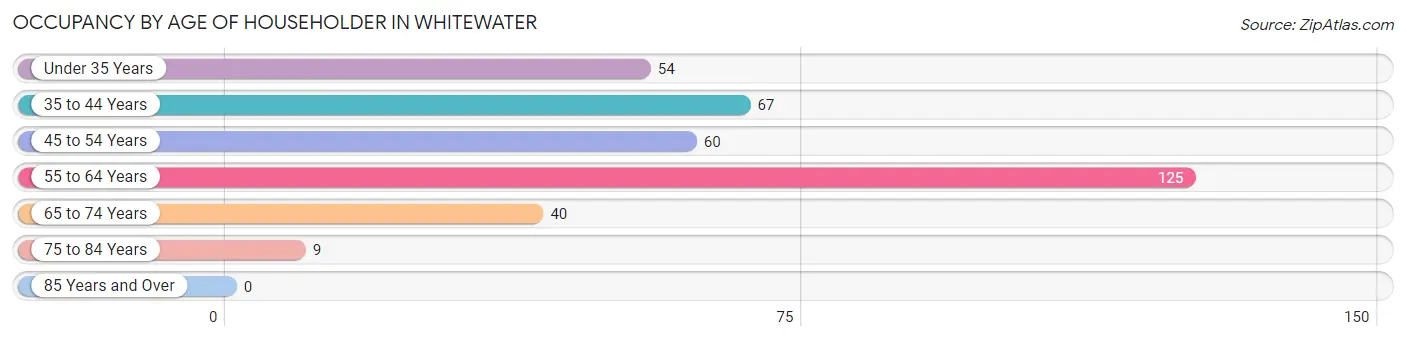
| Age Bracket | # Households | % Households |
| Under 35 Years | 54 | 15.2% |
| 35 to 44 Years | 67 | 18.9% |
| 45 to 54 Years | 60 | 16.9% |
| 55 to 64 Years | 125 | 35.2% |
| 65 to 74 Years | 40 | 11.3% |
| 75 to 84 Years | 9 | 2.5% |
| 85 Years and Over | 0 | 0.0% |
| Total | 355 | 100.0% |
Housing Finances in Whitewater
Median Income by Occupancy in Whitewater
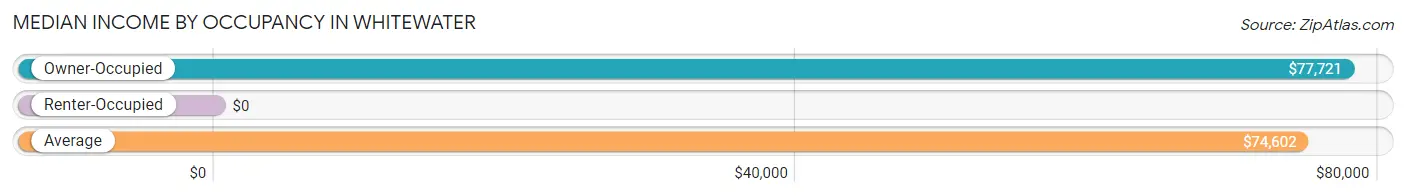
| Occupancy Type | # Households | Median Income |
| Owner-Occupied | 283 (79.7%) | $77,721 |
| Renter-Occupied | 72 (20.3%) | $0 |
| Average | 355 (100.0%) | $74,602 |
Occupancy by Householder Income Bracket in Whitewater
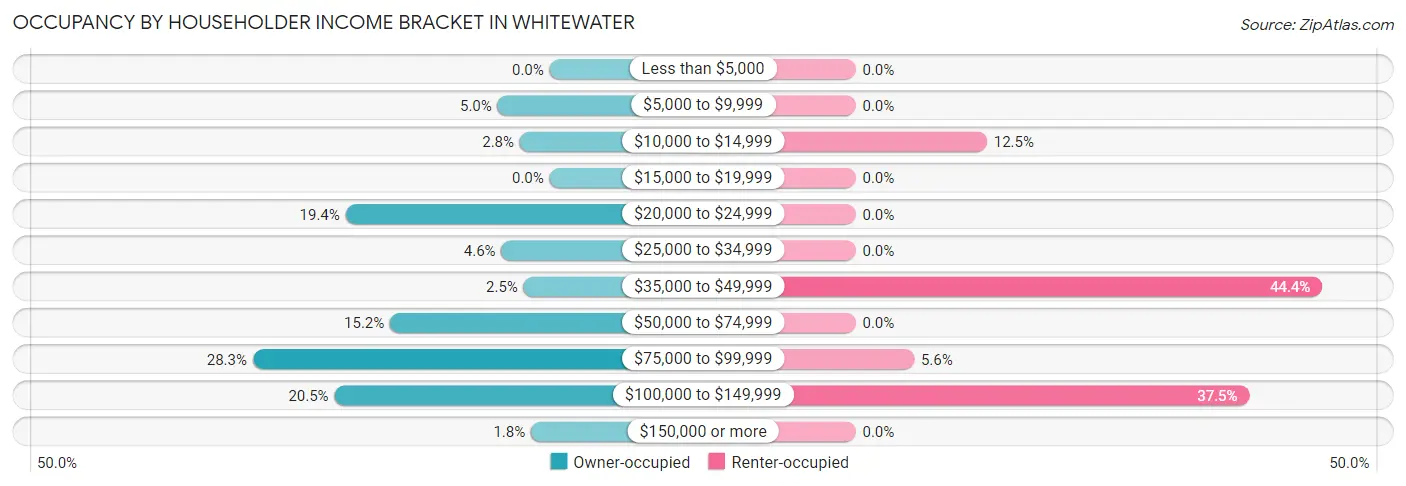
| Income Bracket | Owner-occupied | Renter-occupied |
| Less than $5,000 | 0 (0.0%) | 0 (0.0%) |
| $5,000 to $9,999 | 14 (5.0%) | 0 (0.0%) |
| $10,000 to $14,999 | 8 (2.8%) | 9 (12.5%) |
| $15,000 to $19,999 | 0 (0.0%) | 0 (0.0%) |
| $20,000 to $24,999 | 55 (19.4%) | 0 (0.0%) |
| $25,000 to $34,999 | 13 (4.6%) | 0 (0.0%) |
| $35,000 to $49,999 | 7 (2.5%) | 32 (44.4%) |
| $50,000 to $74,999 | 43 (15.2%) | 0 (0.0%) |
| $75,000 to $99,999 | 80 (28.3%) | 4 (5.6%) |
| $100,000 to $149,999 | 58 (20.5%) | 27 (37.5%) |
| $150,000 or more | 5 (1.8%) | 0 (0.0%) |
| Total | 283 (100.0%) | 72 (100.0%) |
Monthly Housing Cost Tiers in Whitewater
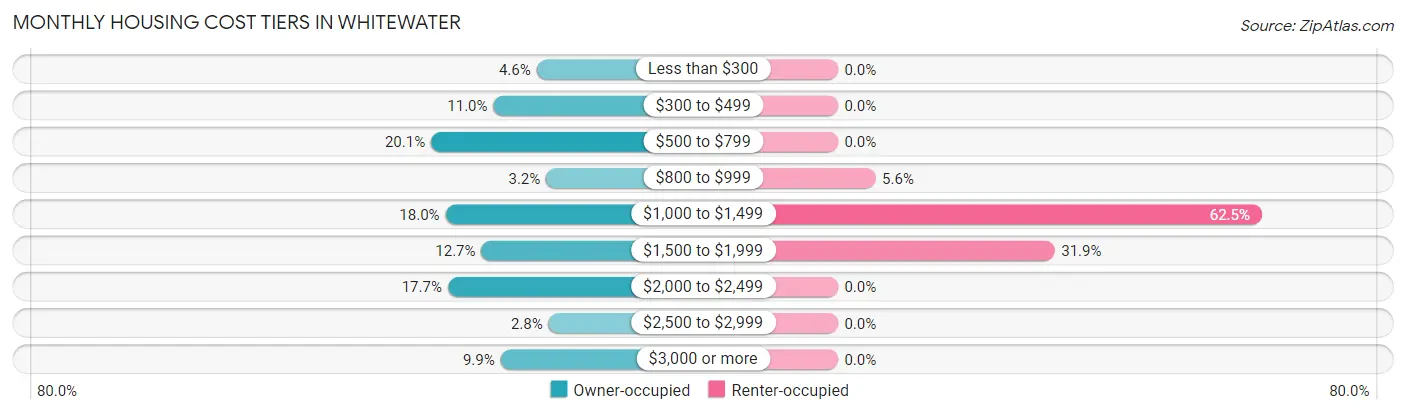
| Monthly Cost | Owner-occupied | Renter-occupied |
| Less than $300 | 13 (4.6%) | 0 (0.0%) |
| $300 to $499 | 31 (11.0%) | 0 (0.0%) |
| $500 to $799 | 57 (20.1%) | 0 (0.0%) |
| $800 to $999 | 9 (3.2%) | 4 (5.6%) |
| $1,000 to $1,499 | 51 (18.0%) | 45 (62.5%) |
| $1,500 to $1,999 | 36 (12.7%) | 23 (31.9%) |
| $2,000 to $2,499 | 50 (17.7%) | 0 (0.0%) |
| $2,500 to $2,999 | 8 (2.8%) | 0 (0.0%) |
| $3,000 or more | 28 (9.9%) | 0 (0.0%) |
| Total | 283 (100.0%) | 72 (100.0%) |
Physical Housing Characteristics in Whitewater
Housing Structures in Whitewater
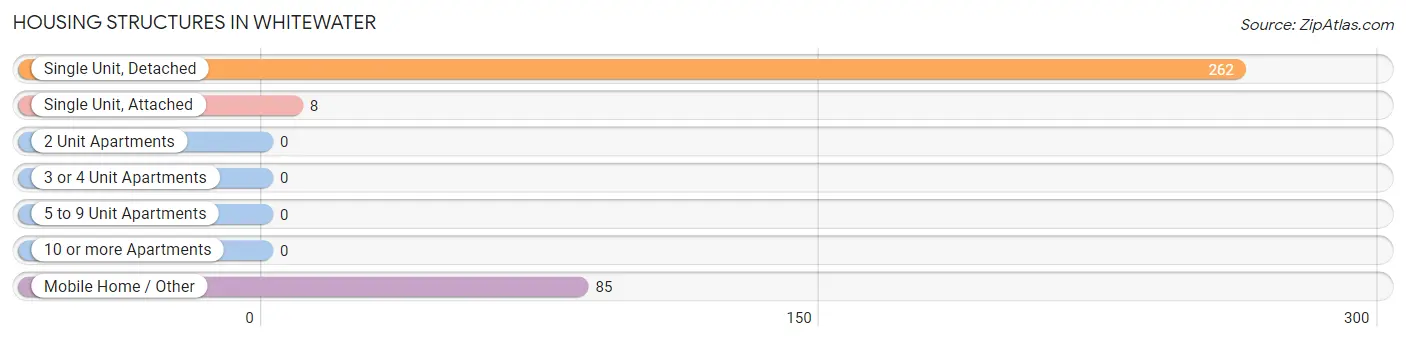
| Structure Type | # Housing Units | % Housing Units |
| Single Unit, Detached | 262 | 73.8% |
| Single Unit, Attached | 8 | 2.2% |
| 2 Unit Apartments | 0 | 0.0% |
| 3 or 4 Unit Apartments | 0 | 0.0% |
| 5 to 9 Unit Apartments | 0 | 0.0% |
| 10 or more Apartments | 0 | 0.0% |
| Mobile Home / Other | 85 | 23.9% |
| Total | 355 | 100.0% |
Housing Structures by Occupancy in Whitewater
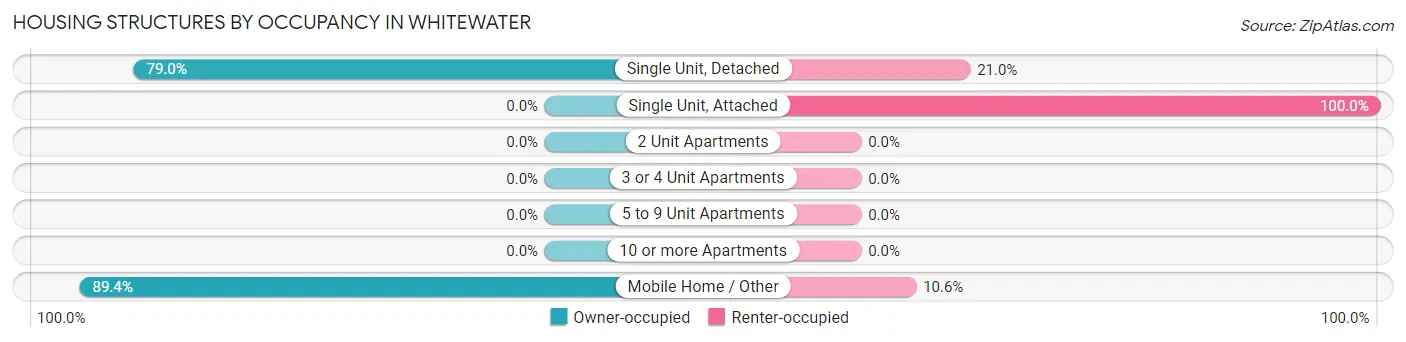
| Structure Type | Owner-occupied | Renter-occupied |
| Single Unit, Detached | 207 (79.0%) | 55 (21.0%) |
| Single Unit, Attached | 0 (0.0%) | 8 (100.0%) |
| 2 Unit Apartments | 0 (0.0%) | 0 (0.0%) |
| 3 or 4 Unit Apartments | 0 (0.0%) | 0 (0.0%) |
| 5 to 9 Unit Apartments | 0 (0.0%) | 0 (0.0%) |
| 10 or more Apartments | 0 (0.0%) | 0 (0.0%) |
| Mobile Home / Other | 76 (89.4%) | 9 (10.6%) |
| Total | 283 (79.7%) | 72 (20.3%) |
Housing Structures by Number of Rooms in Whitewater
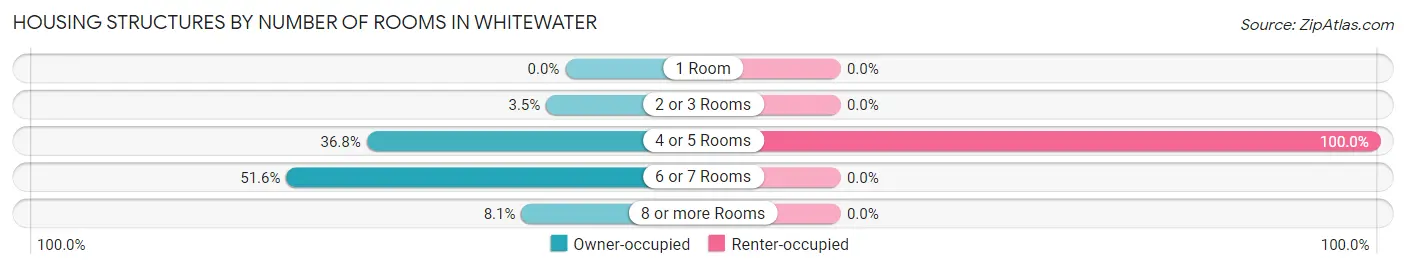
| Number of Rooms | Owner-occupied | Renter-occupied |
| 1 Room | 0 (0.0%) | 0 (0.0%) |
| 2 or 3 Rooms | 10 (3.5%) | 0 (0.0%) |
| 4 or 5 Rooms | 104 (36.7%) | 72 (100.0%) |
| 6 or 7 Rooms | 146 (51.6%) | 0 (0.0%) |
| 8 or more Rooms | 23 (8.1%) | 0 (0.0%) |
| Total | 283 (100.0%) | 72 (100.0%) |
Housing Structure by Heating Type in Whitewater
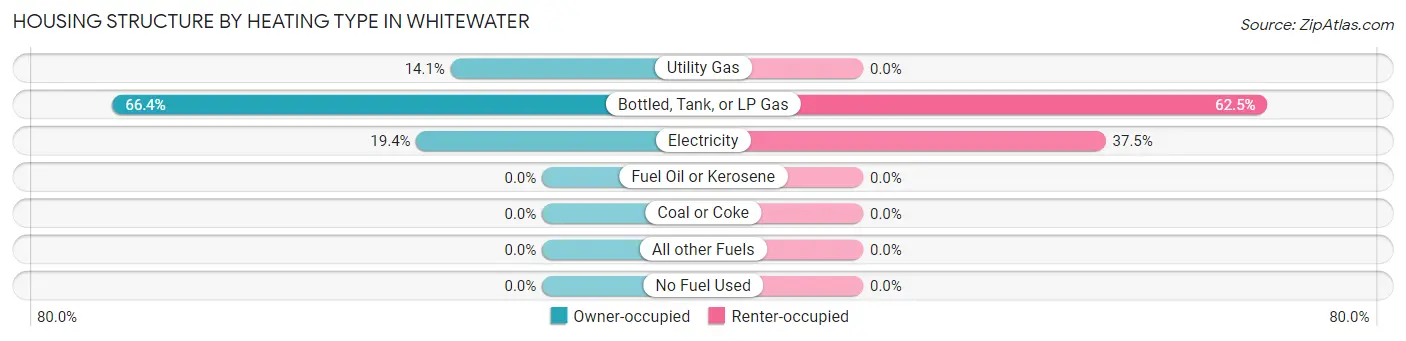
| Heating Type | Owner-occupied | Renter-occupied |
| Utility Gas | 40 (14.1%) | 0 (0.0%) |
| Bottled, Tank, or LP Gas | 188 (66.4%) | 45 (62.5%) |
| Electricity | 55 (19.4%) | 27 (37.5%) |
| Fuel Oil or Kerosene | 0 (0.0%) | 0 (0.0%) |
| Coal or Coke | 0 (0.0%) | 0 (0.0%) |
| All other Fuels | 0 (0.0%) | 0 (0.0%) |
| No Fuel Used | 0 (0.0%) | 0 (0.0%) |
| Total | 283 (100.0%) | 72 (100.0%) |
Household Vehicle Usage in Whitewater
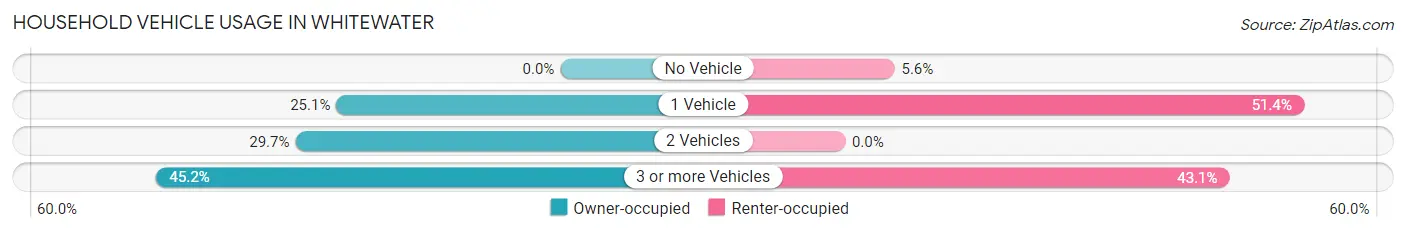
| Vehicles per Household | Owner-occupied | Renter-occupied |
| No Vehicle | 0 (0.0%) | 4 (5.6%) |
| 1 Vehicle | 71 (25.1%) | 37 (51.4%) |
| 2 Vehicles | 84 (29.7%) | 0 (0.0%) |
| 3 or more Vehicles | 128 (45.2%) | 31 (43.1%) |
| Total | 283 (100.0%) | 72 (100.0%) |
Real Estate & Mortgages in Whitewater
Real Estate and Mortgage Overview in Whitewater
| Characteristic | Without Mortgage | With Mortgage |
| Housing Units | 108 | 175 |
| Median Property Value | $244,600 | $277,600 |
| Median Household Income | $73,000 | $5 |
| Monthly Housing Costs | $600 | $28 |
| Real Estate Taxes | $1,290 | $0 |
Property Value by Mortgage Status in Whitewater
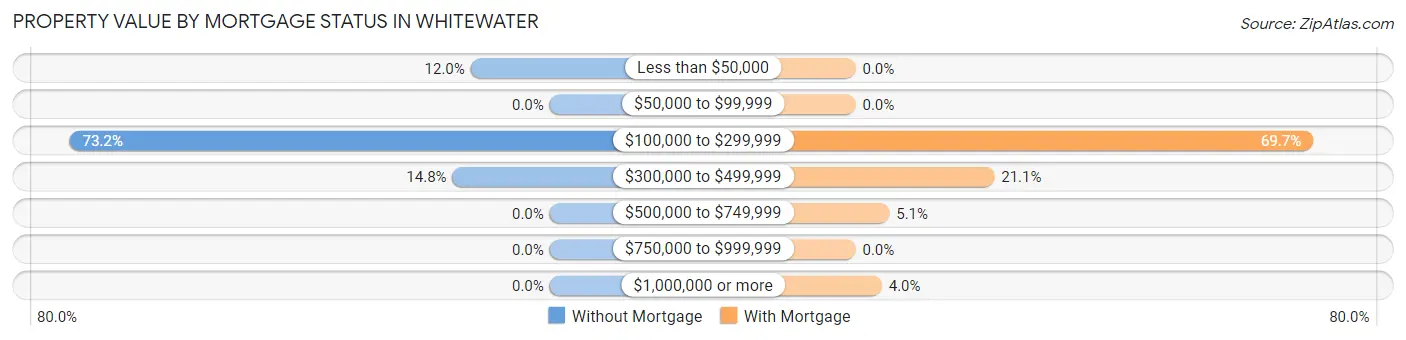
| Property Value | Without Mortgage | With Mortgage |
| Less than $50,000 | 13 (12.0%) | 0 (0.0%) |
| $50,000 to $99,999 | 0 (0.0%) | 0 (0.0%) |
| $100,000 to $299,999 | 79 (73.2%) | 122 (69.7%) |
| $300,000 to $499,999 | 16 (14.8%) | 37 (21.1%) |
| $500,000 to $749,999 | 0 (0.0%) | 9 (5.1%) |
| $750,000 to $999,999 | 0 (0.0%) | 0 (0.0%) |
| $1,000,000 or more | 0 (0.0%) | 7 (4.0%) |
| Total | 108 (100.0%) | 175 (100.0%) |
Household Income by Mortgage Status in Whitewater
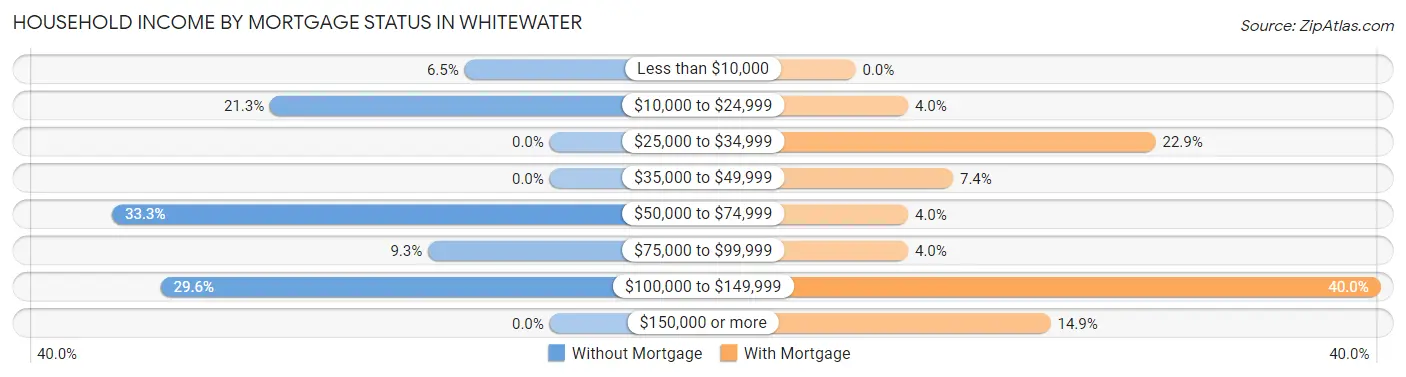
| Household Income | Without Mortgage | With Mortgage |
| Less than $10,000 | 7 (6.5%) | 0 (0.0%) |
| $10,000 to $24,999 | 23 (21.3%) | 7 (4.0%) |
| $25,000 to $34,999 | 0 (0.0%) | 40 (22.9%) |
| $35,000 to $49,999 | 0 (0.0%) | 13 (7.4%) |
| $50,000 to $74,999 | 36 (33.3%) | 7 (4.0%) |
| $75,000 to $99,999 | 10 (9.3%) | 7 (4.0%) |
| $100,000 to $149,999 | 32 (29.6%) | 70 (40.0%) |
| $150,000 or more | 0 (0.0%) | 26 (14.9%) |
| Total | 108 (100.0%) | 175 (100.0%) |
Property Value to Household Income Ratio in Whitewater
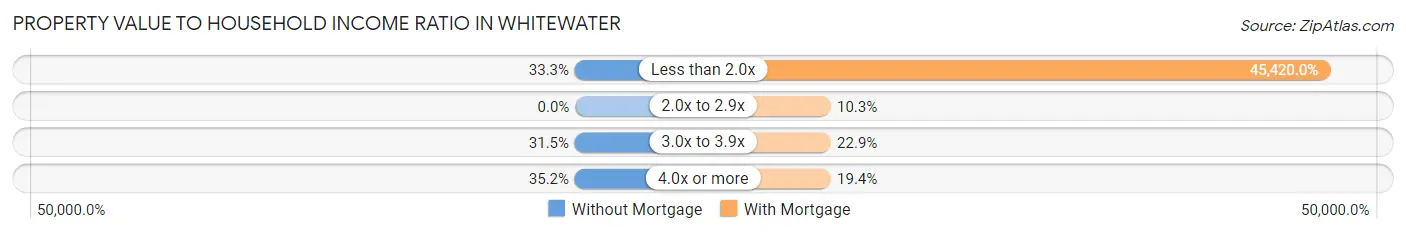
| Value-to-Income Ratio | Without Mortgage | With Mortgage |
| Less than 2.0x | 36 (33.3%) | 79,485 (45,420.0%) |
| 2.0x to 2.9x | 0 (0.0%) | 18 (10.3%) |
| 3.0x to 3.9x | 34 (31.5%) | 40 (22.9%) |
| 4.0x or more | 38 (35.2%) | 34 (19.4%) |
| Total | 108 (100.0%) | 175 (100.0%) |
Real Estate Taxes by Mortgage Status in Whitewater
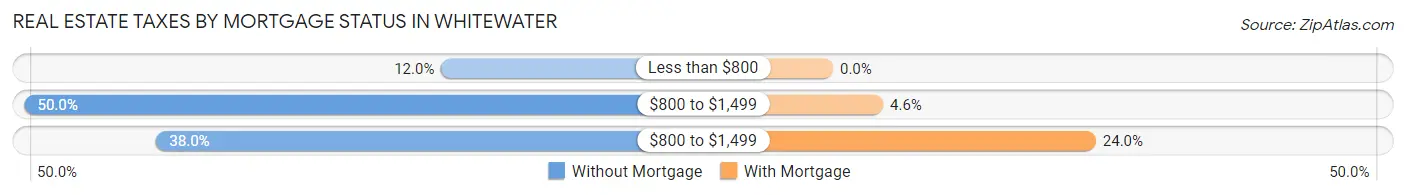
| Property Taxes | Without Mortgage | With Mortgage |
| Less than $800 | 13 (12.0%) | 0 (0.0%) |
| $800 to $1,499 | 54 (50.0%) | 8 (4.6%) |
| $800 to $1,499 | 41 (38.0%) | 42 (24.0%) |
| Total | 108 (100.0%) | 175 (100.0%) |
Health & Disability in Whitewater
Health Insurance Coverage by Age in Whitewater
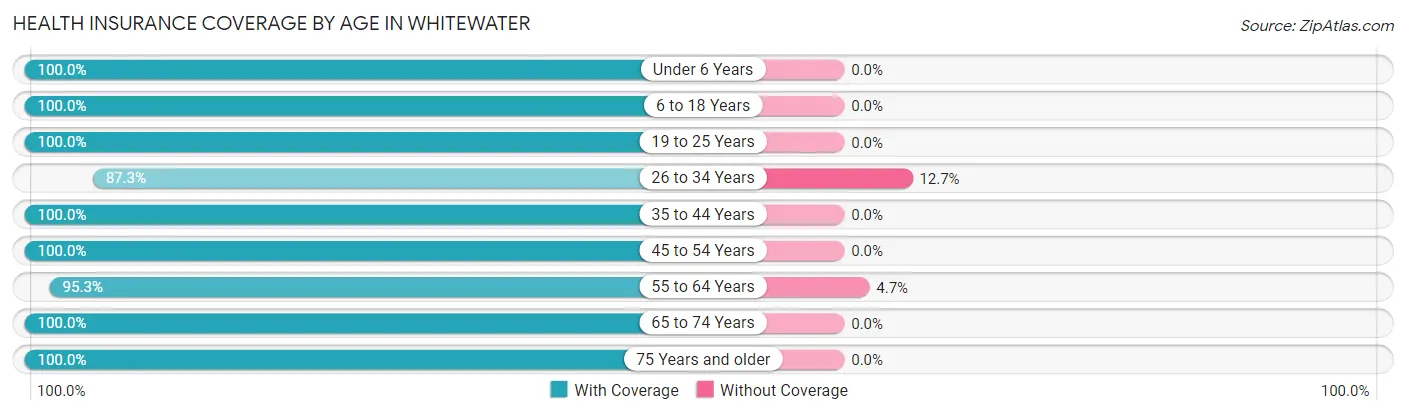
| Age Bracket | With Coverage | Without Coverage |
| Under 6 Years | 57 (100.0%) | 0 (0.0%) |
| 6 to 18 Years | 198 (100.0%) | 0 (0.0%) |
| 19 to 25 Years | 153 (100.0%) | 0 (0.0%) |
| 26 to 34 Years | 103 (87.3%) | 15 (12.7%) |
| 35 to 44 Years | 220 (100.0%) | 0 (0.0%) |
| 45 to 54 Years | 167 (100.0%) | 0 (0.0%) |
| 55 to 64 Years | 163 (95.3%) | 8 (4.7%) |
| 65 to 74 Years | 88 (100.0%) | 0 (0.0%) |
| 75 Years and older | 21 (100.0%) | 0 (0.0%) |
| Total | 1,170 (98.1%) | 23 (1.9%) |
Health Insurance Coverage by Citizenship Status in Whitewater
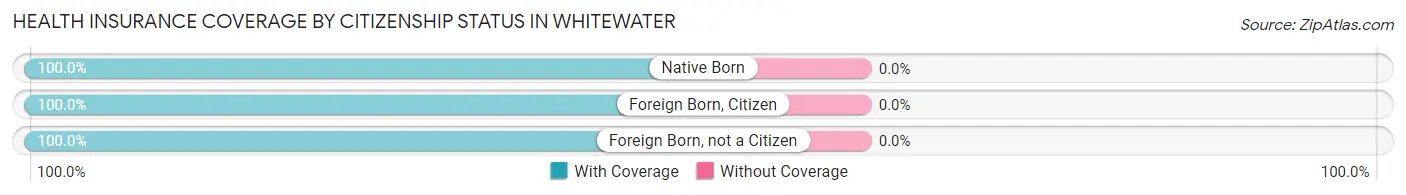
| Citizenship Status | With Coverage | Without Coverage |
| Native Born | 57 (100.0%) | 0 (0.0%) |
| Foreign Born, Citizen | 198 (100.0%) | 0 (0.0%) |
| Foreign Born, not a Citizen | 153 (100.0%) | 0 (0.0%) |
Health Insurance Coverage by Household Income in Whitewater
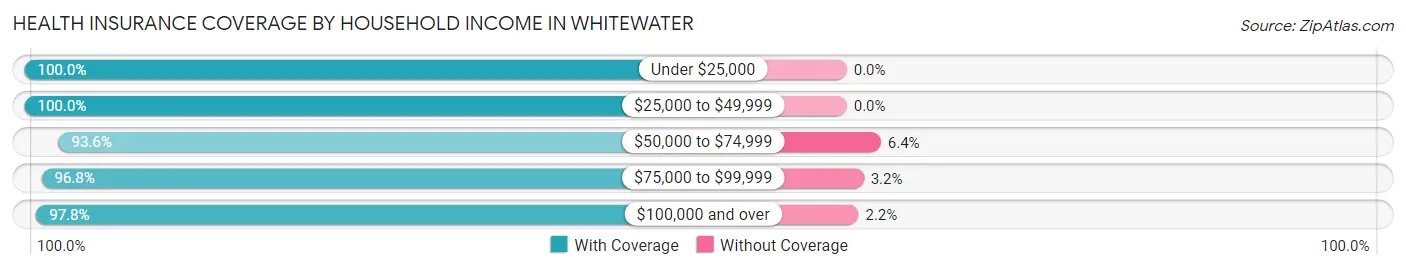
| Household Income | With Coverage | Without Coverage |
| Under $25,000 | 241 (100.0%) | 0 (0.0%) |
| $25,000 to $49,999 | 202 (100.0%) | 0 (0.0%) |
| $50,000 to $74,999 | 88 (93.6%) | 6 (6.4%) |
| $75,000 to $99,999 | 275 (96.8%) | 9 (3.2%) |
| $100,000 and over | 355 (97.8%) | 8 (2.2%) |
Public vs Private Health Insurance Coverage by Age in Whitewater
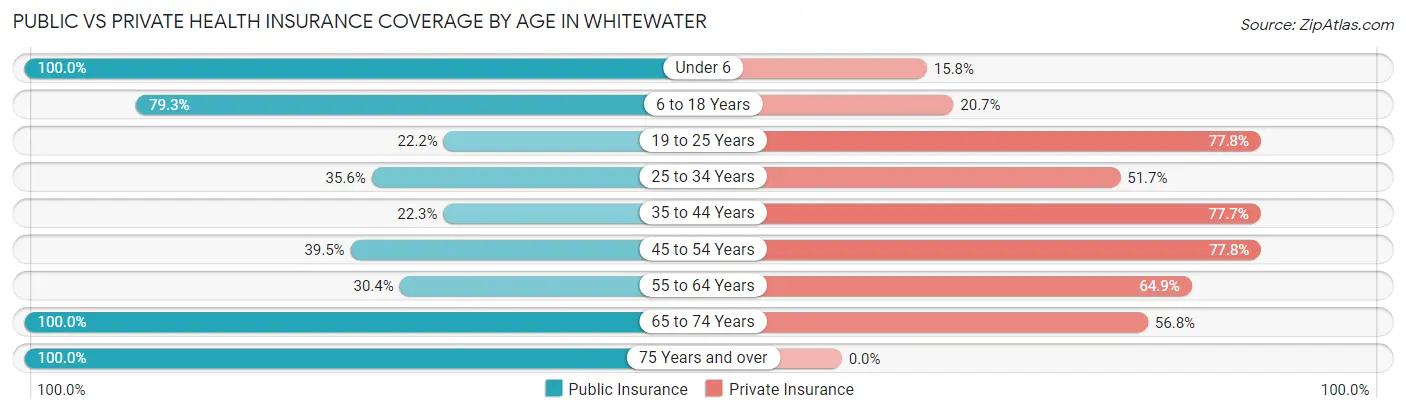
| Age Bracket | Public Insurance | Private Insurance |
| Under 6 | 57 (100.0%) | 9 (15.8%) |
| 6 to 18 Years | 157 (79.3%) | 41 (20.7%) |
| 19 to 25 Years | 34 (22.2%) | 119 (77.8%) |
| 25 to 34 Years | 42 (35.6%) | 61 (51.7%) |
| 35 to 44 Years | 49 (22.3%) | 171 (77.7%) |
| 45 to 54 Years | 66 (39.5%) | 130 (77.8%) |
| 55 to 64 Years | 52 (30.4%) | 111 (64.9%) |
| 65 to 74 Years | 88 (100.0%) | 50 (56.8%) |
| 75 Years and over | 21 (100.0%) | 0 (0.0%) |
| Total | 566 (47.4%) | 692 (58.0%) |
Disability Status by Sex by Age in Whitewater
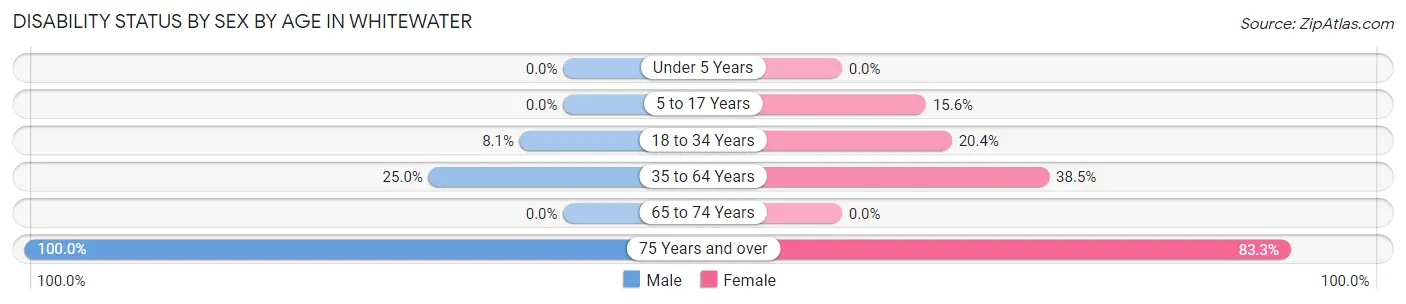
| Age Bracket | Male | Female |
| Under 5 Years | 0 (0.0%) | 0 (0.0%) |
| 5 to 17 Years | 0 (0.0%) | 15 (15.6%) |
| 18 to 34 Years | 14 (8.1%) | 20 (20.4%) |
| 35 to 64 Years | 70 (25.0%) | 107 (38.5%) |
| 65 to 74 Years | 0 (0.0%) | 0 (0.0%) |
| 75 Years and over | 9 (100.0%) | 10 (83.3%) |
Disability Class by Sex by Age in Whitewater
Disability Class: Hearing Difficulty
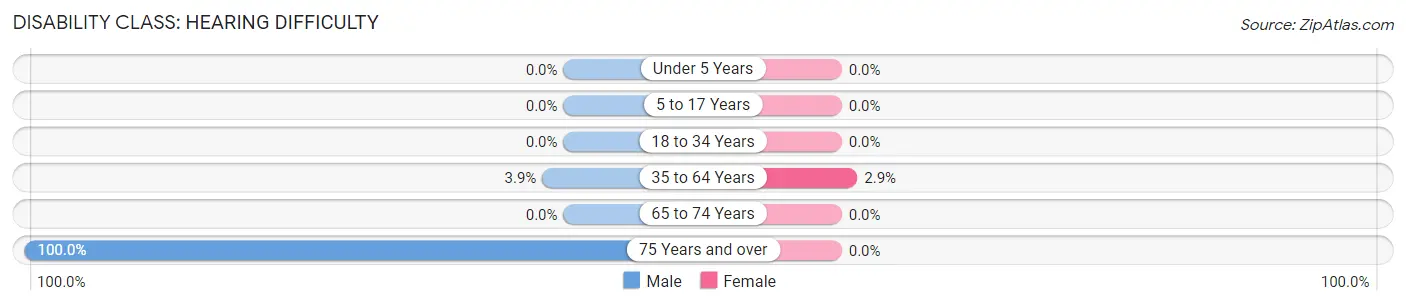
| Age Bracket | Male | Female |
| Under 5 Years | 0 (0.0%) | 0 (0.0%) |
| 5 to 17 Years | 0 (0.0%) | 0 (0.0%) |
| 18 to 34 Years | 0 (0.0%) | 0 (0.0%) |
| 35 to 64 Years | 11 (3.9%) | 8 (2.9%) |
| 65 to 74 Years | 0 (0.0%) | 0 (0.0%) |
| 75 Years and over | 9 (100.0%) | 0 (0.0%) |
Disability Class: Vision Difficulty
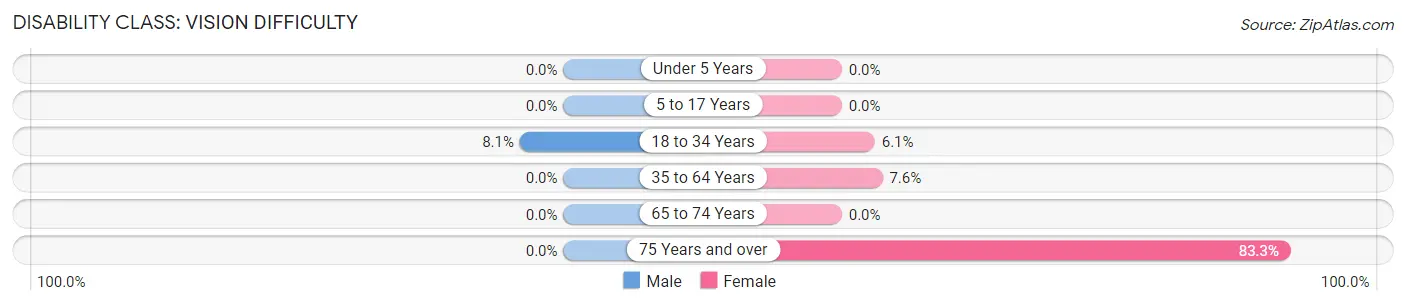
| Age Bracket | Male | Female |
| Under 5 Years | 0 (0.0%) | 0 (0.0%) |
| 5 to 17 Years | 0 (0.0%) | 0 (0.0%) |
| 18 to 34 Years | 14 (8.1%) | 6 (6.1%) |
| 35 to 64 Years | 0 (0.0%) | 21 (7.5%) |
| 65 to 74 Years | 0 (0.0%) | 0 (0.0%) |
| 75 Years and over | 0 (0.0%) | 10 (83.3%) |
Disability Class: Cognitive Difficulty
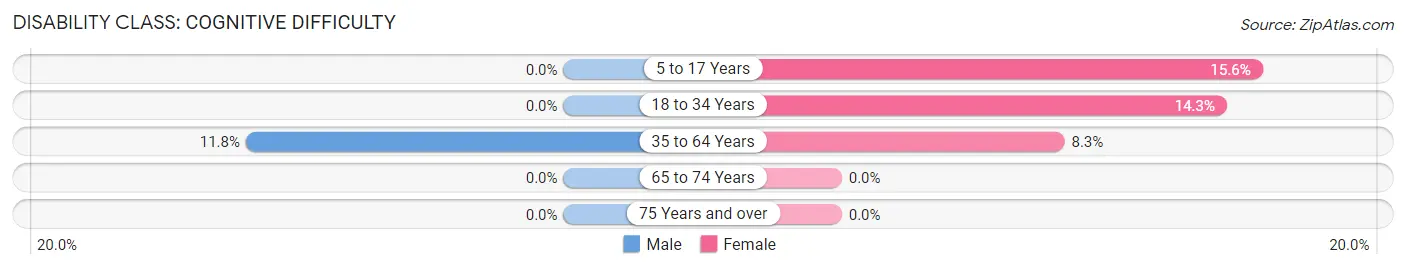
| Age Bracket | Male | Female |
| 5 to 17 Years | 0 (0.0%) | 15 (15.6%) |
| 18 to 34 Years | 0 (0.0%) | 14 (14.3%) |
| 35 to 64 Years | 33 (11.8%) | 23 (8.3%) |
| 65 to 74 Years | 0 (0.0%) | 0 (0.0%) |
| 75 Years and over | 0 (0.0%) | 0 (0.0%) |
Disability Class: Ambulatory Difficulty
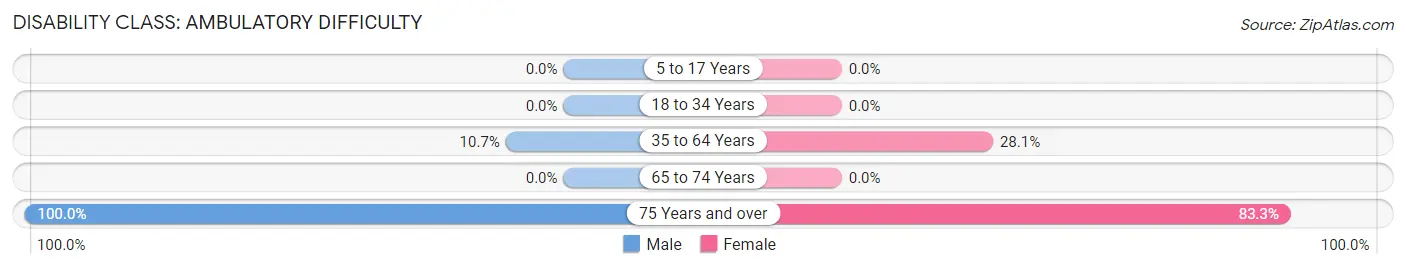
| Age Bracket | Male | Female |
| 5 to 17 Years | 0 (0.0%) | 0 (0.0%) |
| 18 to 34 Years | 0 (0.0%) | 0 (0.0%) |
| 35 to 64 Years | 30 (10.7%) | 78 (28.1%) |
| 65 to 74 Years | 0 (0.0%) | 0 (0.0%) |
| 75 Years and over | 9 (100.0%) | 10 (83.3%) |
Disability Class: Self-Care Difficulty
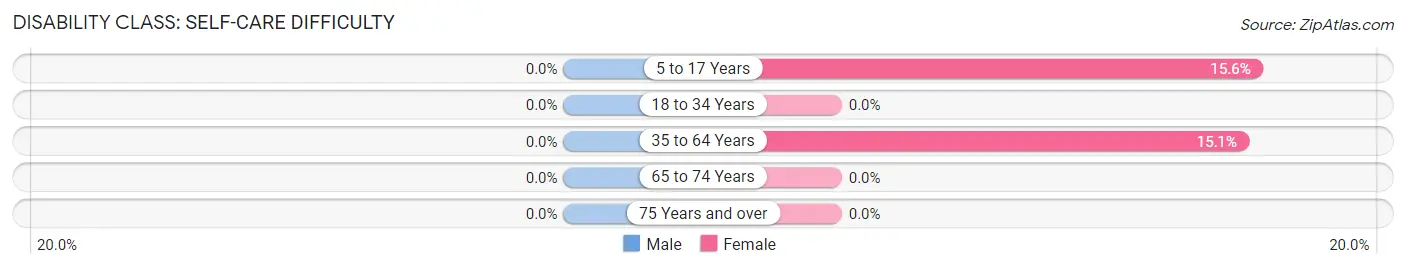
| Age Bracket | Male | Female |
| 5 to 17 Years | 0 (0.0%) | 15 (15.6%) |
| 18 to 34 Years | 0 (0.0%) | 0 (0.0%) |
| 35 to 64 Years | 0 (0.0%) | 42 (15.1%) |
| 65 to 74 Years | 0 (0.0%) | 0 (0.0%) |
| 75 Years and over | 0 (0.0%) | 0 (0.0%) |
Technology Access in Whitewater
Computing Device Access in Whitewater
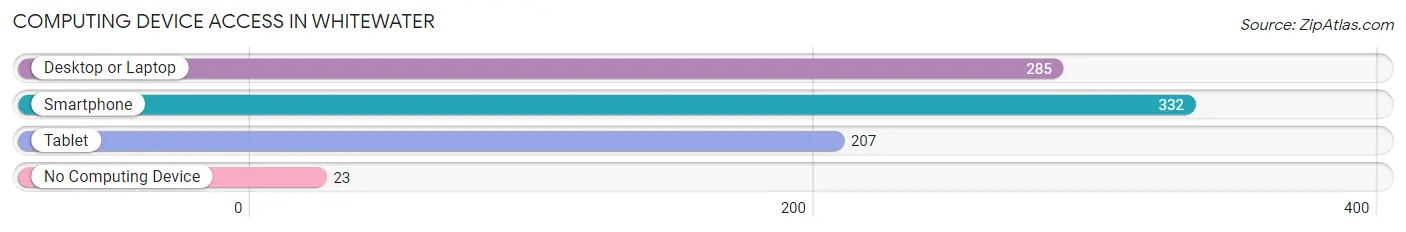
| Device Type | # Households | % Households |
| Desktop or Laptop | 285 | 80.3% |
| Smartphone | 332 | 93.5% |
| Tablet | 207 | 58.3% |
| No Computing Device | 23 | 6.5% |
| Total | 355 | 100.0% |
Internet Access in Whitewater
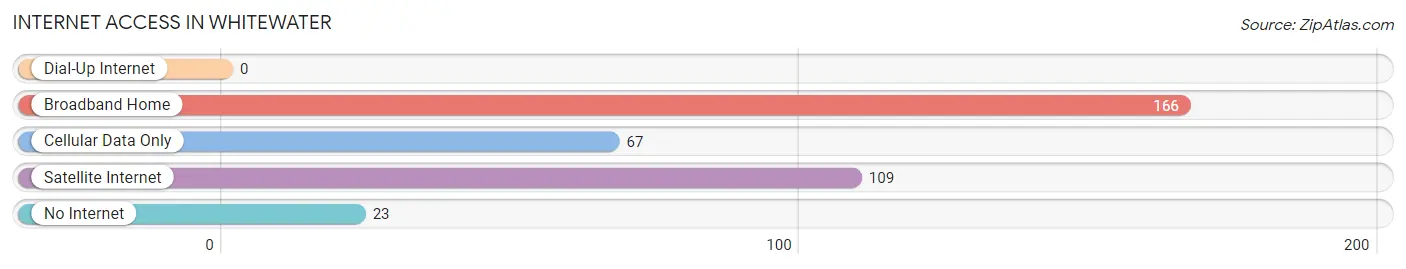
| Internet Type | # Households | % Households |
| Dial-Up Internet | 0 | 0.0% |
| Broadband Home | 166 | 46.8% |
| Cellular Data Only | 67 | 18.9% |
| Satellite Internet | 109 | 30.7% |
| No Internet | 23 | 6.5% |
| Total | 355 | 100.0% |
Whitewater Summary
Whitewater is a small unincorporated community located in Riverside County, California. It is situated in the Coachella Valley, approximately 11 miles east of Palm Springs. The population of Whitewater was estimated to be 1,845 in 2019.
History
The area now known as Whitewater was originally inhabited by the Cahuilla Indians. The first non-native settlers arrived in the area in the late 19th century. The area was originally known as “White Water” due to the presence of a natural spring in the area. The spring was used by the Cahuilla Indians for centuries before the arrival of the settlers.
In the early 20th century, the area was developed as an agricultural community. The first post office was established in Whitewater in 1915. The area was also home to a number of small businesses, including a general store, a gas station, and a hotel.
In the 1950s, the area began to experience a population boom as people moved to the area to take advantage of the warm climate and the nearby recreational opportunities. The population of Whitewater continued to grow throughout the 1960s and 1970s.
Geography
Whitewater is located in the Coachella Valley, approximately 11 miles east of Palm Springs. The area is surrounded by the San Bernardino National Forest to the north and the San Jacinto Mountains to the south. The area is characterized by its desert climate, with hot summers and mild winters.
The terrain of Whitewater is mostly flat, with some rolling hills. The area is home to a variety of wildlife, including coyotes, bobcats, and mountain lions.
Economy
The economy of Whitewater is largely based on tourism and agriculture. The area is home to a number of resorts and golf courses, which attract visitors from around the world. The area is also home to a number of farms, which produce a variety of crops, including dates, citrus fruits, and vegetables.
Demographics
The population of Whitewater was estimated to be 1,845 in 2019. The racial makeup of the area is predominantly white (77.3%), followed by Hispanic or Latino (14.2%), and African American (3.2%). The median household income in Whitewater is $45,945, which is slightly lower than the national average.
Conclusion
Whitewater is a small unincorporated community located in Riverside County, California. It is situated in the Coachella Valley, approximately 11 miles east of Palm Springs. The area is characterized by its desert climate, with hot summers and mild winters. The economy of Whitewater is largely based on tourism and agriculture, and the population of the area was estimated to be 1,845 in 2019. The racial makeup of the area is predominantly white, followed by Hispanic or Latino, and African American.
Common Questions
What is Per Capita Income in Whitewater?
Per Capita income in Whitewater is $22,707.
What is the Median Family Income in Whitewater?
Median Family Income in Whitewater is $81,125.
What is the Median Household income in Whitewater?
Median Household Income in Whitewater is $74,602.
What is Income or Wage Gap in Whitewater?
Income or Wage Gap in Whitewater is 20.3%.
Women in Whitewater earn 79.7 cents for every dollar earned by a man.
What is Family Income Deficit in Whitewater?
Family Income Deficit in Whitewater is $11,339.
Families that are below poverty line in Whitewater earn $11,339 less on average than the poverty threshold level.
What is Inequality or Gini Index in Whitewater?
Inequality or Gini Index in Whitewater is 0.33.
What is the Total Population of Whitewater?
Total Population of Whitewater is 1,194.
What is the Total Male Population of Whitewater?
Total Male Population of Whitewater is 635.
What is the Total Female Population of Whitewater?
Total Female Population of Whitewater is 559.
What is the Ratio of Males per 100 Females in Whitewater?
There are 113.60 Males per 100 Females in Whitewater.
What is the Ratio of Females per 100 Males in Whitewater?
There are 88.03 Females per 100 Males in Whitewater.
What is the Median Population Age in Whitewater?
Median Population Age in Whitewater is 39.1 Years.
What is the Average Family Size in Whitewater
Average Family Size in Whitewater is 3.8 People.
What is the Average Household Size in Whitewater
Average Household Size in Whitewater is 3.3 People.
How Large is the Labor Force in Whitewater?
There are 597 People in the Labor Forcein in Whitewater.
What is the Percentage of People in the Labor Force in Whitewater?
62.2% of People are in the Labor Force in Whitewater.
What is the Unemployment Rate in Whitewater?
Unemployment Rate in Whitewater is 9.9%.