Zip Codes with the Highest Percentage of Population with a Degree in Visual and Performing Arts in Garden Grove, CA
RELATED REPORTS & OPTIONS
Visual and Performing Arts
Garden Grove
Compare Zip Codes
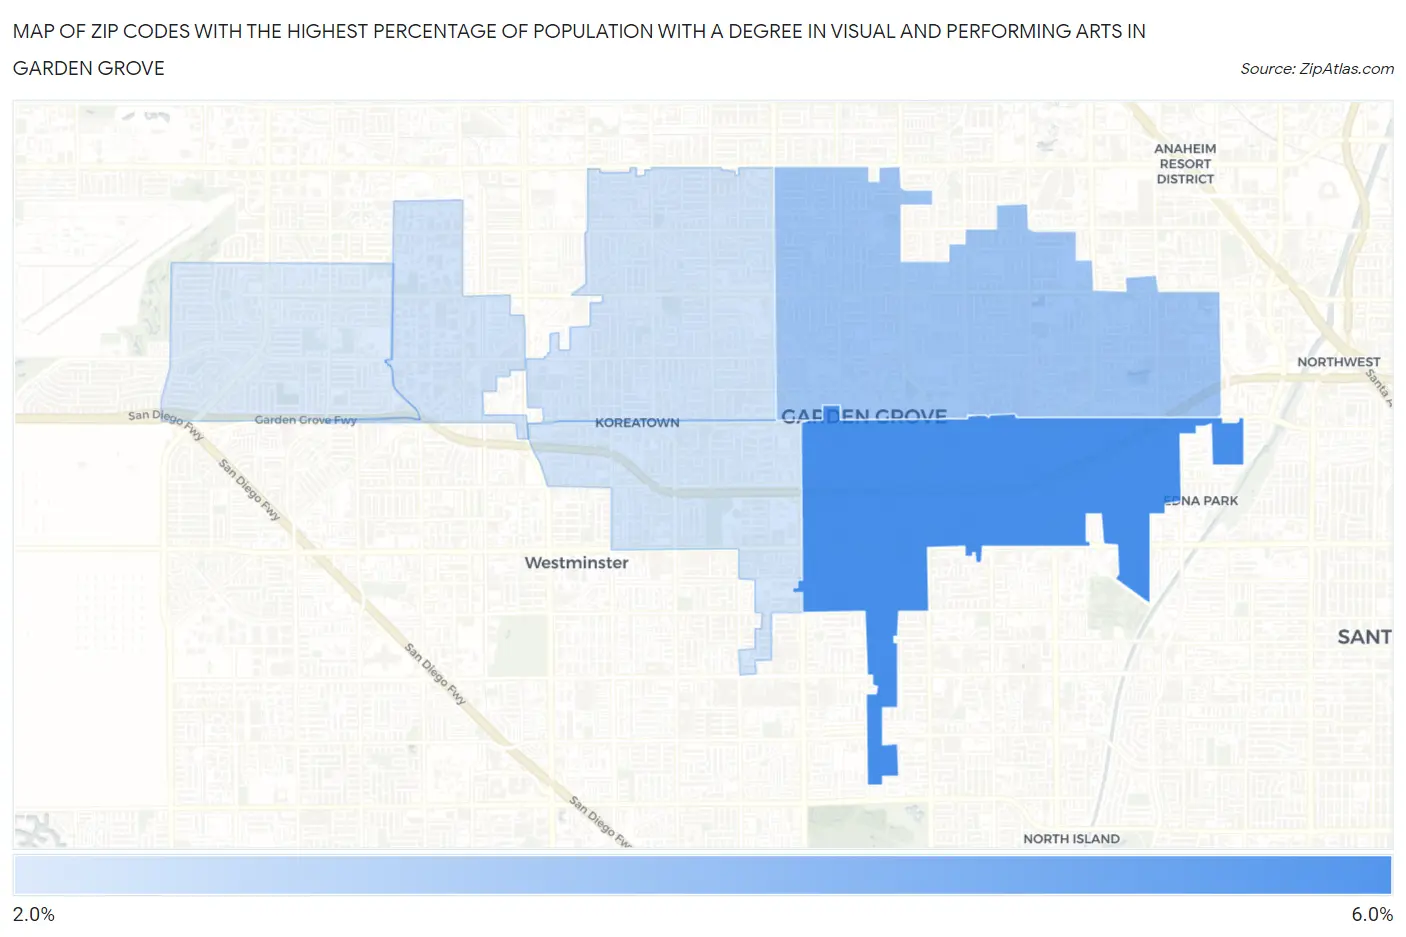
Map of Zip Codes with the Highest Percentage of Population with a Degree in Visual and Performing Arts in Garden Grove
2.9%
5.4%
Zip Codes with the Highest Percentage of Population with a Degree in Visual and Performing Arts in Garden Grove, CA
| Zip Code | % Graduates | vs State | vs National | |
| 1. | 92843 | 5.4% | 5.7%(-0.320)#593 | 4.3%(+1.17)#5,816 |
| 2. | 92840 | 3.9% | 5.7%(-1.81)#900 | 4.3%(-0.323)#9,478 |
| 3. | 92841 | 3.1% | 5.7%(-2.65)#1,075 | 4.3%(-1.16)#12,361 |
| 4. | 92844 | 3.1% | 5.7%(-2.68)#1,085 | 4.3%(-1.20)#12,521 |
| 5. | 92845 | 2.9% | 5.7%(-2.85)#1,119 | 4.3%(-1.36)#13,147 |
1
Common Questions
What are the Top 3 Zip Codes with the Highest Percentage of Population with a Degree in Visual and Performing Arts in Garden Grove, CA?
Top 3 Zip Codes with the Highest Percentage of Population with a Degree in Visual and Performing Arts in Garden Grove, CA are:
What zip code has the Highest Percentage of Population with a Degree in Visual and Performing Arts in Garden Grove, CA?
92843 has the Highest Percentage of Population with a Degree in Visual and Performing Arts in Garden Grove, CA with 5.4%.
What is the Percentage of Population with a Degree in Visual and Performing Arts in Garden Grove, CA?
Percentage of Population with a Degree in Visual and Performing Arts in Garden Grove is 3.8%.
What is the Percentage of Population with a Degree in Visual and Performing Arts in California?
Percentage of Population with a Degree in Visual and Performing Arts in California is 5.7%.
What is the Percentage of Population with a Degree in Visual and Performing Arts in the United States?
Percentage of Population with a Degree in Visual and Performing Arts in the United States is 4.3%.