Tuolumne City, CA Map & Demographics
Tuolumne City Map
Tuolumne City Overview
$27,519
PER CAPITA INCOME
$82,292
AVG FAMILY INCOME
$56,429
AVG HOUSEHOLD INCOME
0.35
INEQUALITY / GINI INDEX
1,297
TOTAL POPULATION
572
MALE POPULATION
725
FEMALE POPULATION
78.90
MALES / 100 FEMALES
126.75
FEMALES / 100 MALES
45.2
MEDIAN AGE
3.9
AVG FAMILY SIZE
2.3
AVG HOUSEHOLD SIZE
492
LABOR FORCE [ PEOPLE ]
48.2%
PERCENT IN LABOR FORCE
Income in Tuolumne City
Income Overview in Tuolumne City
Per Capita Income in Tuolumne City is $27,519, while median incomes of families and households are $82,292 and $56,429 respectively.
| Characteristic | Number | Measure |
| Per Capita Income | 1,297 | $27,519 |
| Median Family Income | 240 | $82,292 |
| Mean Family Income | 240 | $89,631 |
| Median Household Income | 564 | $56,429 |
| Mean Household Income | 564 | $62,587 |
| Income Deficit | 240 | $0 |
| Wage / Income Gap (%) | 1,297 | 0.00% |
| Wage / Income Gap ($) | 1,297 | 100.00¢ per $1 |
| Gini / Inequality Index | 1,297 | 0.35 |
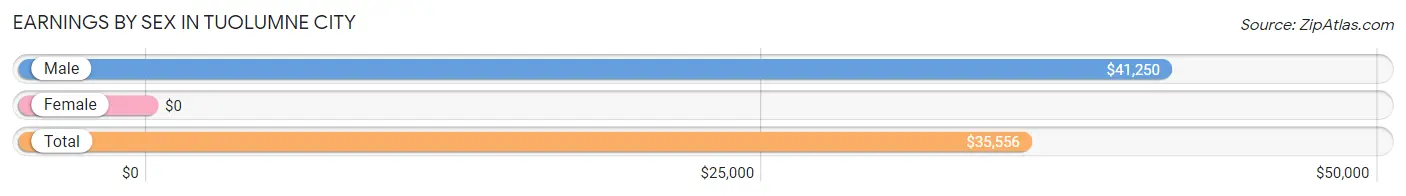
Earnings by Sex in Tuolumne City
| Sex | Number | Average Earnings |
| Male | 194 (35.5%) | $41,250 |
| Female | 352 (64.5%) | $0 |
| Total | 546 (100.0%) | $35,556 |
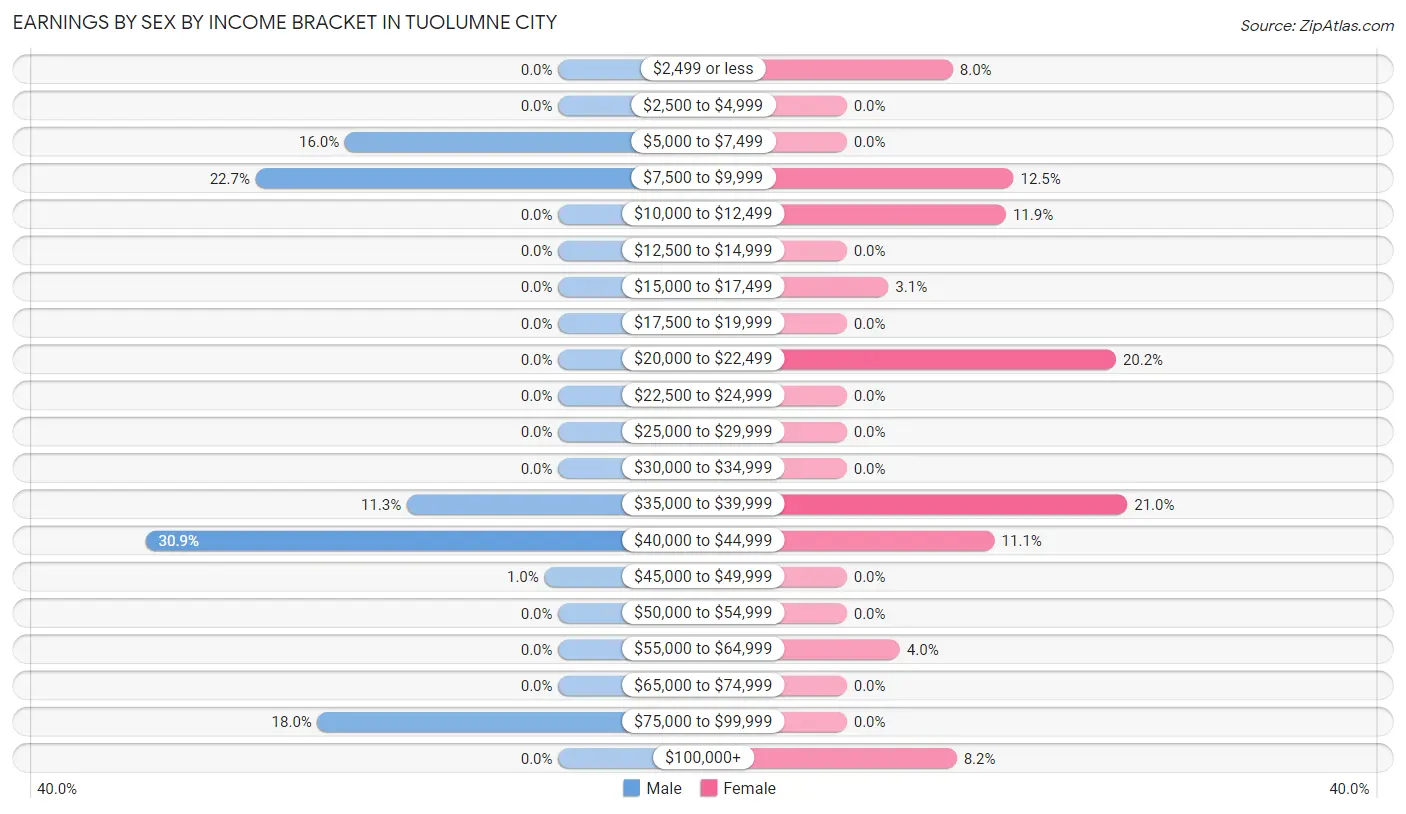
Earnings by Sex by Income Bracket in Tuolumne City
The most common earnings brackets in Tuolumne City are $40,000 to $44,999 for men (60 | 30.9%) and $35,000 to $39,999 for women (74 | 21.0%).
| Income | Male | Female |
| $2,499 or less | 0 (0.0%) | 28 (8.0%) |
| $2,500 to $4,999 | 0 (0.0%) | 0 (0.0%) |
| $5,000 to $7,499 | 31 (16.0%) | 0 (0.0%) |
| $7,500 to $9,999 | 44 (22.7%) | 44 (12.5%) |
| $10,000 to $12,499 | 0 (0.0%) | 42 (11.9%) |
| $12,500 to $14,999 | 0 (0.0%) | 0 (0.0%) |
| $15,000 to $17,499 | 0 (0.0%) | 11 (3.1%) |
| $17,500 to $19,999 | 0 (0.0%) | 0 (0.0%) |
| $20,000 to $22,499 | 0 (0.0%) | 71 (20.2%) |
| $22,500 to $24,999 | 0 (0.0%) | 0 (0.0%) |
| $25,000 to $29,999 | 0 (0.0%) | 0 (0.0%) |
| $30,000 to $34,999 | 0 (0.0%) | 0 (0.0%) |
| $35,000 to $39,999 | 22 (11.3%) | 74 (21.0%) |
| $40,000 to $44,999 | 60 (30.9%) | 39 (11.1%) |
| $45,000 to $49,999 | 2 (1.0%) | 0 (0.0%) |
| $50,000 to $54,999 | 0 (0.0%) | 0 (0.0%) |
| $55,000 to $64,999 | 0 (0.0%) | 14 (4.0%) |
| $65,000 to $74,999 | 0 (0.0%) | 0 (0.0%) |
| $75,000 to $99,999 | 35 (18.0%) | 0 (0.0%) |
| $100,000+ | 0 (0.0%) | 29 (8.2%) |
| Total | 194 (100.0%) | 352 (100.0%) |
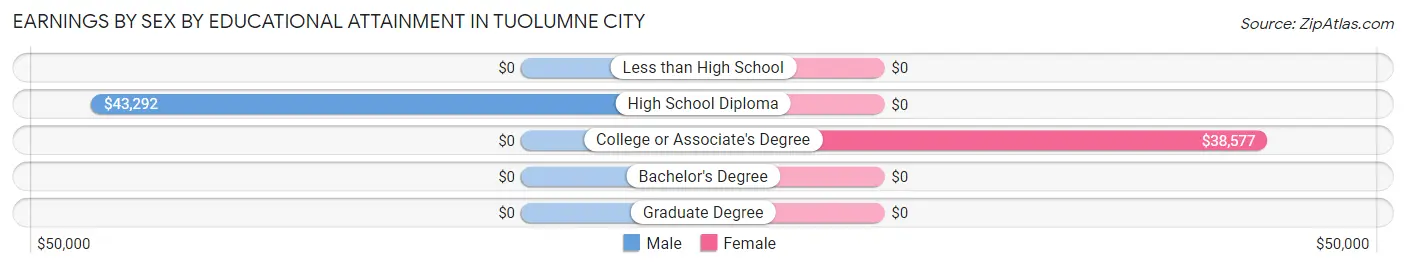
Earnings by Sex by Educational Attainment in Tuolumne City
Average earnings in Tuolumne City are $43,146 for men and $38,885 for women, a difference of 9.9%. Men with an educational attainment of high school diploma enjoy the highest average annual earnings of $43,292, while those with high school diploma education earn the least with $43,292. Women with an educational attainment of college or associate's degree earn the most with the average annual earnings of $38,577, while those with college or associate's degree education have the smallest earnings of $38,577.
| Educational Attainment | Male Income | Female Income |
| Less than High School | - | - |
| High School Diploma | $43,292 | $0 |
| College or Associate's Degree | - | - |
| Bachelor's Degree | - | - |
| Graduate Degree | - | - |
| Total | $43,146 | $38,885 |
Family Income in Tuolumne City
Family Income Brackets in Tuolumne City
According to the Tuolumne City family income data, there are 75 families falling into the $100,000 to $149,999 income range, which is the most common income bracket and makes up 31.2% of all families.
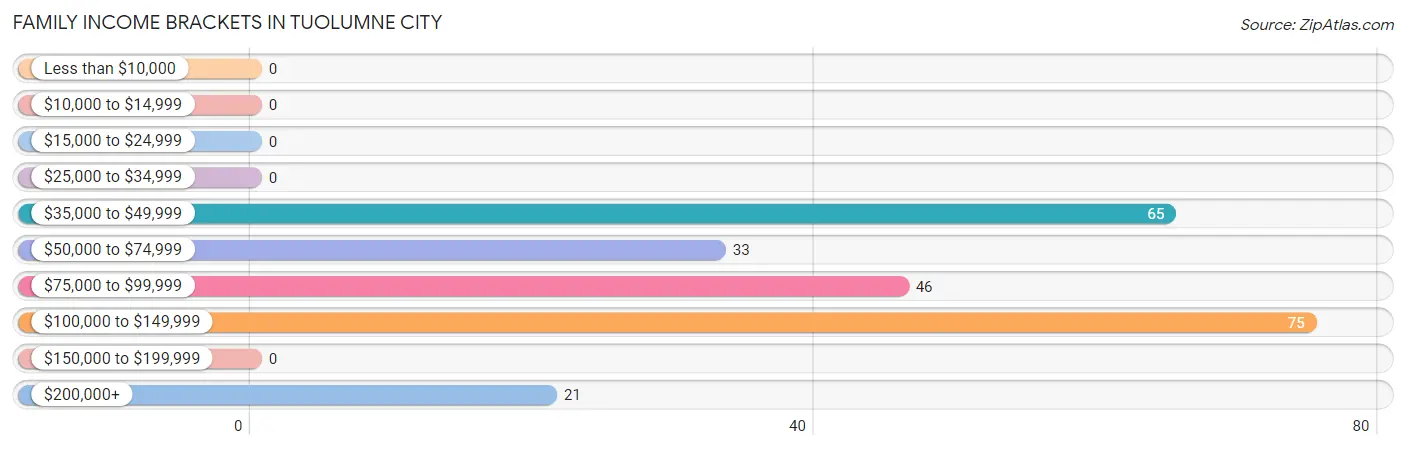
| Income Bracket | # Families | % Families |
| Less than $10,000 | 0 | 0.0% |
| $10,000 to $14,999 | 0 | 0.0% |
| $15,000 to $24,999 | 0 | 0.0% |
| $25,000 to $34,999 | 0 | 0.0% |
| $35,000 to $49,999 | 65 | 27.1% |
| $50,000 to $74,999 | 33 | 13.8% |
| $75,000 to $99,999 | 46 | 19.2% |
| $100,000 to $149,999 | 75 | 31.3% |
| $150,000 to $199,999 | 0 | 0.0% |
| $200,000+ | 21 | 8.8% |
Family Income by Famaliy Size in Tuolumne City
4-person families (74 | 30.8%) account for the highest median family income in Tuolumne City with $106,210 per family, while 4-person families (74 | 30.8%) have the highest median income of $26,552 per family member.
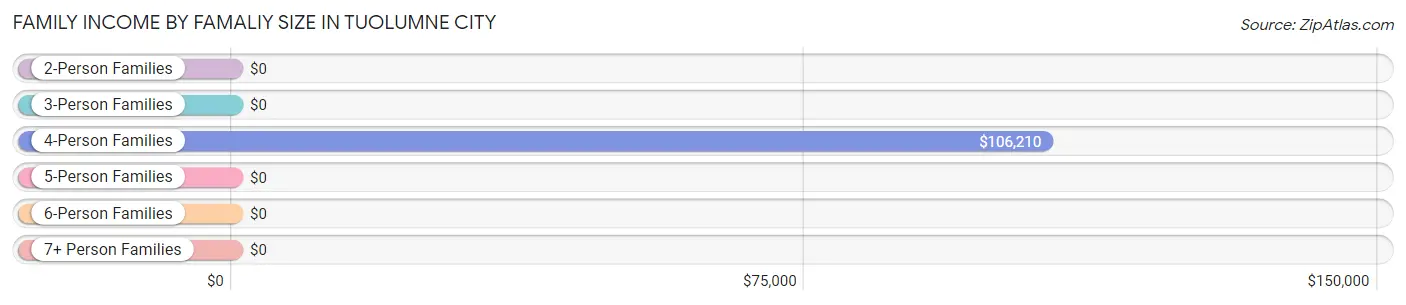
| Income Bracket | # Families | Median Income |
| 2-Person Families | 39 (16.3%) | $0 |
| 3-Person Families | 33 (13.8%) | $0 |
| 4-Person Families | 74 (30.8%) | $106,210 |
| 5-Person Families | 94 (39.2%) | $0 |
| 6-Person Families | 0 (0.0%) | $0 |
| 7+ Person Families | 0 (0.0%) | $0 |
| Total | 240 (100.0%) | $82,292 |
Family Income by Number of Earners in Tuolumne City
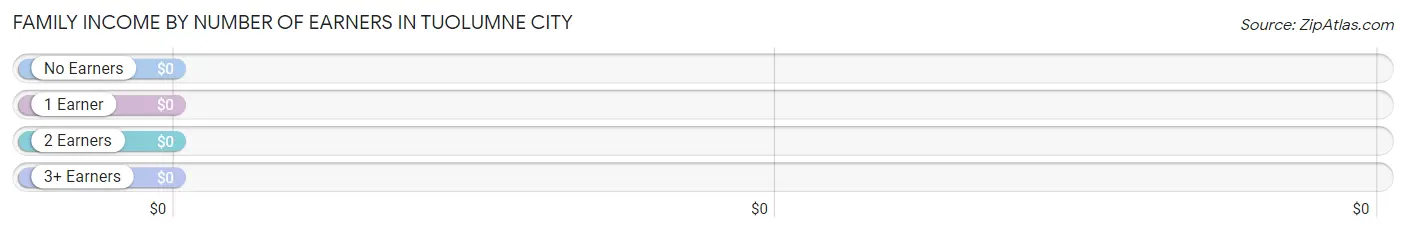
| Number of Earners | # Families | Median Income |
| No Earners | 0 (0.0%) | $0 |
| 1 Earner | 131 (54.6%) | $0 |
| 2 Earners | 41 (17.1%) | $0 |
| 3+ Earners | 68 (28.3%) | $0 |
| Total | 240 (100.0%) | $82,292 |
Household Income in Tuolumne City
Household Income Brackets in Tuolumne City
With 156 households falling in the category, the $50,000 to $74,999 income range is the most frequent in Tuolumne City, accounting for 27.7% of all households.
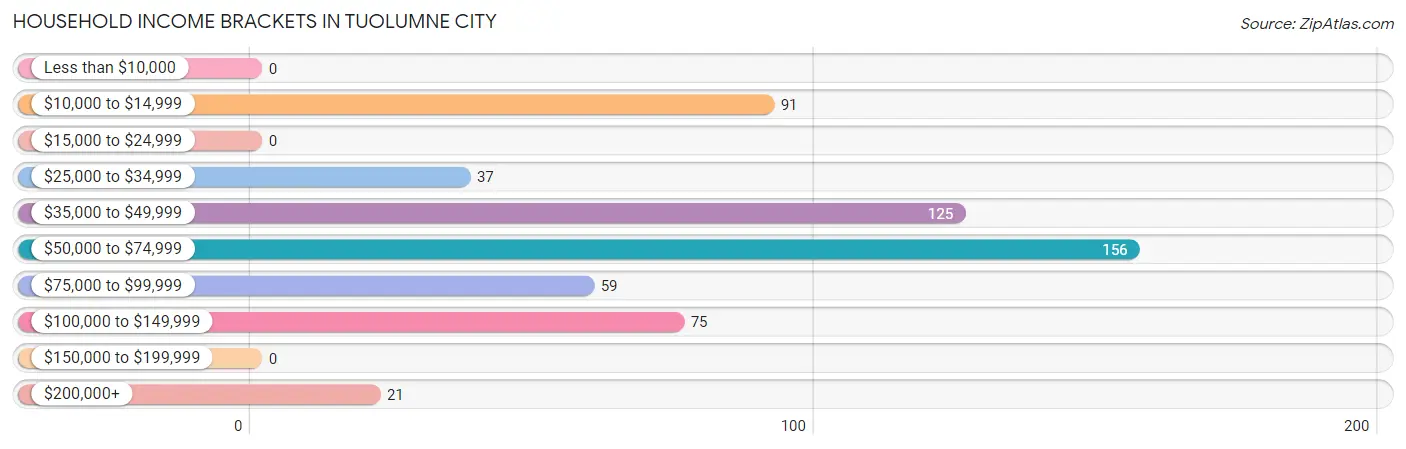
| Income Bracket | # Households | % Households |
| Less than $10,000 | 0 | 0.0% |
| $10,000 to $14,999 | 91 | 16.1% |
| $15,000 to $24,999 | 0 | 0.0% |
| $25,000 to $34,999 | 37 | 6.6% |
| $35,000 to $49,999 | 125 | 22.2% |
| $50,000 to $74,999 | 156 | 27.7% |
| $75,000 to $99,999 | 59 | 10.5% |
| $100,000 to $149,999 | 75 | 13.3% |
| $150,000 to $199,999 | 0 | 0.0% |
| $200,000+ | 21 | 3.7% |
Household Income by Householder Age in Tuolumne City
The median household income in Tuolumne City is $56,429, with the highest median household income of $80,885 found in the 45 to 64 years age bracket for the primary householder. A total of 223 households (39.5%) fall into this category. Meanwhile, the 15 to 24 years age bracket for the primary householder has the lowest median household income of $0, with 11 households (1.9%) in this group.
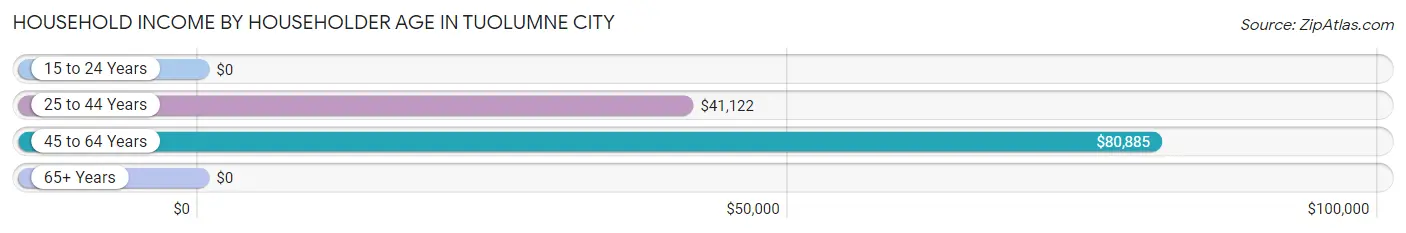
| Income Bracket | # Households | Median Income |
| 15 to 24 Years | 11 (1.9%) | $0 |
| 25 to 44 Years | 87 (15.4%) | $41,122 |
| 45 to 64 Years | 223 (39.5%) | $80,885 |
| 65+ Years | 243 (43.1%) | $0 |
| Total | 564 (100.0%) | $56,429 |
Poverty in Tuolumne City
Income Below Poverty by Sex and Age in Tuolumne City
With 0.7% poverty level for males and 2.3% for females among the residents of Tuolumne City, 18 to 24 year old males and 55 to 64 year old females are the most vulnerable to poverty, with 4 males (11.4%) and 17 females (44.7%) in their respective age groups living below the poverty level.
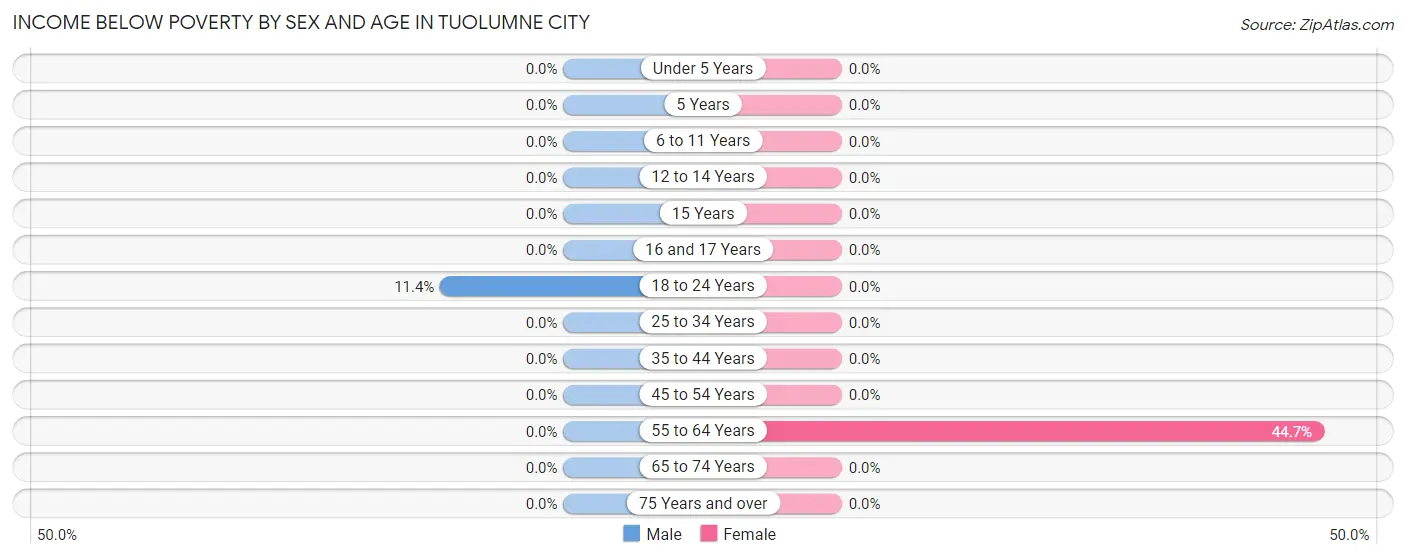
| Age Bracket | Male | Female |
| Under 5 Years | 0 (0.0%) | 0 (0.0%) |
| 5 Years | 0 (0.0%) | 0 (0.0%) |
| 6 to 11 Years | 0 (0.0%) | 0 (0.0%) |
| 12 to 14 Years | 0 (0.0%) | 0 (0.0%) |
| 15 Years | 0 (0.0%) | 0 (0.0%) |
| 16 and 17 Years | 0 (0.0%) | 0 (0.0%) |
| 18 to 24 Years | 4 (11.4%) | 0 (0.0%) |
| 25 to 34 Years | 0 (0.0%) | 0 (0.0%) |
| 35 to 44 Years | 0 (0.0%) | 0 (0.0%) |
| 45 to 54 Years | 0 (0.0%) | 0 (0.0%) |
| 55 to 64 Years | 0 (0.0%) | 17 (44.7%) |
| 65 to 74 Years | 0 (0.0%) | 0 (0.0%) |
| 75 Years and over | 0 (0.0%) | 0 (0.0%) |
| Total | 4 (0.7%) | 17 (2.3%) |
Income Above Poverty by Sex and Age in Tuolumne City
According to the poverty statistics in Tuolumne City, males aged under 5 years and females aged under 5 years are the age groups that are most secure financially, with 100.0% of males and 100.0% of females in these age groups living above the poverty line.
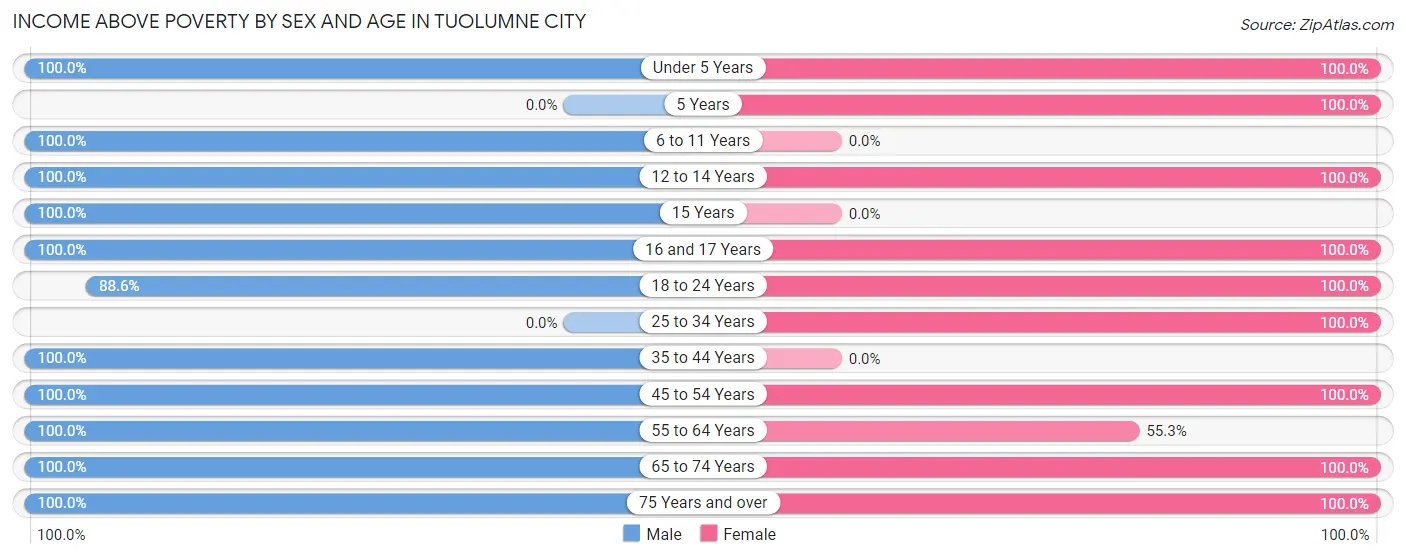
| Age Bracket | Male | Female |
| Under 5 Years | 32 (100.0%) | 23 (100.0%) |
| 5 Years | 0 (0.0%) | 28 (100.0%) |
| 6 to 11 Years | 23 (100.0%) | 0 (0.0%) |
| 12 to 14 Years | 87 (100.0%) | 26 (100.0%) |
| 15 Years | 58 (100.0%) | 0 (0.0%) |
| 16 and 17 Years | 13 (100.0%) | 80 (100.0%) |
| 18 to 24 Years | 31 (88.6%) | 50 (100.0%) |
| 25 to 34 Years | 0 (0.0%) | 126 (100.0%) |
| 35 to 44 Years | 61 (100.0%) | 0 (0.0%) |
| 45 to 54 Years | 141 (100.0%) | 142 (100.0%) |
| 55 to 64 Years | 88 (100.0%) | 21 (55.3%) |
| 65 to 74 Years | 24 (100.0%) | 19 (100.0%) |
| 75 Years and over | 10 (100.0%) | 193 (100.0%) |
| Total | 568 (99.3%) | 708 (97.7%) |
Income Below Poverty Among Married-Couple Families in Tuolumne City
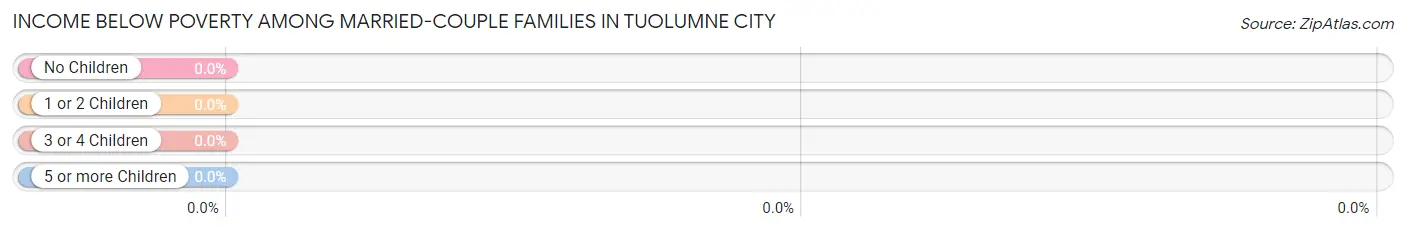
| Children | Above Poverty | Below Poverty |
| No Children | 40 (100.0%) | 0 (0.0%) |
| 1 or 2 Children | 97 (100.0%) | 0 (0.0%) |
| 3 or 4 Children | 50 (100.0%) | 0 (0.0%) |
| 5 or more Children | 0 (0.0%) | 0 (0.0%) |
| Total | 187 (100.0%) | 0 (0.0%) |
Income Below Poverty Among Single-Parent Households in Tuolumne City
| Children | Single Father | Single Mother |
| No Children | 0 (0.0%) | 0 (0.0%) |
| 1 or 2 Children | 0 (0.0%) | 0 (0.0%) |
| 3 or 4 Children | 0 (0.0%) | 0 (0.0%) |
| 5 or more Children | 0 (0.0%) | 0 (0.0%) |
| Total | 0 (0.0%) | 0 (0.0%) |
Income Below Poverty Among Married-Couple vs Single-Parent Households in Tuolumne City
| Children | Married-Couple Families | Single-Parent Households |
| No Children | 0 (0.0%) | 0 (0.0%) |
| 1 or 2 Children | 0 (0.0%) | 0 (0.0%) |
| 3 or 4 Children | 0 (0.0%) | 0 (0.0%) |
| 5 or more Children | 0 (0.0%) | 0 (0.0%) |
| Total | 0 (0.0%) | 0 (0.0%) |
Race in Tuolumne City
The most populous races in Tuolumne City are White / Caucasian (949 | 73.2%), Hispanic or Latino (410 | 31.6%), and Asian (110 | 8.5%).
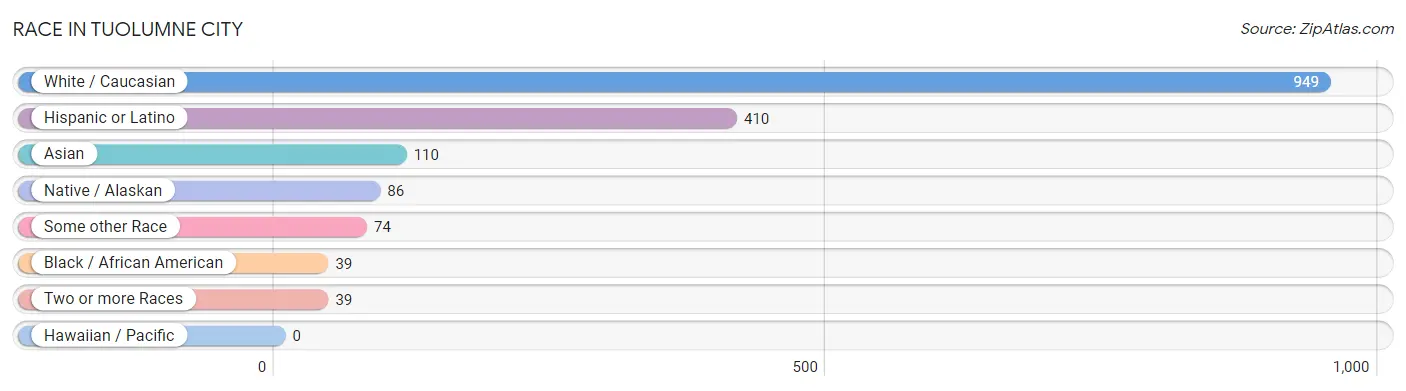
| Race | # Population | % Population |
| Asian | 110 | 8.5% |
| Black / African American | 39 | 3.0% |
| Hawaiian / Pacific | 0 | 0.0% |
| Hispanic or Latino | 410 | 31.6% |
| Native / Alaskan | 86 | 6.6% |
| White / Caucasian | 949 | 73.2% |
| Two or more Races | 39 | 3.0% |
| Some other Race | 74 | 5.7% |
| Total | 1,297 | 100.0% |
Ancestry in Tuolumne City
The most populous ancestries reported in Tuolumne City are Mexican (410 | 31.6%), Scottish (162 | 12.5%), German (160 | 12.3%), English (139 | 10.7%), and Korean (106 | 8.2%), together accounting for 75.3% of all Tuolumne City residents.
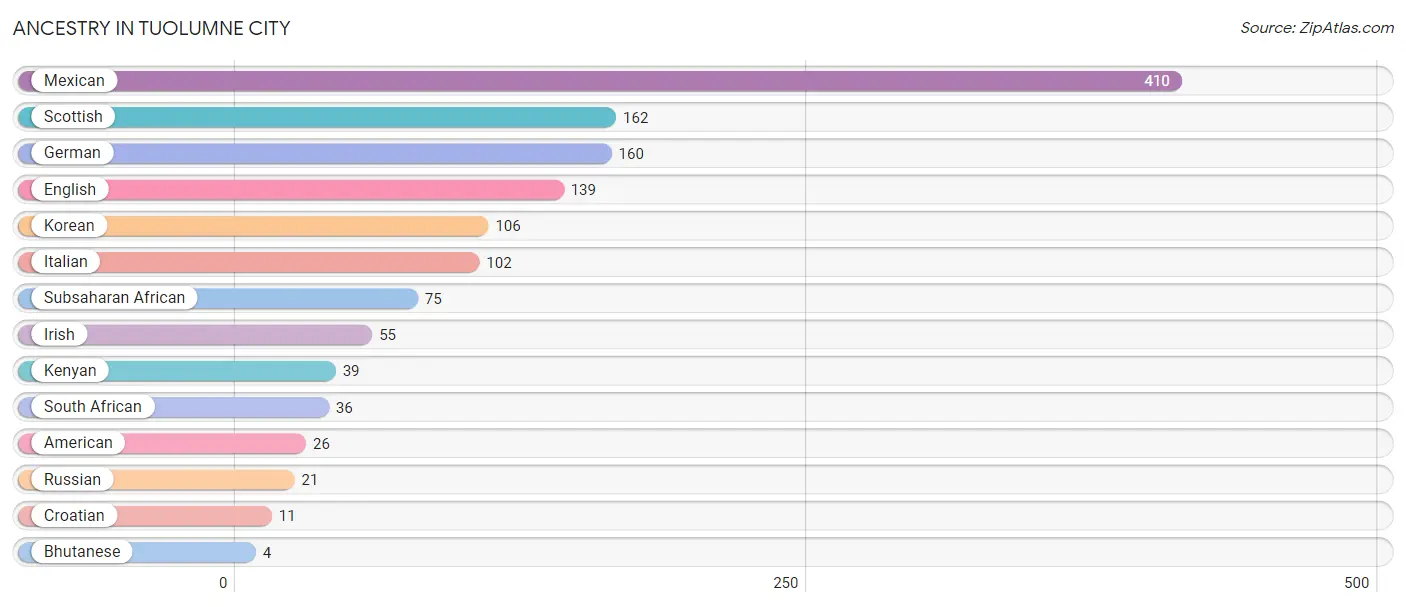
| Ancestry | # Population | % Population |
| American | 26 | 2.0% |
| Bhutanese | 4 | 0.3% |
| Croatian | 11 | 0.9% |
| English | 139 | 10.7% |
| German | 160 | 12.3% |
| Irish | 55 | 4.2% |
| Italian | 102 | 7.9% |
| Kenyan | 39 | 3.0% |
| Korean | 106 | 8.2% |
| Mexican | 410 | 31.6% |
| Russian | 21 | 1.6% |
| Scottish | 162 | 12.5% |
| South African | 36 | 2.8% |
| Subsaharan African | 75 | 5.8% | View All 14 Rows |
Immigrants in Tuolumne City
The most numerous immigrant groups reported in Tuolumne City came from Africa (53 | 4.1%), Eastern Africa (39 | 3.0%), Kenya (39 | 3.0%), South Africa (14 | 1.1%), and Asia (5 | 0.4%), together accounting for 11.6% of all Tuolumne City residents.
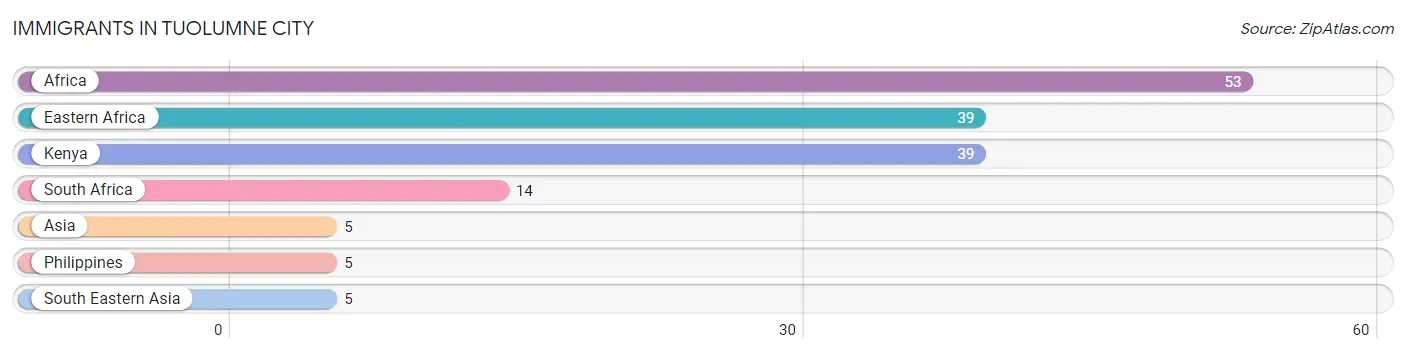
| Immigration Origin | # Population | % Population |
| Africa | 53 | 4.1% |
| Asia | 5 | 0.4% |
| Eastern Africa | 39 | 3.0% |
| Kenya | 39 | 3.0% |
| Philippines | 5 | 0.4% |
| South Africa | 14 | 1.1% |
| South Eastern Asia | 5 | 0.4% | View All 7 Rows |
Sex and Age in Tuolumne City
Sex and Age in Tuolumne City
The most populous age groups in Tuolumne City are 50 to 54 Years (93 | 16.3%) for men and 85 Years and over (193 | 26.6%) for women.
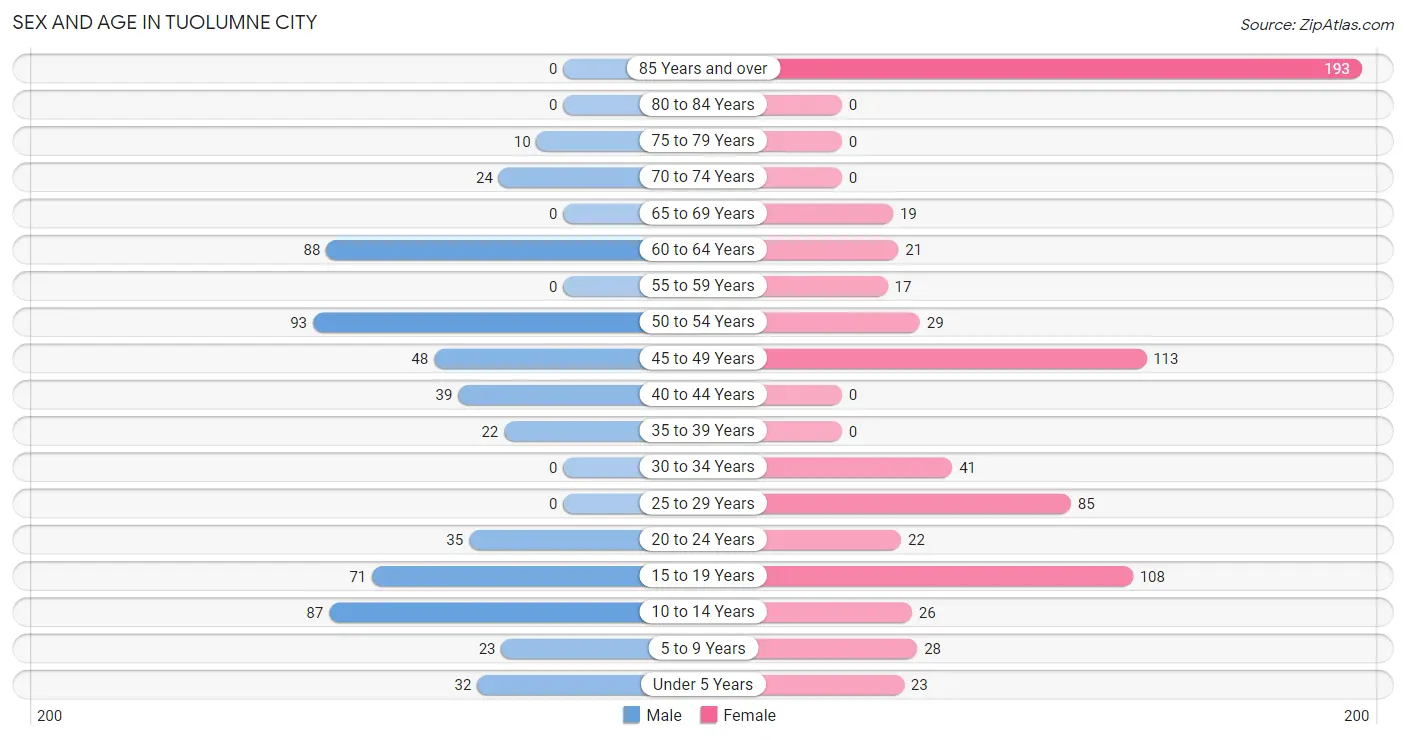
| Age Bracket | Male | Female |
| Under 5 Years | 32 (5.6%) | 23 (3.2%) |
| 5 to 9 Years | 23 (4.0%) | 28 (3.9%) |
| 10 to 14 Years | 87 (15.2%) | 26 (3.6%) |
| 15 to 19 Years | 71 (12.4%) | 108 (14.9%) |
| 20 to 24 Years | 35 (6.1%) | 22 (3.0%) |
| 25 to 29 Years | 0 (0.0%) | 85 (11.7%) |
| 30 to 34 Years | 0 (0.0%) | 41 (5.7%) |
| 35 to 39 Years | 22 (3.8%) | 0 (0.0%) |
| 40 to 44 Years | 39 (6.8%) | 0 (0.0%) |
| 45 to 49 Years | 48 (8.4%) | 113 (15.6%) |
| 50 to 54 Years | 93 (16.3%) | 29 (4.0%) |
| 55 to 59 Years | 0 (0.0%) | 17 (2.3%) |
| 60 to 64 Years | 88 (15.4%) | 21 (2.9%) |
| 65 to 69 Years | 0 (0.0%) | 19 (2.6%) |
| 70 to 74 Years | 24 (4.2%) | 0 (0.0%) |
| 75 to 79 Years | 10 (1.8%) | 0 (0.0%) |
| 80 to 84 Years | 0 (0.0%) | 0 (0.0%) |
| 85 Years and over | 0 (0.0%) | 193 (26.6%) |
| Total | 572 (100.0%) | 725 (100.0%) |
Families and Households in Tuolumne City
Median Family Size in Tuolumne City
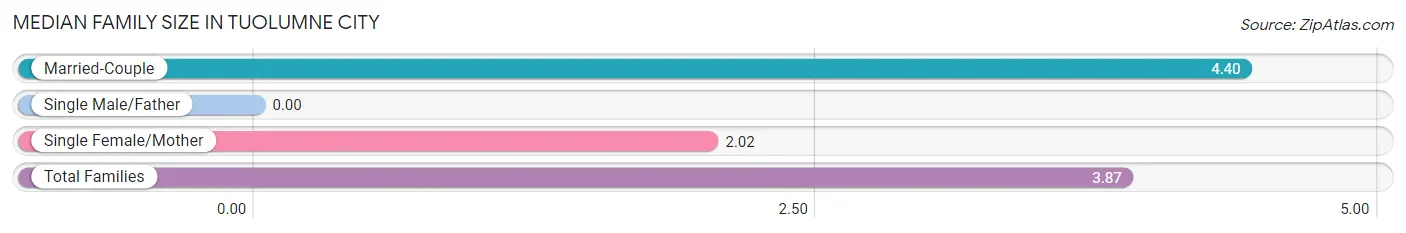
| Family Type | # Families | Family Size |
| Married-Couple | 187 (77.9%) | 4.40 |
| Single Male/Father | 0 (0.0%) | - |
| Single Female/Mother | 53 (22.1%) | 2.02 |
| Total Families | 240 (100.0%) | 3.87 |
Median Household Size in Tuolumne City
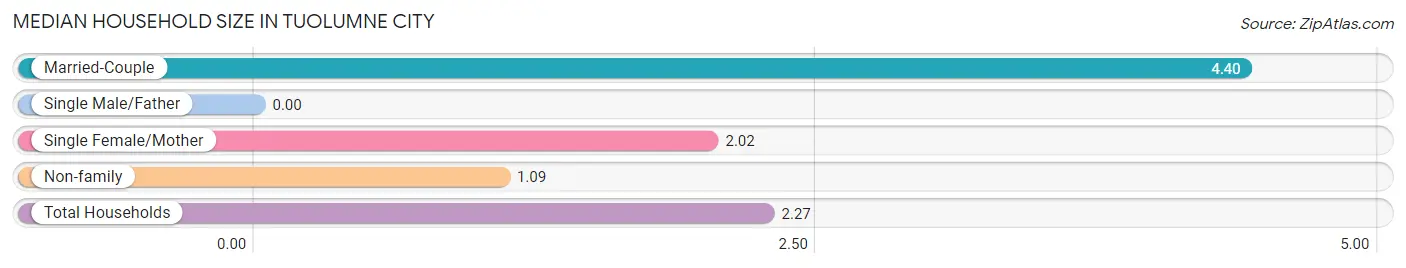
| Household Type | # Households | Household Size |
| Married-Couple | 187 (33.2%) | 4.40 |
| Single Male/Father | 0 (0.0%) | - |
| Single Female/Mother | 53 (9.4%) | 2.02 |
| Non-family | 324 (57.5%) | 1.09 |
| Total Households | 564 (100.0%) | 2.27 |
Household Size by Marriage Status in Tuolumne City
Out of a total of 564 households in Tuolumne City, 240 (42.5%) are family households, while 324 (57.5%) are nonfamily households. The most numerous type of family households are 5-person households, comprising 94, and the most common type of nonfamily households are 1-person households, comprising 300.
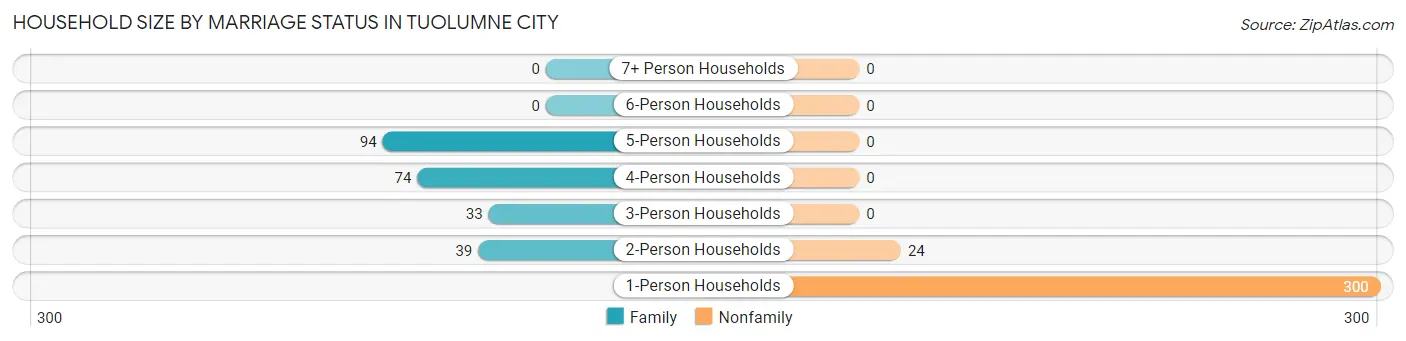
| Household Size | Family Households | Nonfamily Households |
| 1-Person Households | - | 300 (53.2%) |
| 2-Person Households | 39 (6.9%) | 24 (4.3%) |
| 3-Person Households | 33 (5.9%) | 0 (0.0%) |
| 4-Person Households | 74 (13.1%) | 0 (0.0%) |
| 5-Person Households | 94 (16.7%) | 0 (0.0%) |
| 6-Person Households | 0 (0.0%) | 0 (0.0%) |
| 7+ Person Households | 0 (0.0%) | 0 (0.0%) |
| Total | 240 (42.5%) | 324 (57.5%) |
Female Fertility in Tuolumne City
Fertility by Age in Tuolumne City
| Age Bracket | Women with Births | Births / 1,000 Women |
| 15 to 19 years | 0 (0.0%) | 0.0 |
| 20 to 34 years | 0 (0.0%) | 0.0 |
| 35 to 50 years | 0 (0.0%) | 0.0 |
| Total | 0 (0.0%) | 0.0 |
Fertility by Age by Marriage Status in Tuolumne City
| Age Bracket | Married | Unmarried |
| 15 to 19 years | 0 (0.0%) | 0 (0.0%) |
| 20 to 34 years | 0 (0.0%) | 0 (0.0%) |
| 35 to 50 years | 0 (0.0%) | 0 (0.0%) |
| Total | 0 (0.0%) | 0 (0.0%) |
Fertility by Education in Tuolumne City
| Educational Attainment | Women with Births | Births / 1,000 Women |
| Less than High School | 0 (0.0%) | 0.0 |
| High School Diploma | 0 (0.0%) | 0.0 |
| College or Associate's Degree | 0 (0.0%) | 0.0 |
| Bachelor's Degree | 0 (0.0%) | 0.0 |
| Graduate Degree | 0 (0.0%) | 0.0 |
| Total | 0 (0.0%) | 0.0 |
Fertility by Education by Marriage Status in Tuolumne City
| Educational Attainment | Married | Unmarried |
| Less than High School | 0 (0.0%) | 0 (0.0%) |
| High School Diploma | 0 (0.0%) | 0 (0.0%) |
| College or Associate's Degree | 0 (0.0%) | 0 (0.0%) |
| Bachelor's Degree | 0 (0.0%) | 0 (0.0%) |
| Graduate Degree | 0 (0.0%) | 0 (0.0%) |
| Total | 0 (0.0%) | 0 (0.0%) |
Employment Characteristics in Tuolumne City
Employment by Class of Employer in Tuolumne City
Among the 492 employed individuals in Tuolumne City, private company employees (360 | 73.2%), state government employees (44 | 8.9%), and unpaid family workers (37 | 7.5%) make up the most common classes of employment.
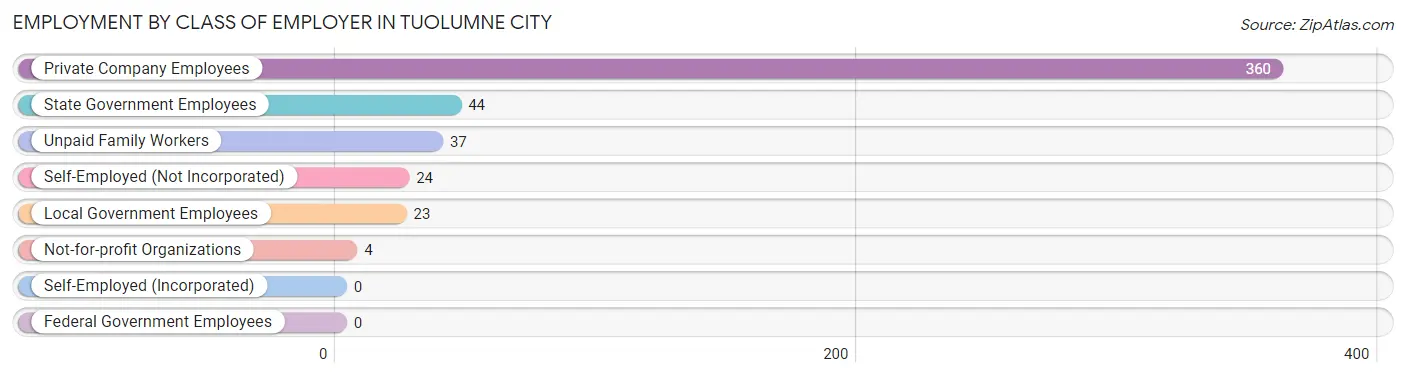
| Employer Class | # Employees | % Employees |
| Private Company Employees | 360 | 73.2% |
| Self-Employed (Incorporated) | 0 | 0.0% |
| Self-Employed (Not Incorporated) | 24 | 4.9% |
| Not-for-profit Organizations | 4 | 0.8% |
| Local Government Employees | 23 | 4.7% |
| State Government Employees | 44 | 8.9% |
| Federal Government Employees | 0 | 0.0% |
| Unpaid Family Workers | 37 | 7.5% |
| Total | 492 | 100.0% |
Employment Status by Age in Tuolumne City
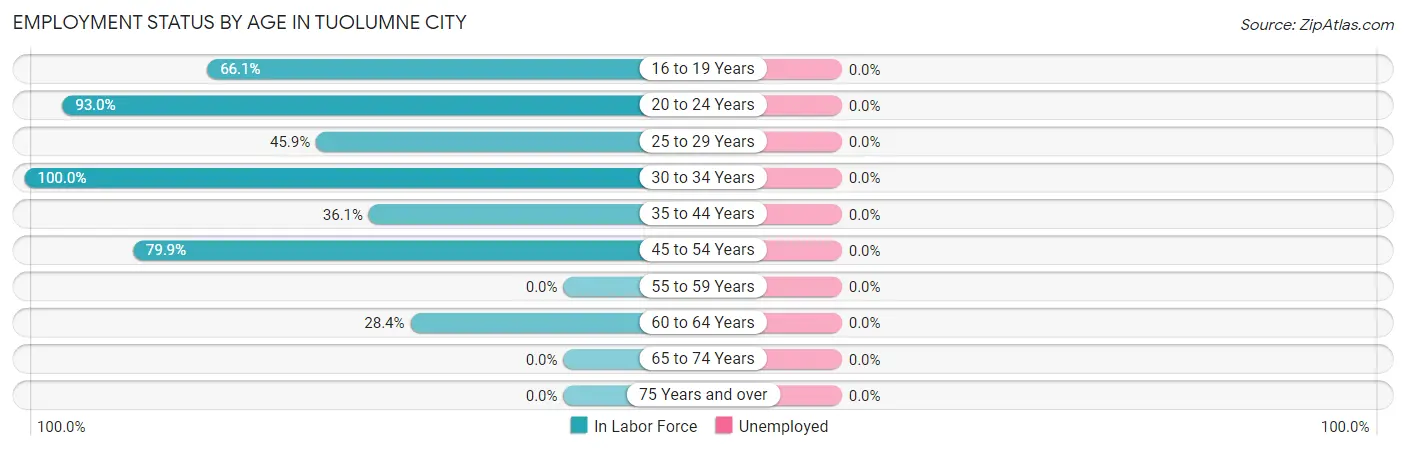
| Age Bracket | In Labor Force | Unemployed |
| 16 to 19 Years | 80 (66.1%) | 0 (0.0%) |
| 20 to 24 Years | 53 (93.0%) | 0 (0.0%) |
| 25 to 29 Years | 39 (45.9%) | 0 (0.0%) |
| 30 to 34 Years | 41 (100.0%) | 0 (0.0%) |
| 35 to 44 Years | 22 (36.1%) | 0 (0.0%) |
| 45 to 54 Years | 226 (79.9%) | 0 (0.0%) |
| 55 to 59 Years | 0 (0.0%) | 0 (0.0%) |
| 60 to 64 Years | 31 (28.4%) | 0 (0.0%) |
| 65 to 74 Years | 0 (0.0%) | 0 (0.0%) |
| 75 Years and over | 0 (0.0%) | 0 (0.0%) |
| Total | 492 (48.2%) | 0 (0.0%) |
Employment Status by Educational Attainment in Tuolumne City
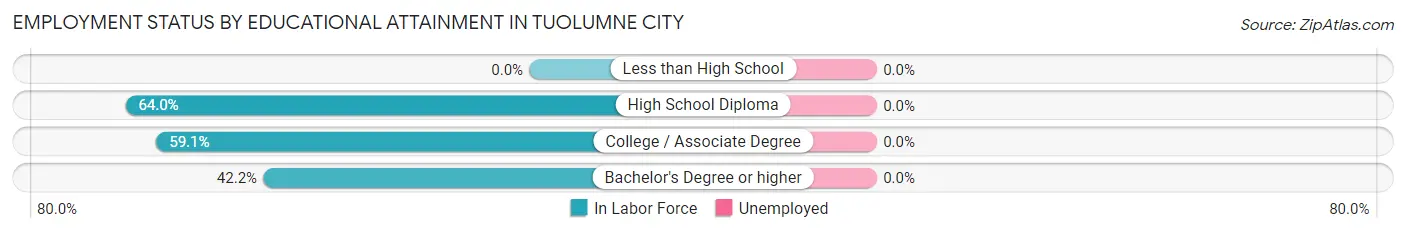
| Educational Attainment | In Labor Force | Unemployed |
| Less than High School | 0 (0.0%) | 0 (0.0%) |
| High School Diploma | 187 (64.0%) | 0 (0.0%) |
| College / Associate Degree | 153 (59.1%) | 0 (0.0%) |
| Bachelor's Degree or higher | 19 (42.2%) | 0 (0.0%) |
| Total | 359 (60.2%) | 0 (0.0%) |
Employment Occupations by Sex in Tuolumne City
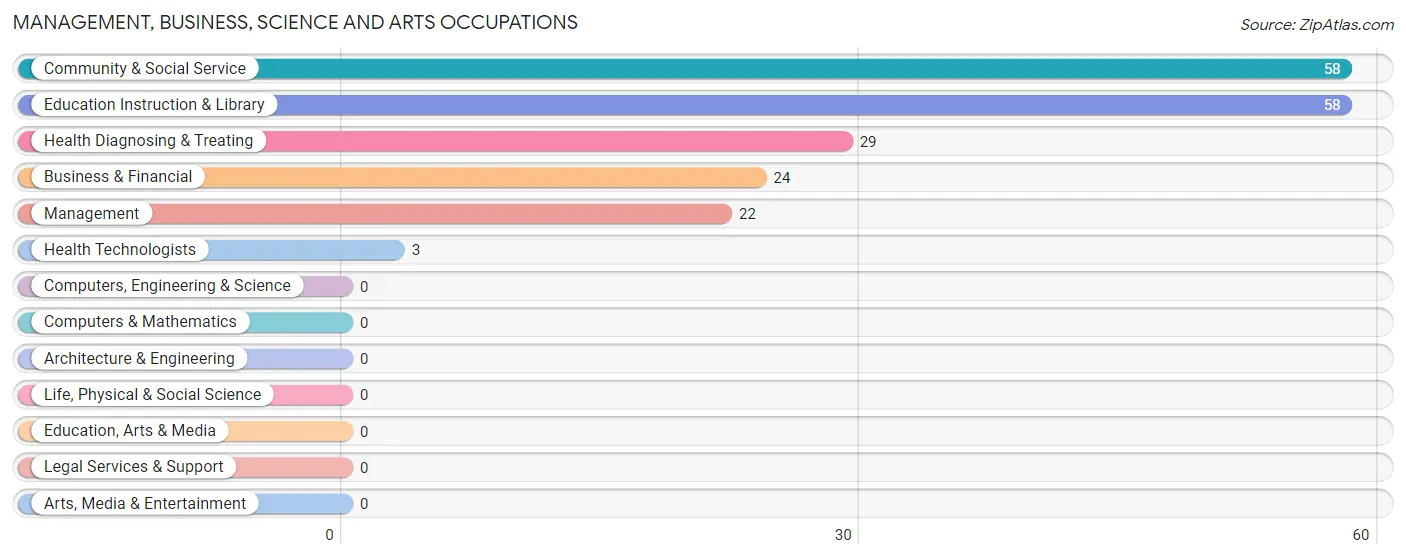
Management, Business, Science and Arts Occupations
The most common Management, Business, Science and Arts occupations in Tuolumne City are Community & Social Service (58 | 11.8%), Education Instruction & Library (58 | 11.8%), Health Diagnosing & Treating (29 | 5.9%), Business & Financial (24 | 4.9%), and Management (22 | 4.5%).
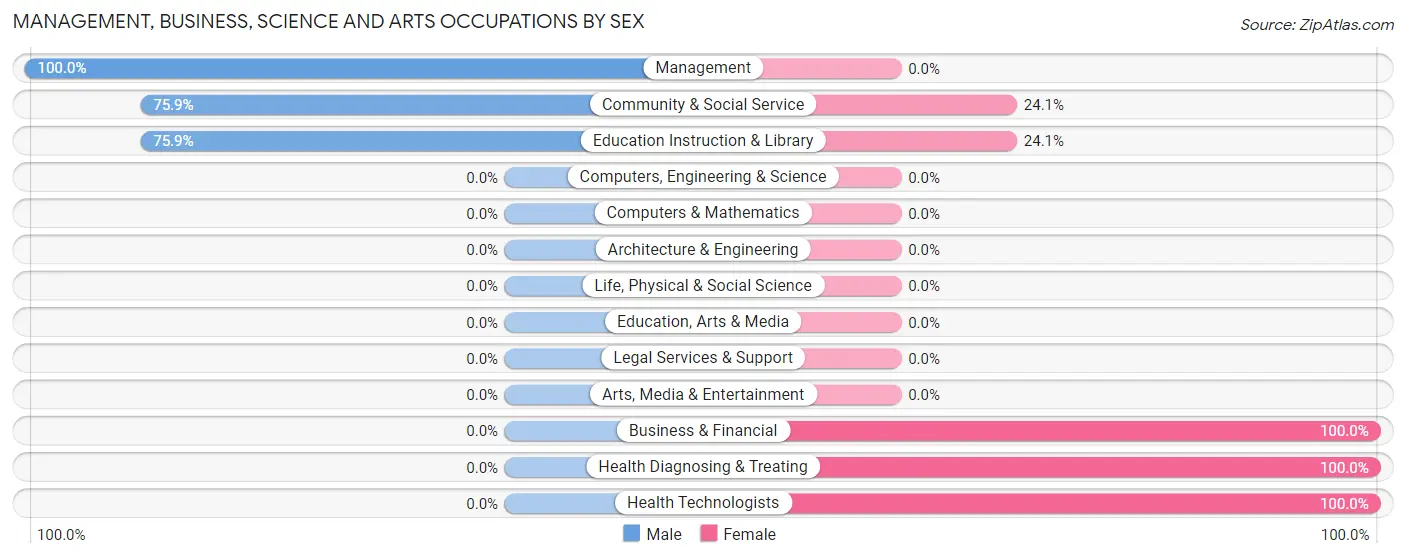
Management, Business, Science and Arts Occupations by Sex
Within the Management, Business, Science and Arts occupations in Tuolumne City, the most male-oriented occupations are Management (100.0%), Community & Social Service (75.9%), and Education Instruction & Library (75.9%), while the most female-oriented occupations are Business & Financial (100.0%), Health Diagnosing & Treating (100.0%), and Health Technologists (100.0%).
| Occupation | Male | Female |
| Management | 22 (100.0%) | 0 (0.0%) |
| Business & Financial | 0 (0.0%) | 24 (100.0%) |
| Computers, Engineering & Science | 0 (0.0%) | 0 (0.0%) |
| Computers & Mathematics | 0 (0.0%) | 0 (0.0%) |
| Architecture & Engineering | 0 (0.0%) | 0 (0.0%) |
| Life, Physical & Social Science | 0 (0.0%) | 0 (0.0%) |
| Community & Social Service | 44 (75.9%) | 14 (24.1%) |
| Education, Arts & Media | 0 (0.0%) | 0 (0.0%) |
| Legal Services & Support | 0 (0.0%) | 0 (0.0%) |
| Education Instruction & Library | 44 (75.9%) | 14 (24.1%) |
| Arts, Media & Entertainment | 0 (0.0%) | 0 (0.0%) |
| Health Diagnosing & Treating | 0 (0.0%) | 29 (100.0%) |
| Health Technologists | 0 (0.0%) | 3 (100.0%) |
| Total (Category) | 66 (49.6%) | 67 (50.4%) |
| Total (Overall) | 194 (39.4%) | 298 (60.6%) |
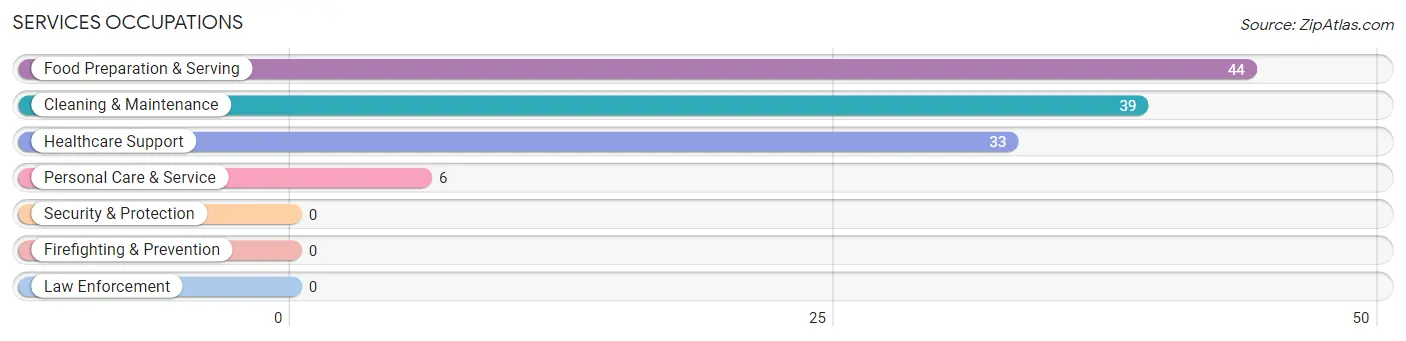
Services Occupations
The most common Services occupations in Tuolumne City are Food Preparation & Serving (44 | 8.9%), Cleaning & Maintenance (39 | 7.9%), Healthcare Support (33 | 6.7%), and Personal Care & Service (6 | 1.2%).
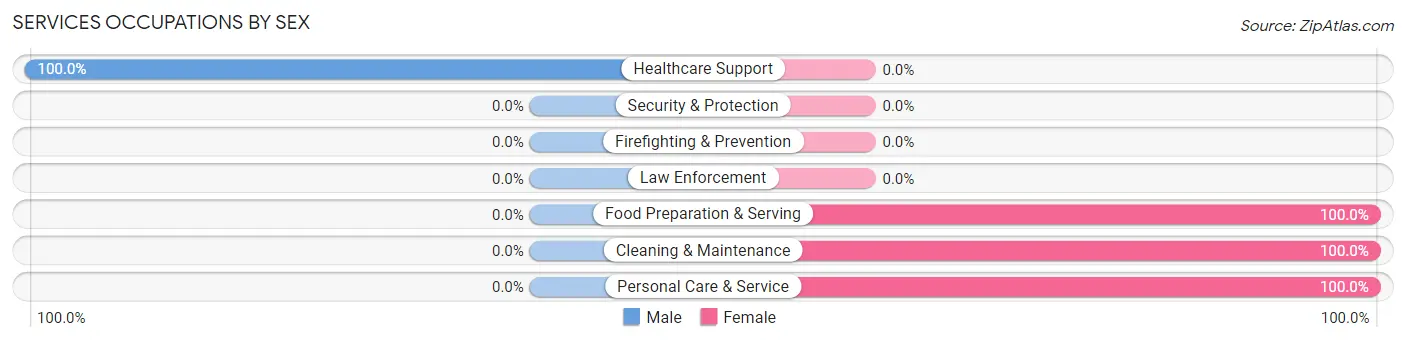
Services Occupations by Sex
| Occupation | Male | Female |
| Healthcare Support | 33 (100.0%) | 0 (0.0%) |
| Security & Protection | 0 (0.0%) | 0 (0.0%) |
| Firefighting & Prevention | 0 (0.0%) | 0 (0.0%) |
| Law Enforcement | 0 (0.0%) | 0 (0.0%) |
| Food Preparation & Serving | 0 (0.0%) | 44 (100.0%) |
| Cleaning & Maintenance | 0 (0.0%) | 39 (100.0%) |
| Personal Care & Service | 0 (0.0%) | 6 (100.0%) |
| Total (Category) | 33 (27.1%) | 89 (73.0%) |
| Total (Overall) | 194 (39.4%) | 298 (60.6%) |
Sales and Office Occupations
The most common Sales and Office occupations in Tuolumne City are Sales & Related (107 | 21.7%), and Office & Administration (95 | 19.3%).
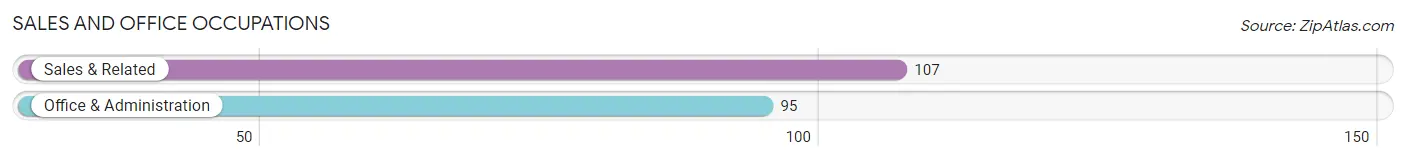
Sales and Office Occupations by Sex

| Occupation | Male | Female |
| Sales & Related | 60 (56.1%) | 47 (43.9%) |
| Office & Administration | 0 (0.0%) | 95 (100.0%) |
| Total (Category) | 60 (29.7%) | 142 (70.3%) |
| Total (Overall) | 194 (39.4%) | 298 (60.6%) |
Natural Resources, Construction and Maintenance Occupations
The most common Natural Resources, Construction and Maintenance occupations in Tuolumne City are , and Construction & Extraction (13 | 2.6%).
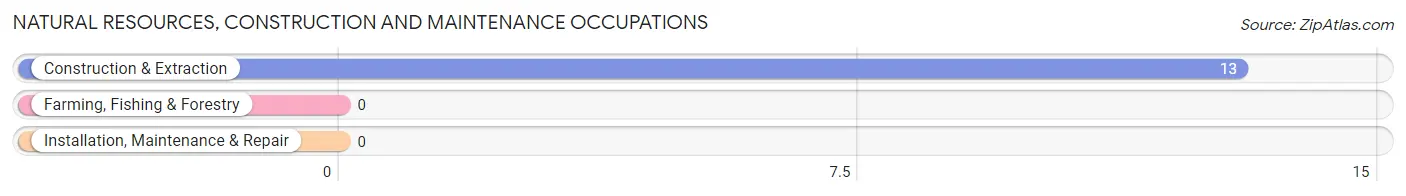
Natural Resources, Construction and Maintenance Occupations by Sex
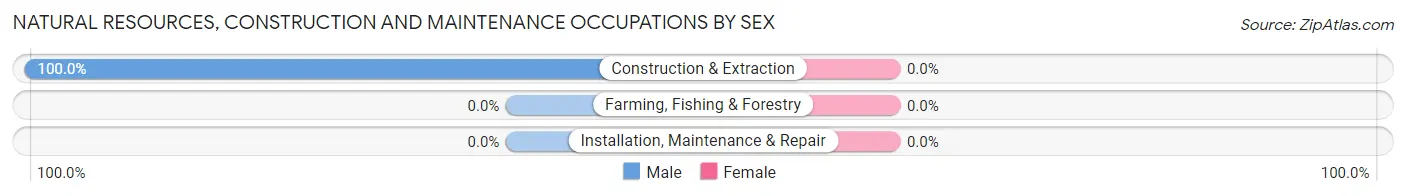
| Occupation | Male | Female |
| Farming, Fishing & Forestry | 0 (0.0%) | 0 (0.0%) |
| Construction & Extraction | 13 (100.0%) | 0 (0.0%) |
| Installation, Maintenance & Repair | 0 (0.0%) | 0 (0.0%) |
| Total (Category) | 13 (100.0%) | 0 (0.0%) |
| Total (Overall) | 194 (39.4%) | 298 (60.6%) |
Production, Transportation and Moving Occupations
The most common Production, Transportation and Moving occupations in Tuolumne City are , and Production (22 | 4.5%).
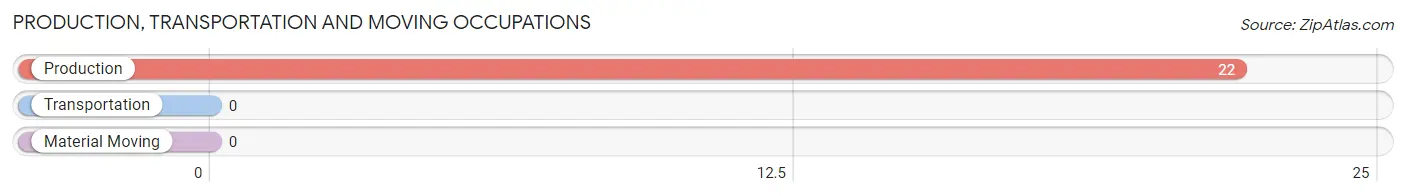
Production, Transportation and Moving Occupations by Sex
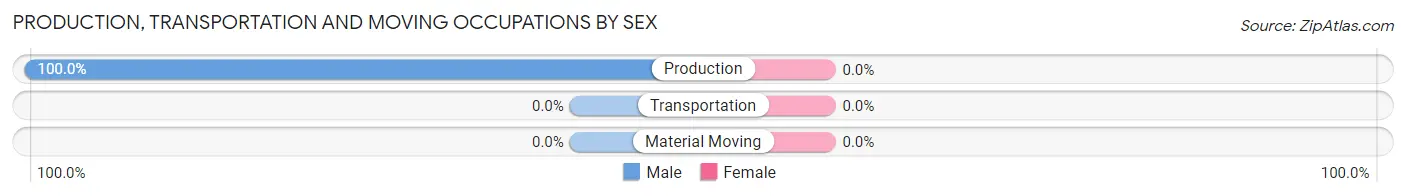
| Occupation | Male | Female |
| Production | 22 (100.0%) | 0 (0.0%) |
| Transportation | 0 (0.0%) | 0 (0.0%) |
| Material Moving | 0 (0.0%) | 0 (0.0%) |
| Total (Category) | 22 (100.0%) | 0 (0.0%) |
| Total (Overall) | 194 (39.4%) | 298 (60.6%) |
Employment Industries by Sex in Tuolumne City
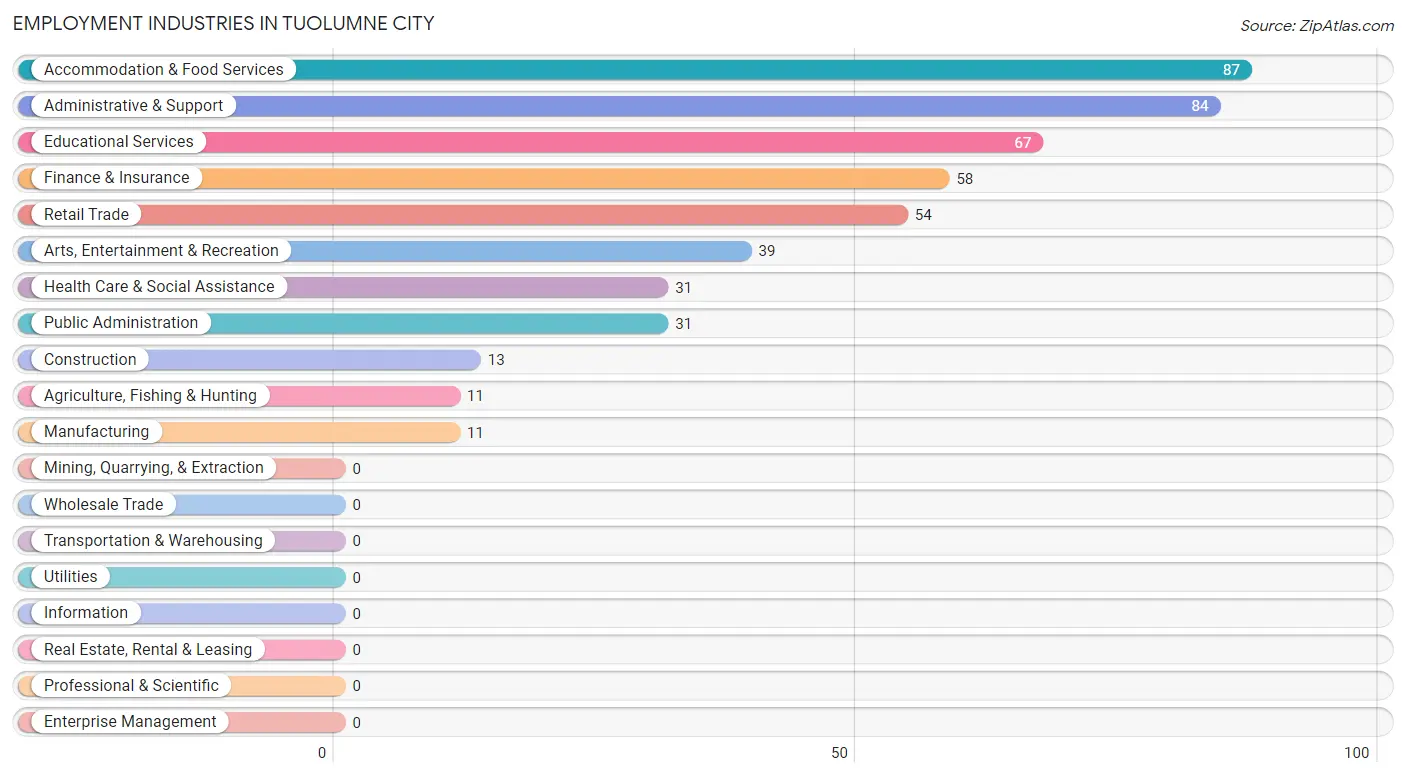
Employment Industries in Tuolumne City
The major employment industries in Tuolumne City include Accommodation & Food Services (87 | 17.7%), Administrative & Support (84 | 17.1%), Educational Services (67 | 13.6%), Finance & Insurance (58 | 11.8%), and Retail Trade (54 | 11.0%).
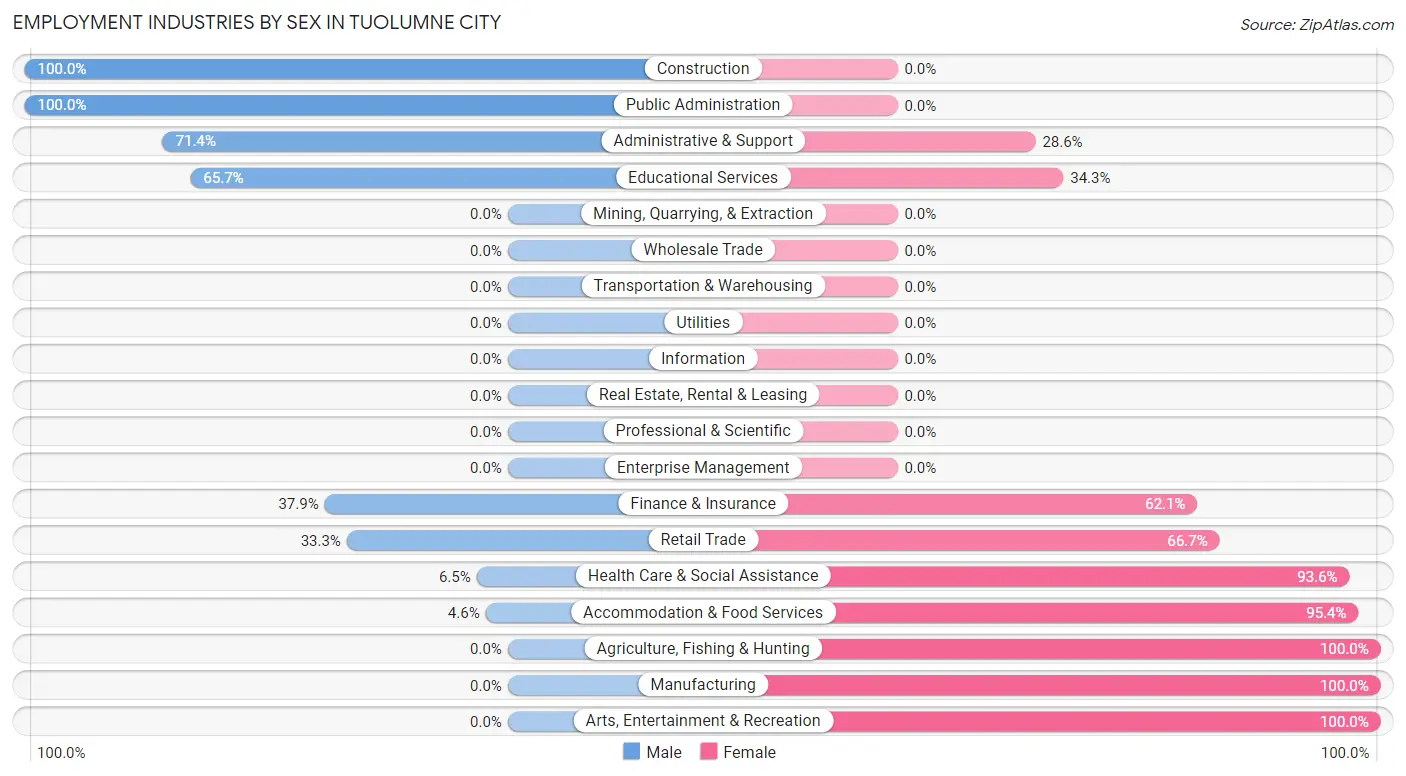
Employment Industries by Sex in Tuolumne City
The Tuolumne City industries that see more men than women are Construction (100.0%), Public Administration (100.0%), and Administrative & Support (71.4%), whereas the industries that tend to have a higher number of women are Agriculture, Fishing & Hunting (100.0%), Manufacturing (100.0%), and Arts, Entertainment & Recreation (100.0%).
| Industry | Male | Female |
| Agriculture, Fishing & Hunting | 0 (0.0%) | 11 (100.0%) |
| Mining, Quarrying, & Extraction | 0 (0.0%) | 0 (0.0%) |
| Construction | 13 (100.0%) | 0 (0.0%) |
| Manufacturing | 0 (0.0%) | 11 (100.0%) |
| Wholesale Trade | 0 (0.0%) | 0 (0.0%) |
| Retail Trade | 18 (33.3%) | 36 (66.7%) |
| Transportation & Warehousing | 0 (0.0%) | 0 (0.0%) |
| Utilities | 0 (0.0%) | 0 (0.0%) |
| Information | 0 (0.0%) | 0 (0.0%) |
| Finance & Insurance | 22 (37.9%) | 36 (62.1%) |
| Real Estate, Rental & Leasing | 0 (0.0%) | 0 (0.0%) |
| Professional & Scientific | 0 (0.0%) | 0 (0.0%) |
| Enterprise Management | 0 (0.0%) | 0 (0.0%) |
| Administrative & Support | 60 (71.4%) | 24 (28.6%) |
| Educational Services | 44 (65.7%) | 23 (34.3%) |
| Health Care & Social Assistance | 2 (6.5%) | 29 (93.5%) |
| Arts, Entertainment & Recreation | 0 (0.0%) | 39 (100.0%) |
| Accommodation & Food Services | 4 (4.6%) | 83 (95.4%) |
| Public Administration | 31 (100.0%) | 0 (0.0%) |
| Total | 194 (39.4%) | 298 (60.6%) |
Education in Tuolumne City
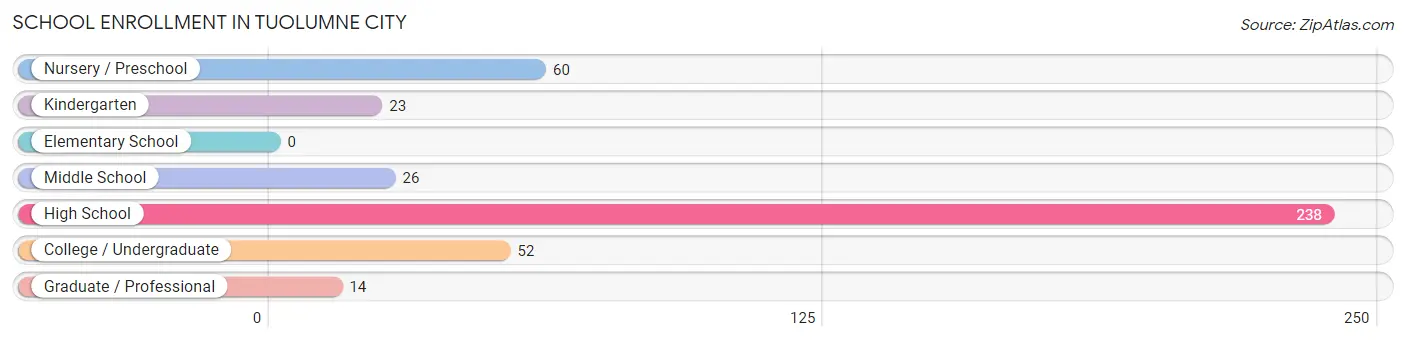
School Enrollment in Tuolumne City
The most common levels of schooling among the 413 students in Tuolumne City are high school (238 | 57.6%), nursery / preschool (60 | 14.5%), and college / undergraduate (52 | 12.6%).
| School Level | # Students | % Students |
| Nursery / Preschool | 60 | 14.5% |
| Kindergarten | 23 | 5.6% |
| Elementary School | 0 | 0.0% |
| Middle School | 26 | 6.3% |
| High School | 238 | 57.6% |
| College / Undergraduate | 52 | 12.6% |
| Graduate / Professional | 14 | 3.4% |
| Total | 413 | 100.0% |
School Enrollment by Age by Funding Source in Tuolumne City
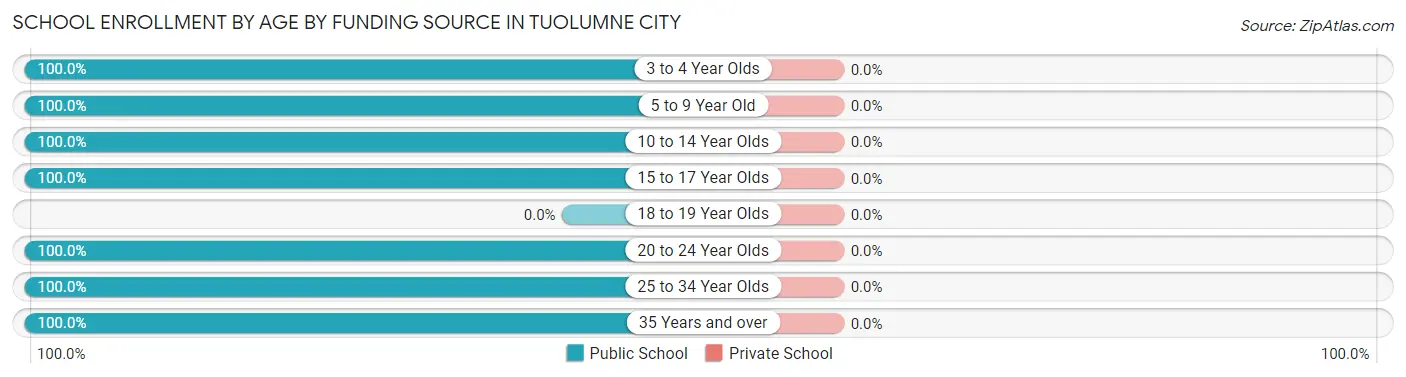
| Age Bracket | Public School | Private School |
| 3 to 4 Year Olds | 55 (100.0%) | 0 (0.0%) |
| 5 to 9 Year Old | 28 (100.0%) | 0 (0.0%) |
| 10 to 14 Year Olds | 113 (100.0%) | 0 (0.0%) |
| 15 to 17 Year Olds | 151 (100.0%) | 0 (0.0%) |
| 18 to 19 Year Olds | 0 (0.0%) | 0 (0.0%) |
| 20 to 24 Year Olds | 11 (100.0%) | 0 (0.0%) |
| 25 to 34 Year Olds | 9 (100.0%) | 0 (0.0%) |
| 35 Years and over | 46 (100.0%) | 0 (0.0%) |
| Total | 413 (100.0%) | 0 (0.0%) |
Educational Attainment by Field of Study in Tuolumne City
Visual & performing arts (102 | 61.1%), education (26 | 15.6%), psychology (17 | 10.2%), literature & languages (14 | 8.4%), and science & technology (3 | 1.8%) are the most common fields of study among 167 individuals in Tuolumne City who have obtained a bachelor's degree or higher.
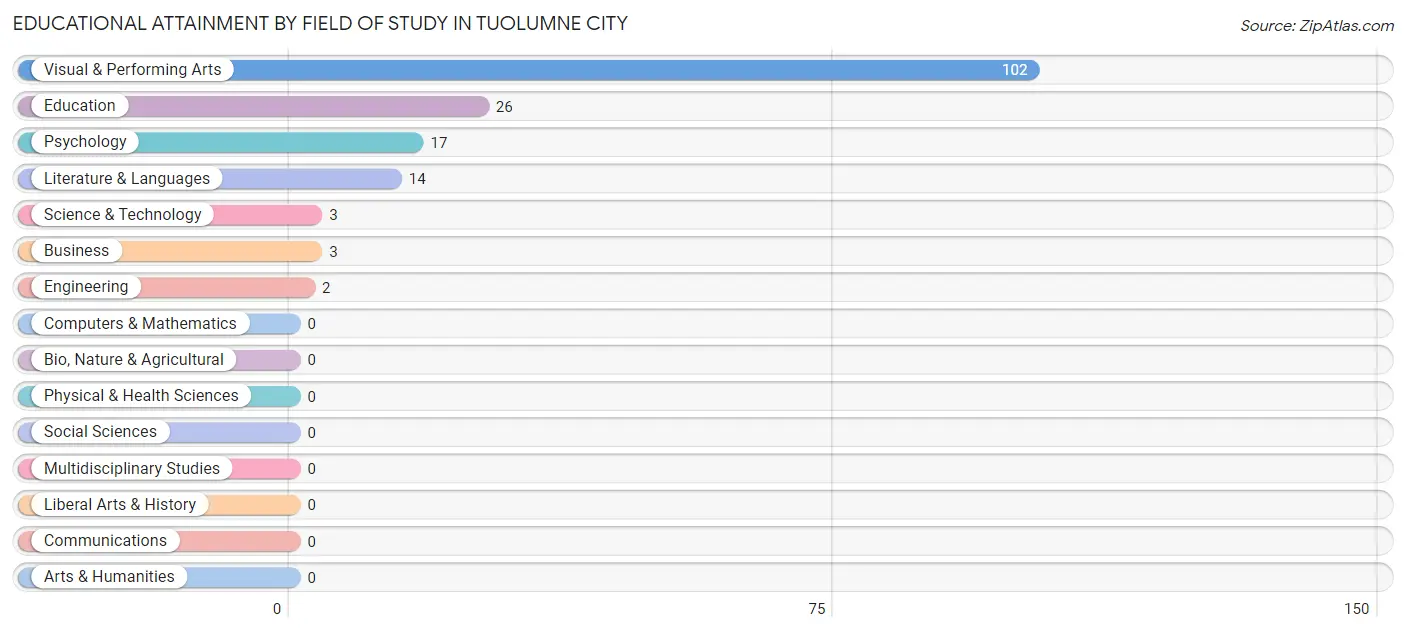
| Field of Study | # Graduates | % Graduates |
| Computers & Mathematics | 0 | 0.0% |
| Bio, Nature & Agricultural | 0 | 0.0% |
| Physical & Health Sciences | 0 | 0.0% |
| Psychology | 17 | 10.2% |
| Social Sciences | 0 | 0.0% |
| Engineering | 2 | 1.2% |
| Multidisciplinary Studies | 0 | 0.0% |
| Science & Technology | 3 | 1.8% |
| Business | 3 | 1.8% |
| Education | 26 | 15.6% |
| Literature & Languages | 14 | 8.4% |
| Liberal Arts & History | 0 | 0.0% |
| Visual & Performing Arts | 102 | 61.1% |
| Communications | 0 | 0.0% |
| Arts & Humanities | 0 | 0.0% |
| Total | 167 | 100.0% |
Transportation & Commute in Tuolumne City
Vehicle Availability by Sex in Tuolumne City
The most prevalent vehicle ownership categories in Tuolumne City are males with 5 or more vehicles (93, accounting for 49.5%) and females with 5 or more vehicles (89, making up 31.5%).
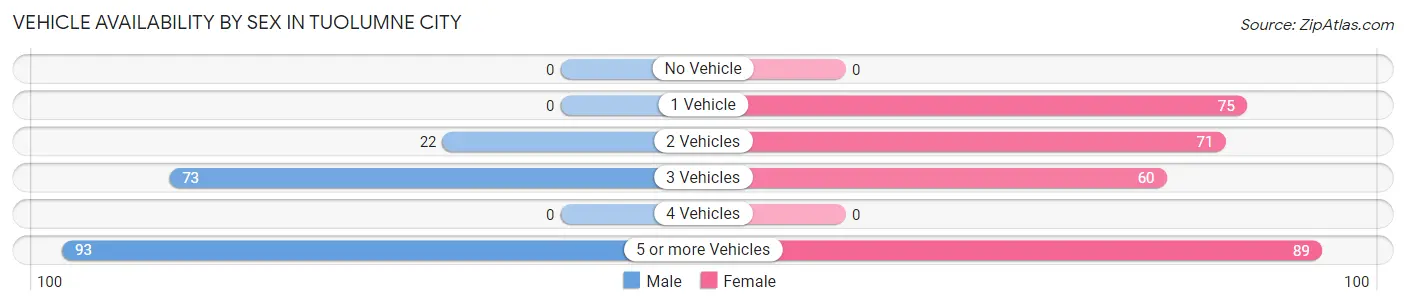
| Vehicles Available | Male | Female |
| No Vehicle | 0 (0.0%) | 0 (0.0%) |
| 1 Vehicle | 0 (0.0%) | 75 (25.4%) |
| 2 Vehicles | 22 (11.7%) | 71 (24.1%) |
| 3 Vehicles | 73 (38.8%) | 60 (20.3%) |
| 4 Vehicles | 0 (0.0%) | 0 (0.0%) |
| 5 or more Vehicles | 93 (49.5%) | 89 (30.2%) |
| Total | 188 (100.0%) | 295 (100.0%) |
Commute Time in Tuolumne City
The most frequently occuring commute durations in Tuolumne City are 15 to 19 minutes (169 commuters, 34.5%), 10 to 14 minutes (111 commuters, 22.7%), and less than 5 minutes (83 commuters, 16.9%).
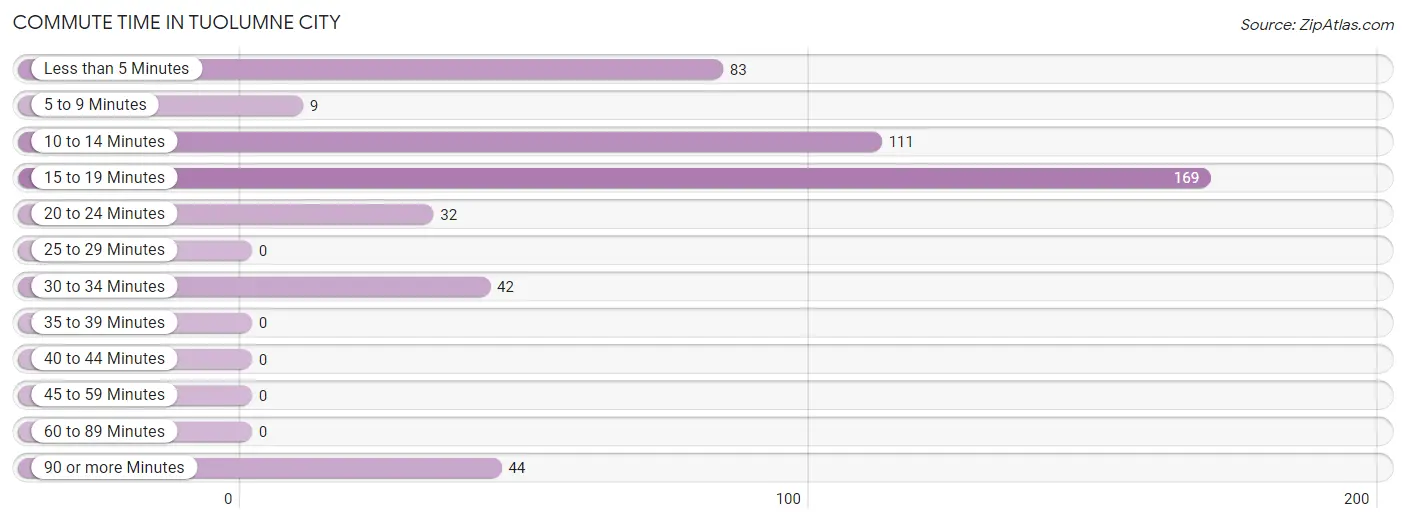
| Commute Time | # Commuters | % Commuters |
| Less than 5 Minutes | 83 | 16.9% |
| 5 to 9 Minutes | 9 | 1.8% |
| 10 to 14 Minutes | 111 | 22.7% |
| 15 to 19 Minutes | 169 | 34.5% |
| 20 to 24 Minutes | 32 | 6.5% |
| 25 to 29 Minutes | 0 | 0.0% |
| 30 to 34 Minutes | 42 | 8.6% |
| 35 to 39 Minutes | 0 | 0.0% |
| 40 to 44 Minutes | 0 | 0.0% |
| 45 to 59 Minutes | 0 | 0.0% |
| 60 to 89 Minutes | 0 | 0.0% |
| 90 or more Minutes | 44 | 9.0% |
Commute Time by Sex in Tuolumne City
The most common commute times in Tuolumne City are 15 to 19 minutes (73 commuters, 38.0%) for males and 15 to 19 minutes (96 commuters, 32.2%) for females.
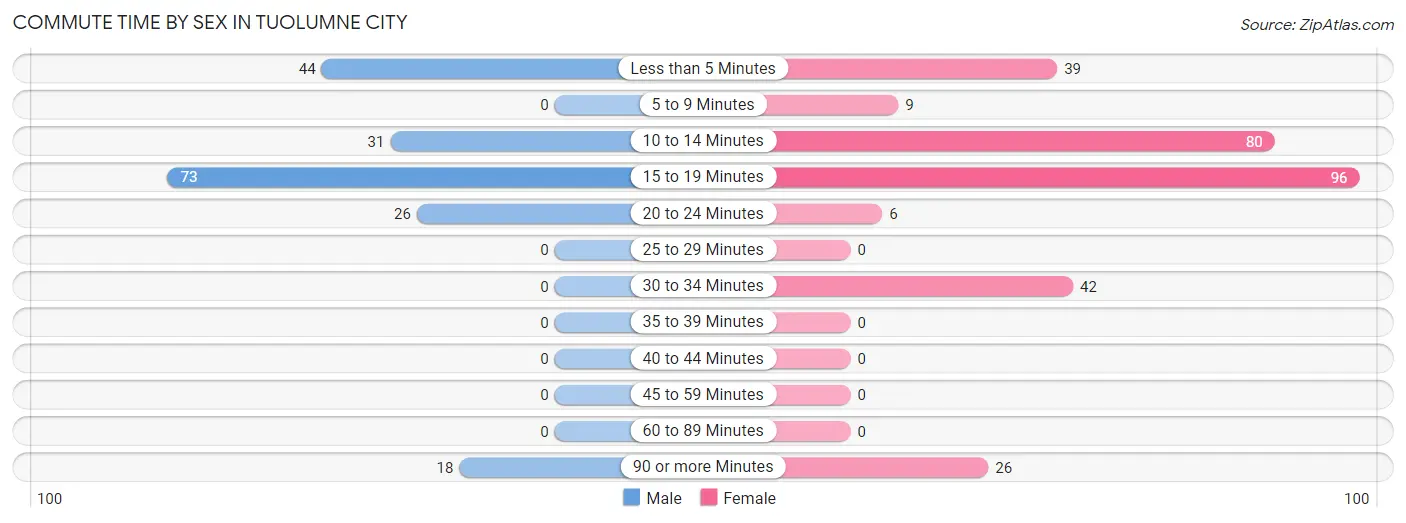
| Commute Time | Male | Female |
| Less than 5 Minutes | 44 (22.9%) | 39 (13.1%) |
| 5 to 9 Minutes | 0 (0.0%) | 9 (3.0%) |
| 10 to 14 Minutes | 31 (16.2%) | 80 (26.9%) |
| 15 to 19 Minutes | 73 (38.0%) | 96 (32.2%) |
| 20 to 24 Minutes | 26 (13.5%) | 6 (2.0%) |
| 25 to 29 Minutes | 0 (0.0%) | 0 (0.0%) |
| 30 to 34 Minutes | 0 (0.0%) | 42 (14.1%) |
| 35 to 39 Minutes | 0 (0.0%) | 0 (0.0%) |
| 40 to 44 Minutes | 0 (0.0%) | 0 (0.0%) |
| 45 to 59 Minutes | 0 (0.0%) | 0 (0.0%) |
| 60 to 89 Minutes | 0 (0.0%) | 0 (0.0%) |
| 90 or more Minutes | 18 (9.4%) | 26 (8.7%) |
Time of Departure to Work by Sex in Tuolumne City
The most frequent times of departure to work in Tuolumne City are 6:00 AM to 6:29 AM (91, 47.4%) for males and 9:00 AM to 9:59 AM (81, 27.2%) for females.
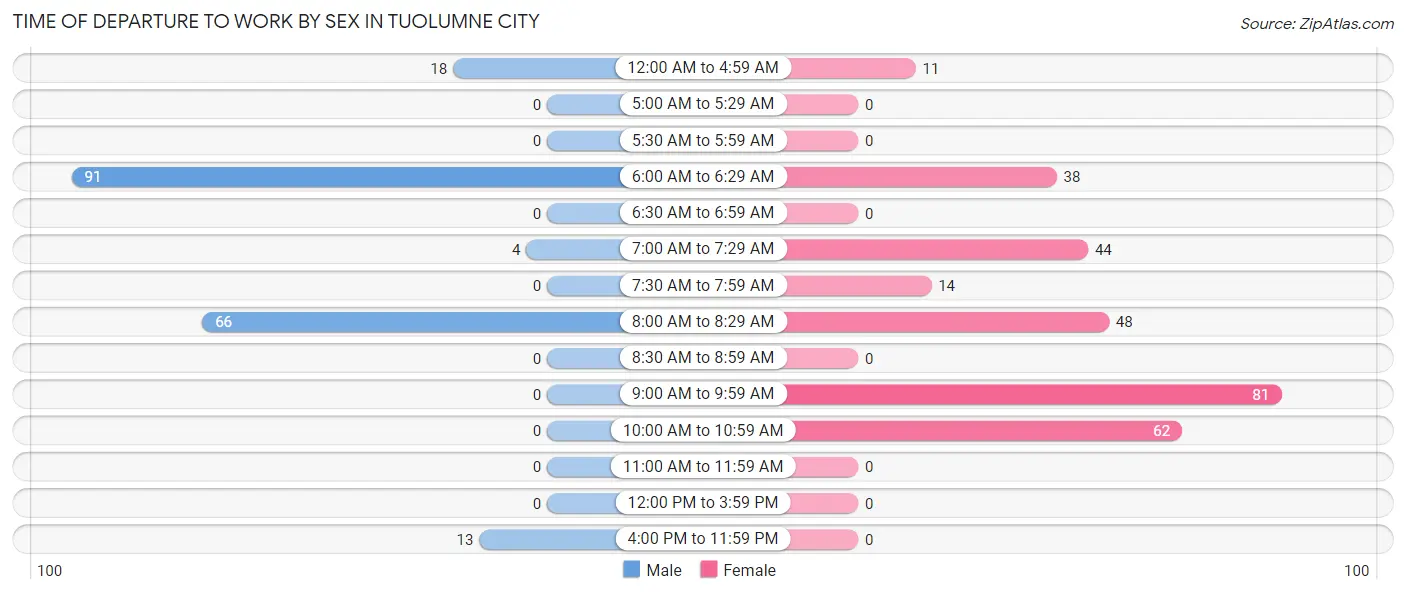
| Time of Departure | Male | Female |
| 12:00 AM to 4:59 AM | 18 (9.4%) | 11 (3.7%) |
| 5:00 AM to 5:29 AM | 0 (0.0%) | 0 (0.0%) |
| 5:30 AM to 5:59 AM | 0 (0.0%) | 0 (0.0%) |
| 6:00 AM to 6:29 AM | 91 (47.4%) | 38 (12.8%) |
| 6:30 AM to 6:59 AM | 0 (0.0%) | 0 (0.0%) |
| 7:00 AM to 7:29 AM | 4 (2.1%) | 44 (14.8%) |
| 7:30 AM to 7:59 AM | 0 (0.0%) | 14 (4.7%) |
| 8:00 AM to 8:29 AM | 66 (34.4%) | 48 (16.1%) |
| 8:30 AM to 8:59 AM | 0 (0.0%) | 0 (0.0%) |
| 9:00 AM to 9:59 AM | 0 (0.0%) | 81 (27.2%) |
| 10:00 AM to 10:59 AM | 0 (0.0%) | 62 (20.8%) |
| 11:00 AM to 11:59 AM | 0 (0.0%) | 0 (0.0%) |
| 12:00 PM to 3:59 PM | 0 (0.0%) | 0 (0.0%) |
| 4:00 PM to 11:59 PM | 13 (6.8%) | 0 (0.0%) |
| Total | 192 (100.0%) | 298 (100.0%) |
Housing Occupancy in Tuolumne City
Occupancy by Ownership in Tuolumne City
Of the total 564 dwellings in Tuolumne City, owner-occupied units account for 338 (59.9%), while renter-occupied units make up 226 (40.1%).
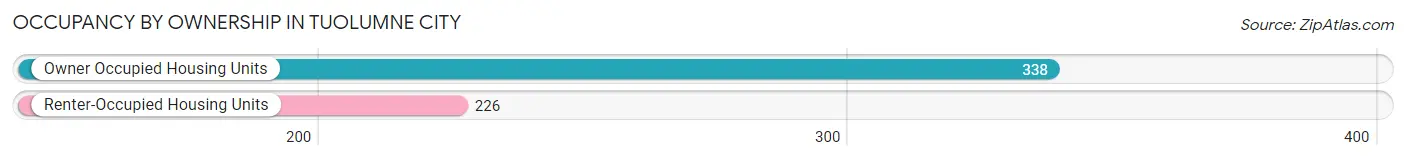
| Occupancy | # Housing Units | % Housing Units |
| Owner Occupied Housing Units | 338 | 59.9% |
| Renter-Occupied Housing Units | 226 | 40.1% |
| Total Occupied Housing Units | 564 | 100.0% |
Occupancy by Household Size in Tuolumne City
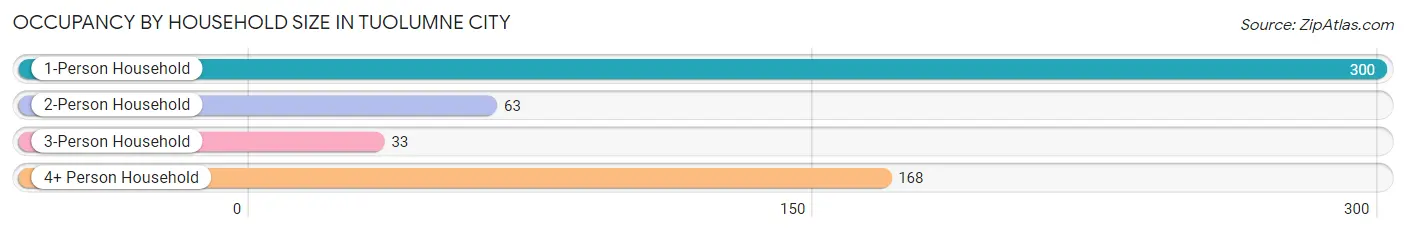
| Household Size | # Housing Units | % Housing Units |
| 1-Person Household | 300 | 53.2% |
| 2-Person Household | 63 | 11.2% |
| 3-Person Household | 33 | 5.9% |
| 4+ Person Household | 168 | 29.8% |
| Total Housing Units | 564 | 100.0% |
Occupancy by Ownership by Household Size in Tuolumne City
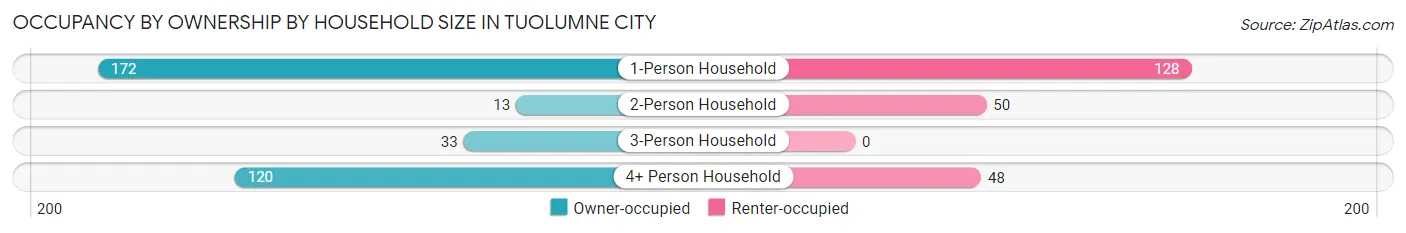
| Household Size | Owner-occupied | Renter-occupied |
| 1-Person Household | 172 (57.3%) | 128 (42.7%) |
| 2-Person Household | 13 (20.6%) | 50 (79.4%) |
| 3-Person Household | 33 (100.0%) | 0 (0.0%) |
| 4+ Person Household | 120 (71.4%) | 48 (28.6%) |
| Total Housing Units | 338 (59.9%) | 226 (40.1%) |
Occupancy by Educational Attainment in Tuolumne City
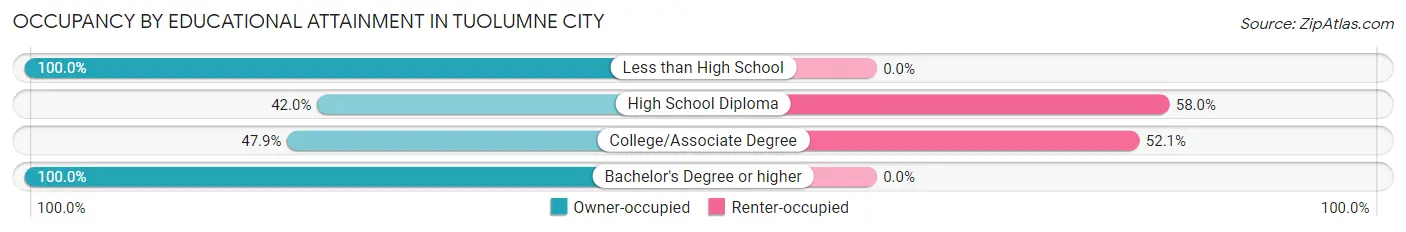
| Household Size | Owner-occupied | Renter-occupied |
| Less than High School | 29 (100.0%) | 0 (0.0%) |
| High School Diploma | 55 (42.0%) | 76 (58.0%) |
| College/Associate Degree | 138 (47.9%) | 150 (52.1%) |
| Bachelor's Degree or higher | 116 (100.0%) | 0 (0.0%) |
Occupancy by Age of Householder in Tuolumne City
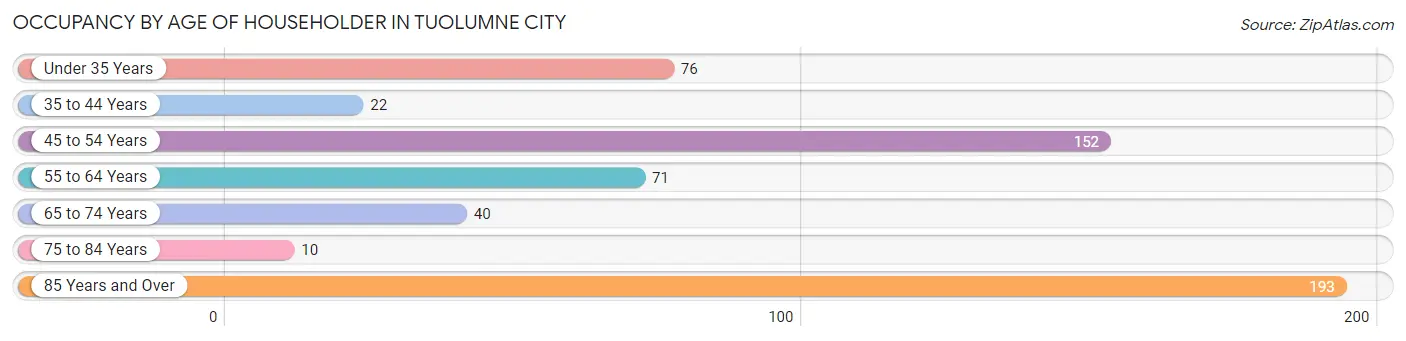
| Age Bracket | # Households | % Households |
| Under 35 Years | 76 | 13.5% |
| 35 to 44 Years | 22 | 3.9% |
| 45 to 54 Years | 152 | 27.0% |
| 55 to 64 Years | 71 | 12.6% |
| 65 to 74 Years | 40 | 7.1% |
| 75 to 84 Years | 10 | 1.8% |
| 85 Years and Over | 193 | 34.2% |
| Total | 564 | 100.0% |
Housing Finances in Tuolumne City
Median Income by Occupancy in Tuolumne City
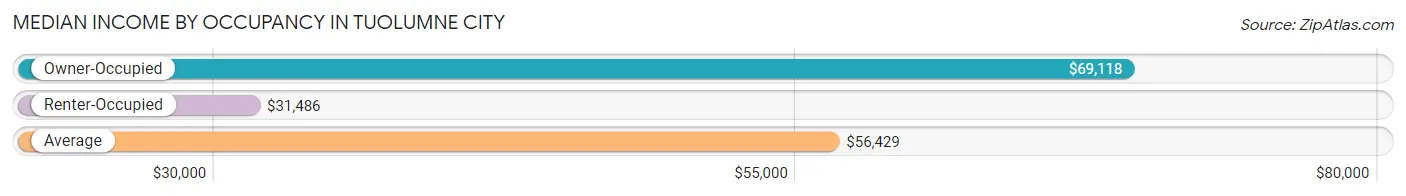
| Occupancy Type | # Households | Median Income |
| Owner-Occupied | 338 (59.9%) | $69,118 |
| Renter-Occupied | 226 (40.1%) | $31,486 |
| Average | 564 (100.0%) | $56,429 |
Occupancy by Householder Income Bracket in Tuolumne City
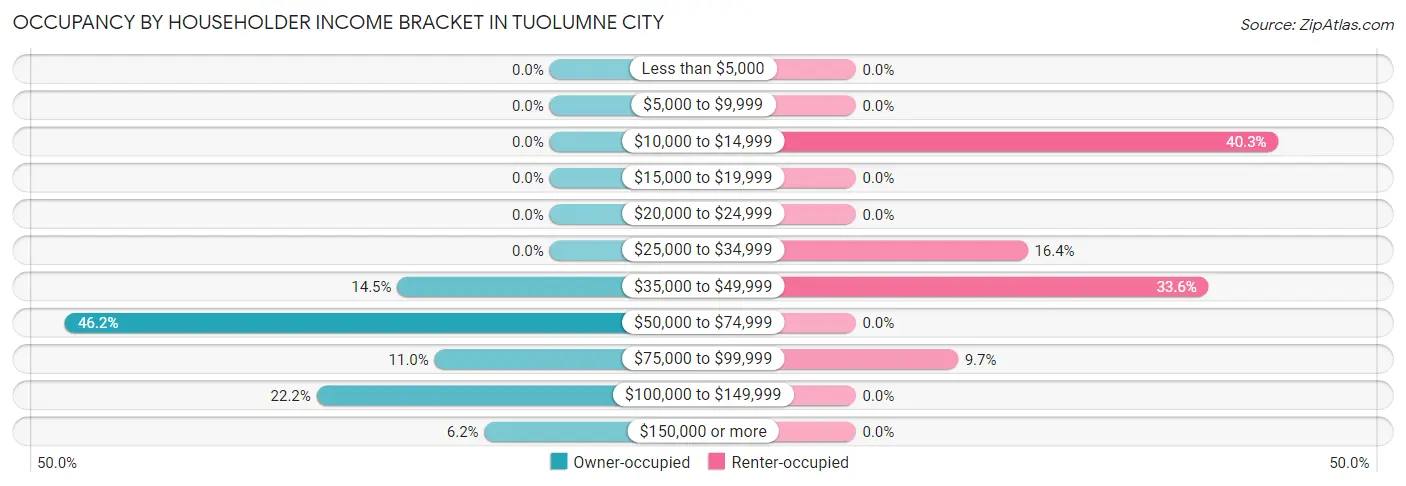
| Income Bracket | Owner-occupied | Renter-occupied |
| Less than $5,000 | 0 (0.0%) | 0 (0.0%) |
| $5,000 to $9,999 | 0 (0.0%) | 0 (0.0%) |
| $10,000 to $14,999 | 0 (0.0%) | 91 (40.3%) |
| $15,000 to $19,999 | 0 (0.0%) | 0 (0.0%) |
| $20,000 to $24,999 | 0 (0.0%) | 0 (0.0%) |
| $25,000 to $34,999 | 0 (0.0%) | 37 (16.4%) |
| $35,000 to $49,999 | 49 (14.5%) | 76 (33.6%) |
| $50,000 to $74,999 | 156 (46.2%) | 0 (0.0%) |
| $75,000 to $99,999 | 37 (11.0%) | 22 (9.7%) |
| $100,000 to $149,999 | 75 (22.2%) | 0 (0.0%) |
| $150,000 or more | 21 (6.2%) | 0 (0.0%) |
| Total | 338 (100.0%) | 226 (100.0%) |
Monthly Housing Cost Tiers in Tuolumne City
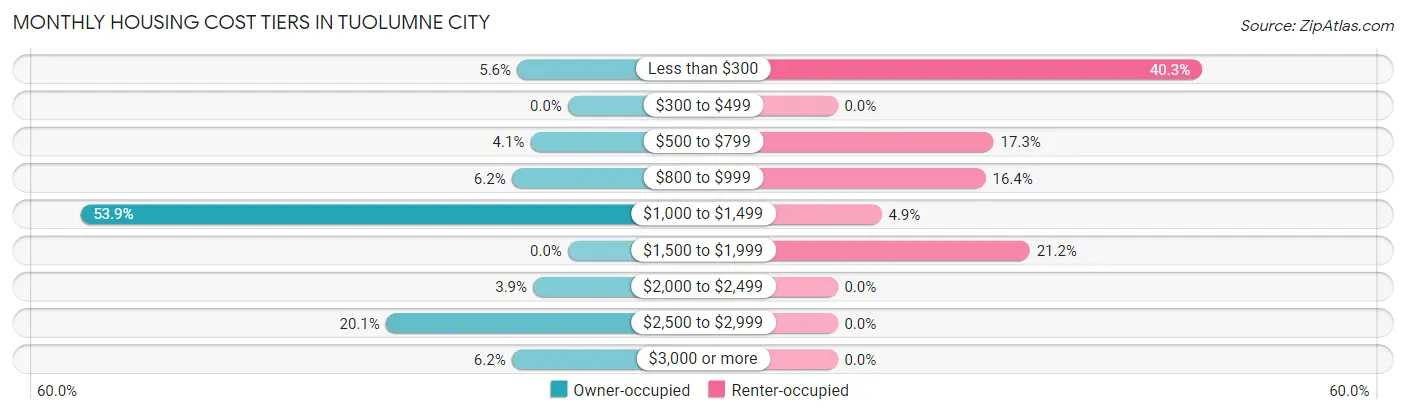
| Monthly Cost | Owner-occupied | Renter-occupied |
| Less than $300 | 19 (5.6%) | 91 (40.3%) |
| $300 to $499 | 0 (0.0%) | 0 (0.0%) |
| $500 to $799 | 14 (4.1%) | 39 (17.3%) |
| $800 to $999 | 21 (6.2%) | 37 (16.4%) |
| $1,000 to $1,499 | 182 (53.8%) | 11 (4.9%) |
| $1,500 to $1,999 | 0 (0.0%) | 48 (21.2%) |
| $2,000 to $2,499 | 13 (3.8%) | 0 (0.0%) |
| $2,500 to $2,999 | 68 (20.1%) | 0 (0.0%) |
| $3,000 or more | 21 (6.2%) | 0 (0.0%) |
| Total | 338 (100.0%) | 226 (100.0%) |
Physical Housing Characteristics in Tuolumne City
Housing Structures in Tuolumne City
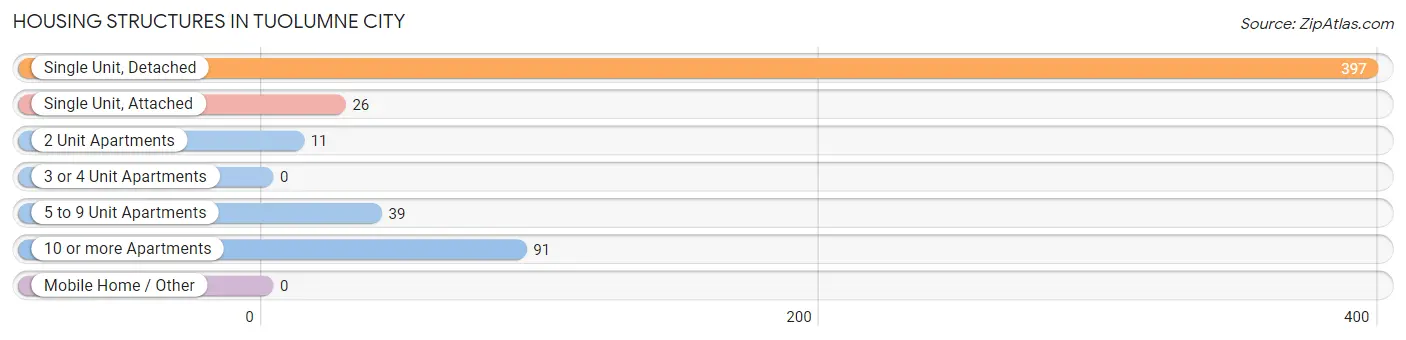
| Structure Type | # Housing Units | % Housing Units |
| Single Unit, Detached | 397 | 70.4% |
| Single Unit, Attached | 26 | 4.6% |
| 2 Unit Apartments | 11 | 1.9% |
| 3 or 4 Unit Apartments | 0 | 0.0% |
| 5 to 9 Unit Apartments | 39 | 6.9% |
| 10 or more Apartments | 91 | 16.1% |
| Mobile Home / Other | 0 | 0.0% |
| Total | 564 | 100.0% |
Housing Structures by Occupancy in Tuolumne City
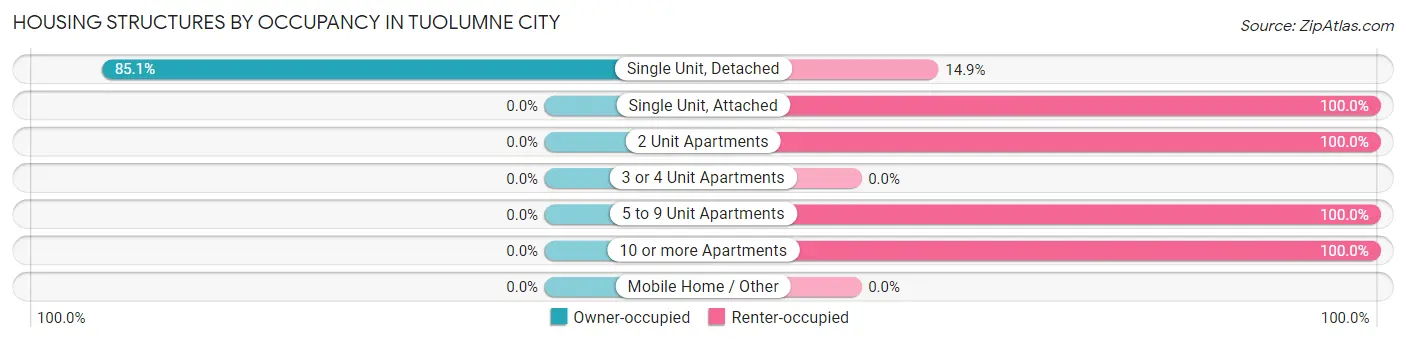
| Structure Type | Owner-occupied | Renter-occupied |
| Single Unit, Detached | 338 (85.1%) | 59 (14.9%) |
| Single Unit, Attached | 0 (0.0%) | 26 (100.0%) |
| 2 Unit Apartments | 0 (0.0%) | 11 (100.0%) |
| 3 or 4 Unit Apartments | 0 (0.0%) | 0 (0.0%) |
| 5 to 9 Unit Apartments | 0 (0.0%) | 39 (100.0%) |
| 10 or more Apartments | 0 (0.0%) | 91 (100.0%) |
| Mobile Home / Other | 0 (0.0%) | 0 (0.0%) |
| Total | 338 (59.9%) | 226 (40.1%) |
Housing Structures by Number of Rooms in Tuolumne City
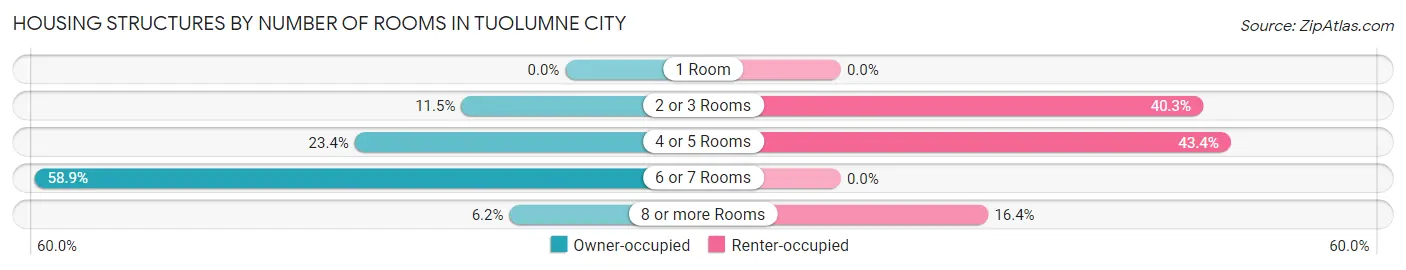
| Number of Rooms | Owner-occupied | Renter-occupied |
| 1 Room | 0 (0.0%) | 0 (0.0%) |
| 2 or 3 Rooms | 39 (11.5%) | 91 (40.3%) |
| 4 or 5 Rooms | 79 (23.4%) | 98 (43.4%) |
| 6 or 7 Rooms | 199 (58.9%) | 0 (0.0%) |
| 8 or more Rooms | 21 (6.2%) | 37 (16.4%) |
| Total | 338 (100.0%) | 226 (100.0%) |
Housing Structure by Heating Type in Tuolumne City
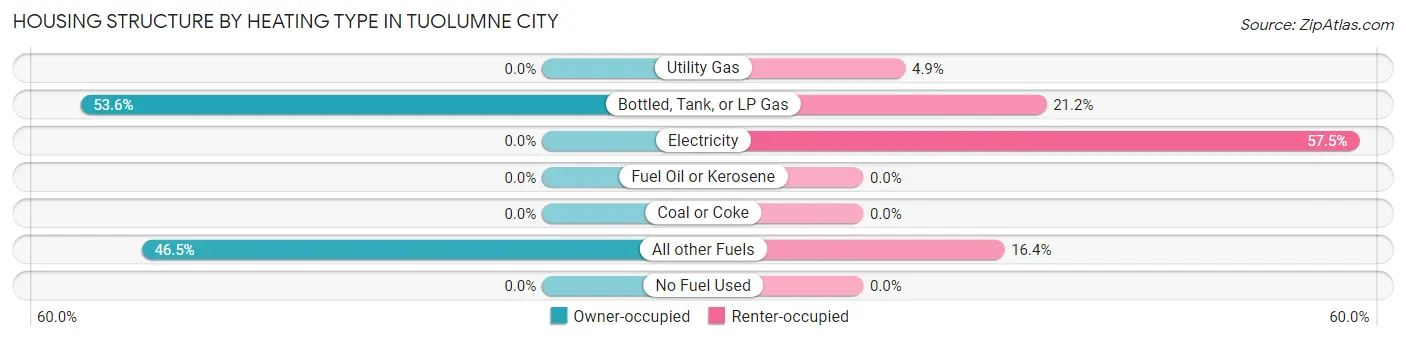
| Heating Type | Owner-occupied | Renter-occupied |
| Utility Gas | 0 (0.0%) | 11 (4.9%) |
| Bottled, Tank, or LP Gas | 181 (53.5%) | 48 (21.2%) |
| Electricity | 0 (0.0%) | 130 (57.5%) |
| Fuel Oil or Kerosene | 0 (0.0%) | 0 (0.0%) |
| Coal or Coke | 0 (0.0%) | 0 (0.0%) |
| All other Fuels | 157 (46.5%) | 37 (16.4%) |
| No Fuel Used | 0 (0.0%) | 0 (0.0%) |
| Total | 338 (100.0%) | 226 (100.0%) |
Household Vehicle Usage in Tuolumne City
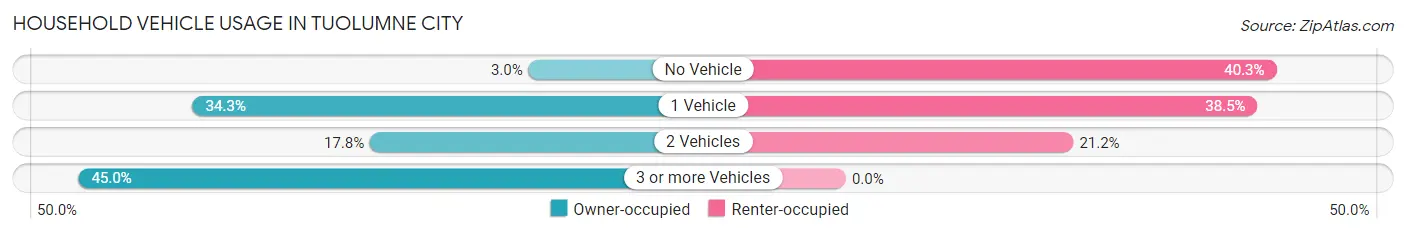
| Vehicles per Household | Owner-occupied | Renter-occupied |
| No Vehicle | 10 (3.0%) | 91 (40.3%) |
| 1 Vehicle | 116 (34.3%) | 87 (38.5%) |
| 2 Vehicles | 60 (17.7%) | 48 (21.2%) |
| 3 or more Vehicles | 152 (45.0%) | 0 (0.0%) |
| Total | 338 (100.0%) | 226 (100.0%) |
Real Estate & Mortgages in Tuolumne City
Real Estate and Mortgage Overview in Tuolumne City
| Characteristic | Without Mortgage | With Mortgage |
| Housing Units | 137 | 201 |
| Median Property Value | $432,800 | $248,300 |
| Median Household Income | $68,321 | $21 |
| Monthly Housing Costs | $1,033 | $21 |
| Real Estate Taxes | - | - |
Property Value by Mortgage Status in Tuolumne City
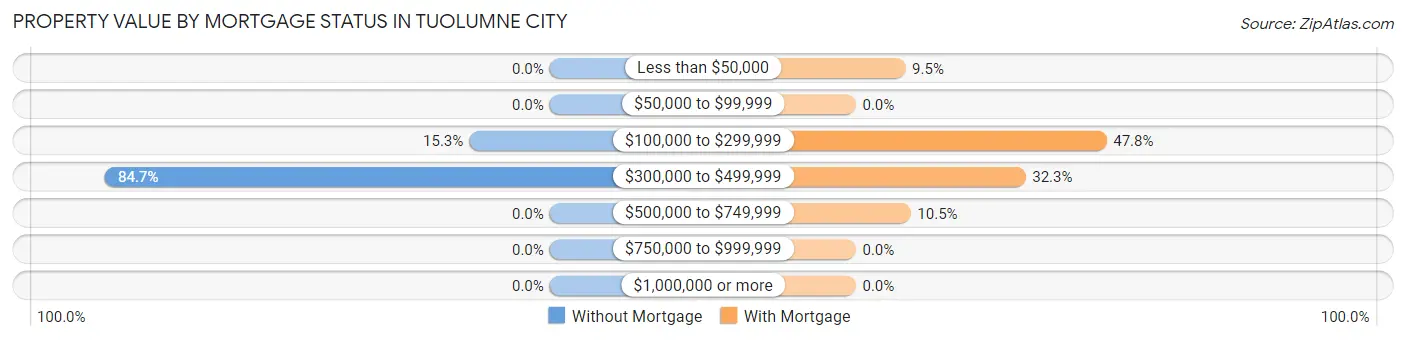
| Property Value | Without Mortgage | With Mortgage |
| Less than $50,000 | 0 (0.0%) | 19 (9.5%) |
| $50,000 to $99,999 | 0 (0.0%) | 0 (0.0%) |
| $100,000 to $299,999 | 21 (15.3%) | 96 (47.8%) |
| $300,000 to $499,999 | 116 (84.7%) | 65 (32.3%) |
| $500,000 to $749,999 | 0 (0.0%) | 21 (10.4%) |
| $750,000 to $999,999 | 0 (0.0%) | 0 (0.0%) |
| $1,000,000 or more | 0 (0.0%) | 0 (0.0%) |
| Total | 137 (100.0%) | 201 (100.0%) |
Household Income by Mortgage Status in Tuolumne City
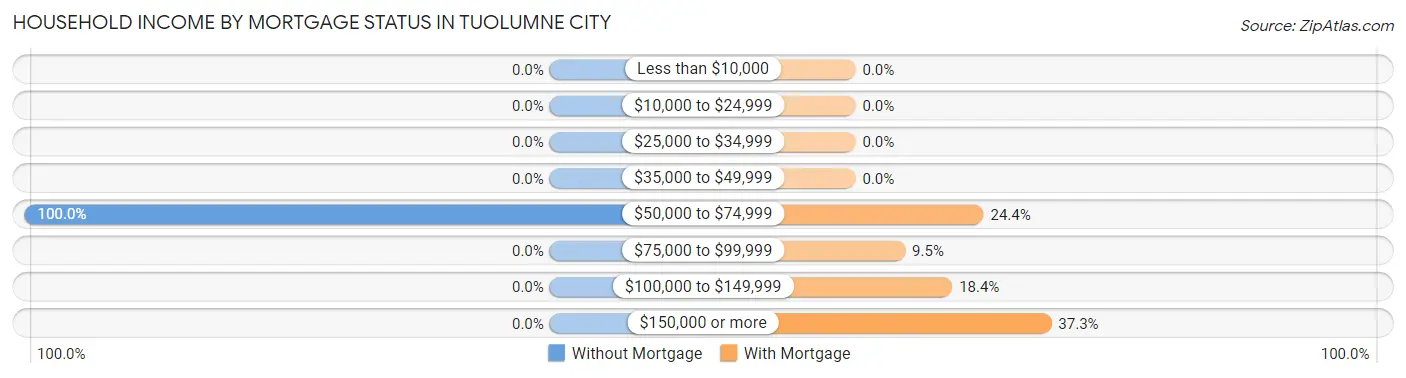
| Household Income | Without Mortgage | With Mortgage |
| Less than $10,000 | 0 (0.0%) | 0 (0.0%) |
| $10,000 to $24,999 | 0 (0.0%) | 0 (0.0%) |
| $25,000 to $34,999 | 0 (0.0%) | 0 (0.0%) |
| $35,000 to $49,999 | 0 (0.0%) | 0 (0.0%) |
| $50,000 to $74,999 | 137 (100.0%) | 49 (24.4%) |
| $75,000 to $99,999 | 0 (0.0%) | 19 (9.5%) |
| $100,000 to $149,999 | 0 (0.0%) | 37 (18.4%) |
| $150,000 or more | 0 (0.0%) | 75 (37.3%) |
| Total | 137 (100.0%) | 201 (100.0%) |
Property Value to Household Income Ratio in Tuolumne City
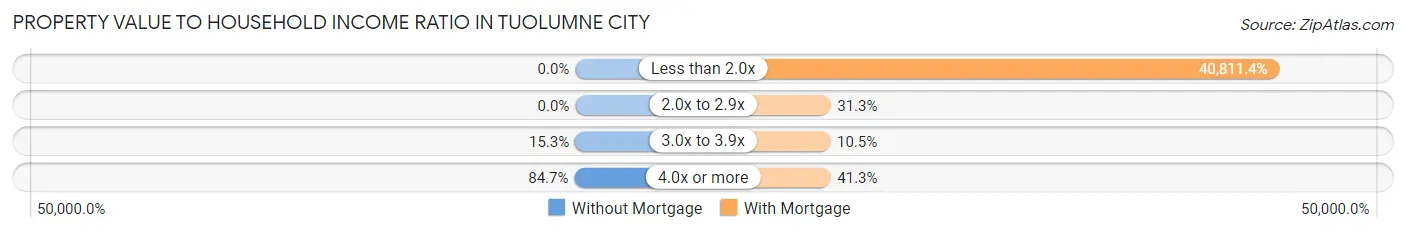
| Value-to-Income Ratio | Without Mortgage | With Mortgage |
| Less than 2.0x | 0 (0.0%) | 82,031 (40,811.4%) |
| 2.0x to 2.9x | 0 (0.0%) | 63 (31.3%) |
| 3.0x to 3.9x | 21 (15.3%) | 21 (10.4%) |
| 4.0x or more | 116 (84.7%) | 83 (41.3%) |
| Total | 137 (100.0%) | 201 (100.0%) |
Real Estate Taxes by Mortgage Status in Tuolumne City
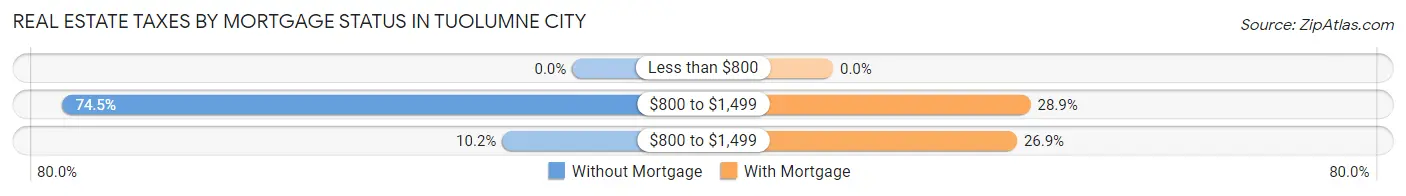
| Property Taxes | Without Mortgage | With Mortgage |
| Less than $800 | 0 (0.0%) | 0 (0.0%) |
| $800 to $1,499 | 102 (74.5%) | 58 (28.9%) |
| $800 to $1,499 | 14 (10.2%) | 54 (26.9%) |
| Total | 137 (100.0%) | 201 (100.0%) |
Health & Disability in Tuolumne City
Health Insurance Coverage by Age in Tuolumne City
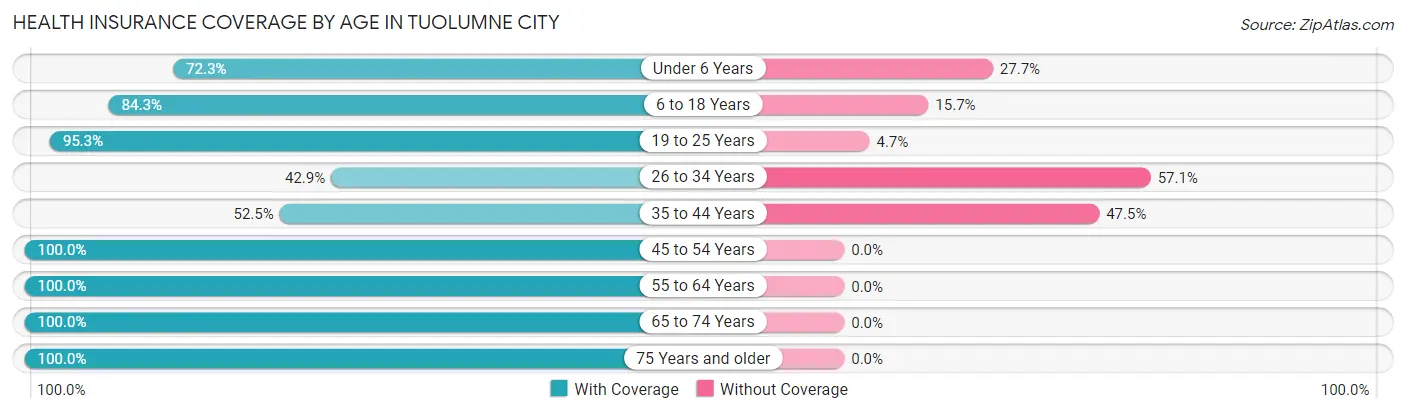
| Age Bracket | With Coverage | Without Coverage |
| Under 6 Years | 60 (72.3%) | 23 (27.7%) |
| 6 to 18 Years | 242 (84.3%) | 45 (15.7%) |
| 19 to 25 Years | 81 (95.3%) | 4 (4.7%) |
| 26 to 34 Years | 54 (42.9%) | 72 (57.1%) |
| 35 to 44 Years | 32 (52.5%) | 29 (47.5%) |
| 45 to 54 Years | 283 (100.0%) | 0 (0.0%) |
| 55 to 64 Years | 126 (100.0%) | 0 (0.0%) |
| 65 to 74 Years | 43 (100.0%) | 0 (0.0%) |
| 75 Years and older | 203 (100.0%) | 0 (0.0%) |
| Total | 1,124 (86.7%) | 173 (13.3%) |
Health Insurance Coverage by Citizenship Status in Tuolumne City
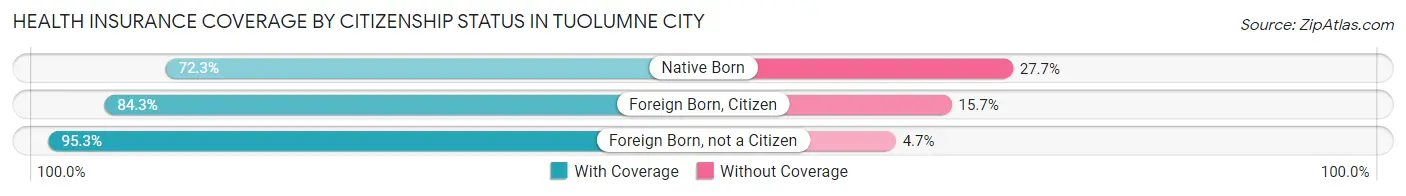
| Citizenship Status | With Coverage | Without Coverage |
| Native Born | 60 (72.3%) | 23 (27.7%) |
| Foreign Born, Citizen | 242 (84.3%) | 45 (15.7%) |
| Foreign Born, not a Citizen | 81 (95.3%) | 4 (4.7%) |
Health Insurance Coverage by Household Income in Tuolumne City
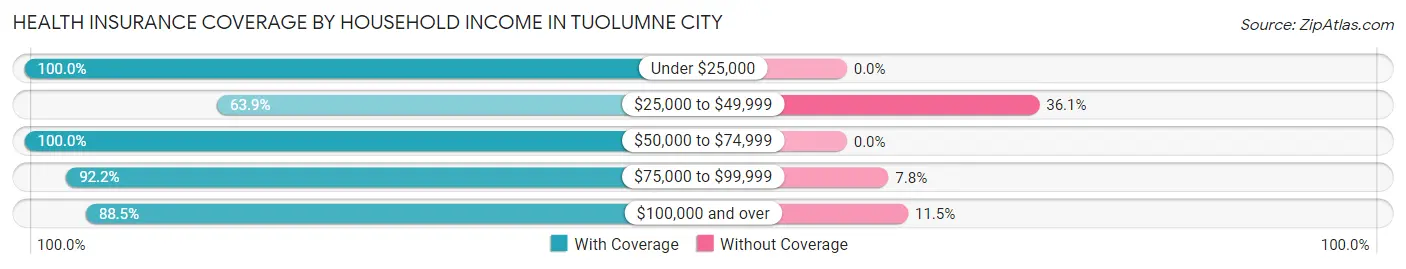
| Household Income | With Coverage | Without Coverage |
| Under $25,000 | 91 (100.0%) | 0 (0.0%) |
| $25,000 to $49,999 | 179 (63.9%) | 101 (36.1%) |
| $50,000 to $74,999 | 227 (100.0%) | 0 (0.0%) |
| $75,000 to $99,999 | 260 (92.2%) | 22 (7.8%) |
| $100,000 and over | 355 (88.5%) | 46 (11.5%) |
Public vs Private Health Insurance Coverage by Age in Tuolumne City
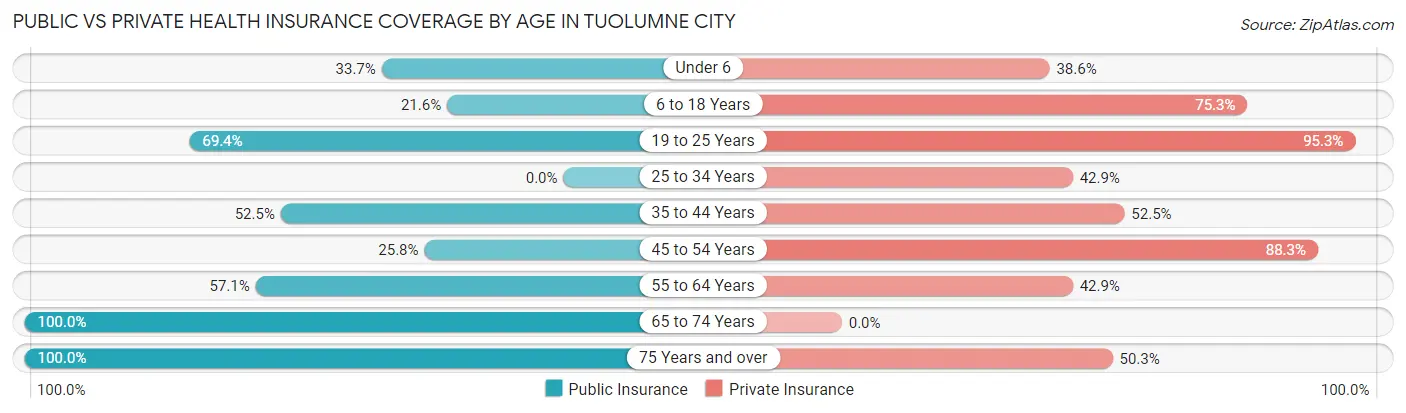
| Age Bracket | Public Insurance | Private Insurance |
| Under 6 | 28 (33.7%) | 32 (38.6%) |
| 6 to 18 Years | 62 (21.6%) | 216 (75.3%) |
| 19 to 25 Years | 59 (69.4%) | 81 (95.3%) |
| 25 to 34 Years | 0 (0.0%) | 54 (42.9%) |
| 35 to 44 Years | 32 (52.5%) | 32 (52.5%) |
| 45 to 54 Years | 73 (25.8%) | 250 (88.3%) |
| 55 to 64 Years | 72 (57.1%) | 54 (42.9%) |
| 65 to 74 Years | 43 (100.0%) | 0 (0.0%) |
| 75 Years and over | 203 (100.0%) | 102 (50.2%) |
| Total | 572 (44.1%) | 821 (63.3%) |
Disability Status by Sex by Age in Tuolumne City
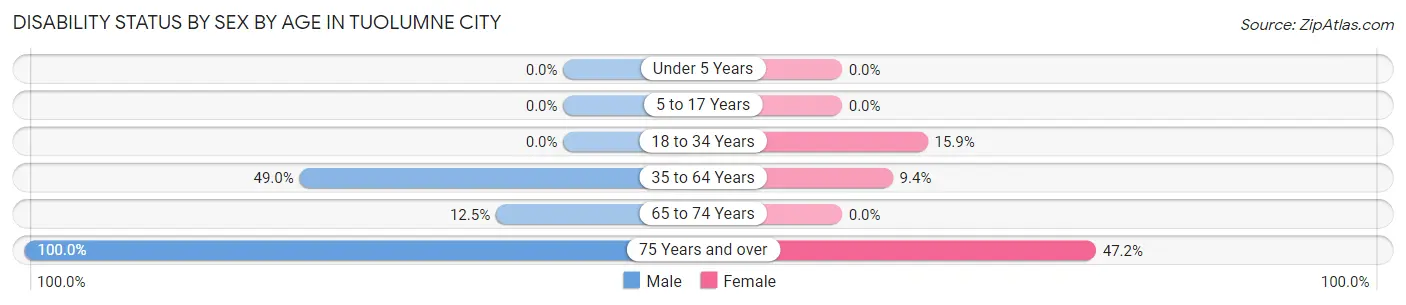
| Age Bracket | Male | Female |
| Under 5 Years | 0 (0.0%) | 0 (0.0%) |
| 5 to 17 Years | 0 (0.0%) | 0 (0.0%) |
| 18 to 34 Years | 0 (0.0%) | 28 (15.9%) |
| 35 to 64 Years | 142 (49.0%) | 17 (9.4%) |
| 65 to 74 Years | 3 (12.5%) | 0 (0.0%) |
| 75 Years and over | 10 (100.0%) | 91 (47.1%) |
Disability Class by Sex by Age in Tuolumne City
Disability Class: Hearing Difficulty
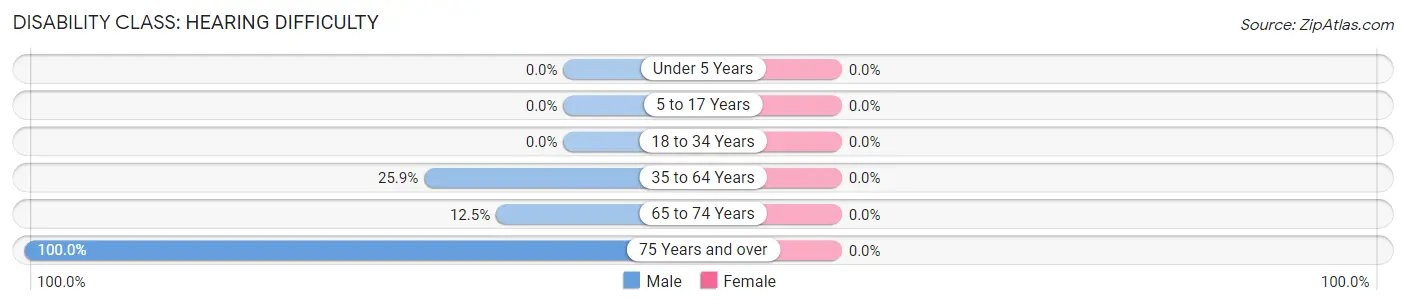
| Age Bracket | Male | Female |
| Under 5 Years | 0 (0.0%) | 0 (0.0%) |
| 5 to 17 Years | 0 (0.0%) | 0 (0.0%) |
| 18 to 34 Years | 0 (0.0%) | 0 (0.0%) |
| 35 to 64 Years | 75 (25.9%) | 0 (0.0%) |
| 65 to 74 Years | 3 (12.5%) | 0 (0.0%) |
| 75 Years and over | 10 (100.0%) | 0 (0.0%) |
Disability Class: Vision Difficulty
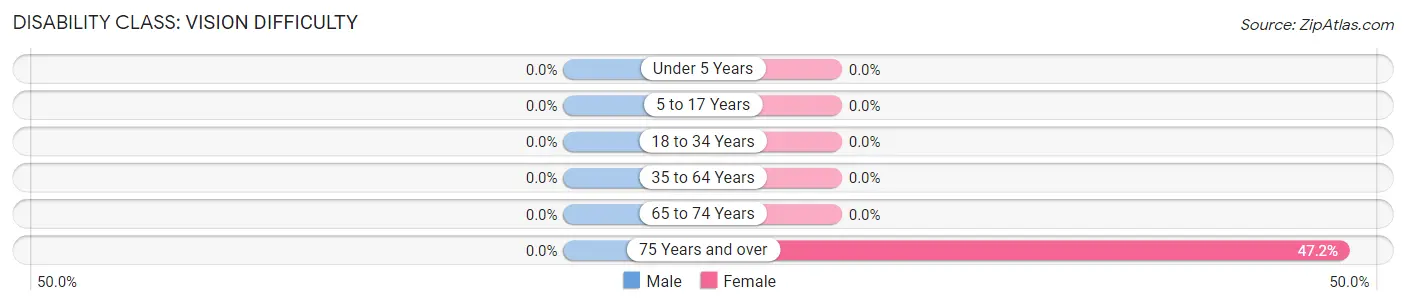
| Age Bracket | Male | Female |
| Under 5 Years | 0 (0.0%) | 0 (0.0%) |
| 5 to 17 Years | 0 (0.0%) | 0 (0.0%) |
| 18 to 34 Years | 0 (0.0%) | 0 (0.0%) |
| 35 to 64 Years | 0 (0.0%) | 0 (0.0%) |
| 65 to 74 Years | 0 (0.0%) | 0 (0.0%) |
| 75 Years and over | 0 (0.0%) | 91 (47.1%) |
Disability Class: Cognitive Difficulty
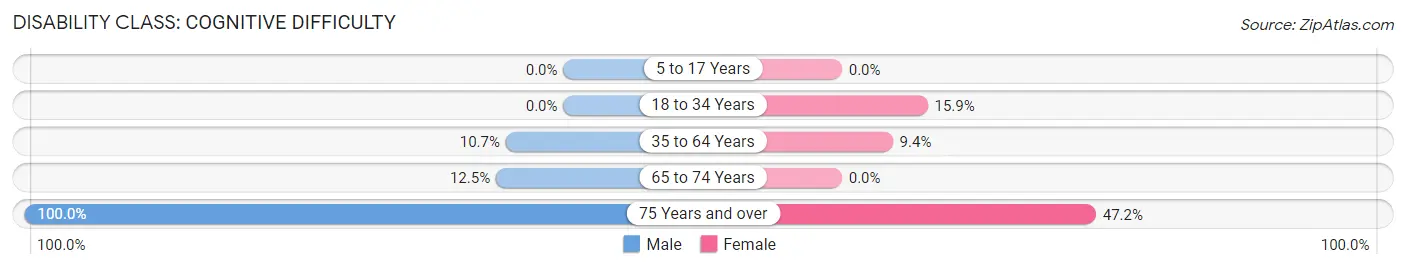
| Age Bracket | Male | Female |
| 5 to 17 Years | 0 (0.0%) | 0 (0.0%) |
| 18 to 34 Years | 0 (0.0%) | 28 (15.9%) |
| 35 to 64 Years | 31 (10.7%) | 17 (9.4%) |
| 65 to 74 Years | 3 (12.5%) | 0 (0.0%) |
| 75 Years and over | 10 (100.0%) | 91 (47.1%) |
Disability Class: Ambulatory Difficulty
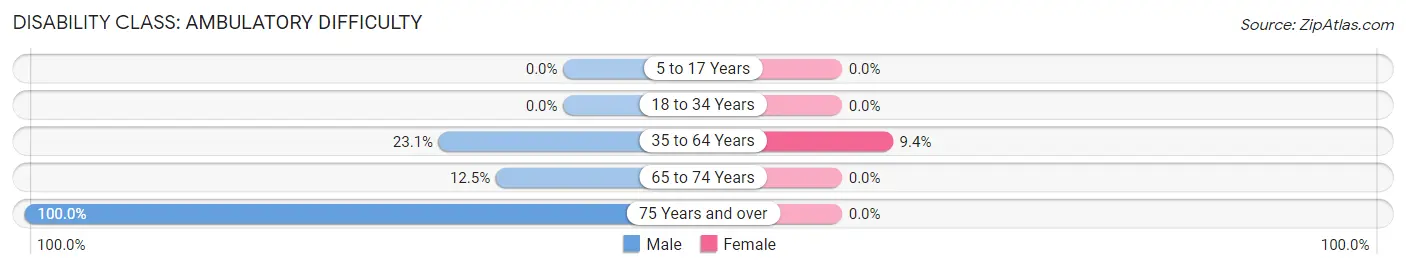
| Age Bracket | Male | Female |
| 5 to 17 Years | 0 (0.0%) | 0 (0.0%) |
| 18 to 34 Years | 0 (0.0%) | 0 (0.0%) |
| 35 to 64 Years | 67 (23.1%) | 17 (9.4%) |
| 65 to 74 Years | 3 (12.5%) | 0 (0.0%) |
| 75 Years and over | 10 (100.0%) | 0 (0.0%) |
Disability Class: Self-Care Difficulty
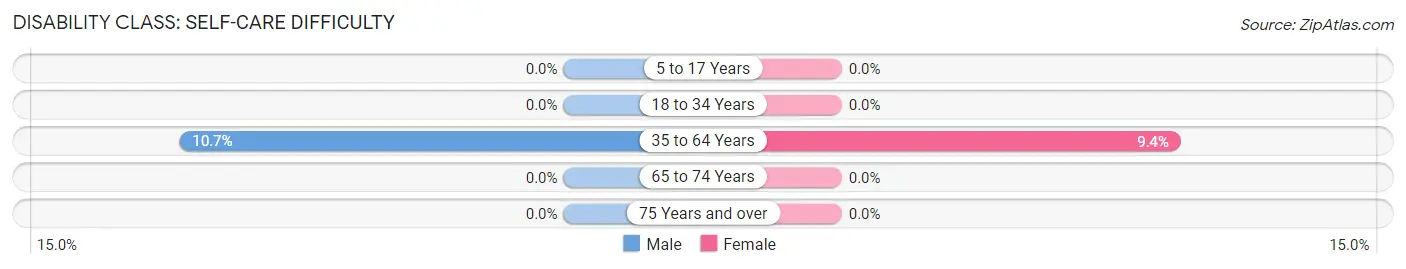
| Age Bracket | Male | Female |
| 5 to 17 Years | 0 (0.0%) | 0 (0.0%) |
| 18 to 34 Years | 0 (0.0%) | 0 (0.0%) |
| 35 to 64 Years | 31 (10.7%) | 17 (9.4%) |
| 65 to 74 Years | 0 (0.0%) | 0 (0.0%) |
| 75 Years and over | 0 (0.0%) | 0 (0.0%) |
Technology Access in Tuolumne City
Computing Device Access in Tuolumne City
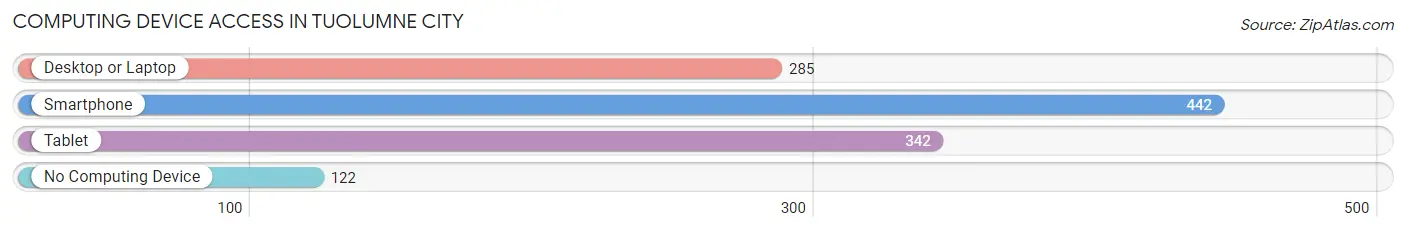
| Device Type | # Households | % Households |
| Desktop or Laptop | 285 | 50.5% |
| Smartphone | 442 | 78.4% |
| Tablet | 342 | 60.6% |
| No Computing Device | 122 | 21.6% |
| Total | 564 | 100.0% |
Internet Access in Tuolumne City
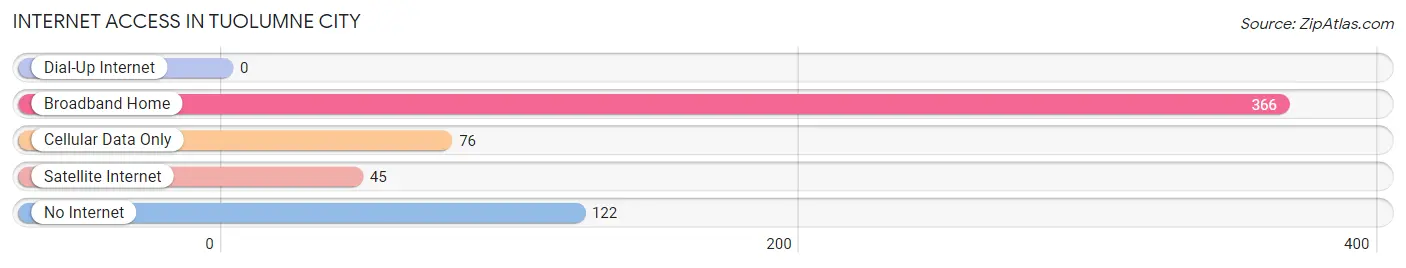
| Internet Type | # Households | % Households |
| Dial-Up Internet | 0 | 0.0% |
| Broadband Home | 366 | 64.9% |
| Cellular Data Only | 76 | 13.5% |
| Satellite Internet | 45 | 8.0% |
| No Internet | 122 | 21.6% |
| Total | 564 | 100.0% |
Tuolumne City Summary
Tuolumne City is a small town located in Tuolumne County, California. It is situated in the Sierra Nevada foothills, about 25 miles east of Sonora. The town was founded in 1851 and is the oldest settlement in the county. It is home to a population of approximately 1,500 people.
History
Tuolumne City was founded in 1851 by a group of miners who were searching for gold in the area. The town was originally called “Tuolumneville” and was the first settlement in the county. The town was named after the Tuolumne River, which runs through the area.
The town quickly grew and by 1852, it had a population of over 1,000 people. During this time, the town was a major hub for the gold mining industry in the area. It was also a popular stop for travelers heading to the gold fields in the Sierra Nevada.
In 1854, the town was renamed “Tuolumne City” and it was incorporated in 1855. During the late 1800s, the town was a major center for the timber industry. It was also a popular destination for tourists who wanted to experience the beauty of the Sierra Nevada.
In the early 1900s, the town began to decline as the gold and timber industries moved away. The population decreased and the town became a quiet, rural community.
Geography
Tuolumne City is located in the Sierra Nevada foothills, about 25 miles east of Sonora. The town is situated at an elevation of 1,890 feet and is surrounded by rolling hills and mountains. The town is located near the Tuolumne River, which runs through the area.
The climate in Tuolumne City is mild and temperate. The average high temperature in the summer is around 85 degrees Fahrenheit and the average low temperature in the winter is around 40 degrees Fahrenheit.
Economy
The economy of Tuolumne City is largely based on tourism. The town is a popular destination for outdoor enthusiasts who want to experience the beauty of the Sierra Nevada. The town is also home to several wineries and vineyards, which attract visitors from all over the world.
In addition to tourism, the town is also home to several small businesses. These businesses include restaurants, retail stores, and other services.
Demographics
As of the 2010 census, the population of Tuolumne City was 1,521. The racial makeup of the town was 94.3% White, 0.7% African American, 0.7% Native American, 0.7% Asian, 0.2% Pacific Islander, and 2.7% from other races. The median household income was $41,250 and the median family income was $50,000.
Conclusion
Tuolumne City is a small town located in Tuolumne County, California. It was founded in 1851 and is the oldest settlement in the county. The town is situated in the Sierra Nevada foothills and is a popular destination for outdoor enthusiasts. The economy of the town is largely based on tourism and small businesses. The population of Tuolumne City is 1,521 and the median household income is $41,250.
Common Questions
What is Per Capita Income in Tuolumne City?
Per Capita income in Tuolumne City is $27,519.
What is the Median Family Income in Tuolumne City?
Median Family Income in Tuolumne City is $82,292.
What is the Median Household income in Tuolumne City?
Median Household Income in Tuolumne City is $56,429.
What is Inequality or Gini Index in Tuolumne City?
Inequality or Gini Index in Tuolumne City is 0.35.
What is the Total Population of Tuolumne City?
Total Population of Tuolumne City is 1,297.
What is the Total Male Population of Tuolumne City?
Total Male Population of Tuolumne City is 572.
What is the Total Female Population of Tuolumne City?
Total Female Population of Tuolumne City is 725.
What is the Ratio of Males per 100 Females in Tuolumne City?
There are 78.90 Males per 100 Females in Tuolumne City.
What is the Ratio of Females per 100 Males in Tuolumne City?
There are 126.75 Females per 100 Males in Tuolumne City.
What is the Median Population Age in Tuolumne City?
Median Population Age in Tuolumne City is 45.2 Years.
What is the Average Family Size in Tuolumne City
Average Family Size in Tuolumne City is 3.9 People.
What is the Average Household Size in Tuolumne City
Average Household Size in Tuolumne City is 2.3 People.
How Large is the Labor Force in Tuolumne City?
There are 492 People in the Labor Forcein in Tuolumne City.
What is the Percentage of People in the Labor Force in Tuolumne City?
48.2% of People are in the Labor Force in Tuolumne City.