Fiddletown, CA Map & Demographics
Fiddletown Map
Fiddletown Overview
$19,900
PER CAPITA INCOME
0.60
INEQUALITY / GINI INDEX
56
TOTAL POPULATION
46
MALE POPULATION
10
FEMALE POPULATION
460.00
MALES / 100 FEMALES
21.74
FEMALES / 100 MALES
36.0
MEDIAN AGE
3.5
AVG FAMILY SIZE
1.2
AVG HOUSEHOLD SIZE
10
LABOR FORCE [ PEOPLE ]
17.9%
PERCENT IN LABOR FORCE
Fiddletown Zip Codes
Income in Fiddletown
Income Overview in Fiddletown
| Characteristic | Number | Measure |
| Per Capita Income | 56 | $19,900 |
| Median Family Income | 4 | $0 |
| Mean Family Income | 4 | $0 |
| Median Household Income | 46 | $0 |
| Mean Household Income | 46 | $0 |
| Income Deficit | 4 | $0 |
| Wage / Income Gap (%) | 56 | 0.00% |
| Wage / Income Gap ($) | 56 | 100.00¢ per $1 |
| Gini / Inequality Index | 56 | 0.60 |
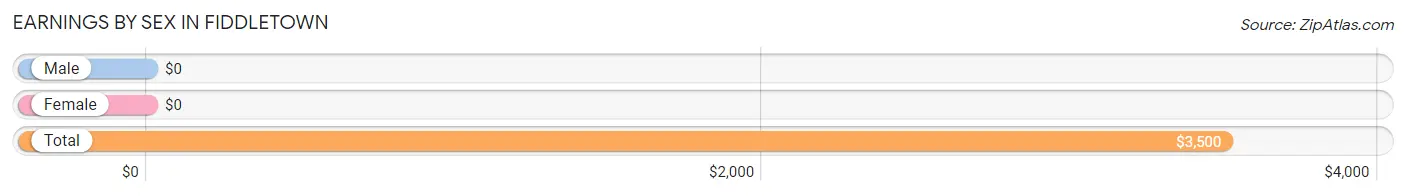
Earnings by Sex in Fiddletown
| Sex | Number | Average Earnings |
| Male | 20 (66.7%) | $0 |
| Female | 10 (33.3%) | $0 |
| Total | 30 (100.0%) | $3,500 |
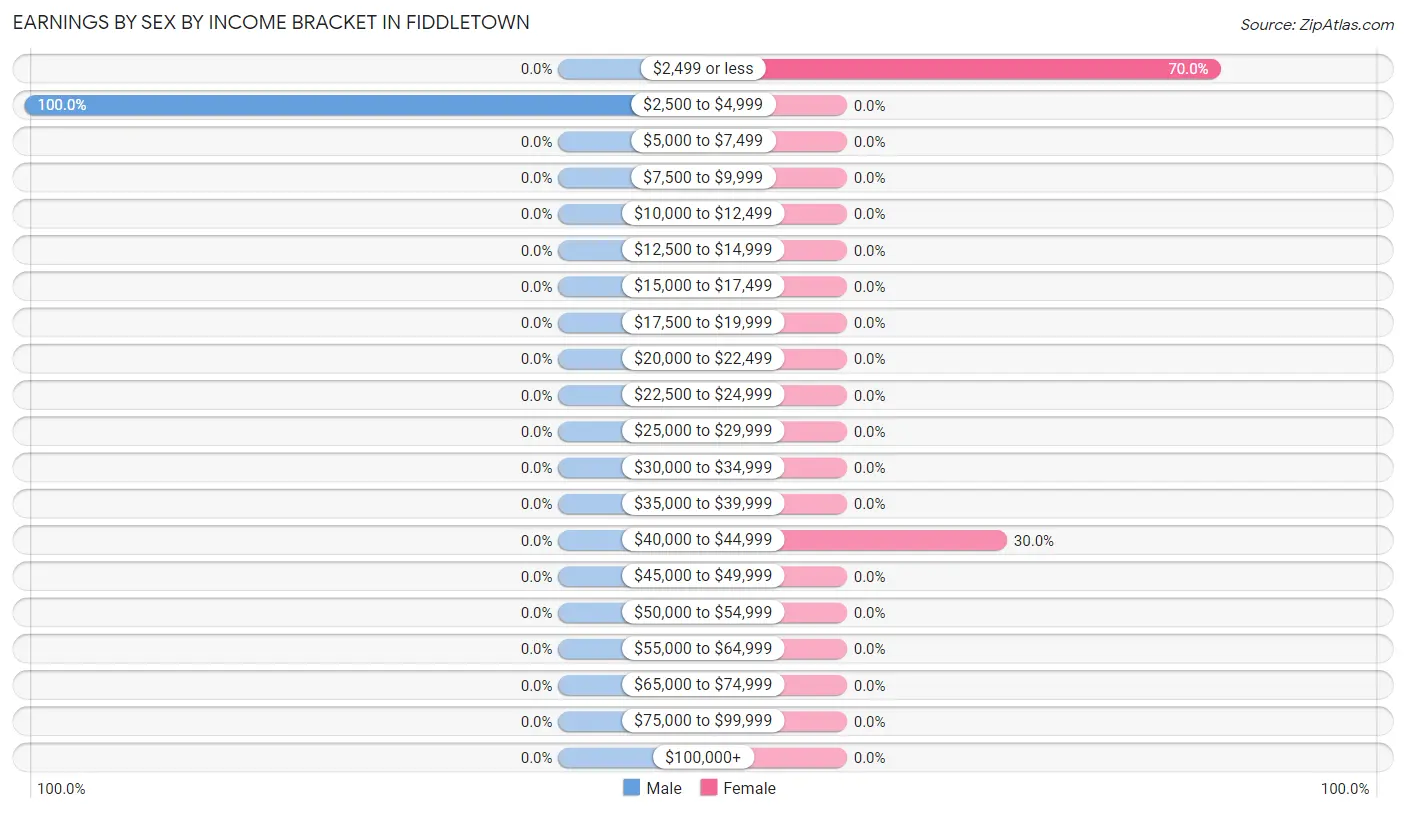
Earnings by Sex by Income Bracket in Fiddletown
The most common earnings brackets in Fiddletown are $2,500 to $4,999 for men (20 | 100.0%) and $2,499 or less for women (7 | 70.0%).
| Income | Male | Female |
| $2,499 or less | 0 (0.0%) | 7 (70.0%) |
| $2,500 to $4,999 | 20 (100.0%) | 0 (0.0%) |
| $5,000 to $7,499 | 0 (0.0%) | 0 (0.0%) |
| $7,500 to $9,999 | 0 (0.0%) | 0 (0.0%) |
| $10,000 to $12,499 | 0 (0.0%) | 0 (0.0%) |
| $12,500 to $14,999 | 0 (0.0%) | 0 (0.0%) |
| $15,000 to $17,499 | 0 (0.0%) | 0 (0.0%) |
| $17,500 to $19,999 | 0 (0.0%) | 0 (0.0%) |
| $20,000 to $22,499 | 0 (0.0%) | 0 (0.0%) |
| $22,500 to $24,999 | 0 (0.0%) | 0 (0.0%) |
| $25,000 to $29,999 | 0 (0.0%) | 0 (0.0%) |
| $30,000 to $34,999 | 0 (0.0%) | 0 (0.0%) |
| $35,000 to $39,999 | 0 (0.0%) | 0 (0.0%) |
| $40,000 to $44,999 | 0 (0.0%) | 3 (30.0%) |
| $45,000 to $49,999 | 0 (0.0%) | 0 (0.0%) |
| $50,000 to $54,999 | 0 (0.0%) | 0 (0.0%) |
| $55,000 to $64,999 | 0 (0.0%) | 0 (0.0%) |
| $65,000 to $74,999 | 0 (0.0%) | 0 (0.0%) |
| $75,000 to $99,999 | 0 (0.0%) | 0 (0.0%) |
| $100,000+ | 0 (0.0%) | 0 (0.0%) |
| Total | 20 (100.0%) | 10 (100.0%) |
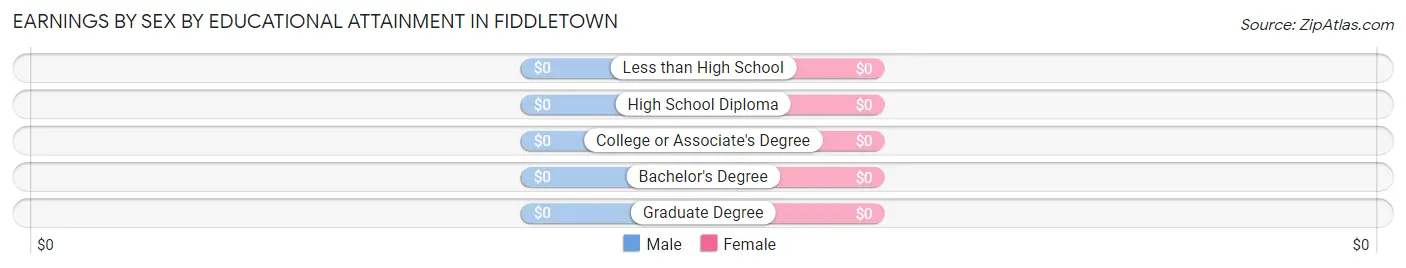
Earnings by Sex by Educational Attainment in Fiddletown
| Educational Attainment | Male Income | Female Income |
| Less than High School | - | - |
| High School Diploma | - | - |
| College or Associate's Degree | - | - |
| Bachelor's Degree | - | - |
| Graduate Degree | - | - |
| Total | - | - |
Family Income in Fiddletown
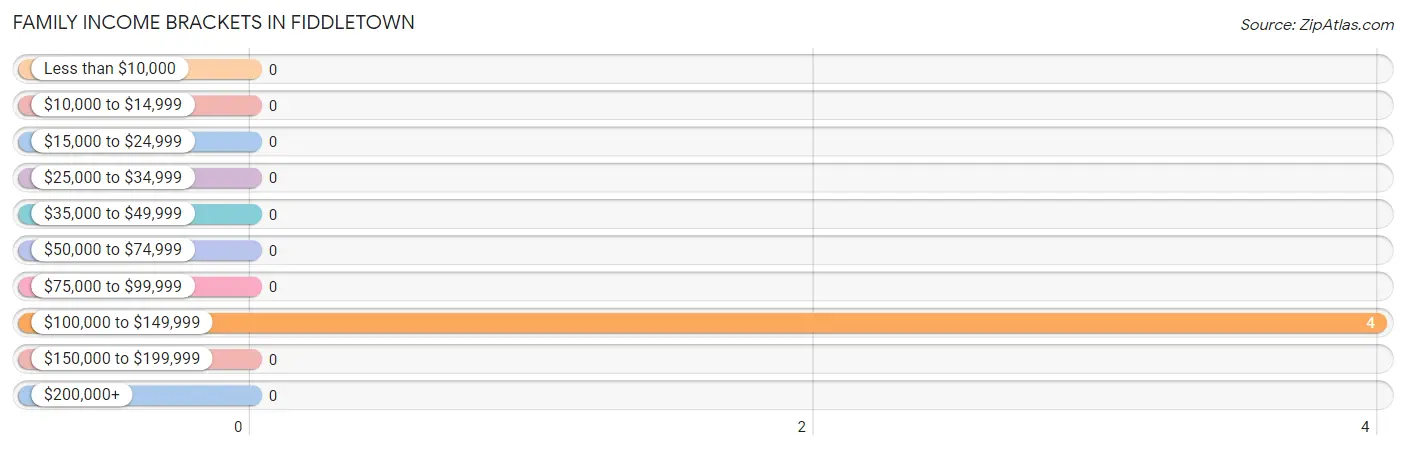
Family Income Brackets in Fiddletown
According to the Fiddletown family income data, there are 4 families falling into the $100,000 to $149,999 income range, which is the most common income bracket and makes up 100.0% of all families.
| Income Bracket | # Families | % Families |
| Less than $10,000 | 0 | 0.0% |
| $10,000 to $14,999 | 0 | 0.0% |
| $15,000 to $24,999 | 0 | 0.0% |
| $25,000 to $34,999 | 0 | 0.0% |
| $35,000 to $49,999 | 0 | 0.0% |
| $50,000 to $74,999 | 0 | 0.0% |
| $75,000 to $99,999 | 0 | 0.0% |
| $100,000 to $149,999 | 4 | 100.0% |
| $150,000 to $199,999 | 0 | 0.0% |
| $200,000+ | 0 | 0.0% |
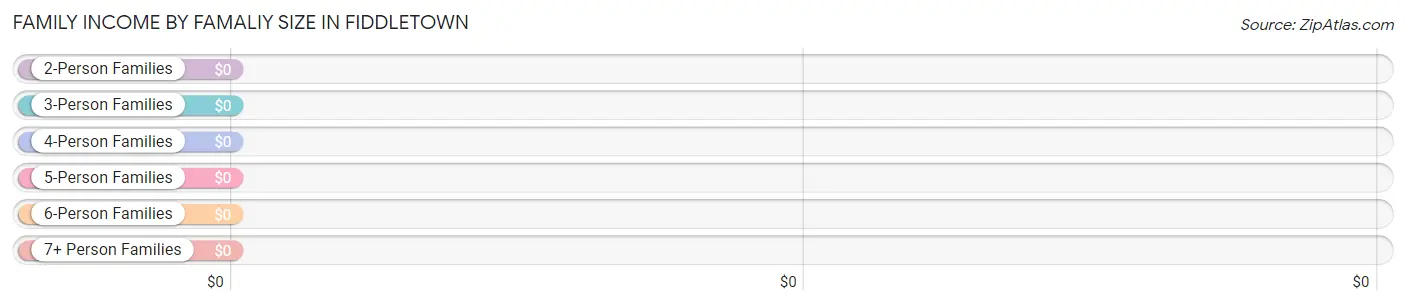
Family Income by Famaliy Size in Fiddletown
| Income Bracket | # Families | Median Income |
| 2-Person Families | 0 (0.0%) | $0 |
| 3-Person Families | 4 (100.0%) | $0 |
| 4-Person Families | 0 (0.0%) | $0 |
| 5-Person Families | 0 (0.0%) | $0 |
| 6-Person Families | 0 (0.0%) | $0 |
| 7+ Person Families | 0 (0.0%) | $0 |
| Total | 4 (100.0%) | $0 |
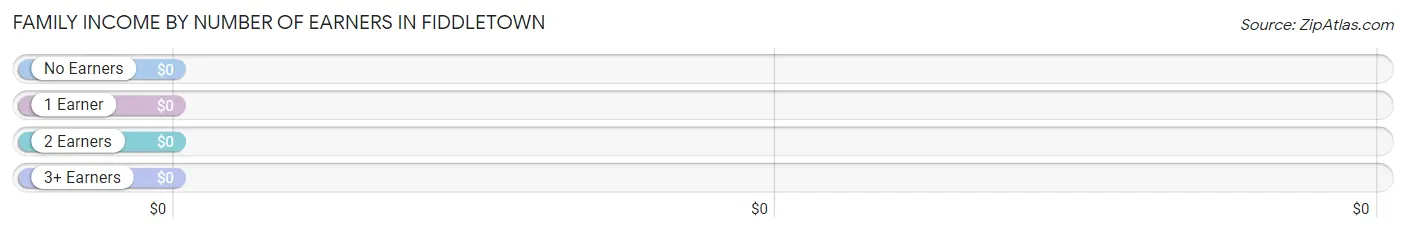
Family Income by Number of Earners in Fiddletown
| Number of Earners | # Families | Median Income |
| No Earners | 0 (0.0%) | $0 |
| 1 Earner | 0 (0.0%) | $0 |
| 2 Earners | 4 (100.0%) | $0 |
| 3+ Earners | 0 (0.0%) | $0 |
| Total | 4 (100.0%) | $0 |
Household Income in Fiddletown
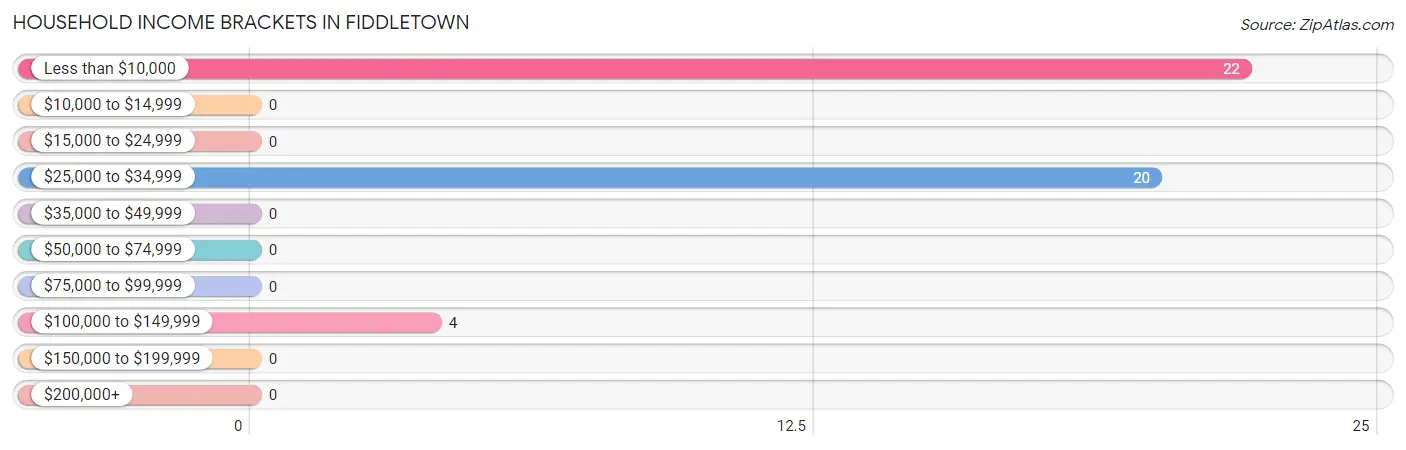
Household Income Brackets in Fiddletown
With 22 households falling in the category, the less than $10,000 income range is the most frequent in Fiddletown, accounting for 47.8% of all households.
| Income Bracket | # Households | % Households |
| Less than $10,000 | 22 | 47.8% |
| $10,000 to $14,999 | 0 | 0.0% |
| $15,000 to $24,999 | 0 | 0.0% |
| $25,000 to $34,999 | 20 | 43.5% |
| $35,000 to $49,999 | 0 | 0.0% |
| $50,000 to $74,999 | 0 | 0.0% |
| $75,000 to $99,999 | 0 | 0.0% |
| $100,000 to $149,999 | 4 | 8.7% |
| $150,000 to $199,999 | 0 | 0.0% |
| $200,000+ | 0 | 0.0% |
Household Income by Householder Age in Fiddletown
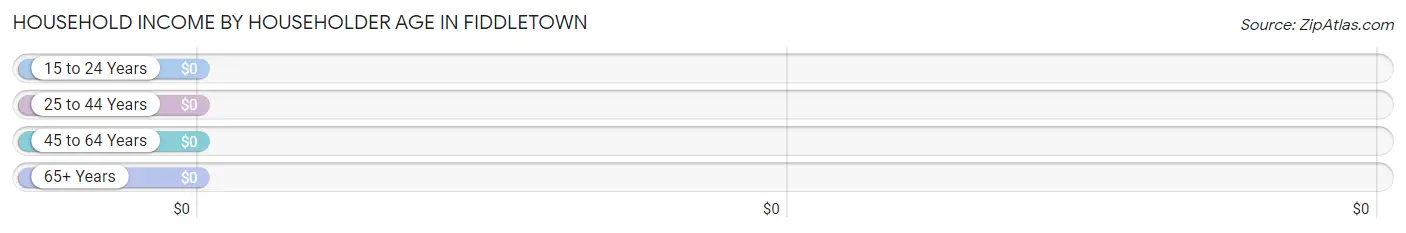
| Income Bracket | # Households | Median Income |
| 15 to 24 Years | 0 (0.0%) | $0 |
| 25 to 44 Years | 22 (47.8%) | $0 |
| 45 to 64 Years | 0 (0.0%) | $0 |
| 65+ Years | 24 (52.2%) | $0 |
| Total | 46 (100.0%) | $0 |
Poverty in Fiddletown
Income Below Poverty by Sex and Age in Fiddletown
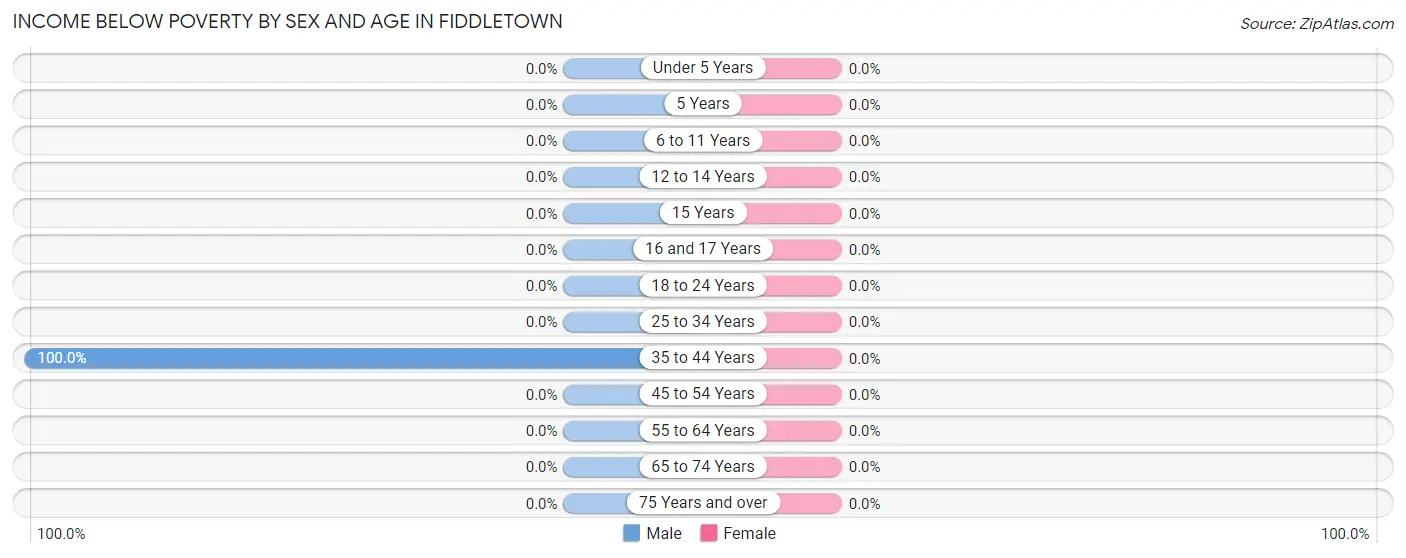
| Age Bracket | Male | Female |
| Under 5 Years | 0 (0.0%) | 0 (0.0%) |
| 5 Years | 0 (0.0%) | 0 (0.0%) |
| 6 to 11 Years | 0 (0.0%) | 0 (0.0%) |
| 12 to 14 Years | 0 (0.0%) | 0 (0.0%) |
| 15 Years | 0 (0.0%) | 0 (0.0%) |
| 16 and 17 Years | 0 (0.0%) | 0 (0.0%) |
| 18 to 24 Years | 0 (0.0%) | 0 (0.0%) |
| 25 to 34 Years | 0 (0.0%) | 0 (0.0%) |
| 35 to 44 Years | 22 (100.0%) | 0 (0.0%) |
| 45 to 54 Years | 0 (0.0%) | 0 (0.0%) |
| 55 to 64 Years | 0 (0.0%) | 0 (0.0%) |
| 65 to 74 Years | 0 (0.0%) | 0 (0.0%) |
| 75 Years and over | 0 (0.0%) | 0 (0.0%) |
| Total | 22 (47.8%) | 0 (0.0%) |
Income Above Poverty by Sex and Age in Fiddletown
According to the poverty statistics in Fiddletown, males aged 65 to 74 years and females aged 25 to 34 years are the age groups that are most secure financially, with 100.0% of males and 100.0% of females in these age groups living above the poverty line.
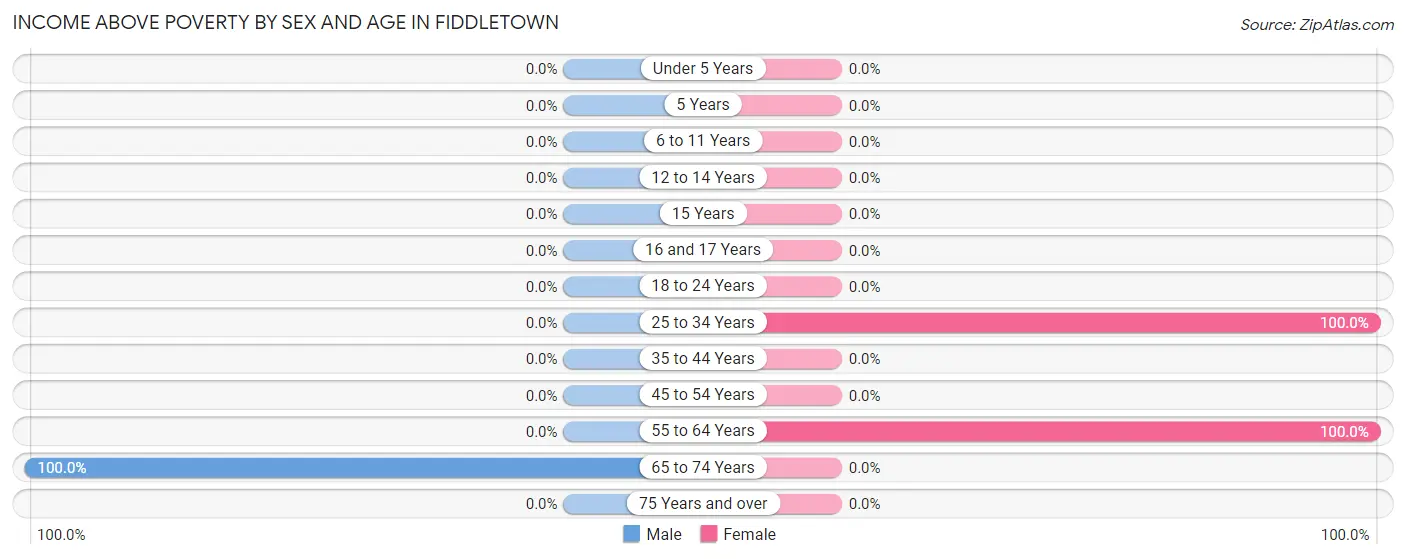
| Age Bracket | Male | Female |
| Under 5 Years | 0 (0.0%) | 0 (0.0%) |
| 5 Years | 0 (0.0%) | 0 (0.0%) |
| 6 to 11 Years | 0 (0.0%) | 0 (0.0%) |
| 12 to 14 Years | 0 (0.0%) | 0 (0.0%) |
| 15 Years | 0 (0.0%) | 0 (0.0%) |
| 16 and 17 Years | 0 (0.0%) | 0 (0.0%) |
| 18 to 24 Years | 0 (0.0%) | 0 (0.0%) |
| 25 to 34 Years | 0 (0.0%) | 7 (100.0%) |
| 35 to 44 Years | 0 (0.0%) | 0 (0.0%) |
| 45 to 54 Years | 0 (0.0%) | 0 (0.0%) |
| 55 to 64 Years | 0 (0.0%) | 3 (100.0%) |
| 65 to 74 Years | 24 (100.0%) | 0 (0.0%) |
| 75 Years and over | 0 (0.0%) | 0 (0.0%) |
| Total | 24 (52.2%) | 10 (100.0%) |
Income Below Poverty Among Married-Couple Families in Fiddletown
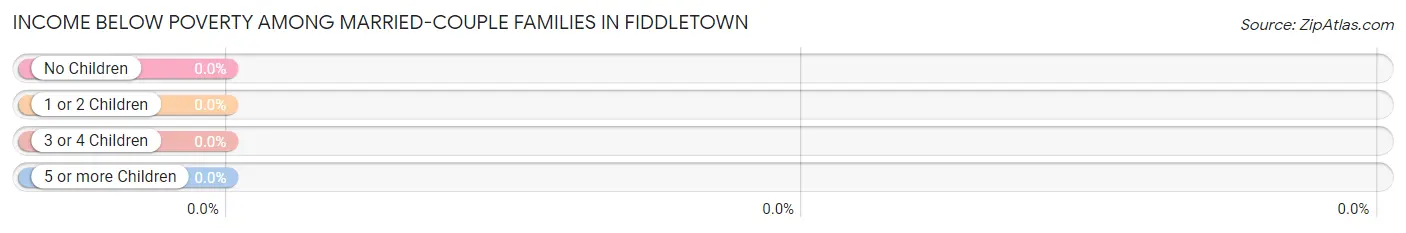
| Children | Above Poverty | Below Poverty |
| No Children | 4 (100.0%) | 0 (0.0%) |
| 1 or 2 Children | 0 (0.0%) | 0 (0.0%) |
| 3 or 4 Children | 0 (0.0%) | 0 (0.0%) |
| 5 or more Children | 0 (0.0%) | 0 (0.0%) |
| Total | 4 (100.0%) | 0 (0.0%) |
Income Below Poverty Among Single-Parent Households in Fiddletown
| Children | Single Father | Single Mother |
| No Children | 0 (0.0%) | 0 (0.0%) |
| 1 or 2 Children | 0 (0.0%) | 0 (0.0%) |
| 3 or 4 Children | 0 (0.0%) | 0 (0.0%) |
| 5 or more Children | 0 (0.0%) | 0 (0.0%) |
| Total | 0 (0.0%) | 0 (0.0%) |
Income Below Poverty Among Married-Couple vs Single-Parent Households in Fiddletown
| Children | Married-Couple Families | Single-Parent Households |
| No Children | 0 (0.0%) | 0 (0.0%) |
| 1 or 2 Children | 0 (0.0%) | 0 (0.0%) |
| 3 or 4 Children | 0 (0.0%) | 0 (0.0%) |
| 5 or more Children | 0 (0.0%) | 0 (0.0%) |
| Total | 0 (0.0%) | 0 (0.0%) |
Race in Fiddletown
The most populous races in Fiddletown are , and White / Caucasian (56 | 100.0%).
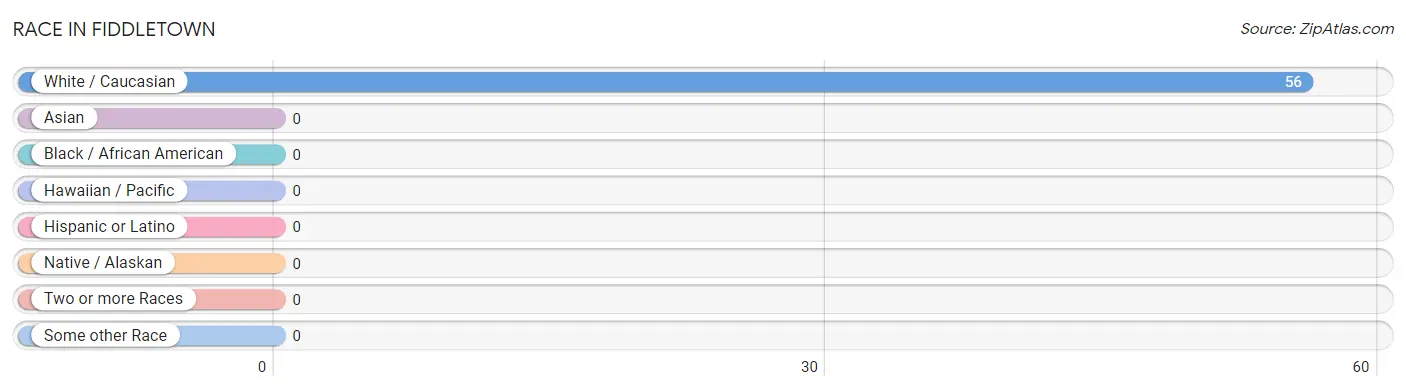
| Race | # Population | % Population |
| Asian | 0 | 0.0% |
| Black / African American | 0 | 0.0% |
| Hawaiian / Pacific | 0 | 0.0% |
| Hispanic or Latino | 0 | 0.0% |
| Native / Alaskan | 0 | 0.0% |
| White / Caucasian | 56 | 100.0% |
| Two or more Races | 0 | 0.0% |
| Some other Race | 0 | 0.0% |
| Total | 56 | 100.0% |
Ancestry in Fiddletown
The most populous ancestries reported in Fiddletown are Norwegian (20 | 35.7%), English (14 | 25.0%), Irish (10 | 17.9%), and Scotch-Irish (4 | 7.1%), together accounting for 85.7% of all Fiddletown residents.
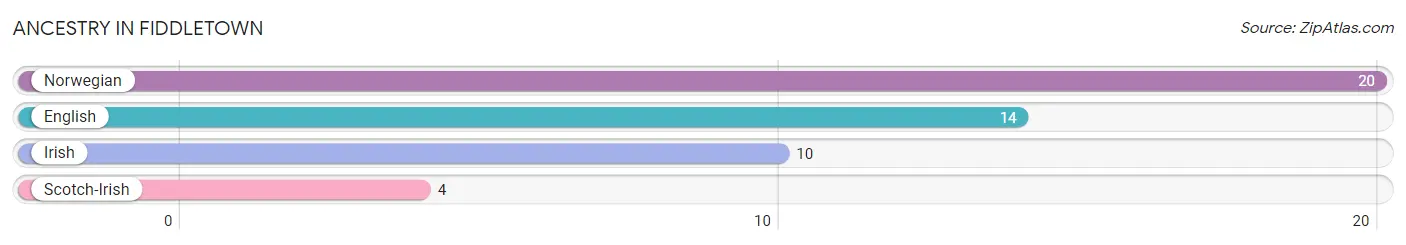
| Ancestry | # Population | % Population |
| English | 14 | 25.0% |
| Irish | 10 | 17.9% |
| Norwegian | 20 | 35.7% |
| Scotch-Irish | 4 | 7.1% | View All 4 Rows |
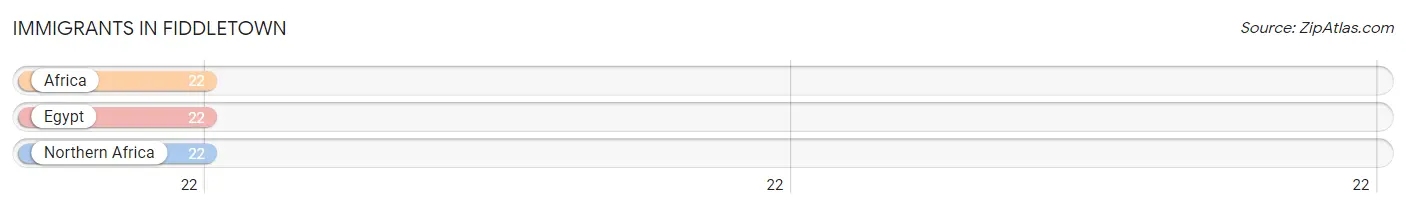
Immigrants in Fiddletown
The most numerous immigrant groups reported in Fiddletown came from Africa (22 | 39.3%), Egypt (22 | 39.3%), and Northern Africa (22 | 39.3%), together accounting for 117.9% of all Fiddletown residents.
| Immigration Origin | # Population | % Population |
| Africa | 22 | 39.3% |
| Egypt | 22 | 39.3% |
| Northern Africa | 22 | 39.3% | View All 3 Rows |
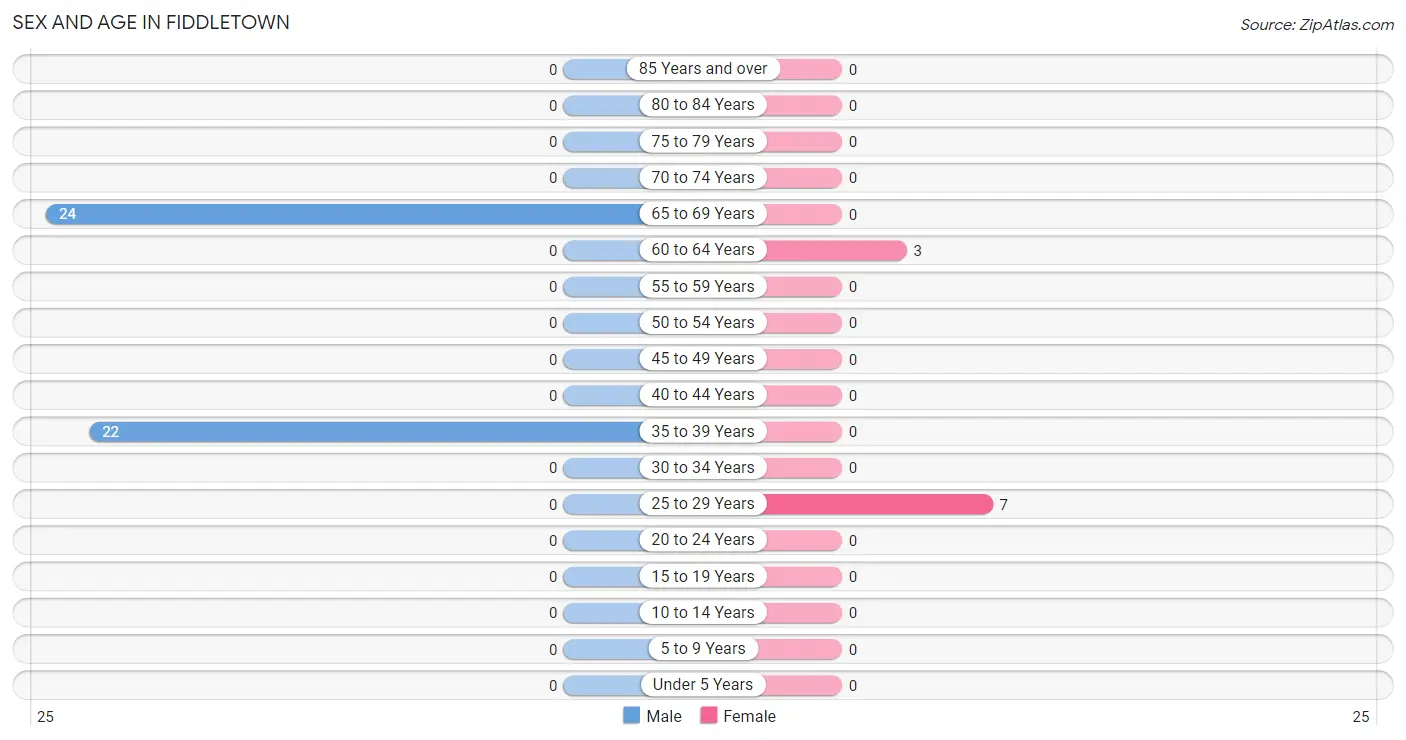
Sex and Age in Fiddletown
Sex and Age in Fiddletown
The most populous age groups in Fiddletown are 65 to 69 Years (24 | 52.2%) for men and 25 to 29 Years (7 | 70.0%) for women.
| Age Bracket | Male | Female |
| Under 5 Years | 0 (0.0%) | 0 (0.0%) |
| 5 to 9 Years | 0 (0.0%) | 0 (0.0%) |
| 10 to 14 Years | 0 (0.0%) | 0 (0.0%) |
| 15 to 19 Years | 0 (0.0%) | 0 (0.0%) |
| 20 to 24 Years | 0 (0.0%) | 0 (0.0%) |
| 25 to 29 Years | 0 (0.0%) | 7 (70.0%) |
| 30 to 34 Years | 0 (0.0%) | 0 (0.0%) |
| 35 to 39 Years | 22 (47.8%) | 0 (0.0%) |
| 40 to 44 Years | 0 (0.0%) | 0 (0.0%) |
| 45 to 49 Years | 0 (0.0%) | 0 (0.0%) |
| 50 to 54 Years | 0 (0.0%) | 0 (0.0%) |
| 55 to 59 Years | 0 (0.0%) | 0 (0.0%) |
| 60 to 64 Years | 0 (0.0%) | 3 (30.0%) |
| 65 to 69 Years | 24 (52.2%) | 0 (0.0%) |
| 70 to 74 Years | 0 (0.0%) | 0 (0.0%) |
| 75 to 79 Years | 0 (0.0%) | 0 (0.0%) |
| 80 to 84 Years | 0 (0.0%) | 0 (0.0%) |
| 85 Years and over | 0 (0.0%) | 0 (0.0%) |
| Total | 46 (100.0%) | 10 (100.0%) |
Families and Households in Fiddletown
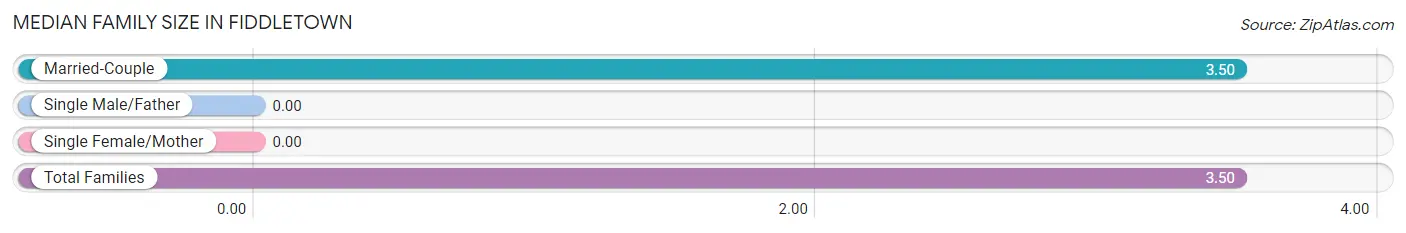
Median Family Size in Fiddletown
| Family Type | # Families | Family Size |
| Married-Couple | 4 (100.0%) | 3.50 |
| Single Male/Father | 0 (0.0%) | - |
| Single Female/Mother | 0 (0.0%) | - |
| Total Families | 4 (100.0%) | 3.50 |
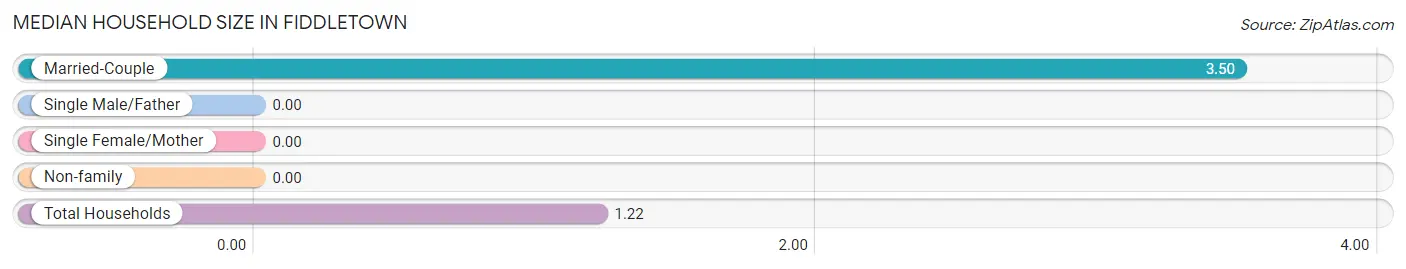
Median Household Size in Fiddletown
| Household Type | # Households | Household Size |
| Married-Couple | 4 (8.7%) | 3.50 |
| Single Male/Father | 0 (0.0%) | - |
| Single Female/Mother | 0 (0.0%) | - |
| Non-family | 42 (91.3%) | - |
| Total Households | 46 (100.0%) | 1.22 |
Household Size by Marriage Status in Fiddletown
Out of a total of 46 households in Fiddletown, 4 (8.7%) are family households, while 42 (91.3%) are nonfamily households. The most numerous type of family households are 3-person households, comprising 4, and the most common type of nonfamily households are 1-person households, comprising 42.
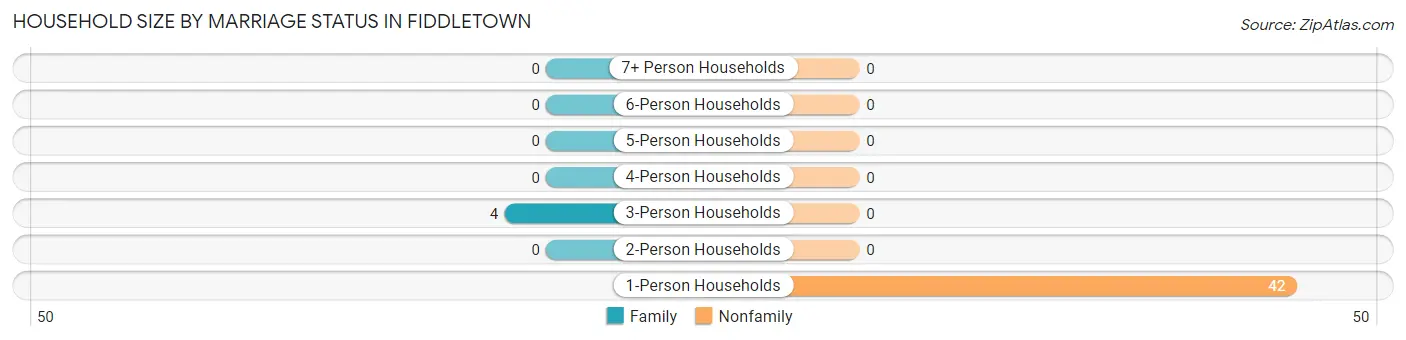
| Household Size | Family Households | Nonfamily Households |
| 1-Person Households | - | 42 (91.3%) |
| 2-Person Households | 0 (0.0%) | 0 (0.0%) |
| 3-Person Households | 4 (8.7%) | 0 (0.0%) |
| 4-Person Households | 0 (0.0%) | 0 (0.0%) |
| 5-Person Households | 0 (0.0%) | 0 (0.0%) |
| 6-Person Households | 0 (0.0%) | 0 (0.0%) |
| 7+ Person Households | 0 (0.0%) | 0 (0.0%) |
| Total | 4 (8.7%) | 42 (91.3%) |
Female Fertility in Fiddletown
Fertility by Age in Fiddletown
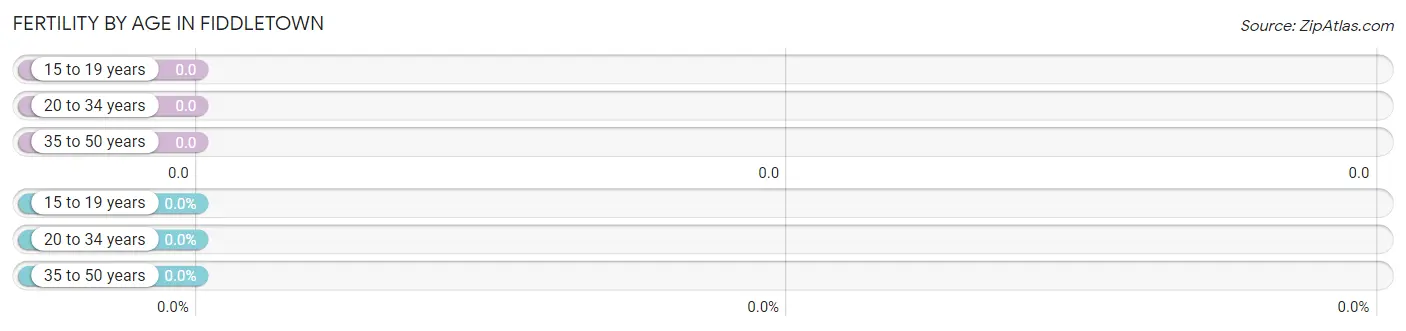
| Age Bracket | Women with Births | Births / 1,000 Women |
| 15 to 19 years | 0 (0.0%) | 0.0 |
| 20 to 34 years | 0 (0.0%) | 0.0 |
| 35 to 50 years | 0 (0.0%) | 0.0 |
| Total | 0 (0.0%) | 0.0 |
Fertility by Age by Marriage Status in Fiddletown
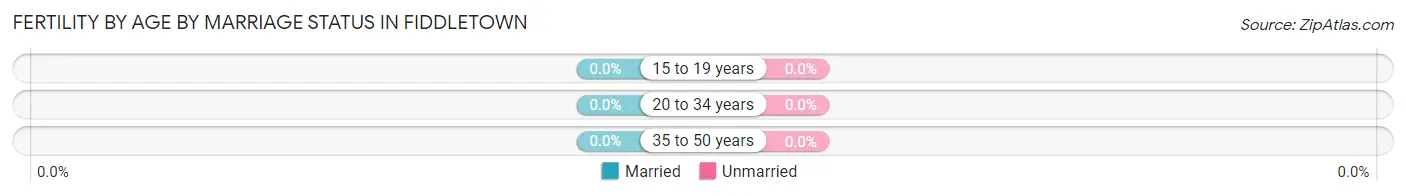
| Age Bracket | Married | Unmarried |
| 15 to 19 years | 0 (0.0%) | 0 (0.0%) |
| 20 to 34 years | 0 (0.0%) | 0 (0.0%) |
| 35 to 50 years | 0 (0.0%) | 0 (0.0%) |
| Total | 0 (0.0%) | 0 (0.0%) |
Fertility by Education in Fiddletown
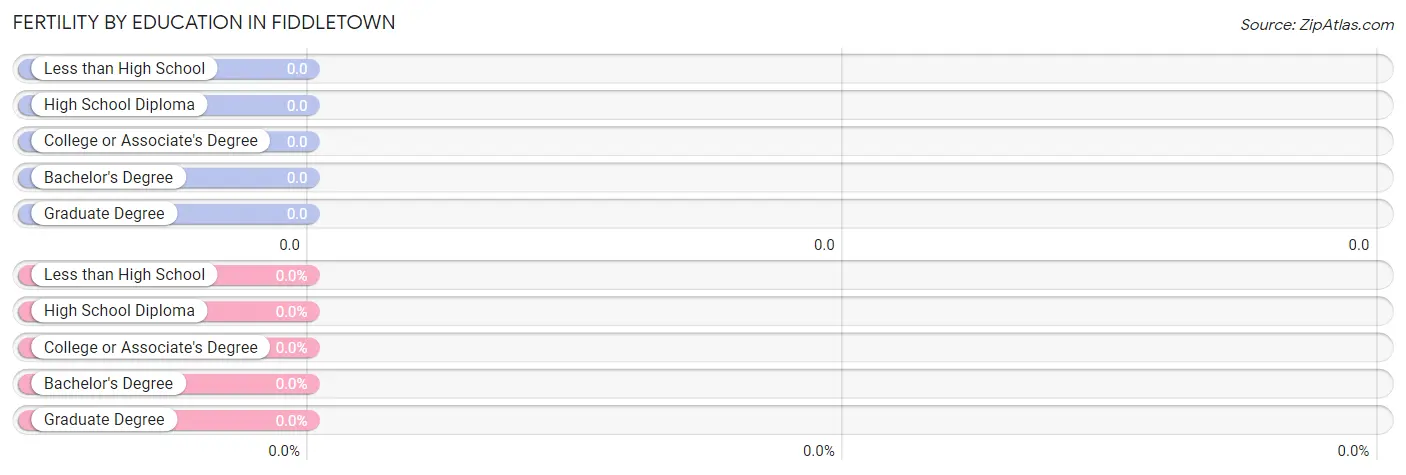
| Educational Attainment | Women with Births | Births / 1,000 Women |
| Less than High School | 0 (0.0%) | 0.0 |
| High School Diploma | 0 (0.0%) | 0.0 |
| College or Associate's Degree | 0 (0.0%) | 0.0 |
| Bachelor's Degree | 0 (0.0%) | 0.0 |
| Graduate Degree | 0 (0.0%) | 0.0 |
| Total | 0 (0.0%) | 0.0 |
Fertility by Education by Marriage Status in Fiddletown

| Educational Attainment | Married | Unmarried |
| Less than High School | 0 (0.0%) | 0 (0.0%) |
| High School Diploma | 0 (0.0%) | 0 (0.0%) |
| College or Associate's Degree | 0 (0.0%) | 0 (0.0%) |
| Bachelor's Degree | 0 (0.0%) | 0 (0.0%) |
| Graduate Degree | 0 (0.0%) | 0 (0.0%) |
| Total | 0 (0.0%) | 0 (0.0%) |
Employment Characteristics in Fiddletown
Employment by Class of Employer in Fiddletown
Among the 10 employed individuals in Fiddletown, private company employees (7 | 70.0%), and not-for-profit organizations (3 | 30.0%) make up the most common classes of employment.
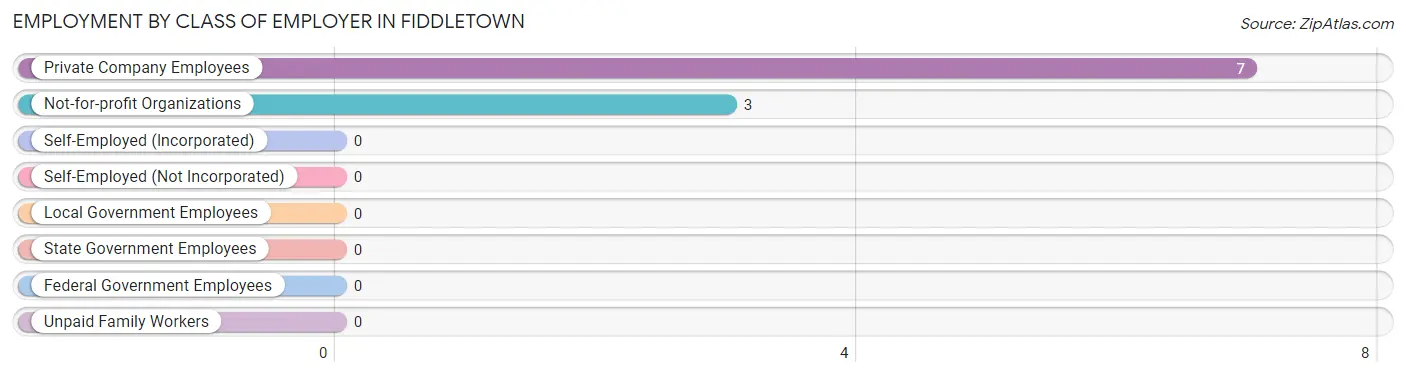
| Employer Class | # Employees | % Employees |
| Private Company Employees | 7 | 70.0% |
| Self-Employed (Incorporated) | 0 | 0.0% |
| Self-Employed (Not Incorporated) | 0 | 0.0% |
| Not-for-profit Organizations | 3 | 30.0% |
| Local Government Employees | 0 | 0.0% |
| State Government Employees | 0 | 0.0% |
| Federal Government Employees | 0 | 0.0% |
| Unpaid Family Workers | 0 | 0.0% |
| Total | 10 | 100.0% |
Employment Status by Age in Fiddletown
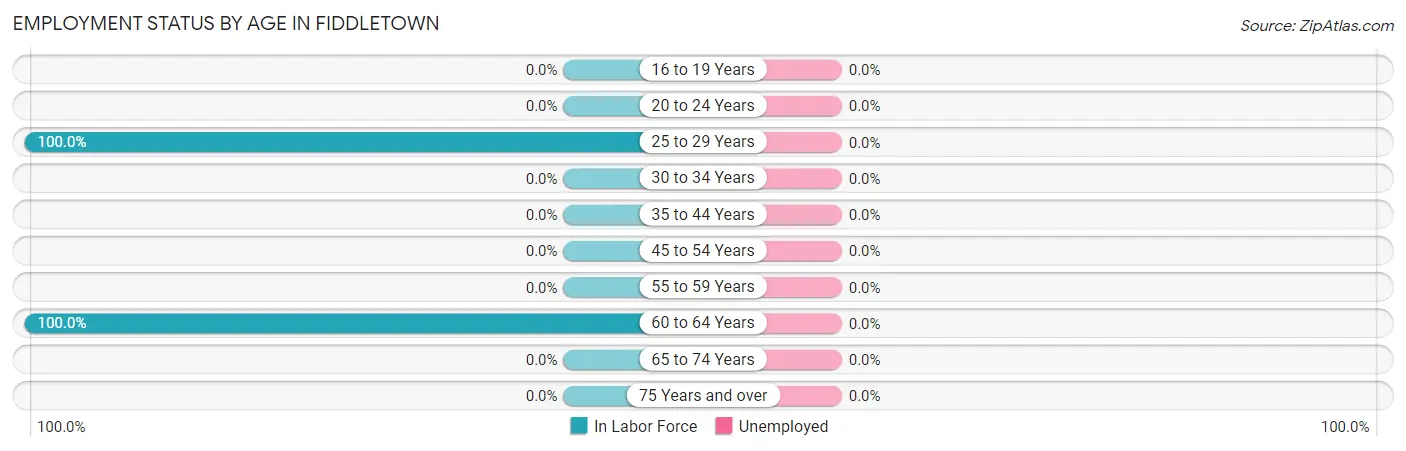
| Age Bracket | In Labor Force | Unemployed |
| 16 to 19 Years | 0 (0.0%) | 0 (0.0%) |
| 20 to 24 Years | 0 (0.0%) | 0 (0.0%) |
| 25 to 29 Years | 7 (100.0%) | 0 (0.0%) |
| 30 to 34 Years | 0 (0.0%) | 0 (0.0%) |
| 35 to 44 Years | 0 (0.0%) | 0 (0.0%) |
| 45 to 54 Years | 0 (0.0%) | 0 (0.0%) |
| 55 to 59 Years | 0 (0.0%) | 0 (0.0%) |
| 60 to 64 Years | 3 (100.0%) | 0 (0.0%) |
| 65 to 74 Years | 0 (0.0%) | 0 (0.0%) |
| 75 Years and over | 0 (0.0%) | 0 (0.0%) |
| Total | 10 (17.9%) | 0 (0.0%) |
Employment Status by Educational Attainment in Fiddletown
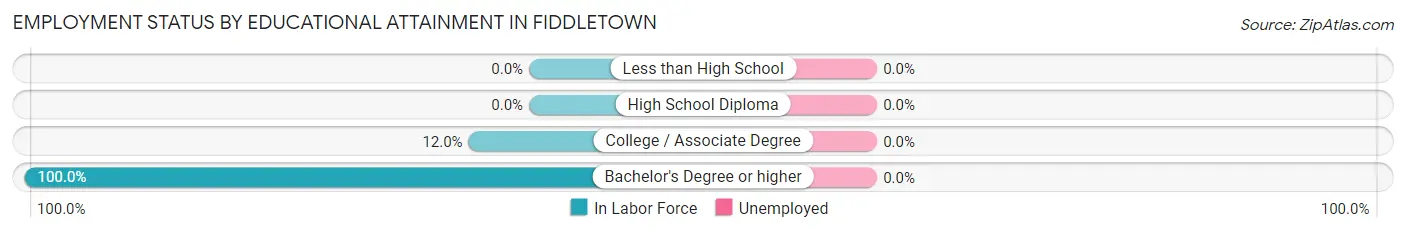
| Educational Attainment | In Labor Force | Unemployed |
| Less than High School | 0 (0.0%) | 0 (0.0%) |
| High School Diploma | 0 (0.0%) | 0 (0.0%) |
| College / Associate Degree | 3 (12.0%) | 0 (0.0%) |
| Bachelor's Degree or higher | 7 (100.0%) | 0 (0.0%) |
| Total | 10 (31.3%) | 0 (0.0%) |
Employment Occupations by Sex in Fiddletown
Management, Business, Science and Arts Occupations
The most common Management, Business, Science and Arts occupations in Fiddletown are , and Business & Financial (7 | 70.0%).
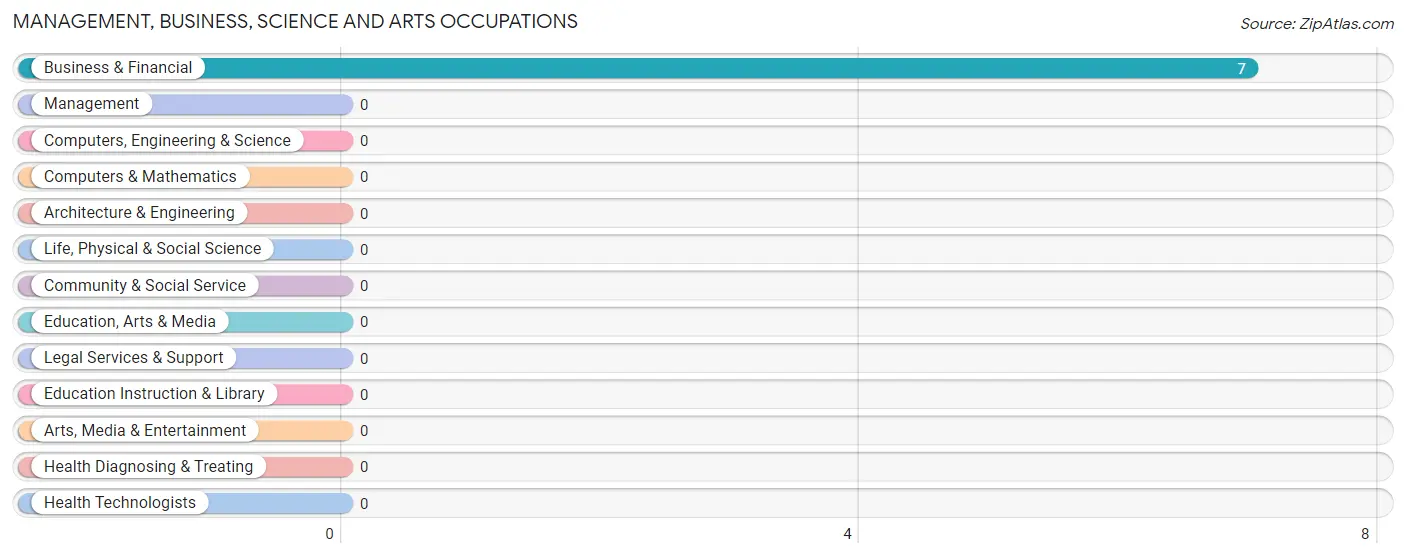
Management, Business, Science and Arts Occupations by Sex
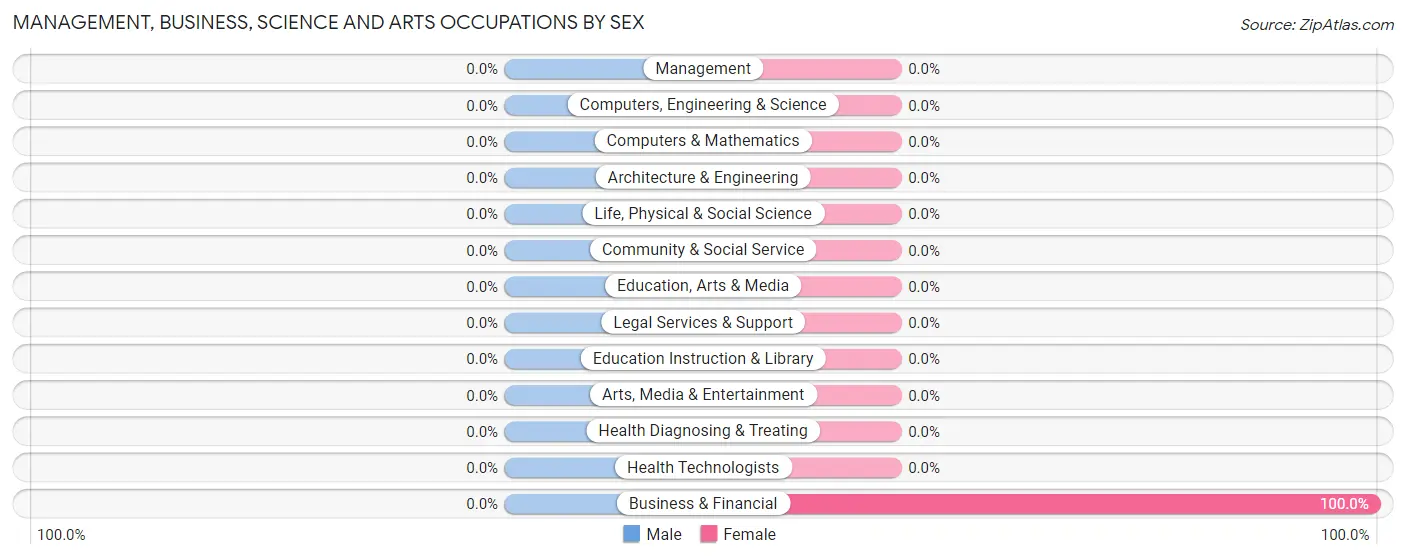
| Occupation | Male | Female |
| Management | 0 (0.0%) | 0 (0.0%) |
| Business & Financial | 0 (0.0%) | 7 (100.0%) |
| Computers, Engineering & Science | 0 (0.0%) | 0 (0.0%) |
| Computers & Mathematics | 0 (0.0%) | 0 (0.0%) |
| Architecture & Engineering | 0 (0.0%) | 0 (0.0%) |
| Life, Physical & Social Science | 0 (0.0%) | 0 (0.0%) |
| Community & Social Service | 0 (0.0%) | 0 (0.0%) |
| Education, Arts & Media | 0 (0.0%) | 0 (0.0%) |
| Legal Services & Support | 0 (0.0%) | 0 (0.0%) |
| Education Instruction & Library | 0 (0.0%) | 0 (0.0%) |
| Arts, Media & Entertainment | 0 (0.0%) | 0 (0.0%) |
| Health Diagnosing & Treating | 0 (0.0%) | 0 (0.0%) |
| Health Technologists | 0 (0.0%) | 0 (0.0%) |
| Total (Category) | 0 (0.0%) | 7 (100.0%) |
| Total (Overall) | 0 (0.0%) | 10 (100.0%) |
Services Occupations
Services Occupations by Sex
| Occupation | Male | Female |
| Healthcare Support | 0 (0.0%) | 0 (0.0%) |
| Security & Protection | 0 (0.0%) | 0 (0.0%) |
| Firefighting & Prevention | 0 (0.0%) | 0 (0.0%) |
| Law Enforcement | 0 (0.0%) | 0 (0.0%) |
| Food Preparation & Serving | 0 (0.0%) | 0 (0.0%) |
| Cleaning & Maintenance | 0 (0.0%) | 0 (0.0%) |
| Personal Care & Service | 0 (0.0%) | 0 (0.0%) |
| Total (Category) | 0 (0.0%) | 0 (0.0%) |
| Total (Overall) | 0 (0.0%) | 10 (100.0%) |
Sales and Office Occupations
The most common Sales and Office occupations in Fiddletown are , and Office & Administration (3 | 30.0%).
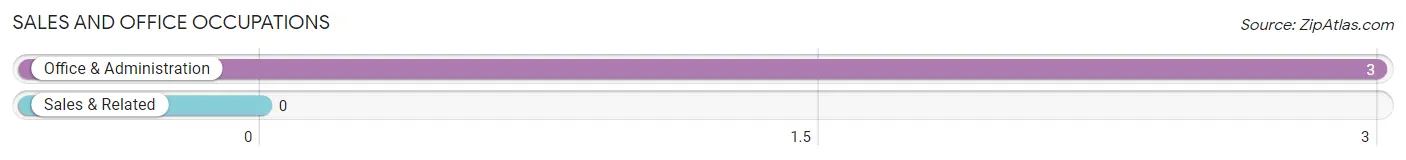
Sales and Office Occupations by Sex
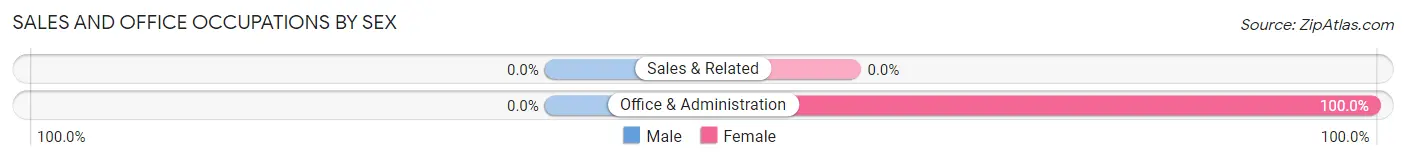
| Occupation | Male | Female |
| Sales & Related | 0 (0.0%) | 0 (0.0%) |
| Office & Administration | 0 (0.0%) | 3 (100.0%) |
| Total (Category) | 0 (0.0%) | 3 (100.0%) |
| Total (Overall) | 0 (0.0%) | 10 (100.0%) |
Natural Resources, Construction and Maintenance Occupations
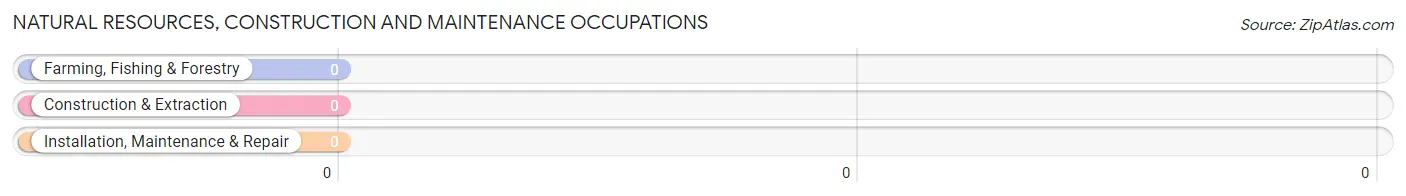
Natural Resources, Construction and Maintenance Occupations by Sex
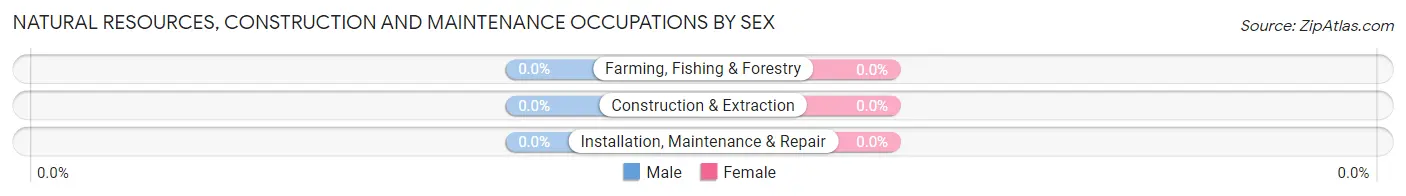
| Occupation | Male | Female |
| Farming, Fishing & Forestry | 0 (0.0%) | 0 (0.0%) |
| Construction & Extraction | 0 (0.0%) | 0 (0.0%) |
| Installation, Maintenance & Repair | 0 (0.0%) | 0 (0.0%) |
| Total (Category) | 0 (0.0%) | 0 (0.0%) |
| Total (Overall) | 0 (0.0%) | 10 (100.0%) |
Production, Transportation and Moving Occupations
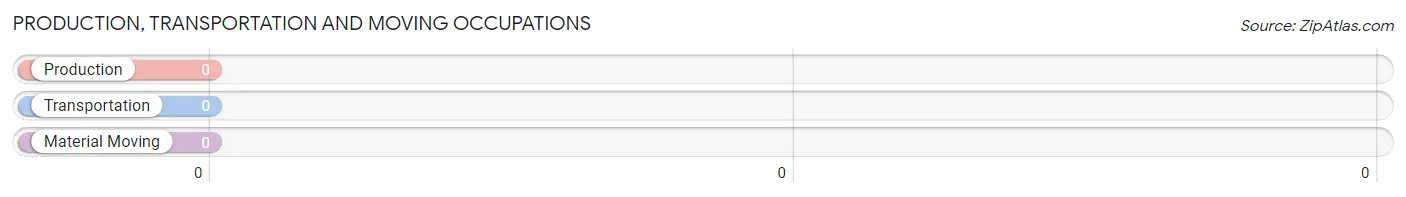
Production, Transportation and Moving Occupations by Sex
| Occupation | Male | Female |
| Production | 0 (0.0%) | 0 (0.0%) |
| Transportation | 0 (0.0%) | 0 (0.0%) |
| Material Moving | 0 (0.0%) | 0 (0.0%) |
| Total (Category) | 0 (0.0%) | 0 (0.0%) |
| Total (Overall) | 0 (0.0%) | 10 (100.0%) |
Employment Industries by Sex in Fiddletown
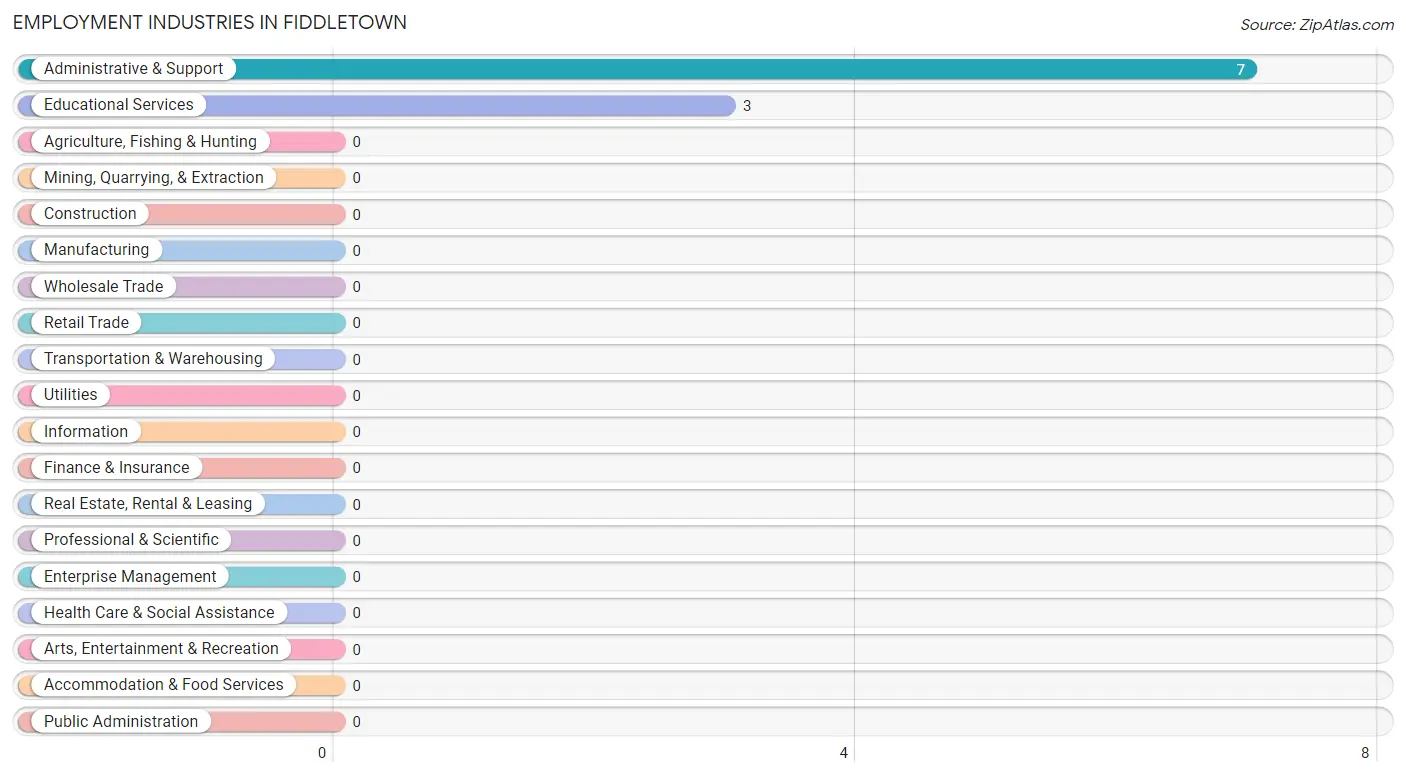
Employment Industries in Fiddletown
The major employment industries in Fiddletown include Administrative & Support (7 | 70.0%), and Educational Services (3 | 30.0%).
Employment Industries by Sex in Fiddletown
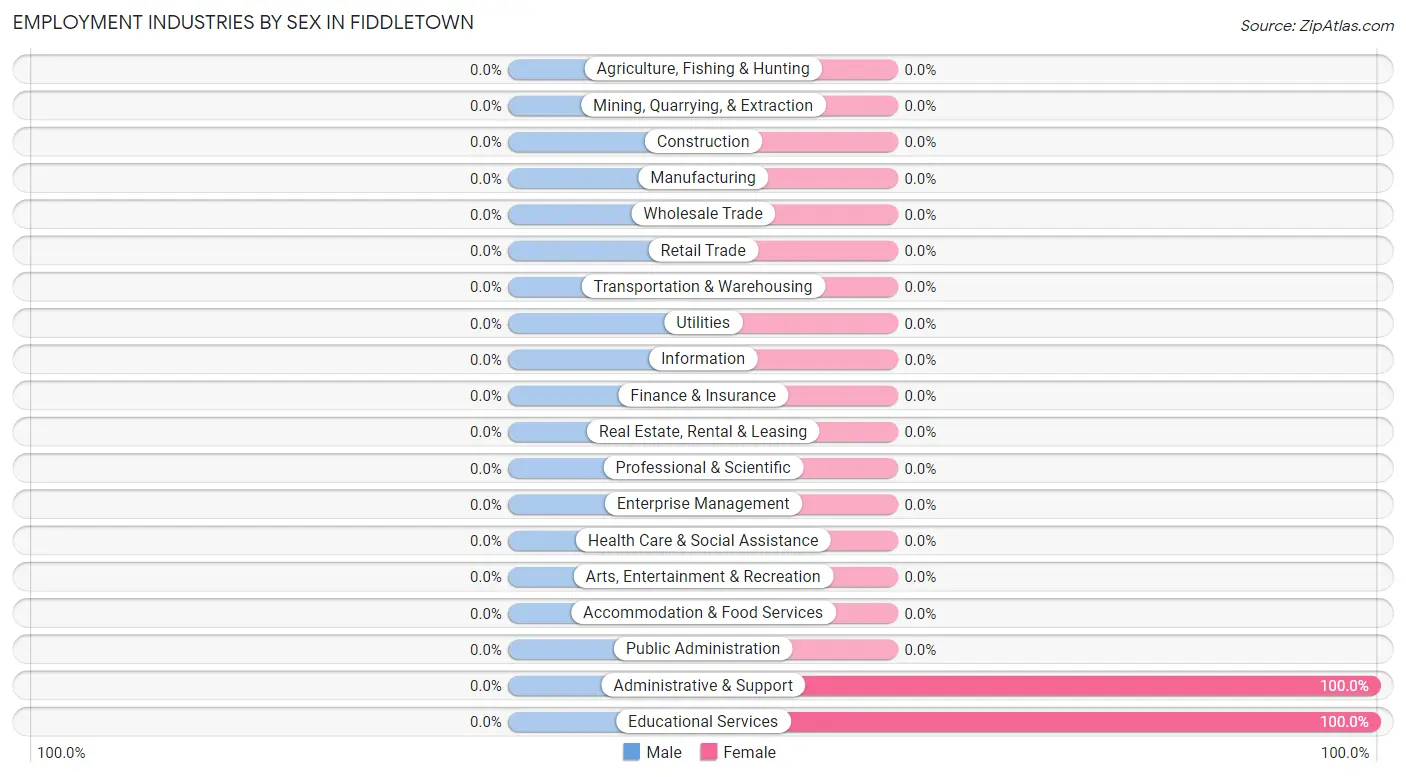
| Industry | Male | Female |
| Agriculture, Fishing & Hunting | 0 (0.0%) | 0 (0.0%) |
| Mining, Quarrying, & Extraction | 0 (0.0%) | 0 (0.0%) |
| Construction | 0 (0.0%) | 0 (0.0%) |
| Manufacturing | 0 (0.0%) | 0 (0.0%) |
| Wholesale Trade | 0 (0.0%) | 0 (0.0%) |
| Retail Trade | 0 (0.0%) | 0 (0.0%) |
| Transportation & Warehousing | 0 (0.0%) | 0 (0.0%) |
| Utilities | 0 (0.0%) | 0 (0.0%) |
| Information | 0 (0.0%) | 0 (0.0%) |
| Finance & Insurance | 0 (0.0%) | 0 (0.0%) |
| Real Estate, Rental & Leasing | 0 (0.0%) | 0 (0.0%) |
| Professional & Scientific | 0 (0.0%) | 0 (0.0%) |
| Enterprise Management | 0 (0.0%) | 0 (0.0%) |
| Administrative & Support | 0 (0.0%) | 7 (100.0%) |
| Educational Services | 0 (0.0%) | 3 (100.0%) |
| Health Care & Social Assistance | 0 (0.0%) | 0 (0.0%) |
| Arts, Entertainment & Recreation | 0 (0.0%) | 0 (0.0%) |
| Accommodation & Food Services | 0 (0.0%) | 0 (0.0%) |
| Public Administration | 0 (0.0%) | 0 (0.0%) |
| Total | 0 (0.0%) | 10 (100.0%) |
Education in Fiddletown
School Enrollment in Fiddletown
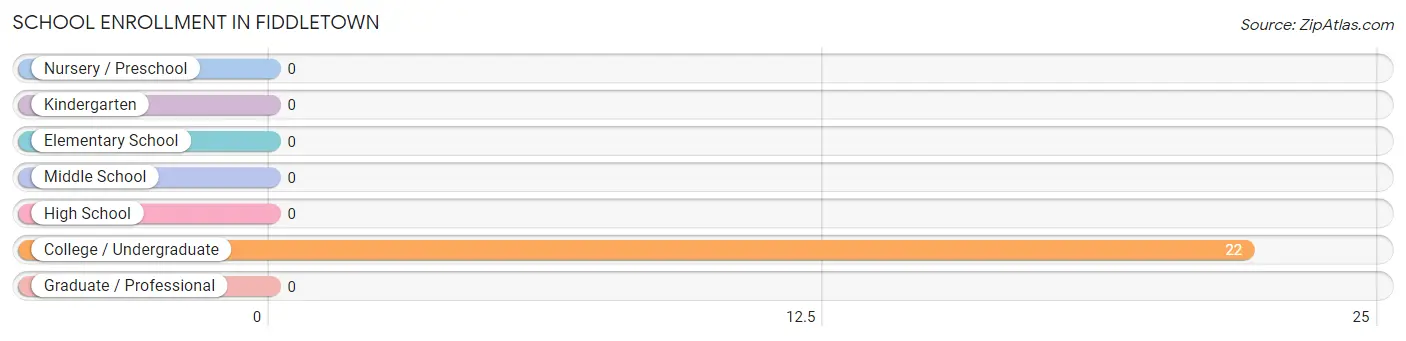
| School Level | # Students | % Students |
| Nursery / Preschool | 0 | 0.0% |
| Kindergarten | 0 | 0.0% |
| Elementary School | 0 | 0.0% |
| Middle School | 0 | 0.0% |
| High School | 0 | 0.0% |
| College / Undergraduate | 22 | 100.0% |
| Graduate / Professional | 0 | 0.0% |
| Total | 22 | 100.0% |
School Enrollment by Age by Funding Source in Fiddletown
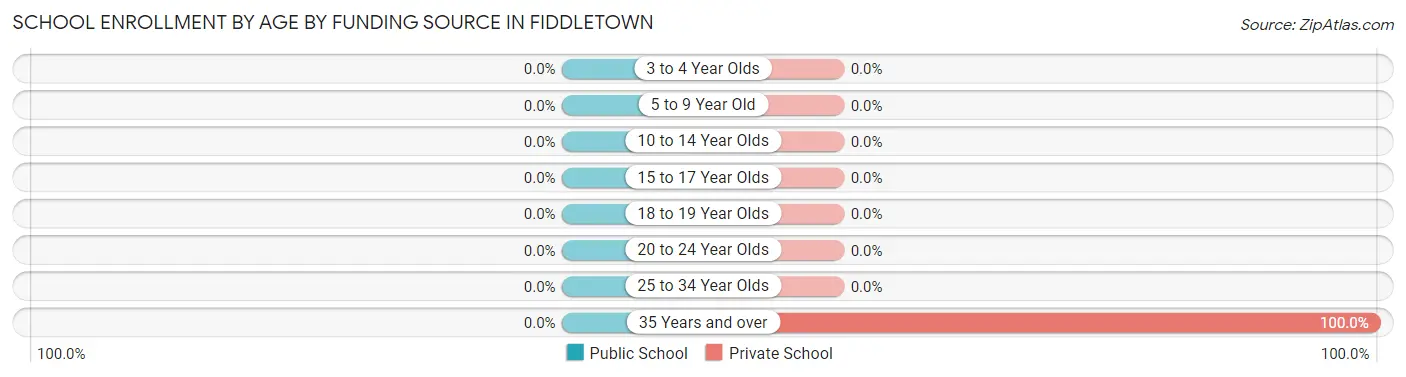
| Age Bracket | Public School | Private School |
| 3 to 4 Year Olds | 0 (0.0%) | 0 (0.0%) |
| 5 to 9 Year Old | 0 (0.0%) | 0 (0.0%) |
| 10 to 14 Year Olds | 0 (0.0%) | 0 (0.0%) |
| 15 to 17 Year Olds | 0 (0.0%) | 0 (0.0%) |
| 18 to 19 Year Olds | 0 (0.0%) | 0 (0.0%) |
| 20 to 24 Year Olds | 0 (0.0%) | 0 (0.0%) |
| 25 to 34 Year Olds | 0 (0.0%) | 0 (0.0%) |
| 35 Years and over | 0 (0.0%) | 22 (100.0%) |
| Total | 0 (0.0%) | 22 (100.0%) |
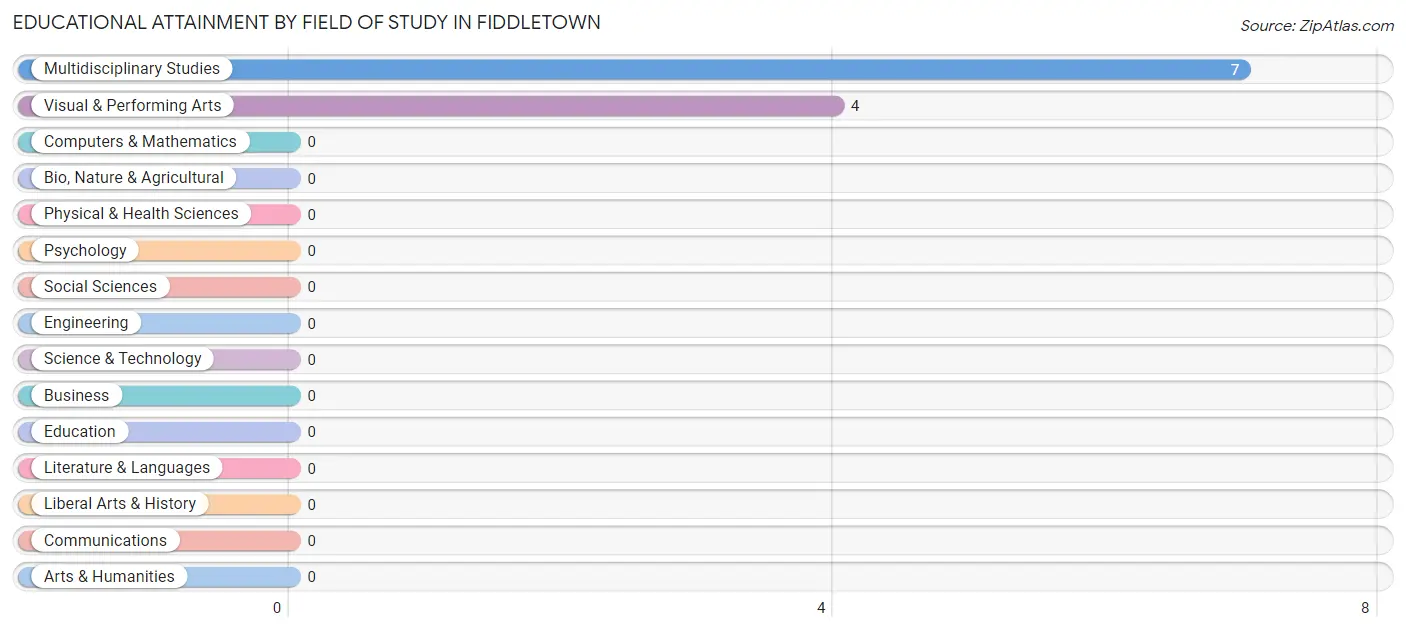
Educational Attainment by Field of Study in Fiddletown
Multidisciplinary studies (7 | 63.6%), and visual & performing arts (4 | 36.4%) are the most common fields of study among 11 individuals in Fiddletown who have obtained a bachelor's degree or higher.
| Field of Study | # Graduates | % Graduates |
| Computers & Mathematics | 0 | 0.0% |
| Bio, Nature & Agricultural | 0 | 0.0% |
| Physical & Health Sciences | 0 | 0.0% |
| Psychology | 0 | 0.0% |
| Social Sciences | 0 | 0.0% |
| Engineering | 0 | 0.0% |
| Multidisciplinary Studies | 7 | 63.6% |
| Science & Technology | 0 | 0.0% |
| Business | 0 | 0.0% |
| Education | 0 | 0.0% |
| Literature & Languages | 0 | 0.0% |
| Liberal Arts & History | 0 | 0.0% |
| Visual & Performing Arts | 4 | 36.4% |
| Communications | 0 | 0.0% |
| Arts & Humanities | 0 | 0.0% |
| Total | 11 | 100.0% |
Transportation & Commute in Fiddletown
Vehicle Availability by Sex in Fiddletown
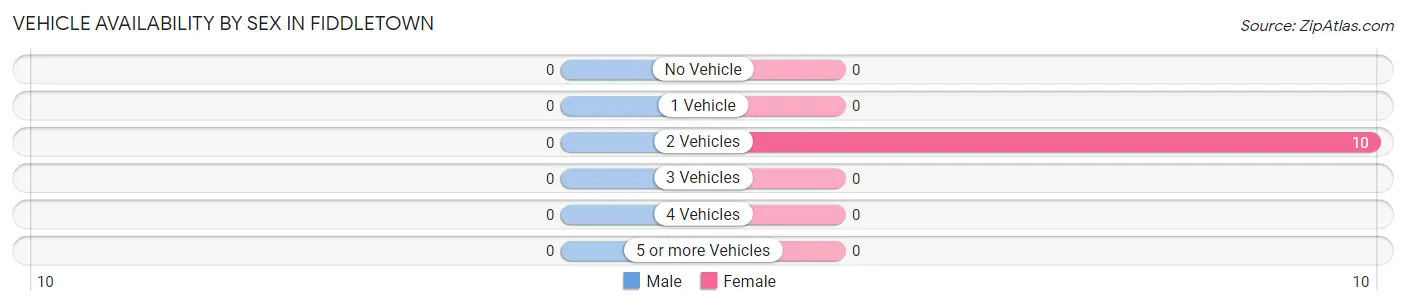
| Vehicles Available | Male | Female |
| No Vehicle | 0 (0.0%) | 0 (0.0%) |
| 1 Vehicle | 0 (0.0%) | 0 (0.0%) |
| 2 Vehicles | 0 (0.0%) | 10 (100.0%) |
| 3 Vehicles | 0 (0.0%) | 0 (0.0%) |
| 4 Vehicles | 0 (0.0%) | 0 (0.0%) |
| 5 or more Vehicles | 0 (0.0%) | 0 (0.0%) |
| Total | 0 (0.0%) | 10 (100.0%) |
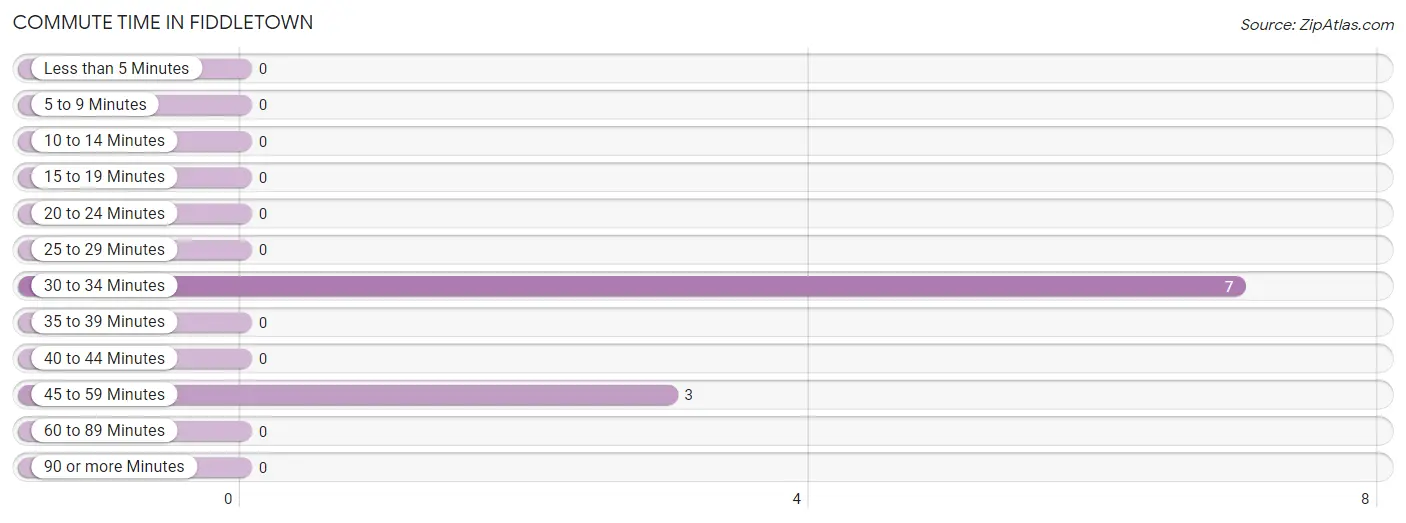
Commute Time in Fiddletown
The most frequently occuring commute durations in Fiddletown are 30 to 34 minutes (7 commuters, 70.0%), 45 to 59 minutes (3 commuters, 30.0%), and less than 5 minutes (0 commuters, 0.0%).
| Commute Time | # Commuters | % Commuters |
| Less than 5 Minutes | 0 | 0.0% |
| 5 to 9 Minutes | 0 | 0.0% |
| 10 to 14 Minutes | 0 | 0.0% |
| 15 to 19 Minutes | 0 | 0.0% |
| 20 to 24 Minutes | 0 | 0.0% |
| 25 to 29 Minutes | 0 | 0.0% |
| 30 to 34 Minutes | 7 | 70.0% |
| 35 to 39 Minutes | 0 | 0.0% |
| 40 to 44 Minutes | 0 | 0.0% |
| 45 to 59 Minutes | 3 | 30.0% |
| 60 to 89 Minutes | 0 | 0.0% |
| 90 or more Minutes | 0 | 0.0% |
Commute Time by Sex in Fiddletown
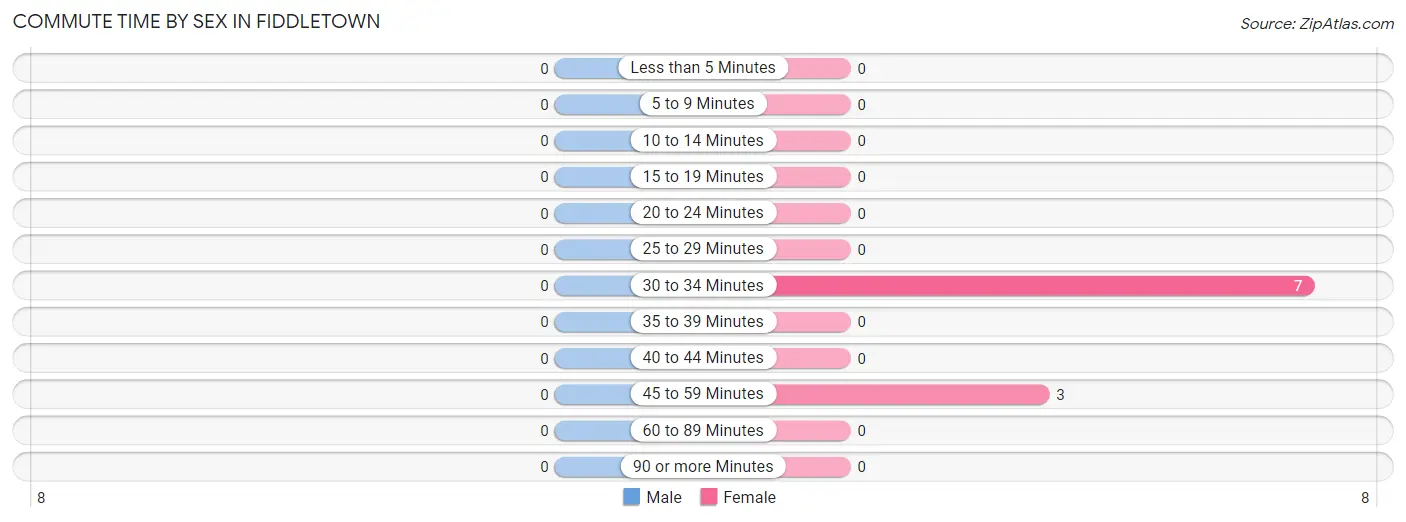
| Commute Time | Male | Female |
| Less than 5 Minutes | 0 (0.0%) | 0 (0.0%) |
| 5 to 9 Minutes | 0 (0.0%) | 0 (0.0%) |
| 10 to 14 Minutes | 0 (0.0%) | 0 (0.0%) |
| 15 to 19 Minutes | 0 (0.0%) | 0 (0.0%) |
| 20 to 24 Minutes | 0 (0.0%) | 0 (0.0%) |
| 25 to 29 Minutes | 0 (0.0%) | 0 (0.0%) |
| 30 to 34 Minutes | 0 (0.0%) | 7 (70.0%) |
| 35 to 39 Minutes | 0 (0.0%) | 0 (0.0%) |
| 40 to 44 Minutes | 0 (0.0%) | 0 (0.0%) |
| 45 to 59 Minutes | 0 (0.0%) | 3 (30.0%) |
| 60 to 89 Minutes | 0 (0.0%) | 0 (0.0%) |
| 90 or more Minutes | 0 (0.0%) | 0 (0.0%) |
Time of Departure to Work by Sex in Fiddletown
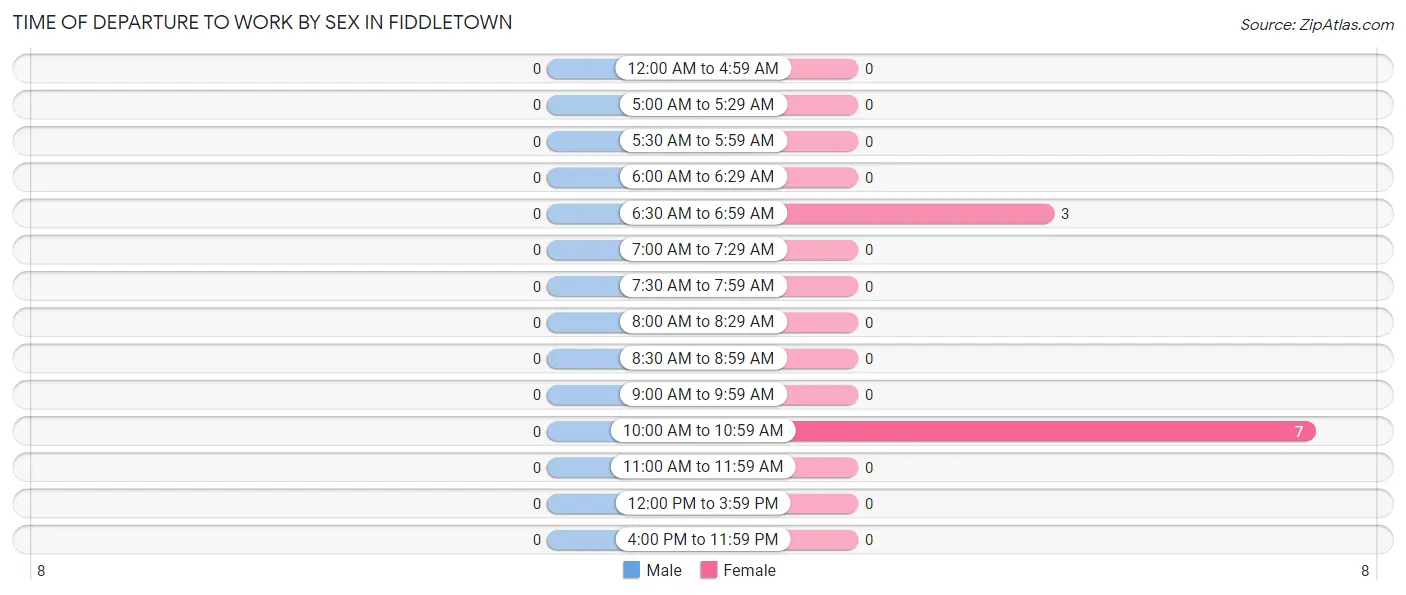
| Time of Departure | Male | Female |
| 12:00 AM to 4:59 AM | 0 (0.0%) | 0 (0.0%) |
| 5:00 AM to 5:29 AM | 0 (0.0%) | 0 (0.0%) |
| 5:30 AM to 5:59 AM | 0 (0.0%) | 0 (0.0%) |
| 6:00 AM to 6:29 AM | 0 (0.0%) | 0 (0.0%) |
| 6:30 AM to 6:59 AM | 0 (0.0%) | 3 (30.0%) |
| 7:00 AM to 7:29 AM | 0 (0.0%) | 0 (0.0%) |
| 7:30 AM to 7:59 AM | 0 (0.0%) | 0 (0.0%) |
| 8:00 AM to 8:29 AM | 0 (0.0%) | 0 (0.0%) |
| 8:30 AM to 8:59 AM | 0 (0.0%) | 0 (0.0%) |
| 9:00 AM to 9:59 AM | 0 (0.0%) | 0 (0.0%) |
| 10:00 AM to 10:59 AM | 0 (0.0%) | 7 (70.0%) |
| 11:00 AM to 11:59 AM | 0 (0.0%) | 0 (0.0%) |
| 12:00 PM to 3:59 PM | 0 (0.0%) | 0 (0.0%) |
| 4:00 PM to 11:59 PM | 0 (0.0%) | 0 (0.0%) |
| Total | 0 (0.0%) | 10 (100.0%) |
Housing Occupancy in Fiddletown
Occupancy by Ownership in Fiddletown
Of the total 46 dwellings in Fiddletown, owner-occupied units account for 24 (52.2%), while renter-occupied units make up 22 (47.8%).
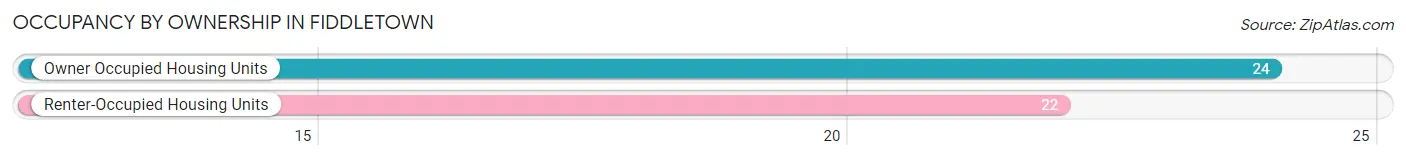
| Occupancy | # Housing Units | % Housing Units |
| Owner Occupied Housing Units | 24 | 52.2% |
| Renter-Occupied Housing Units | 22 | 47.8% |
| Total Occupied Housing Units | 46 | 100.0% |
Occupancy by Household Size in Fiddletown
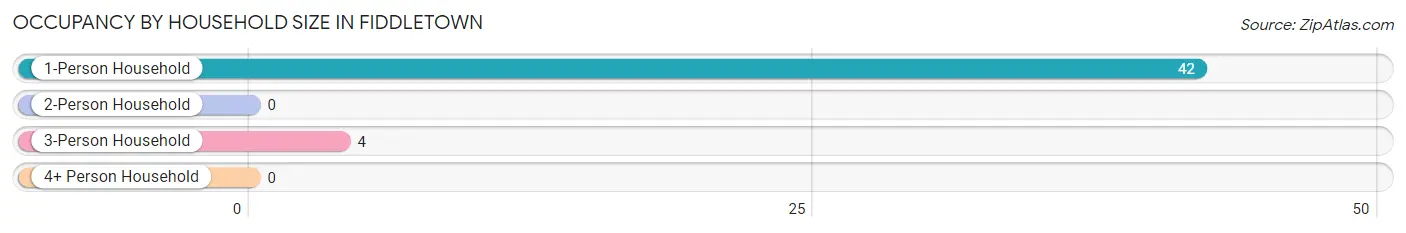
| Household Size | # Housing Units | % Housing Units |
| 1-Person Household | 42 | 91.3% |
| 2-Person Household | 0 | 0.0% |
| 3-Person Household | 4 | 8.7% |
| 4+ Person Household | 0 | 0.0% |
| Total Housing Units | 46 | 100.0% |
Occupancy by Ownership by Household Size in Fiddletown
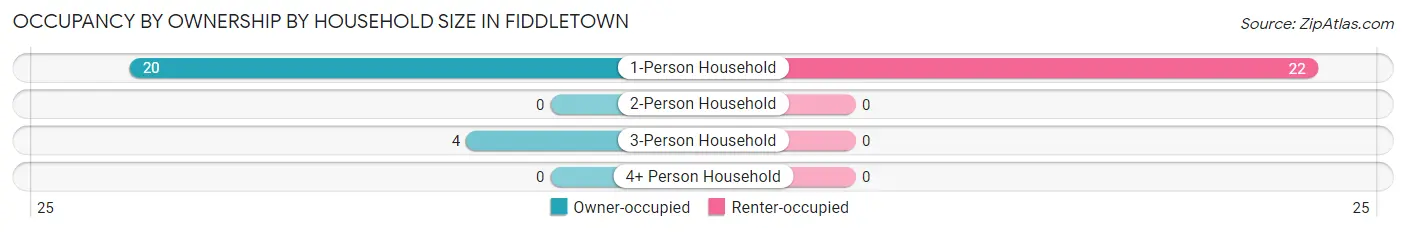
| Household Size | Owner-occupied | Renter-occupied |
| 1-Person Household | 20 (47.6%) | 22 (52.4%) |
| 2-Person Household | 0 (0.0%) | 0 (0.0%) |
| 3-Person Household | 4 (100.0%) | 0 (0.0%) |
| 4+ Person Household | 0 (0.0%) | 0 (0.0%) |
| Total Housing Units | 24 (52.2%) | 22 (47.8%) |
Occupancy by Educational Attainment in Fiddletown
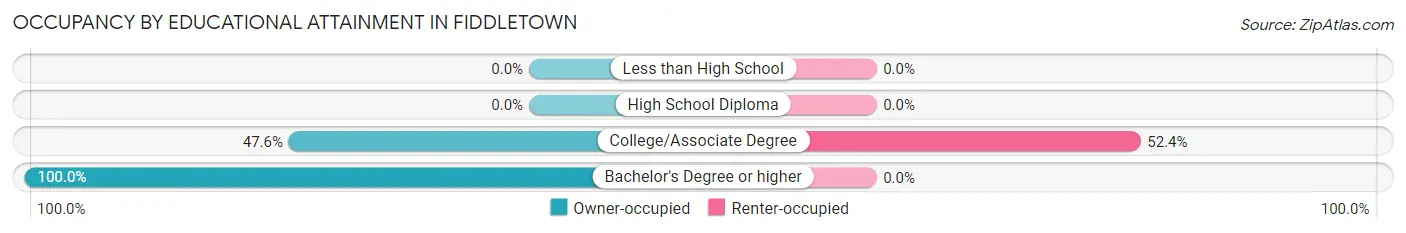
| Household Size | Owner-occupied | Renter-occupied |
| Less than High School | 0 (0.0%) | 0 (0.0%) |
| High School Diploma | 0 (0.0%) | 0 (0.0%) |
| College/Associate Degree | 20 (47.6%) | 22 (52.4%) |
| Bachelor's Degree or higher | 4 (100.0%) | 0 (0.0%) |
Occupancy by Age of Householder in Fiddletown
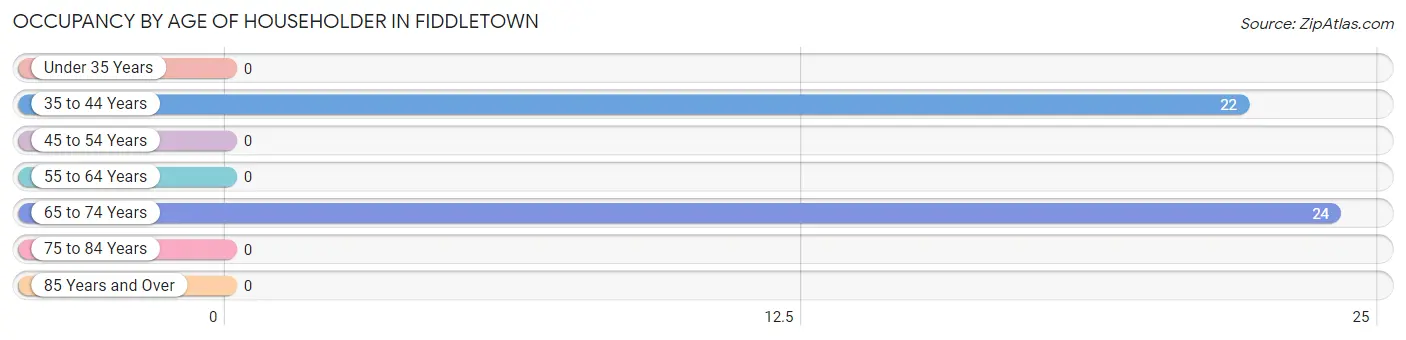
| Age Bracket | # Households | % Households |
| Under 35 Years | 0 | 0.0% |
| 35 to 44 Years | 22 | 47.8% |
| 45 to 54 Years | 0 | 0.0% |
| 55 to 64 Years | 0 | 0.0% |
| 65 to 74 Years | 24 | 52.2% |
| 75 to 84 Years | 0 | 0.0% |
| 85 Years and Over | 0 | 0.0% |
| Total | 46 | 100.0% |
Housing Finances in Fiddletown
Median Income by Occupancy in Fiddletown
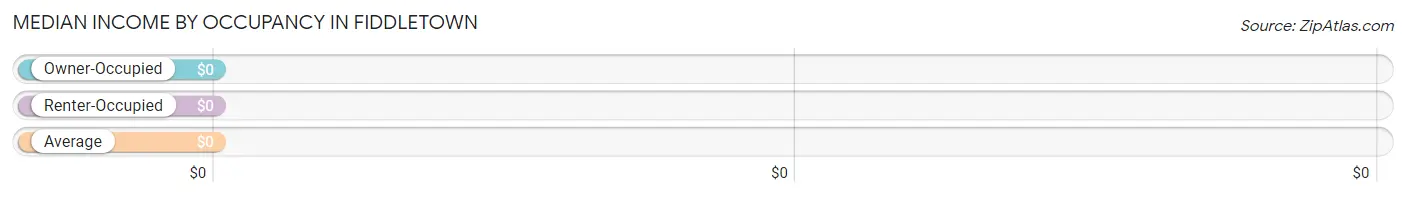
| Occupancy Type | # Households | Median Income |
| Owner-Occupied | 24 (52.2%) | $0 |
| Renter-Occupied | 22 (47.8%) | $0 |
| Average | 46 (100.0%) | $0 |
Occupancy by Householder Income Bracket in Fiddletown
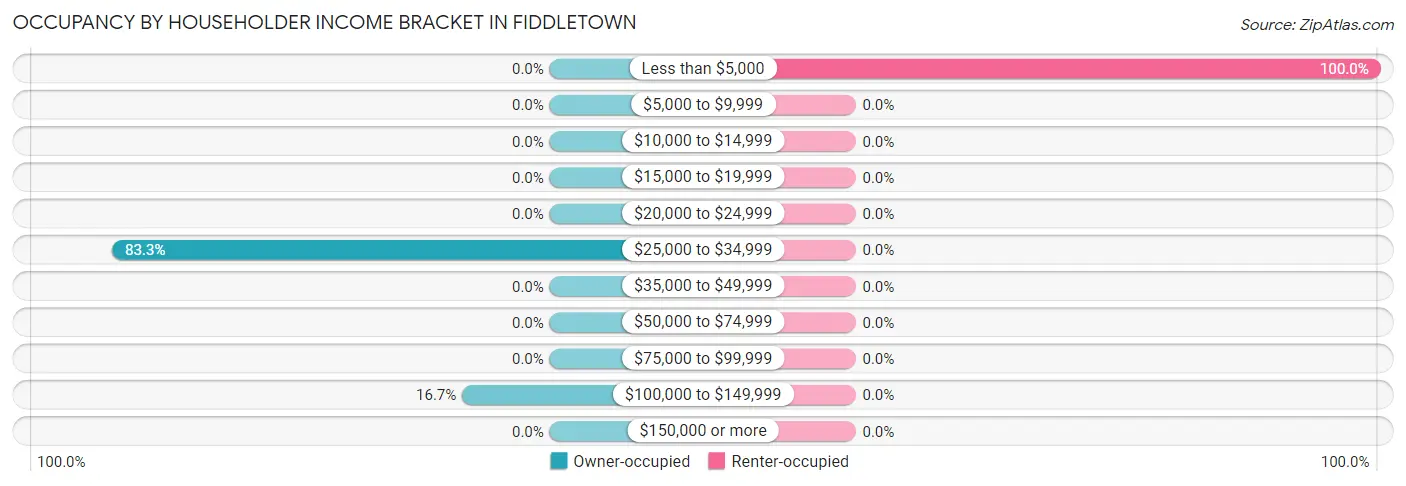
| Income Bracket | Owner-occupied | Renter-occupied |
| Less than $5,000 | 0 (0.0%) | 22 (100.0%) |
| $5,000 to $9,999 | 0 (0.0%) | 0 (0.0%) |
| $10,000 to $14,999 | 0 (0.0%) | 0 (0.0%) |
| $15,000 to $19,999 | 0 (0.0%) | 0 (0.0%) |
| $20,000 to $24,999 | 0 (0.0%) | 0 (0.0%) |
| $25,000 to $34,999 | 20 (83.3%) | 0 (0.0%) |
| $35,000 to $49,999 | 0 (0.0%) | 0 (0.0%) |
| $50,000 to $74,999 | 0 (0.0%) | 0 (0.0%) |
| $75,000 to $99,999 | 0 (0.0%) | 0 (0.0%) |
| $100,000 to $149,999 | 4 (16.7%) | 0 (0.0%) |
| $150,000 or more | 0 (0.0%) | 0 (0.0%) |
| Total | 24 (100.0%) | 22 (100.0%) |
Monthly Housing Cost Tiers in Fiddletown
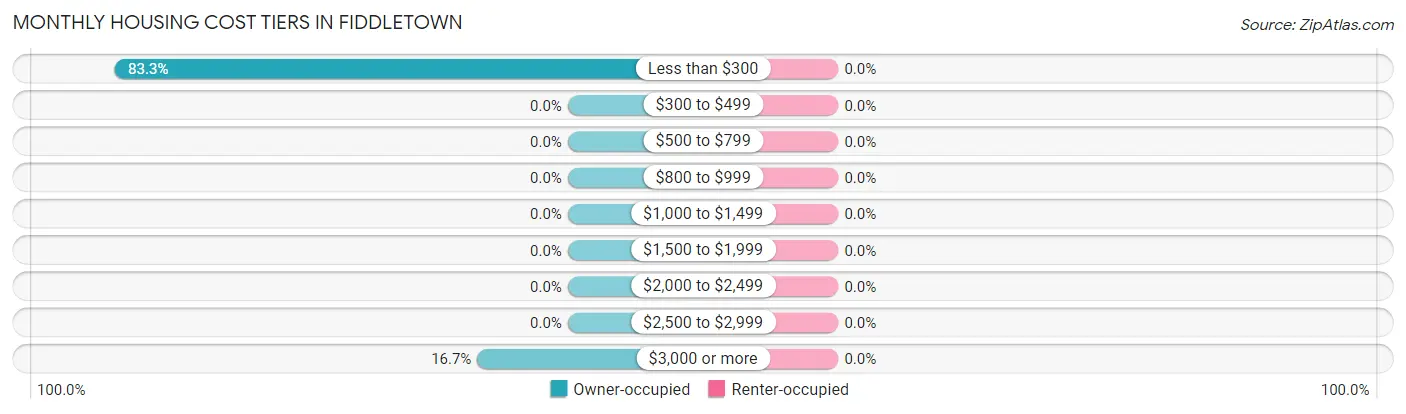
| Monthly Cost | Owner-occupied | Renter-occupied |
| Less than $300 | 20 (83.3%) | 0 (0.0%) |
| $300 to $499 | 0 (0.0%) | 0 (0.0%) |
| $500 to $799 | 0 (0.0%) | 0 (0.0%) |
| $800 to $999 | 0 (0.0%) | 0 (0.0%) |
| $1,000 to $1,499 | 0 (0.0%) | 0 (0.0%) |
| $1,500 to $1,999 | 0 (0.0%) | 0 (0.0%) |
| $2,000 to $2,499 | 0 (0.0%) | 0 (0.0%) |
| $2,500 to $2,999 | 0 (0.0%) | 0 (0.0%) |
| $3,000 or more | 4 (16.7%) | 0 (0.0%) |
| Total | 24 (100.0%) | 22 (100.0%) |
Physical Housing Characteristics in Fiddletown
Housing Structures in Fiddletown
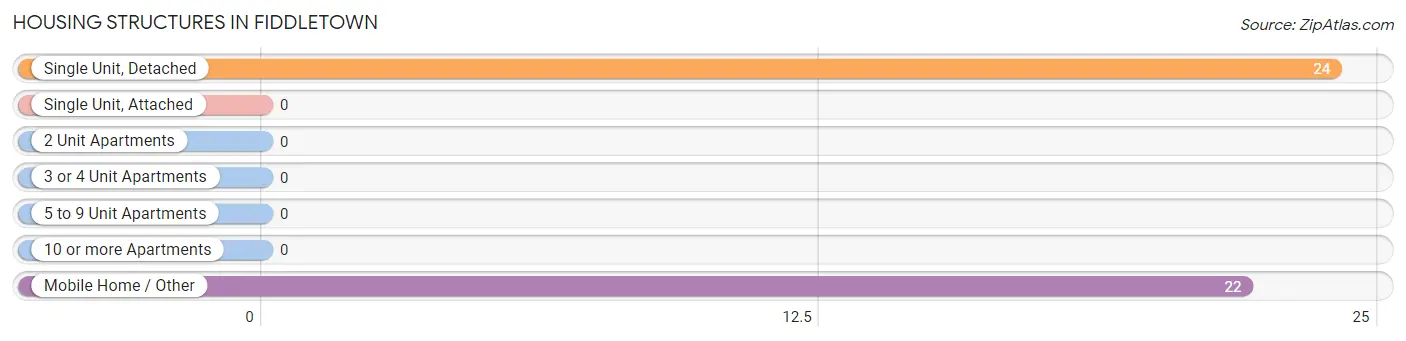
| Structure Type | # Housing Units | % Housing Units |
| Single Unit, Detached | 24 | 52.2% |
| Single Unit, Attached | 0 | 0.0% |
| 2 Unit Apartments | 0 | 0.0% |
| 3 or 4 Unit Apartments | 0 | 0.0% |
| 5 to 9 Unit Apartments | 0 | 0.0% |
| 10 or more Apartments | 0 | 0.0% |
| Mobile Home / Other | 22 | 47.8% |
| Total | 46 | 100.0% |
Housing Structures by Occupancy in Fiddletown
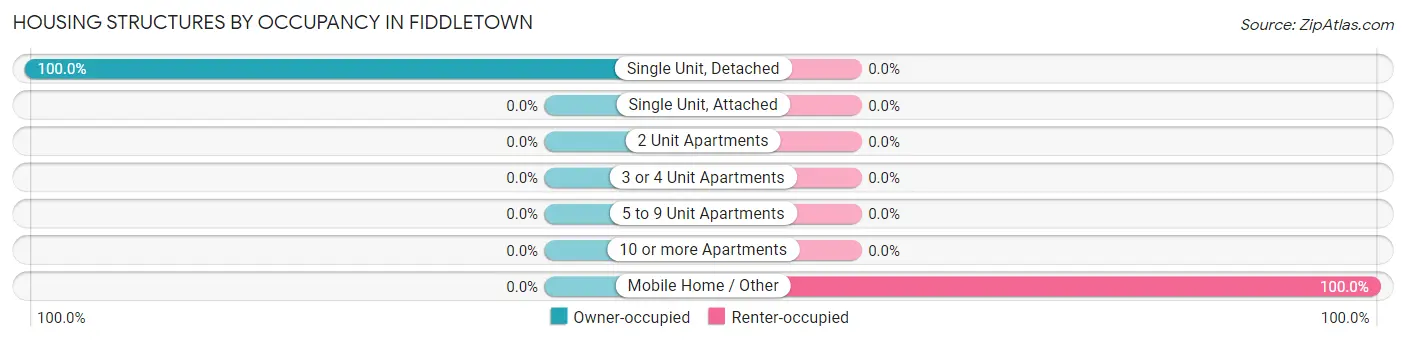
| Structure Type | Owner-occupied | Renter-occupied |
| Single Unit, Detached | 24 (100.0%) | 0 (0.0%) |
| Single Unit, Attached | 0 (0.0%) | 0 (0.0%) |
| 2 Unit Apartments | 0 (0.0%) | 0 (0.0%) |
| 3 or 4 Unit Apartments | 0 (0.0%) | 0 (0.0%) |
| 5 to 9 Unit Apartments | 0 (0.0%) | 0 (0.0%) |
| 10 or more Apartments | 0 (0.0%) | 0 (0.0%) |
| Mobile Home / Other | 0 (0.0%) | 22 (100.0%) |
| Total | 24 (52.2%) | 22 (47.8%) |
Housing Structures by Number of Rooms in Fiddletown
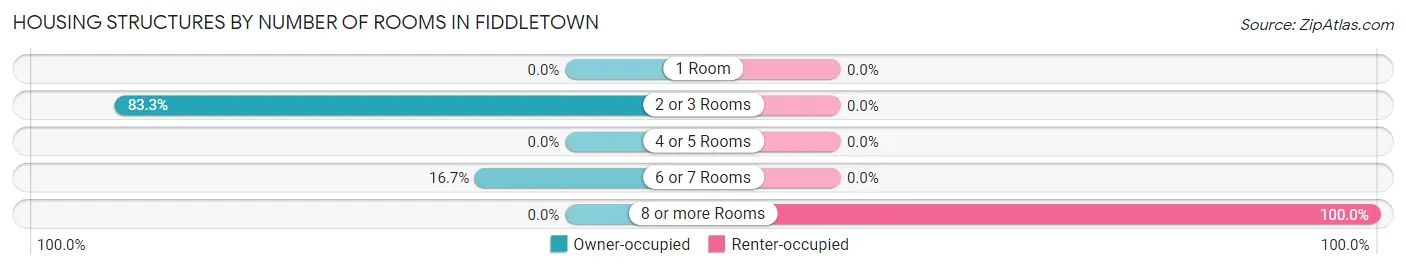
| Number of Rooms | Owner-occupied | Renter-occupied |
| 1 Room | 0 (0.0%) | 0 (0.0%) |
| 2 or 3 Rooms | 20 (83.3%) | 0 (0.0%) |
| 4 or 5 Rooms | 0 (0.0%) | 0 (0.0%) |
| 6 or 7 Rooms | 4 (16.7%) | 0 (0.0%) |
| 8 or more Rooms | 0 (0.0%) | 22 (100.0%) |
| Total | 24 (100.0%) | 22 (100.0%) |
Housing Structure by Heating Type in Fiddletown
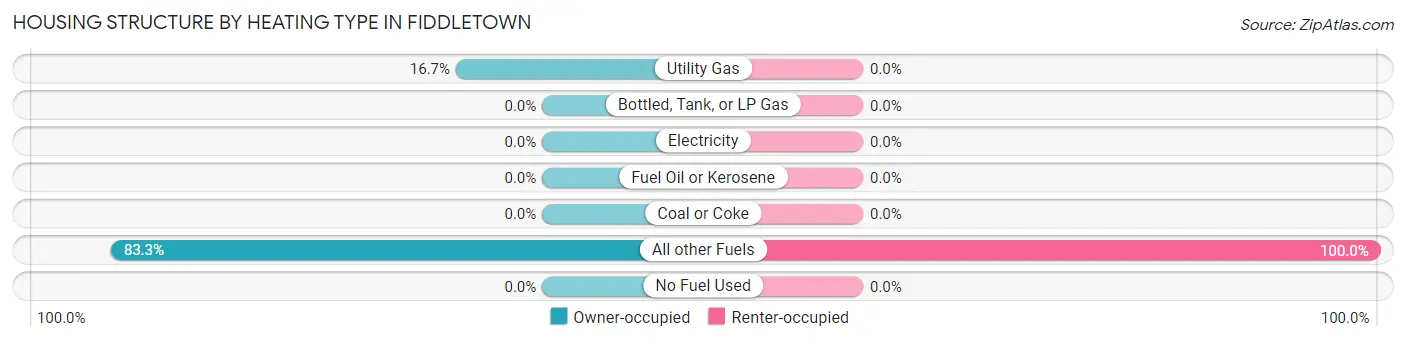
| Heating Type | Owner-occupied | Renter-occupied |
| Utility Gas | 4 (16.7%) | 0 (0.0%) |
| Bottled, Tank, or LP Gas | 0 (0.0%) | 0 (0.0%) |
| Electricity | 0 (0.0%) | 0 (0.0%) |
| Fuel Oil or Kerosene | 0 (0.0%) | 0 (0.0%) |
| Coal or Coke | 0 (0.0%) | 0 (0.0%) |
| All other Fuels | 20 (83.3%) | 22 (100.0%) |
| No Fuel Used | 0 (0.0%) | 0 (0.0%) |
| Total | 24 (100.0%) | 22 (100.0%) |
Household Vehicle Usage in Fiddletown
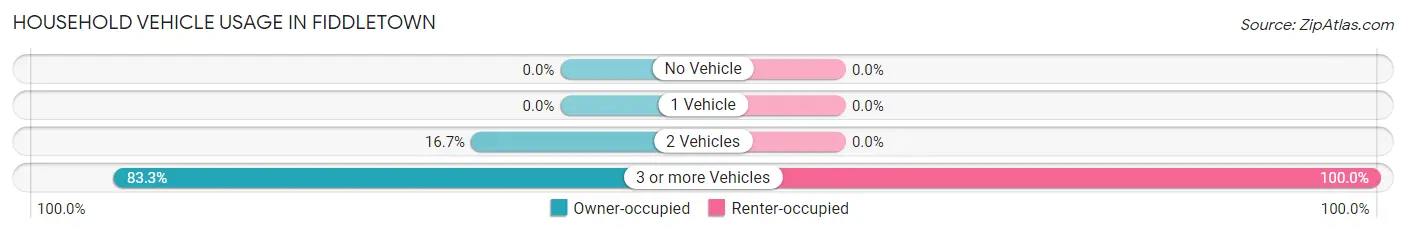
| Vehicles per Household | Owner-occupied | Renter-occupied |
| No Vehicle | 0 (0.0%) | 0 (0.0%) |
| 1 Vehicle | 0 (0.0%) | 0 (0.0%) |
| 2 Vehicles | 4 (16.7%) | 0 (0.0%) |
| 3 or more Vehicles | 20 (83.3%) | 22 (100.0%) |
| Total | 24 (100.0%) | 22 (100.0%) |
Real Estate & Mortgages in Fiddletown
Real Estate and Mortgage Overview in Fiddletown
| Characteristic | Without Mortgage | With Mortgage |
| Housing Units | 20 | 4 |
| Median Property Value | - | - |
| Median Household Income | - | - |
| Monthly Housing Costs | - | - |
| Real Estate Taxes | - | - |
Property Value by Mortgage Status in Fiddletown
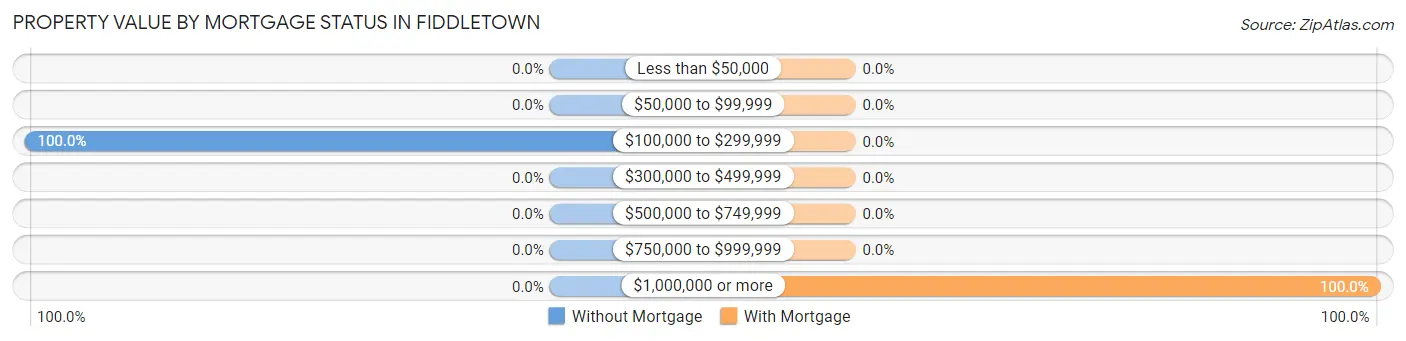
| Property Value | Without Mortgage | With Mortgage |
| Less than $50,000 | 0 (0.0%) | 0 (0.0%) |
| $50,000 to $99,999 | 0 (0.0%) | 0 (0.0%) |
| $100,000 to $299,999 | 20 (100.0%) | 0 (0.0%) |
| $300,000 to $499,999 | 0 (0.0%) | 0 (0.0%) |
| $500,000 to $749,999 | 0 (0.0%) | 0 (0.0%) |
| $750,000 to $999,999 | 0 (0.0%) | 0 (0.0%) |
| $1,000,000 or more | 0 (0.0%) | 4 (100.0%) |
| Total | 20 (100.0%) | 4 (100.0%) |
Household Income by Mortgage Status in Fiddletown
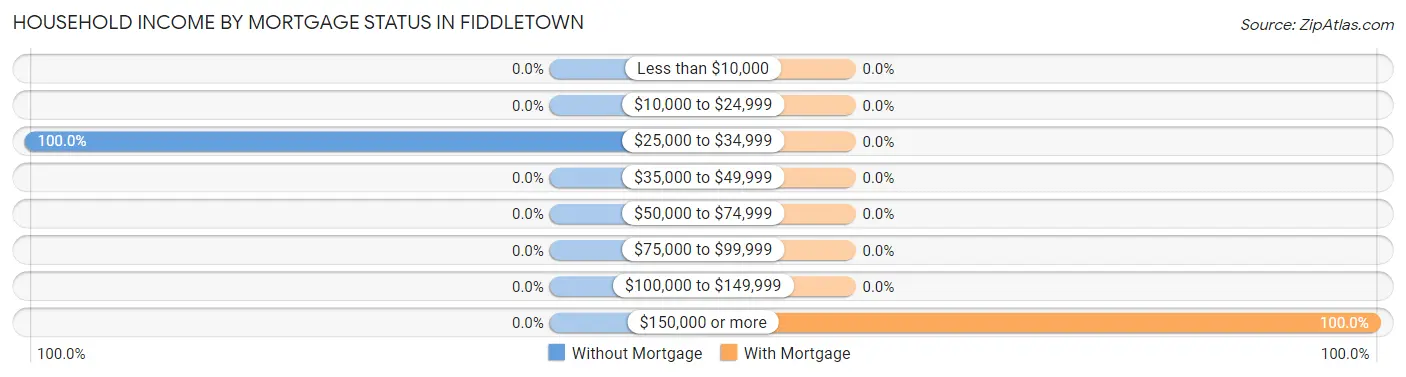
| Household Income | Without Mortgage | With Mortgage |
| Less than $10,000 | 0 (0.0%) | 0 (0.0%) |
| $10,000 to $24,999 | 0 (0.0%) | 0 (0.0%) |
| $25,000 to $34,999 | 20 (100.0%) | 0 (0.0%) |
| $35,000 to $49,999 | 0 (0.0%) | 0 (0.0%) |
| $50,000 to $74,999 | 0 (0.0%) | 0 (0.0%) |
| $75,000 to $99,999 | 0 (0.0%) | 0 (0.0%) |
| $100,000 to $149,999 | 0 (0.0%) | 0 (0.0%) |
| $150,000 or more | 0 (0.0%) | 4 (100.0%) |
| Total | 20 (100.0%) | 4 (100.0%) |
Property Value to Household Income Ratio in Fiddletown
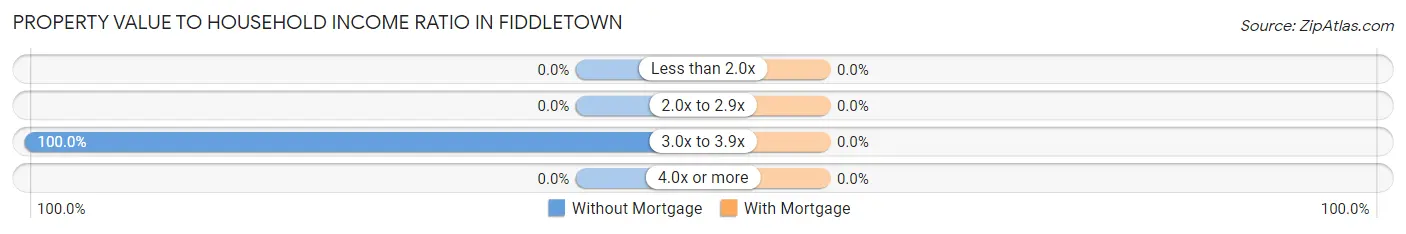
| Value-to-Income Ratio | Without Mortgage | With Mortgage |
| Less than 2.0x | 0 (0.0%) | 0 (0.0%) |
| 2.0x to 2.9x | 0 (0.0%) | 0 (0.0%) |
| 3.0x to 3.9x | 20 (100.0%) | 0 (0.0%) |
| 4.0x or more | 0 (0.0%) | 0 (0.0%) |
| Total | 20 (100.0%) | 4 (100.0%) |
Real Estate Taxes by Mortgage Status in Fiddletown
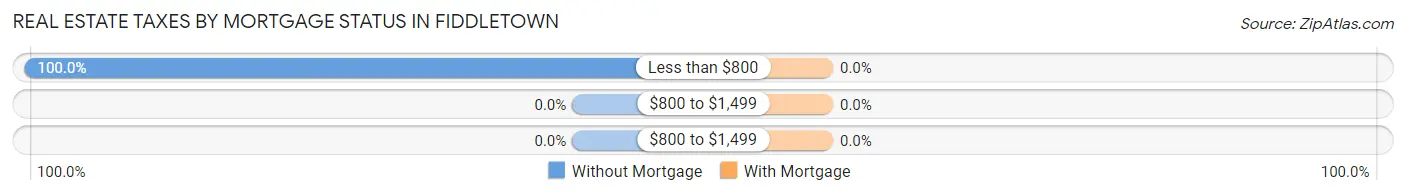
| Property Taxes | Without Mortgage | With Mortgage |
| Less than $800 | 20 (100.0%) | 0 (0.0%) |
| $800 to $1,499 | 0 (0.0%) | 0 (0.0%) |
| $800 to $1,499 | 0 (0.0%) | 0 (0.0%) |
| Total | 20 (100.0%) | 4 (100.0%) |
Health & Disability in Fiddletown
Health Insurance Coverage by Age in Fiddletown
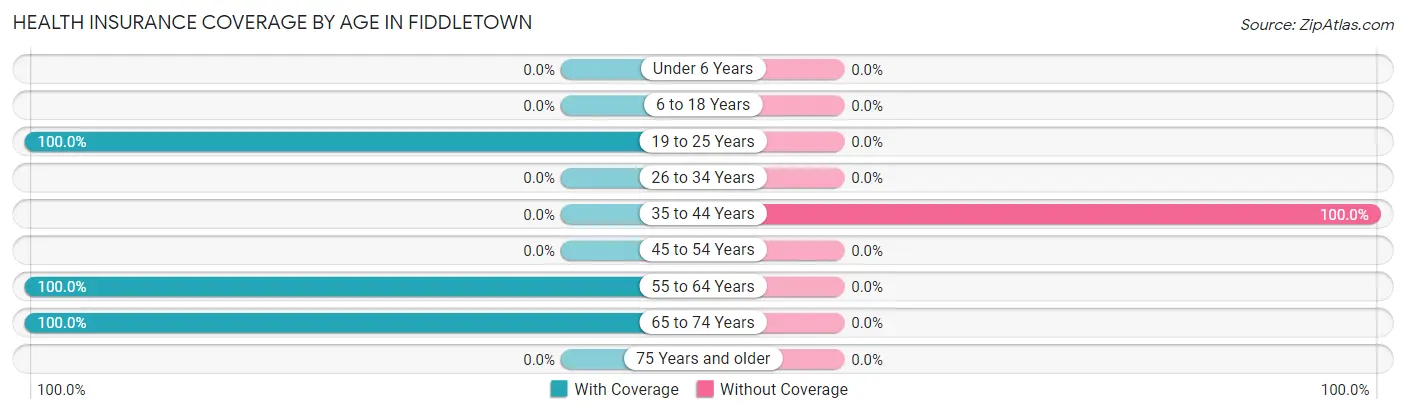
| Age Bracket | With Coverage | Without Coverage |
| Under 6 Years | 0 (0.0%) | 0 (0.0%) |
| 6 to 18 Years | 0 (0.0%) | 0 (0.0%) |
| 19 to 25 Years | 7 (100.0%) | 0 (0.0%) |
| 26 to 34 Years | 0 (0.0%) | 0 (0.0%) |
| 35 to 44 Years | 0 (0.0%) | 22 (100.0%) |
| 45 to 54 Years | 0 (0.0%) | 0 (0.0%) |
| 55 to 64 Years | 3 (100.0%) | 0 (0.0%) |
| 65 to 74 Years | 24 (100.0%) | 0 (0.0%) |
| 75 Years and older | 0 (0.0%) | 0 (0.0%) |
| Total | 34 (60.7%) | 22 (39.3%) |
Health Insurance Coverage by Citizenship Status in Fiddletown
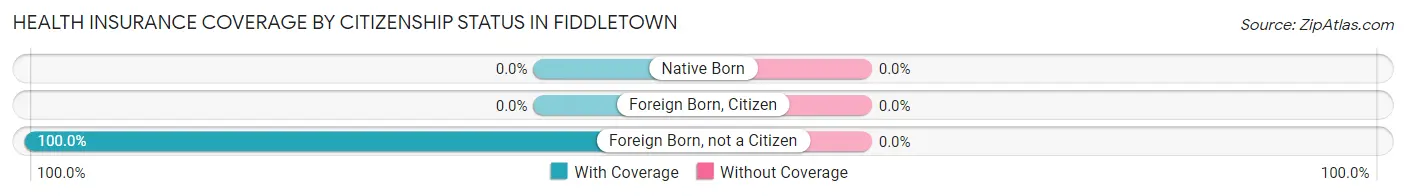
| Citizenship Status | With Coverage | Without Coverage |
| Native Born | 0 (0.0%) | 0 (0.0%) |
| Foreign Born, Citizen | 0 (0.0%) | 0 (0.0%) |
| Foreign Born, not a Citizen | 7 (100.0%) | 0 (0.0%) |
Health Insurance Coverage by Household Income in Fiddletown
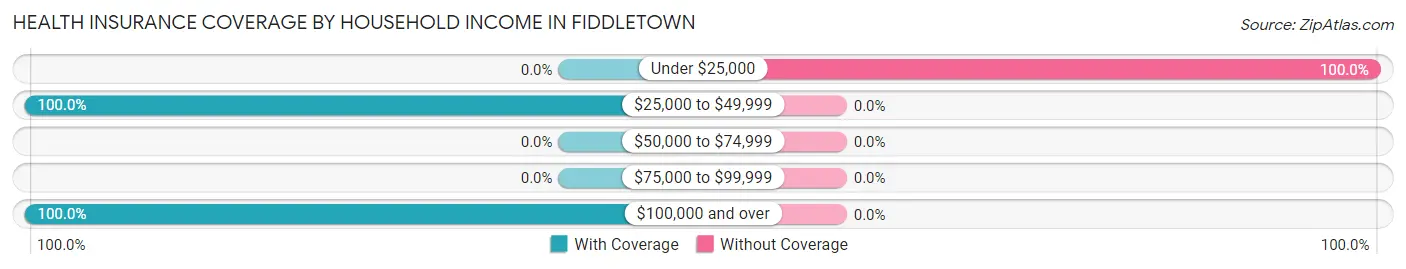
| Household Income | With Coverage | Without Coverage |
| Under $25,000 | 0 (0.0%) | 22 (100.0%) |
| $25,000 to $49,999 | 20 (100.0%) | 0 (0.0%) |
| $50,000 to $74,999 | 0 (0.0%) | 0 (0.0%) |
| $75,000 to $99,999 | 0 (0.0%) | 0 (0.0%) |
| $100,000 and over | 14 (100.0%) | 0 (0.0%) |
Public vs Private Health Insurance Coverage by Age in Fiddletown
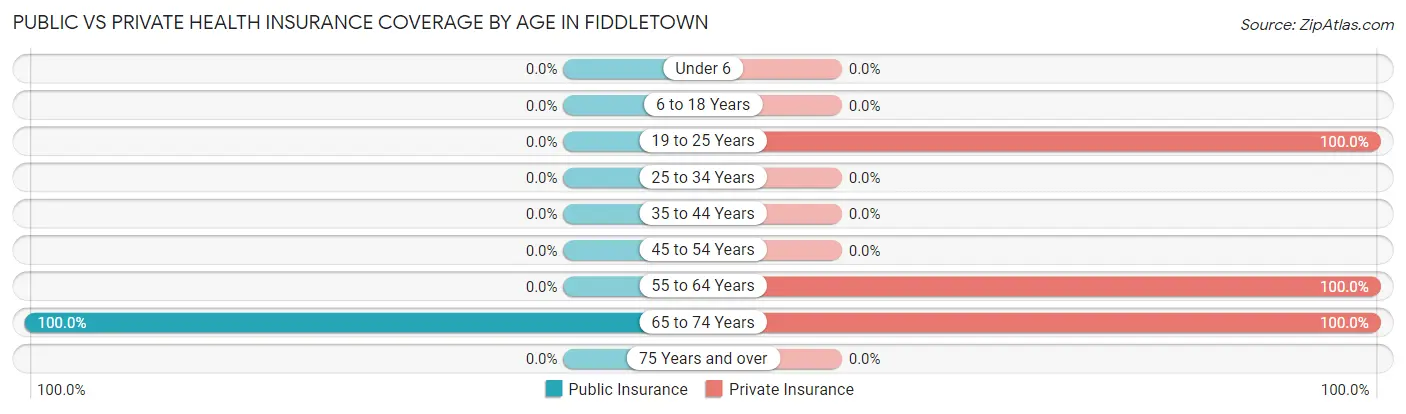
| Age Bracket | Public Insurance | Private Insurance |
| Under 6 | 0 (0.0%) | 0 (0.0%) |
| 6 to 18 Years | 0 (0.0%) | 0 (0.0%) |
| 19 to 25 Years | 0 (0.0%) | 7 (100.0%) |
| 25 to 34 Years | 0 (0.0%) | 0 (0.0%) |
| 35 to 44 Years | 0 (0.0%) | 0 (0.0%) |
| 45 to 54 Years | 0 (0.0%) | 0 (0.0%) |
| 55 to 64 Years | 0 (0.0%) | 3 (100.0%) |
| 65 to 74 Years | 24 (100.0%) | 24 (100.0%) |
| 75 Years and over | 0 (0.0%) | 0 (0.0%) |
| Total | 24 (42.9%) | 34 (60.7%) |
Disability Status by Sex by Age in Fiddletown
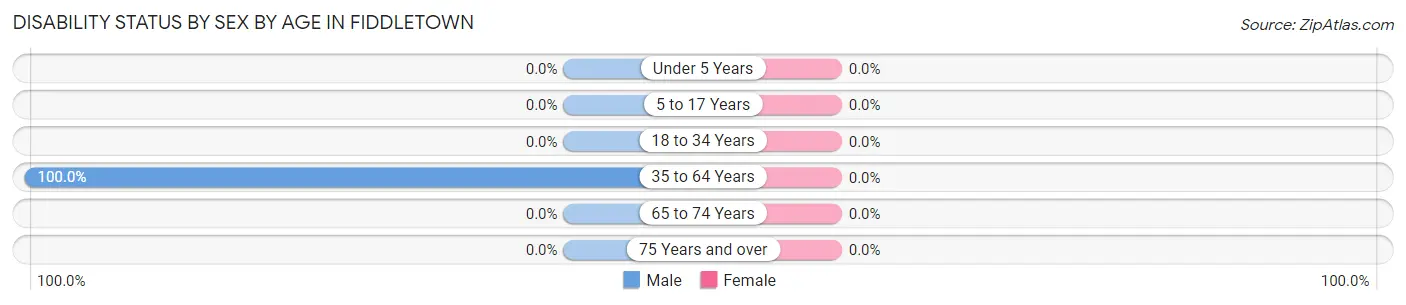
| Age Bracket | Male | Female |
| Under 5 Years | 0 (0.0%) | 0 (0.0%) |
| 5 to 17 Years | 0 (0.0%) | 0 (0.0%) |
| 18 to 34 Years | 0 (0.0%) | 0 (0.0%) |
| 35 to 64 Years | 22 (100.0%) | 0 (0.0%) |
| 65 to 74 Years | 0 (0.0%) | 0 (0.0%) |
| 75 Years and over | 0 (0.0%) | 0 (0.0%) |
Disability Class by Sex by Age in Fiddletown
Disability Class: Hearing Difficulty
| Age Bracket | Male | Female |
| Under 5 Years | 0 (0.0%) | 0 (0.0%) |
| 5 to 17 Years | 0 (0.0%) | 0 (0.0%) |
| 18 to 34 Years | 0 (0.0%) | 0 (0.0%) |
| 35 to 64 Years | 0 (0.0%) | 0 (0.0%) |
| 65 to 74 Years | 0 (0.0%) | 0 (0.0%) |
| 75 Years and over | 0 (0.0%) | 0 (0.0%) |
Disability Class: Vision Difficulty
| Age Bracket | Male | Female |
| Under 5 Years | 0 (0.0%) | 0 (0.0%) |
| 5 to 17 Years | 0 (0.0%) | 0 (0.0%) |
| 18 to 34 Years | 0 (0.0%) | 0 (0.0%) |
| 35 to 64 Years | 0 (0.0%) | 0 (0.0%) |
| 65 to 74 Years | 0 (0.0%) | 0 (0.0%) |
| 75 Years and over | 0 (0.0%) | 0 (0.0%) |
Disability Class: Cognitive Difficulty
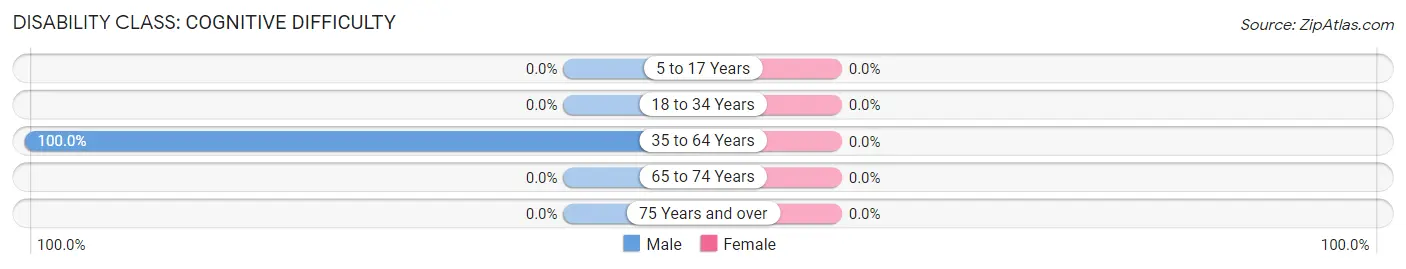
| Age Bracket | Male | Female |
| 5 to 17 Years | 0 (0.0%) | 0 (0.0%) |
| 18 to 34 Years | 0 (0.0%) | 0 (0.0%) |
| 35 to 64 Years | 22 (100.0%) | 0 (0.0%) |
| 65 to 74 Years | 0 (0.0%) | 0 (0.0%) |
| 75 Years and over | 0 (0.0%) | 0 (0.0%) |
Disability Class: Ambulatory Difficulty
| Age Bracket | Male | Female |
| 5 to 17 Years | 0 (0.0%) | 0 (0.0%) |
| 18 to 34 Years | 0 (0.0%) | 0 (0.0%) |
| 35 to 64 Years | 0 (0.0%) | 0 (0.0%) |
| 65 to 74 Years | 0 (0.0%) | 0 (0.0%) |
| 75 Years and over | 0 (0.0%) | 0 (0.0%) |
Disability Class: Self-Care Difficulty
| Age Bracket | Male | Female |
| 5 to 17 Years | 0 (0.0%) | 0 (0.0%) |
| 18 to 34 Years | 0 (0.0%) | 0 (0.0%) |
| 35 to 64 Years | 0 (0.0%) | 0 (0.0%) |
| 65 to 74 Years | 0 (0.0%) | 0 (0.0%) |
| 75 Years and over | 0 (0.0%) | 0 (0.0%) |
Technology Access in Fiddletown
Computing Device Access in Fiddletown
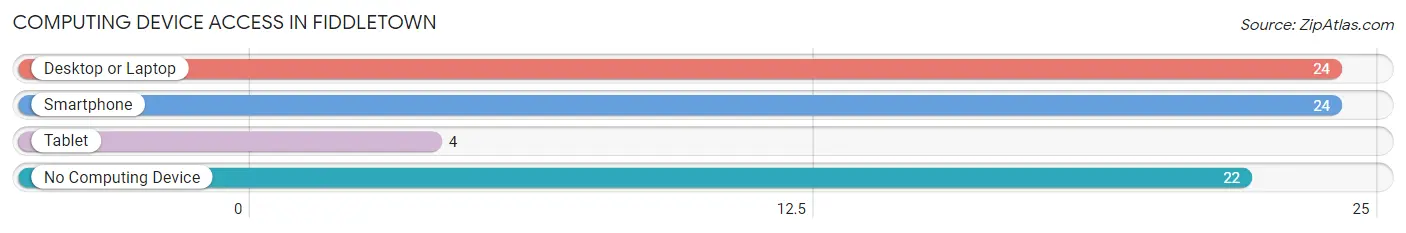
| Device Type | # Households | % Households |
| Desktop or Laptop | 24 | 52.2% |
| Smartphone | 24 | 52.2% |
| Tablet | 4 | 8.7% |
| No Computing Device | 22 | 47.8% |
| Total | 46 | 100.0% |
Internet Access in Fiddletown
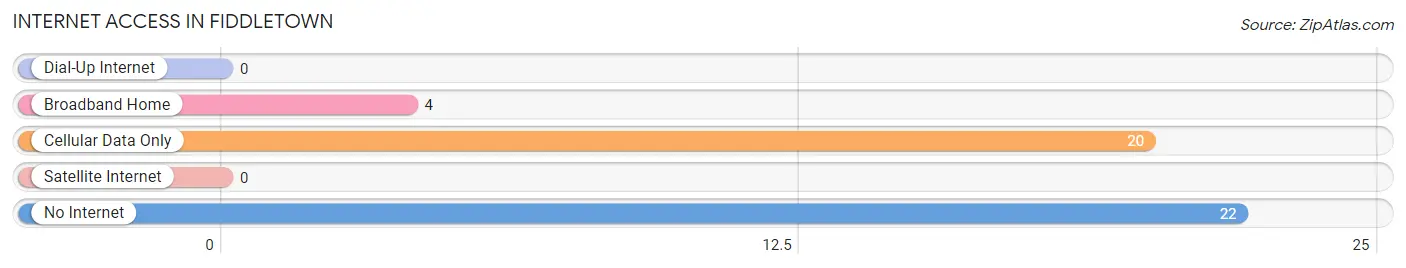
| Internet Type | # Households | % Households |
| Dial-Up Internet | 0 | 0.0% |
| Broadband Home | 4 | 8.7% |
| Cellular Data Only | 20 | 43.5% |
| Satellite Internet | 0 | 0.0% |
| No Internet | 22 | 47.8% |
| Total | 46 | 100.0% |
Fiddletown Summary
Fiddletown is a small unincorporated community located in Amador County, California. It is situated in the Sierra Nevada foothills, approximately 25 miles east of the city of Jackson. The town is named after a fiddle-playing miner who lived in the area in the 1850s.
History
Fiddletown was founded in 1849 during the California Gold Rush. It was one of the first settlements in Amador County and was originally known as “Fiddletown Flat”. The town was home to a number of gold mines, including the famous Kennedy Mine, which was one of the most productive in the state. The town was also home to a number of saloons, stores, and other businesses.
In the late 19th century, the town began to decline as the gold mines were depleted and the population dwindled. By the early 20th century, the town was largely abandoned. In the 1970s, the town was rediscovered by a group of artists and writers who were drawn to the area’s rural beauty and charm. The town was revitalized and is now home to a number of wineries, restaurants, and other businesses.
Geography
Fiddletown is located in the Sierra Nevada foothills, approximately 25 miles east of the city of Jackson. The town is situated at an elevation of 1,400 feet and is surrounded by rolling hills and oak-studded meadows. The town is located in the Shenandoah Valley, which is known for its picturesque scenery and abundant wildlife.
The climate in Fiddletown is mild and temperate, with hot summers and cool winters. The average annual temperature is around 60 degrees Fahrenheit. The area receives an average of 20 inches of precipitation per year, mostly in the form of rain.
Economy
Fiddletown’s economy is largely based on tourism and agriculture. The town is home to a number of wineries, restaurants, and other businesses that cater to visitors. The town is also home to a number of farms and ranches that produce a variety of fruits, vegetables, and livestock.
Demographics
As of the 2010 census, the population of Fiddletown was 545. The racial makeup of the town was 94.2% White, 0.7% African American, 0.4% Native American, 0.7% Asian, 0.2% Pacific Islander, and 3.0% from other races. The median household income was $45,000 and the median family income was $50,000. The per capita income was $20,000.
Fiddletown is a small, rural community with a rich history and a unique culture. The town is home to a number of wineries, restaurants, and other businesses that cater to visitors. The town is also home to a number of farms and ranches that produce a variety of fruits, vegetables, and livestock. The town is a popular destination for tourists and is known for its picturesque scenery and abundant wildlife.
Common Questions
What is Per Capita Income in Fiddletown?
Per Capita income in Fiddletown is $19,900.
What is Inequality or Gini Index in Fiddletown?
Inequality or Gini Index in Fiddletown is 0.60.
What is the Total Population of Fiddletown?
Total Population of Fiddletown is 56.
What is the Total Male Population of Fiddletown?
Total Male Population of Fiddletown is 46.
What is the Total Female Population of Fiddletown?
Total Female Population of Fiddletown is 10.
What is the Ratio of Males per 100 Females in Fiddletown?
There are 460.00 Males per 100 Females in Fiddletown.
What is the Ratio of Females per 100 Males in Fiddletown?
There are 21.74 Females per 100 Males in Fiddletown.
What is the Median Population Age in Fiddletown?
Median Population Age in Fiddletown is 36.0 Years.
What is the Average Family Size in Fiddletown
Average Family Size in Fiddletown is 3.5 People.
What is the Average Household Size in Fiddletown
Average Household Size in Fiddletown is 1.2 People.
How Large is the Labor Force in Fiddletown?
There are 10 People in the Labor Forcein in Fiddletown.
What is the Percentage of People in the Labor Force in Fiddletown?
17.9% of People are in the Labor Force in Fiddletown.