Cities with the Highest Percentage of Population with a Degree in Visual and Performing Arts in Georgia
RELATED REPORTS & OPTIONS
Visual and Performing Arts
Georgia
Compare Cities
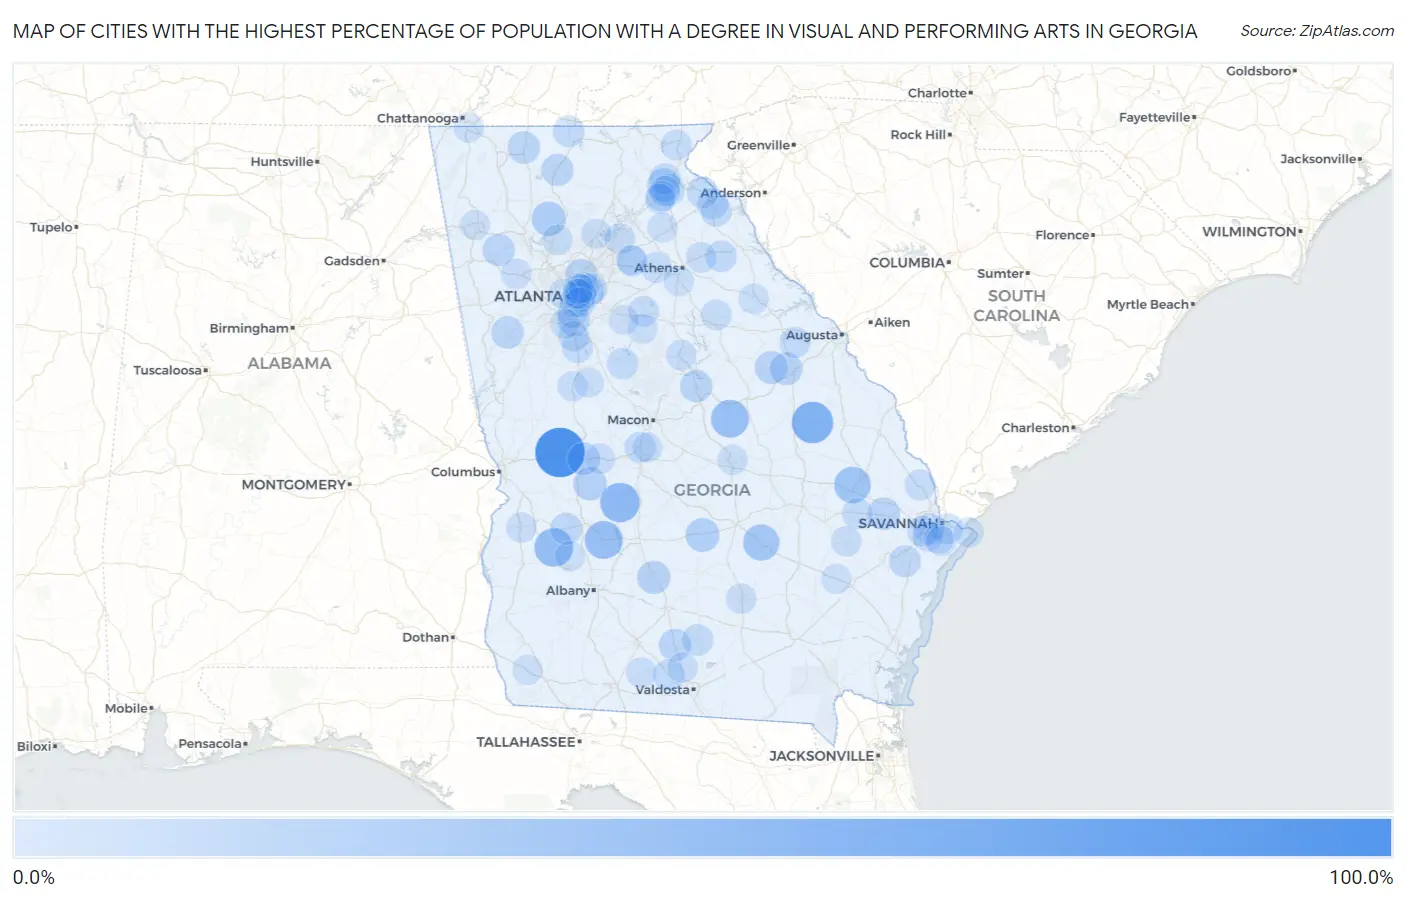
Map of Cities with the Highest Percentage of Population with a Degree in Visual and Performing Arts in Georgia
0.0%
100.0%
Cities with the Highest Percentage of Population with a Degree in Visual and Performing Arts in Georgia
| City | % Graduates | vs State | vs National | |
| 1. | Junction City | 100.0% | 3.8%(+96.2)#1 | 4.3%(+95.7)#9 |
| 2. | Midville | 60.0% | 3.8%(+56.2)#2 | 4.3%(+55.7)#81 |
| 3. | Dooling | 50.0% | 3.8%(+46.2)#3 | 4.3%(+45.7)#124 |
| 4. | Parrott | 45.5% | 3.8%(+41.7)#4 | 4.3%(+41.2)#147 |
| 5. | De Soto | 42.9% | 3.8%(+39.1)#5 | 4.3%(+38.6)#160 |
| 6. | Oconee | 42.3% | 3.8%(+38.5)#6 | 4.3%(+38.1)#163 |
| 7. | Register | 36.1% | 3.8%(+32.3)#7 | 4.3%(+31.9)#212 |
| 8. | Lumber City | 34.5% | 3.8%(+30.7)#8 | 4.3%(+30.2)#234 |
| 9. | Waleska | 25.9% | 3.8%(+22.1)#9 | 4.3%(+21.7)#399 |
| 10. | Rhine | 23.5% | 3.8%(+19.7)#10 | 4.3%(+19.3)#470 |
| 11. | Ideal | 21.7% | 3.8%(+17.9)#11 | 4.3%(+17.5)#537 |
| 12. | Sycamore | 20.6% | 3.8%(+16.8)#12 | 4.3%(+16.4)#592 |
| 13. | Demorest | 19.7% | 3.8%(+15.9)#13 | 4.3%(+15.4)#658 |
| 14. | Gibson | 18.9% | 3.8%(+15.1)#14 | 4.3%(+14.6)#717 |
| 15. | Butler | 18.4% | 3.8%(+14.6)#15 | 4.3%(+14.2)#748 |
| 16. | Stapleton | 18.2% | 3.8%(+14.4)#16 | 4.3%(+13.9)#762 |
| 17. | Pine Lake | 17.0% | 3.8%(+13.2)#17 | 4.3%(+12.8)#844 |
| 18. | Pembroke | 17.0% | 3.8%(+13.2)#18 | 4.3%(+12.7)#847 |
| 19. | Whitesburg | 16.7% | 3.8%(+12.9)#19 | 4.3%(+12.4)#879 |
| 20. | Milledgeville | 16.6% | 3.8%(+12.8)#20 | 4.3%(+12.4)#909 |
| 21. | Morrow | 16.4% | 3.8%(+12.6)#21 | 4.3%(+12.1)#921 |
| 22. | Eton | 16.3% | 3.8%(+12.5)#22 | 4.3%(+12.1)#927 |
| 23. | East Ellijay | 15.9% | 3.8%(+12.1)#23 | 4.3%(+11.6)#963 |
| 24. | Taylorsville | 15.9% | 3.8%(+12.1)#24 | 4.3%(+11.6)#964 |
| 25. | Doraville | 15.6% | 3.8%(+11.8)#25 | 4.3%(+11.3)#999 |
| 26. | Sparks | 15.6% | 3.8%(+11.8)#26 | 4.3%(+11.3)#1,000 |
| 27. | Mount Airy | 14.5% | 3.8%(+10.7)#27 | 4.3%(+10.2)#1,125 |
| 28. | Plains | 14.3% | 3.8%(+10.5)#28 | 4.3%(+10.0)#1,145 |
| 29. | Midway | 14.0% | 3.8%(+10.2)#29 | 4.3%(+9.77)#1,196 |
| 30. | Epworth | 12.8% | 3.8%(+8.97)#30 | 4.3%(+8.51)#1,378 |
| 31. | Avalon | 12.5% | 3.8%(+8.71)#31 | 4.3%(+8.25)#1,420 |
| 32. | Morven | 12.1% | 3.8%(+8.33)#32 | 4.3%(+7.87)#1,502 |
| 33. | Nashville | 11.9% | 3.8%(+8.10)#33 | 4.3%(+7.64)#1,545 |
| 34. | Carlton | 11.8% | 3.8%(+7.97)#34 | 4.3%(+7.51)#1,576 |
| 35. | West Brow | 11.6% | 3.8%(+7.81)#35 | 4.3%(+7.35)#1,609 |
| 36. | Clarkesville | 11.3% | 3.8%(+7.49)#36 | 4.3%(+7.02)#1,659 |
| 37. | Hampton | 11.0% | 3.8%(+7.17)#37 | 4.3%(+6.71)#1,756 |
| 38. | Flovilla | 10.9% | 3.8%(+7.15)#38 | 4.3%(+6.69)#1,765 |
| 39. | Byron | 10.9% | 3.8%(+7.14)#39 | 4.3%(+6.68)#1,766 |
| 40. | Conley | 10.9% | 3.8%(+7.11)#40 | 4.3%(+6.65)#1,773 |
| 41. | Belvedere Park | 10.7% | 3.8%(+6.94)#41 | 4.3%(+6.48)#1,820 |
| 42. | Lavonia | 10.6% | 3.8%(+6.84)#42 | 4.3%(+6.38)#1,862 |
| 43. | Thunderbolt | 10.6% | 3.8%(+6.78)#43 | 4.3%(+6.32)#1,878 |
| 44. | Dearing | 10.2% | 3.8%(+6.39)#44 | 4.3%(+5.93)#2,004 |
| 45. | Stone Mountain | 10.1% | 3.8%(+6.31)#45 | 4.3%(+5.85)#2,028 |
| 46. | Bowersville | 10.0% | 3.8%(+6.21)#46 | 4.3%(+5.75)#2,064 |
| 47. | Springfield | 9.5% | 3.8%(+5.69)#47 | 4.3%(+5.22)#2,257 |
| 48. | Savannah | 9.5% | 3.8%(+5.68)#48 | 4.3%(+5.21)#2,259 |
| 49. | Scottdale | 9.4% | 3.8%(+5.64)#49 | 4.3%(+5.18)#2,277 |
| 50. | Henderson | 9.4% | 3.8%(+5.60)#50 | 4.3%(+5.14)#2,291 |
| 51. | Bonanza | 9.3% | 3.8%(+5.47)#51 | 4.3%(+5.01)#2,337 |
| 52. | Union Point | 9.2% | 3.8%(+5.42)#52 | 4.3%(+4.96)#2,352 |
| 53. | Daisy | 9.1% | 3.8%(+5.30)#53 | 4.3%(+4.84)#2,403 |
| 54. | Statham | 9.0% | 3.8%(+5.23)#54 | 4.3%(+4.77)#2,445 |
| 55. | Tiger | 8.8% | 3.8%(+5.00)#55 | 4.3%(+4.54)#2,559 |
| 56. | Social Circle | 8.5% | 3.8%(+4.75)#56 | 4.3%(+4.29)#2,675 |
| 57. | Avondale Estates | 8.4% | 3.8%(+4.64)#57 | 4.3%(+4.18)#2,730 |
| 58. | Eatonton | 8.4% | 3.8%(+4.59)#58 | 4.3%(+4.13)#2,752 |
| 59. | Colbert | 8.2% | 3.8%(+4.46)#59 | 4.3%(+4.00)#2,842 |
| 60. | Holly Springs | 8.0% | 3.8%(+4.22)#60 | 4.3%(+3.76)#2,959 |
| 61. | Douglas | 8.0% | 3.8%(+4.17)#61 | 4.3%(+3.71)#3,001 |
| 62. | Flowery Branch | 7.9% | 3.8%(+4.14)#62 | 4.3%(+3.68)#3,015 |
| 63. | Dallas | 7.8% | 3.8%(+4.03)#63 | 4.3%(+3.57)#3,074 |
| 64. | Gresham Park | 7.8% | 3.8%(+3.96)#64 | 4.3%(+3.50)#3,123 |
| 65. | Reynolds | 7.7% | 3.8%(+3.90)#65 | 4.3%(+3.44)#3,146 |
| 66. | Carl | 7.7% | 3.8%(+3.90)#66 | 4.3%(+3.44)#3,161 |
| 67. | Hahira | 7.6% | 3.8%(+3.84)#67 | 4.3%(+3.38)#3,205 |
| 68. | Cornelia | 7.5% | 3.8%(+3.75)#68 | 4.3%(+3.28)#3,273 |
| 69. | Glennville | 7.4% | 3.8%(+3.62)#69 | 4.3%(+3.16)#3,343 |
| 70. | Georgetown | 7.3% | 3.8%(+3.55)#70 | 4.3%(+3.09)#3,404 |
| 71. | Pavo | 7.3% | 3.8%(+3.53)#71 | 4.3%(+3.06)#3,429 |
| 72. | Clarkston | 7.2% | 3.8%(+3.45)#72 | 4.3%(+2.99)#3,496 |
| 73. | Lakeview | 7.2% | 3.8%(+3.45)#73 | 4.3%(+2.99)#3,497 |
| 74. | Zebulon | 7.1% | 3.8%(+3.27)#74 | 4.3%(+2.81)#3,657 |
| 75. | Lumpkin | 7.0% | 3.8%(+3.25)#75 | 4.3%(+2.79)#3,671 |
| 76. | Auburn | 7.0% | 3.8%(+3.21)#76 | 4.3%(+2.75)#3,701 |
| 77. | Dublin | 7.0% | 3.8%(+3.16)#77 | 4.3%(+2.70)#3,743 |
| 78. | Baldwin | 6.9% | 3.8%(+3.13)#78 | 4.3%(+2.67)#3,768 |
| 79. | Washington | 6.9% | 3.8%(+3.10)#79 | 4.3%(+2.64)#3,801 |
| 80. | North Decatur | 6.8% | 3.8%(+3.04)#80 | 4.3%(+2.58)#3,855 |
| 81. | Bronwood | 6.7% | 3.8%(+2.88)#81 | 4.3%(+2.41)#4,037 |
| 82. | Rome | 6.7% | 3.8%(+2.87)#82 | 4.3%(+2.41)#4,064 |
| 83. | Montgomery | 6.6% | 3.8%(+2.86)#83 | 4.3%(+2.40)#4,075 |
| 84. | Centerville | 6.6% | 3.8%(+2.84)#84 | 4.3%(+2.38)#4,090 |
| 85. | Vernonburg | 6.6% | 3.8%(+2.79)#85 | 4.3%(+2.33)#4,137 |
| 86. | Milner | 6.6% | 3.8%(+2.77)#86 | 4.3%(+2.31)#4,147 |
| 87. | Panthersville | 6.5% | 3.8%(+2.68)#87 | 4.3%(+2.22)#4,225 |
| 88. | Brinson | 6.5% | 3.8%(+2.66)#88 | 4.3%(+2.20)#4,245 |
| 89. | Watkinsville | 6.4% | 3.8%(+2.60)#89 | 4.3%(+2.14)#4,301 |
| 90. | Mansfield | 6.4% | 3.8%(+2.59)#90 | 4.3%(+2.13)#4,314 |
| 91. | Athens-Clarke County Unified Government (Balance) | 6.3% | 3.8%(+2.55)#91 | 4.3%(+2.09)#4,348 |
| 92. | Riverdale | 6.3% | 3.8%(+2.54)#92 | 4.3%(+2.08)#4,359 |
| 93. | Alto | 6.2% | 3.8%(+2.46)#93 | 4.3%(+2.00)#4,427 |
| 94. | Odum | 6.2% | 3.8%(+2.46)#94 | 4.3%(+2.00)#4,447 |
| 95. | Porterdale | 6.1% | 3.8%(+2.33)#95 | 4.3%(+1.87)#4,575 |
| 96. | Maysville | 6.1% | 3.8%(+2.31)#96 | 4.3%(+1.85)#4,595 |
| 97. | Tybee Island | 6.1% | 3.8%(+2.28)#97 | 4.3%(+1.82)#4,630 |
| 98. | Atlanta | 6.1% | 3.8%(+2.27)#98 | 4.3%(+1.81)#4,644 |
| 99. | Decatur | 5.9% | 3.8%(+2.16)#99 | 4.3%(+1.70)#4,765 |
| 100. | Cumming | 5.9% | 3.8%(+2.10)#100 | 4.3%(+1.64)#4,826 |
Common Questions
What are the Top 10 Cities with the Highest Percentage of Population with a Degree in Visual and Performing Arts in Georgia?
Top 10 Cities with the Highest Percentage of Population with a Degree in Visual and Performing Arts in Georgia are:
#1
100.0%
#2
60.0%
#3
50.0%
#4
45.5%
#5
42.9%
#6
42.3%
#7
36.1%
#8
34.5%
#9
25.9%
#10
23.5%
What city has the Highest Percentage of Population with a Degree in Visual and Performing Arts in Georgia?
Junction City has the Highest Percentage of Population with a Degree in Visual and Performing Arts in Georgia with 100.0%.
What is the Percentage of Population with a Degree in Visual and Performing Arts in the State of Georgia?
Percentage of Population with a Degree in Visual and Performing Arts in Georgia is 3.8%.
What is the Percentage of Population with a Degree in Visual and Performing Arts in the United States?
Percentage of Population with a Degree in Visual and Performing Arts in the United States is 4.3%.