Zip Codes with the Highest Percentage of Population with a Degree in Visual and Performing Arts in San Francisco, CA
RELATED REPORTS & OPTIONS
Visual and Performing Arts
San Francisco
Compare Zip Codes
Map of Zip Codes with the Highest Percentage of Population with a Degree in Visual and Performing Arts in San Francisco
4.2%
12.1%
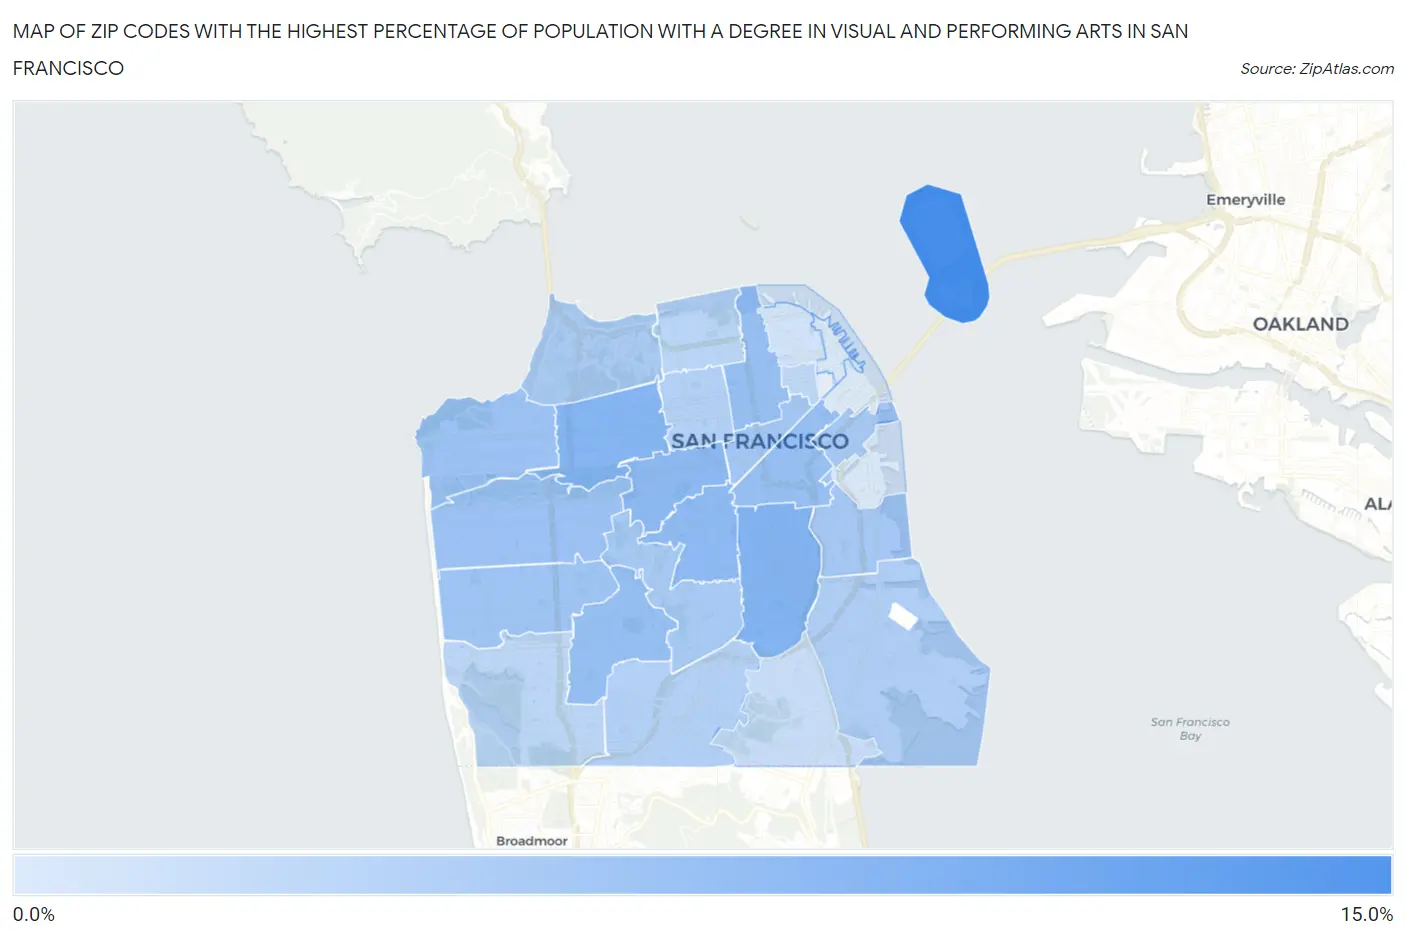
Zip Codes with the Highest Percentage of Population with a Degree in Visual and Performing Arts in San Francisco, CA
| Zip Code | % Graduates | vs State | vs National | |
| 1. | 94130 | 12.1% | 5.7% (+6.37)#134 | 4.3% (+7.86)#1,265 |
| 2. | 94110 | 8.9% | 5.7% (+3.18)#248 | 4.3% (+4.67)#2,295 |
| 3. | 94118 | 8.7% | 5.7% (+2.97)#270 | 4.3% (+4.46)#2,412 |
| 4. | 94117 | 8.4% | 5.7% (+2.68)#298 | 4.3% (+4.16)#2,591 |
| 5. | 94114 | 8.3% | 5.7% (+2.55)#308 | 4.3% (+4.04)#2,663 |
| 6. | 94127 | 7.9% | 5.7% (+2.17)#326 | 4.3% (+3.66)#2,918 |
| 7. | 94103 | 7.8% | 5.7% (+2.02)#341 | 4.3% (+3.51)#3,010 |
| 8. | 94109 | 7.7% | 5.7% (+1.96)#345 | 4.3% (+3.45)#3,048 |
| 9. | 94121 | 7.6% | 5.7% (+1.84)#355 | 4.3% (+3.33)#3,159 |
| 10. | 94122 | 7.5% | 5.7% (+1.72)#372 | 4.3% (+3.21)#3,248 |
| 11. | 94116 | 7.4% | 5.7% (+1.68)#375 | 4.3% (+3.17)#3,274 |
| 12. | 94102 | 7.2% | 5.7% (+1.43)#392 | 4.3% (+2.92)#3,484 |
| 13. | 94107 | 7.0% | 5.7% (+1.28)#406 | 4.3% (+2.77)#3,642 |
| 14. | 94131 | 7.0% | 5.7% (+1.21)#415 | 4.3% (+2.70)#3,709 |
| 15. | 94129 | 6.7% | 5.7% (+0.991)#432 | 4.3% (+2.48)#3,951 |
| 16. | 94124 | 6.6% | 5.7% (+0.828)#454 | 4.3% (+2.31)#4,160 |
| 17. | 94115 | 6.3% | 5.7% (+0.610)#475 | 4.3% (+2.10)#4,411 |
| 18. | 94112 | 6.3% | 5.7% (+0.600)#477 | 4.3% (+2.09)#4,423 |
| 19. | 94123 | 5.9% | 5.7% (+0.203)#518 | 4.3% (+1.69)#4,951 |
| 20. | 94132 | 5.9% | 5.7% (+0.137)#524 | 4.3% (+1.62)#5,047 |
| 21. | 94108 | 5.7% | 5.7% (-0.031)#544 | 4.3% (+1.46)#5,317 |
| 22. | 94134 | 5.2% | 5.7% (-0.505)#624 | 4.3% (+0.982)#6,179 |
| 23. | 94133 | 4.8% | 5.7% (-0.980)#700 | 4.3% (+0.507)#7,173 |
| 24. | 94111 | 4.4% | 5.7% (-1.29)#766 | 4.3% (+0.195)#7,948 |
| 25. | 94158 | 4.3% | 5.7% (-1.49)#809 | 4.3% (+0.002)#8,481 |
| 26. | 94105 | 4.2% | 5.7% (-1.57)#830 | 4.3% (-0.084)#8,721 |
1
Common Questions
What are the Top 10 Zip Codes with the Highest Percentage of Population with a Degree in Visual and Performing Arts in San Francisco, CA?
Top 10 Zip Codes with the Highest Percentage of Population with a Degree in Visual and Performing Arts in San Francisco, CA are:
What zip code has the Highest Percentage of Population with a Degree in Visual and Performing Arts in San Francisco, CA?
94130 has the Highest Percentage of Population with a Degree in Visual and Performing Arts in San Francisco, CA with 12.1%.
What is the Percentage of Population with a Degree in Visual and Performing Arts in San Francisco, CA?
Percentage of Population with a Degree in Visual and Performing Arts in San Francisco is 7.2%.
What is the Percentage of Population with a Degree in Visual and Performing Arts in California?
Percentage of Population with a Degree in Visual and Performing Arts in California is 5.7%.
What is the Percentage of Population with a Degree in Visual and Performing Arts in the United States?
Percentage of Population with a Degree in Visual and Performing Arts in the United States is 4.3%.