Zip Codes with the Highest Percentage of Population with a Degree in Visual and Performing Arts in Manteca, CA
RELATED REPORTS & OPTIONS
Visual and Performing Arts
Manteca
Compare Zip Codes
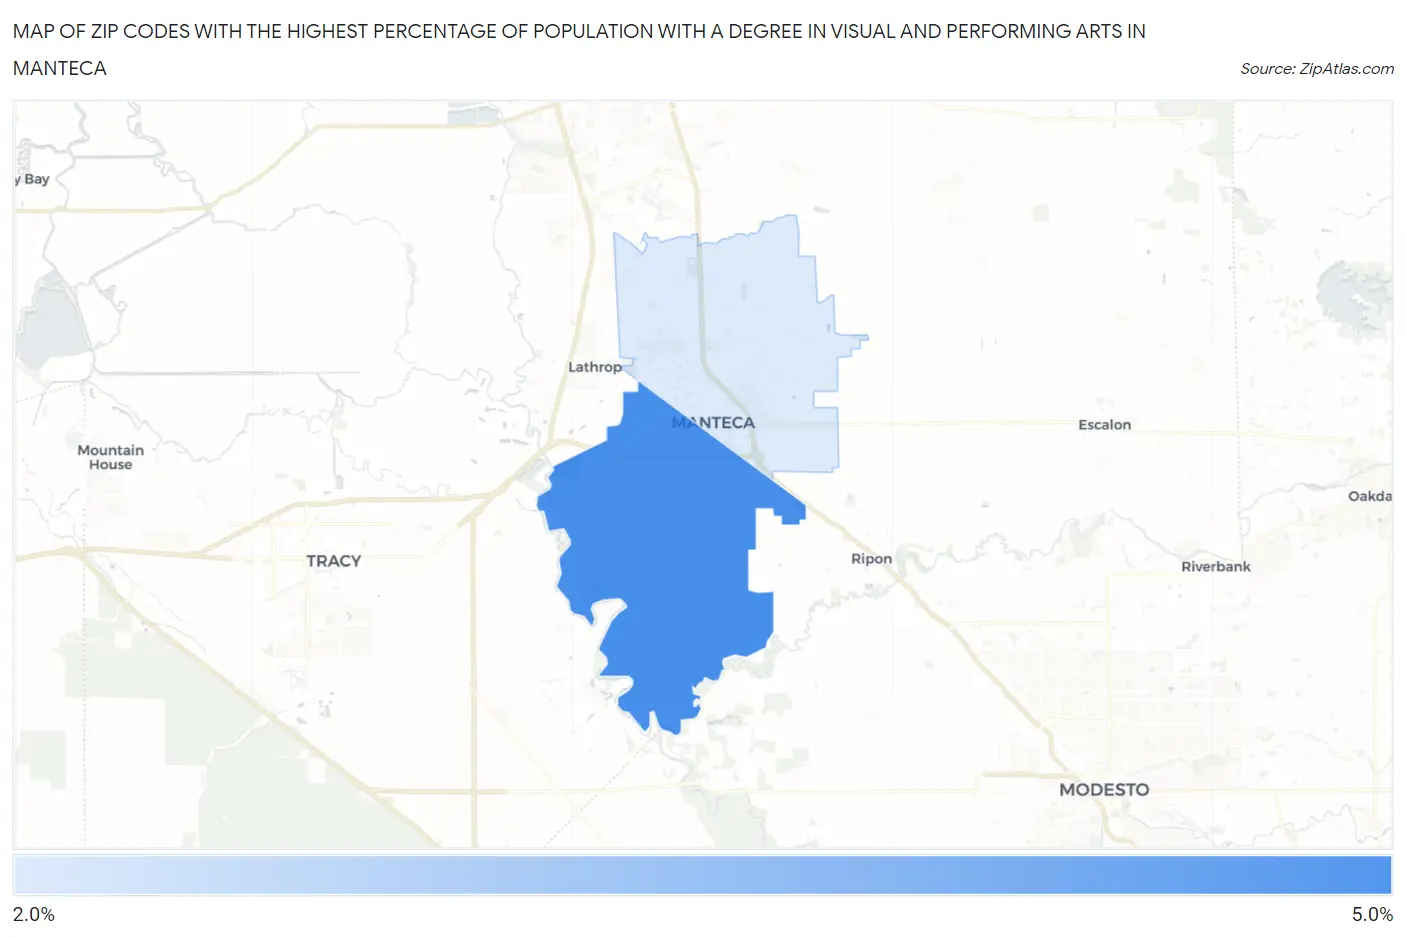
Map of Zip Codes with the Highest Percentage of Population with a Degree in Visual and Performing Arts in Manteca
2.5%
4.5%
Zip Codes with the Highest Percentage of Population with a Degree in Visual and Performing Arts in Manteca, CA
| Zip Code | % Graduates | vs State | vs National | |
| 1. | 95337 | 4.5% | 5.7%(-1.27)#764 | 4.3%(+0.218)#7,889 |
| 2. | 95336 | 2.5% | 5.7%(-3.26)#1,201 | 4.3%(-1.77)#14,690 |
1
Common Questions
What are the Top Zip Codes with the Highest Percentage of Population with a Degree in Visual and Performing Arts in Manteca, CA?
Top Zip Codes with the Highest Percentage of Population with a Degree in Visual and Performing Arts in Manteca, CA are:
What zip code has the Highest Percentage of Population with a Degree in Visual and Performing Arts in Manteca, CA?
95337 has the Highest Percentage of Population with a Degree in Visual and Performing Arts in Manteca, CA with 4.5%.
What is the Percentage of Population with a Degree in Visual and Performing Arts in Manteca, CA?
Percentage of Population with a Degree in Visual and Performing Arts in Manteca is 3.9%.
What is the Percentage of Population with a Degree in Visual and Performing Arts in California?
Percentage of Population with a Degree in Visual and Performing Arts in California is 5.7%.
What is the Percentage of Population with a Degree in Visual and Performing Arts in the United States?
Percentage of Population with a Degree in Visual and Performing Arts in the United States is 4.3%.