Cities with the Highest Percentage of Population with a Degree in Visual and Performing Arts in Virginia
RELATED REPORTS & OPTIONS
Visual and Performing Arts
Virginia
Compare Cities
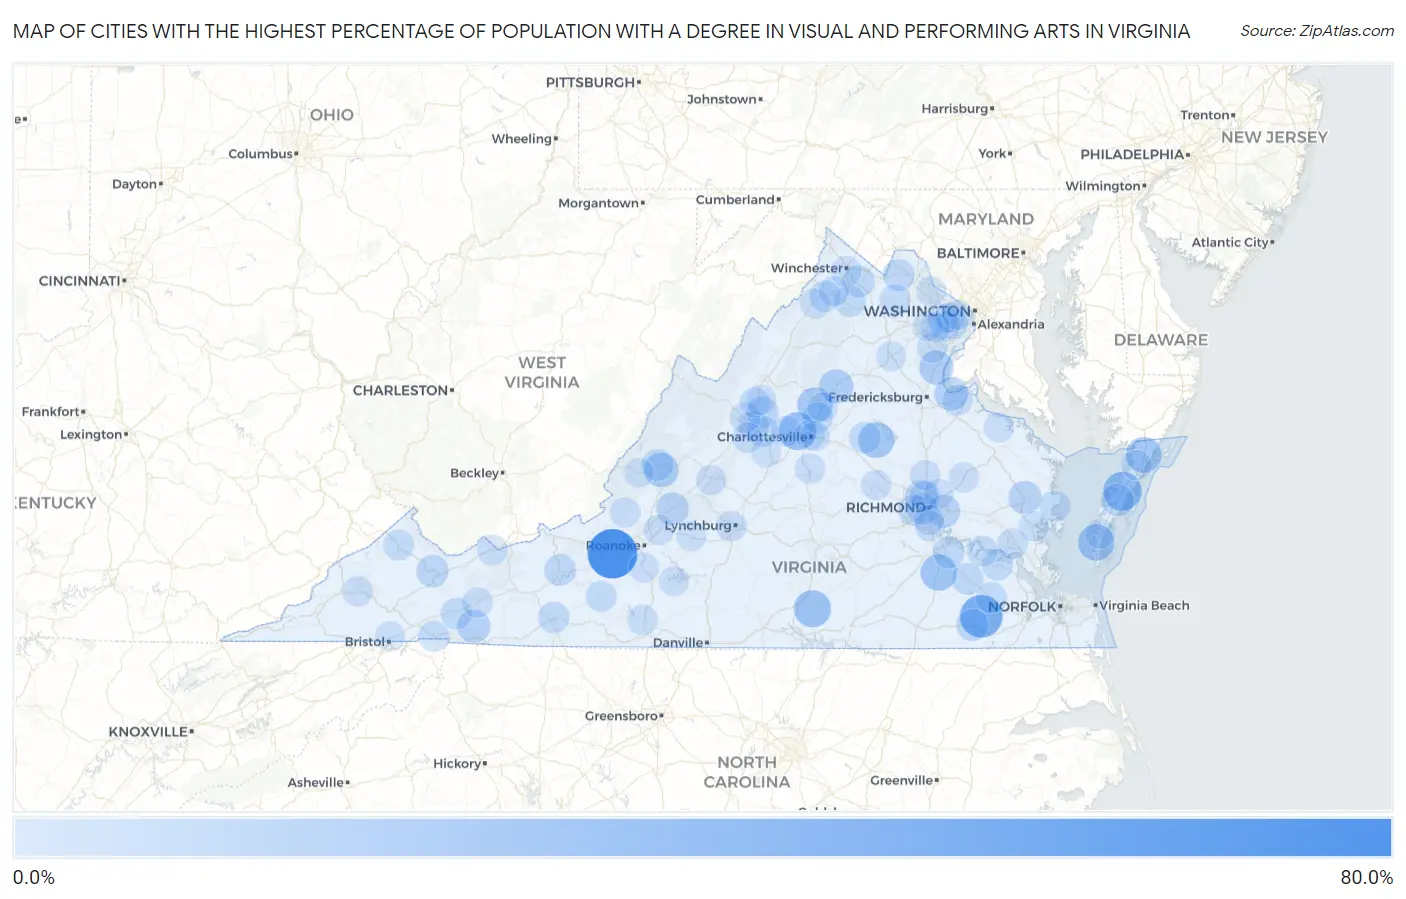
Map of Cities with the Highest Percentage of Population with a Degree in Visual and Performing Arts in Virginia
0.0%
80.0%
Cities with the Highest Percentage of Population with a Degree in Visual and Performing Arts in Virginia
| City | % Graduates | vs State | vs National | |
| 1. | Elliston | 61.5% | 3.7%(+57.8)#1 | 4.3%(+57.3)#76 |
| 2. | Sedley | 41.4% | 3.7%(+37.6)#2 | 4.3%(+37.1)#167 |
| 3. | Melfa | 29.5% | 3.7%(+25.8)#3 | 4.3%(+25.2)#317 |
| 4. | Ivy | 27.0% | 3.7%(+23.2)#4 | 4.3%(+22.7)#376 |
| 5. | Fairview | 25.0% | 3.7%(+21.3)#5 | 4.3%(+20.7)#428 |
| 6. | Templeton | 23.2% | 3.7%(+19.5)#6 | 4.3%(+19.0)#481 |
| 7. | Cheriton | 23.1% | 3.7%(+19.4)#7 | 4.3%(+18.8)#483 |
| 8. | Mineral | 21.7% | 3.7%(+18.0)#8 | 4.3%(+17.5)#538 |
| 9. | Temperanceville | 21.6% | 3.7%(+17.9)#9 | 4.3%(+17.4)#546 |
| 10. | Twin Lakes | 20.3% | 3.7%(+16.5)#10 | 4.3%(+16.0)#614 |
| 11. | Iron Gate | 17.9% | 3.7%(+14.1)#11 | 4.3%(+13.6)#792 |
| 12. | Madison | 16.9% | 3.7%(+13.2)#12 | 4.3%(+12.6)#858 |
| 13. | Boswell S Corner | 16.7% | 3.7%(+12.9)#13 | 4.3%(+12.4)#869 |
| 14. | Fairview Beach | 15.1% | 3.7%(+11.4)#14 | 4.3%(+10.8)#1,048 |
| 15. | Troutdale | 14.3% | 3.7%(+10.6)#15 | 4.3%(+10.0)#1,160 |
| 16. | Saluda | 13.6% | 3.7%(+9.92)#16 | 4.3%(+9.38)#1,243 |
| 17. | Sandston | 13.4% | 3.7%(+9.72)#17 | 4.3%(+9.19)#1,272 |
| 18. | Weems | 13.0% | 3.7%(+9.27)#18 | 4.3%(+8.73)#1,348 |
| 19. | Buchanan | 12.9% | 3.7%(+9.21)#19 | 4.3%(+8.68)#1,352 |
| 20. | Painter | 12.5% | 3.7%(+8.78)#20 | 4.3%(+8.25)#1,423 |
| 21. | Richlands | 11.8% | 3.7%(+8.11)#21 | 4.3%(+7.57)#1,557 |
| 22. | Dumbarton | 11.8% | 3.7%(+8.08)#22 | 4.3%(+7.55)#1,563 |
| 23. | Courtland | 11.3% | 3.7%(+7.54)#23 | 4.3%(+7.01)#1,663 |
| 24. | New Hope | 10.8% | 3.7%(+7.08)#24 | 4.3%(+6.55)#1,803 |
| 25. | Boyce | 10.5% | 3.7%(+6.81)#25 | 4.3%(+6.27)#1,887 |
| 26. | Purcellville | 10.4% | 3.7%(+6.65)#26 | 4.3%(+6.11)#1,940 |
| 27. | Prince George | 10.3% | 3.7%(+6.55)#27 | 4.3%(+6.01)#1,971 |
| 28. | Clifton Forge | 10.0% | 3.7%(+6.32)#28 | 4.3%(+5.79)#2,042 |
| 29. | Waverly | 9.9% | 3.7%(+6.16)#29 | 4.3%(+5.63)#2,107 |
| 30. | Dublin | 9.8% | 3.7%(+6.09)#30 | 4.3%(+5.55)#2,131 |
| 31. | Shenandoah Shores | 9.7% | 3.7%(+5.96)#31 | 4.3%(+5.43)#2,180 |
| 32. | Hillsville | 9.6% | 3.7%(+5.88)#32 | 4.3%(+5.34)#2,212 |
| 33. | Waterford | 9.5% | 3.7%(+5.76)#33 | 4.3%(+5.23)#2,256 |
| 34. | Louisa | 9.3% | 3.7%(+5.61)#34 | 4.3%(+5.07)#2,311 |
| 35. | Adwolf | 9.2% | 3.7%(+5.50)#35 | 4.3%(+4.97)#2,348 |
| 36. | Surry | 9.1% | 3.7%(+5.37)#36 | 4.3%(+4.84)#2,415 |
| 37. | Dinwiddie | 9.0% | 3.7%(+5.27)#37 | 4.3%(+4.73)#2,463 |
| 38. | Strasburg | 8.9% | 3.7%(+5.16)#38 | 4.3%(+4.63)#2,517 |
| 39. | Waynesboro | 8.8% | 3.7%(+5.12)#39 | 4.3%(+4.58)#2,533 |
| 40. | Deltaville | 8.7% | 3.7%(+4.95)#40 | 4.3%(+4.42)#2,616 |
| 41. | Ivor | 8.6% | 3.7%(+4.85)#41 | 4.3%(+4.32)#2,665 |
| 42. | Richmond | 8.4% | 3.7%(+4.72)#42 | 4.3%(+4.18)#2,725 |
| 43. | Middleburg | 8.4% | 3.7%(+4.70)#43 | 4.3%(+4.17)#2,736 |
| 44. | Kings Park | 8.4% | 3.7%(+4.68)#44 | 4.3%(+4.15)#2,742 |
| 45. | Claremont | 8.3% | 3.7%(+4.62)#45 | 4.3%(+4.08)#2,782 |
| 46. | Grundy | 8.2% | 3.7%(+4.50)#46 | 4.3%(+3.96)#2,865 |
| 47. | Bon Air | 8.0% | 3.7%(+4.27)#47 | 4.3%(+3.74)#2,981 |
| 48. | Damascus | 7.9% | 3.7%(+4.18)#48 | 4.3%(+3.64)#3,028 |
| 49. | Piney Mountain | 7.9% | 3.7%(+4.17)#49 | 4.3%(+3.63)#3,035 |
| 50. | Floyd | 7.9% | 3.7%(+4.16)#50 | 4.3%(+3.63)#3,039 |
| 51. | Fishersville | 7.8% | 3.7%(+4.06)#51 | 4.3%(+3.53)#3,102 |
| 52. | Staunton | 7.7% | 3.7%(+4.03)#52 | 4.3%(+3.50)#3,125 |
| 53. | King George | 7.5% | 3.7%(+3.74)#53 | 4.3%(+3.21)#3,316 |
| 54. | George Mason | 7.0% | 3.7%(+3.29)#54 | 4.3%(+2.75)#3,700 |
| 55. | Williamsburg | 6.9% | 3.7%(+3.22)#55 | 4.3%(+2.69)#3,753 |
| 56. | Lakeside | 6.9% | 3.7%(+3.17)#56 | 4.3%(+2.63)#3,806 |
| 57. | Winchester | 6.8% | 3.7%(+3.11)#57 | 4.3%(+2.57)#3,858 |
| 58. | Goochland | 6.8% | 3.7%(+3.10)#58 | 4.3%(+2.57)#3,874 |
| 59. | Boones Mill | 6.8% | 3.7%(+3.06)#59 | 4.3%(+2.53)#3,925 |
| 60. | Blue Ridge | 6.8% | 3.7%(+3.05)#60 | 4.3%(+2.51)#3,935 |
| 61. | Bluefield | 6.8% | 3.7%(+3.04)#61 | 4.3%(+2.50)#3,949 |
| 62. | Buena Vista | 6.8% | 3.7%(+3.04)#62 | 4.3%(+2.50)#3,950 |
| 63. | Independent Hill | 6.7% | 3.7%(+3.02)#63 | 4.3%(+2.48)#3,970 |
| 64. | Stanleytown | 6.7% | 3.7%(+3.00)#64 | 4.3%(+2.46)#3,985 |
| 65. | Crozet | 6.7% | 3.7%(+2.99)#65 | 4.3%(+2.46)#3,988 |
| 66. | Scottsville | 6.7% | 3.7%(+2.99)#66 | 4.3%(+2.46)#3,992 |
| 67. | Lynchburg | 6.6% | 3.7%(+2.92)#67 | 4.3%(+2.38)#4,088 |
| 68. | Central Garage | 6.6% | 3.7%(+2.90)#68 | 4.3%(+2.37)#4,102 |
| 69. | Coeburn | 6.6% | 3.7%(+2.86)#69 | 4.3%(+2.32)#4,139 |
| 70. | Bellwood | 6.6% | 3.7%(+2.85)#70 | 4.3%(+2.31)#4,141 |
| 71. | Atkins | 6.5% | 3.7%(+2.78)#71 | 4.3%(+2.24)#4,204 |
| 72. | New Castle | 6.3% | 3.7%(+2.61)#72 | 4.3%(+2.08)#4,366 |
| 73. | Middletown | 6.3% | 3.7%(+2.61)#73 | 4.3%(+2.07)#4,372 |
| 74. | Bensley | 6.3% | 3.7%(+2.56)#74 | 4.3%(+2.03)#4,405 |
| 75. | Stuarts Draft | 6.2% | 3.7%(+2.49)#75 | 4.3%(+1.96)#4,492 |
| 76. | Ashland | 6.1% | 3.7%(+2.41)#76 | 4.3%(+1.87)#4,573 |
| 77. | Mount Sidney | 6.0% | 3.7%(+2.30)#77 | 4.3%(+1.77)#4,700 |
| 78. | Earlysville | 6.0% | 3.7%(+2.28)#78 | 4.3%(+1.75)#4,723 |
| 79. | Bloxom | 5.9% | 3.7%(+2.17)#79 | 4.3%(+1.63)#4,848 |
| 80. | Toms Brook | 5.9% | 3.7%(+2.17)#80 | 4.3%(+1.63)#4,852 |
| 81. | Mechanicsville | 5.9% | 3.7%(+2.14)#81 | 4.3%(+1.61)#4,882 |
| 82. | Dulles Town Center | 5.9% | 3.7%(+2.14)#82 | 4.3%(+1.60)#4,885 |
| 83. | Bedford | 5.8% | 3.7%(+2.07)#83 | 4.3%(+1.53)#4,960 |
| 84. | Charlottesville | 5.8% | 3.7%(+2.05)#84 | 4.3%(+1.52)#4,972 |
| 85. | Burke Centre | 5.7% | 3.7%(+2.03)#85 | 4.3%(+1.49)#5,011 |
| 86. | Gloucester Courthouse | 5.7% | 3.7%(+2.02)#86 | 4.3%(+1.49)#5,018 |
| 87. | Weyers Cave | 5.7% | 3.7%(+2.02)#87 | 4.3%(+1.49)#5,020 |
| 88. | Ruckersville | 5.7% | 3.7%(+2.02)#88 | 4.3%(+1.48)#5,027 |
| 89. | Bealeton | 5.7% | 3.7%(+1.98)#89 | 4.3%(+1.45)#5,069 |
| 90. | Nellysford | 5.7% | 3.7%(+1.93)#90 | 4.3%(+1.40)#5,119 |
| 91. | Mantua | 5.6% | 3.7%(+1.93)#91 | 4.3%(+1.39)#5,125 |
| 92. | Eastville | 5.6% | 3.7%(+1.92)#92 | 4.3%(+1.38)#5,142 |
| 93. | Yorkshire | 5.6% | 3.7%(+1.91)#93 | 4.3%(+1.38)#5,148 |
| 94. | Bristol | 5.6% | 3.7%(+1.90)#94 | 4.3%(+1.37)#5,154 |
| 95. | West Falls Church | 5.6% | 3.7%(+1.90)#95 | 4.3%(+1.37)#5,157 |
| 96. | Montross | 5.6% | 3.7%(+1.88)#96 | 4.3%(+1.35)#5,183 |
| 97. | Clifton | 5.6% | 3.7%(+1.87)#97 | 4.3%(+1.33)#5,196 |
| 98. | Pantops | 5.6% | 3.7%(+1.84)#98 | 4.3%(+1.31)#5,219 |
| 99. | Union Hall | 5.6% | 3.7%(+1.84)#99 | 4.3%(+1.30)#5,230 |
| 100. | Covington | 5.5% | 3.7%(+1.83)#100 | 4.3%(+1.29)#5,266 |
Common Questions
What are the Top 10 Cities with the Highest Percentage of Population with a Degree in Visual and Performing Arts in Virginia?
Top 10 Cities with the Highest Percentage of Population with a Degree in Visual and Performing Arts in Virginia are:
#1
61.5%
#2
41.4%
#3
29.5%
#4
27.0%
#5
25.0%
#6
23.2%
#7
23.1%
#8
21.7%
#9
21.6%
#10
20.3%
What city has the Highest Percentage of Population with a Degree in Visual and Performing Arts in Virginia?
Elliston has the Highest Percentage of Population with a Degree in Visual and Performing Arts in Virginia with 61.5%.
What is the Percentage of Population with a Degree in Visual and Performing Arts in the State of Virginia?
Percentage of Population with a Degree in Visual and Performing Arts in Virginia is 3.7%.
What is the Percentage of Population with a Degree in Visual and Performing Arts in the United States?
Percentage of Population with a Degree in Visual and Performing Arts in the United States is 4.3%.