Cities with the Highest Percentage of Population with a Degree in Visual and Performing Arts in Delaware
RELATED REPORTS & OPTIONS
Visual and Performing Arts
Delaware
Compare Cities
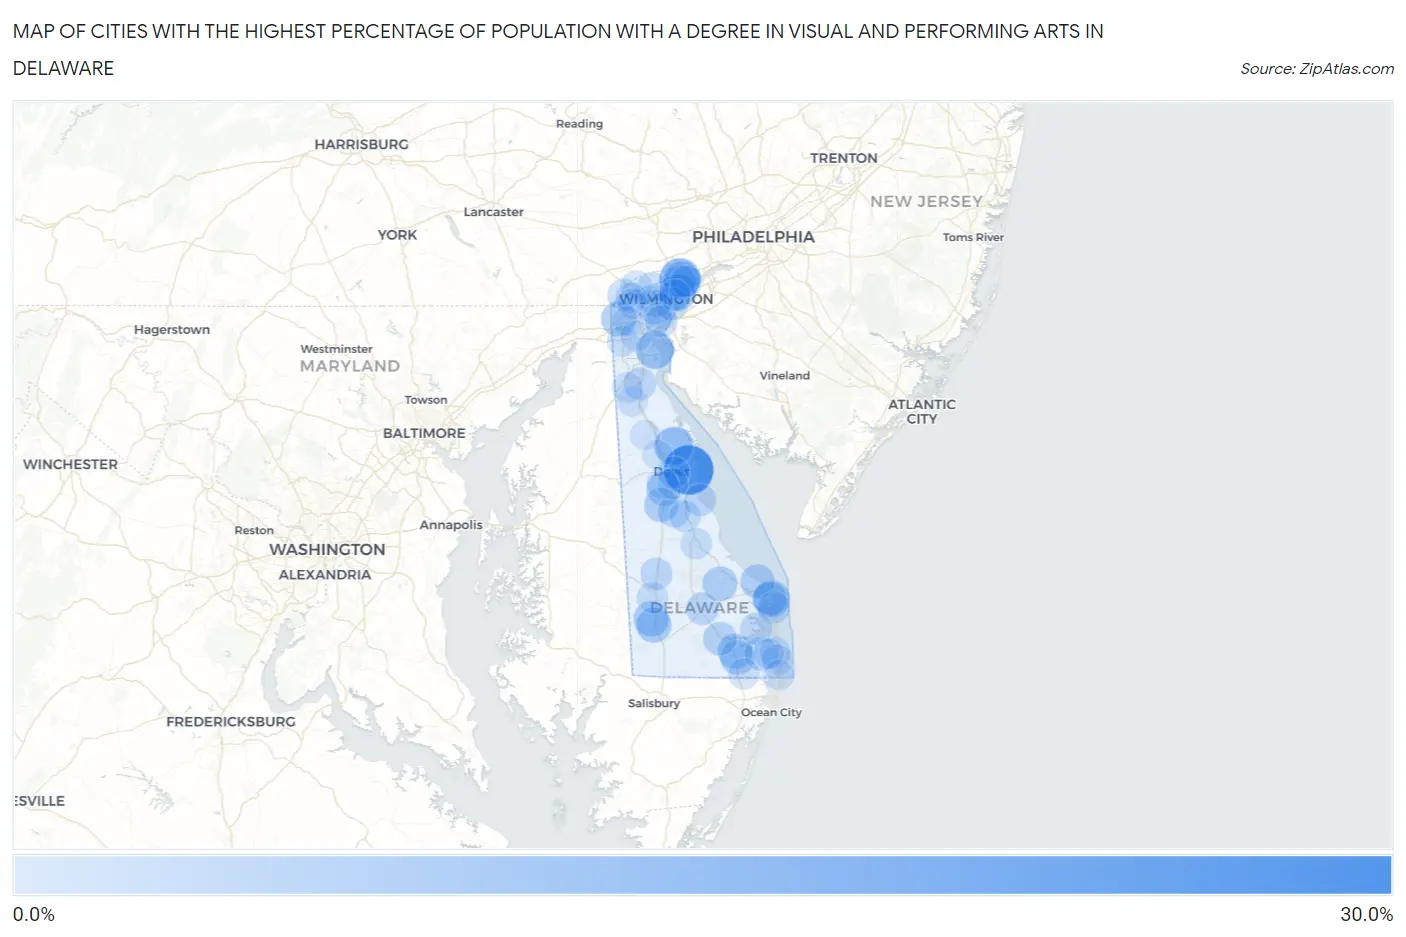
Map of Cities with the Highest Percentage of Population with a Degree in Visual and Performing Arts in Delaware
0.0%
30.0%
Cities with the Highest Percentage of Population with a Degree in Visual and Performing Arts in Delaware
| City | % Graduates | vs State | vs National | |
| 1. | Little Creek | 27.3% | 2.9%(+24.4)#1 | 4.3%(+23.0)#372 |
| 2. | Arden | 14.9% | 2.9%(+12.0)#2 | 4.3%(+10.7)#1,072 |
| 3. | Leipsic | 11.8% | 2.9%(+8.86)#3 | 4.3%(+7.51)#1,580 |
| 4. | Delaware City | 10.9% | 2.9%(+8.03)#4 | 4.3%(+6.69)#1,764 |
| 5. | Henlopen Acres | 10.0% | 2.9%(+7.09)#5 | 4.3%(+5.75)#2,076 |
| 6. | Ardentown | 9.9% | 2.9%(+7.02)#6 | 4.3%(+5.68)#2,095 |
| 7. | Bellefonte | 9.7% | 2.9%(+6.80)#7 | 4.3%(+5.46)#2,167 |
| 8. | Newark | 7.3% | 2.9%(+4.38)#8 | 4.3%(+3.04)#3,455 |
| 9. | Seaford | 7.3% | 2.9%(+4.37)#9 | 4.3%(+3.03)#3,461 |
| 10. | Blades | 7.3% | 2.9%(+4.36)#10 | 4.3%(+3.02)#3,468 |
| 11. | Dagsboro | 6.5% | 2.9%(+3.63)#11 | 4.3%(+2.29)#4,152 |
| 12. | Milton | 6.4% | 2.9%(+3.53)#12 | 4.3%(+2.18)#4,259 |
| 13. | Frankford | 6.2% | 2.9%(+3.34)#13 | 4.3%(+2.00)#4,433 |
| 14. | Newport | 6.1% | 2.9%(+3.19)#14 | 4.3%(+1.85)#4,596 |
| 15. | Camden | 6.1% | 2.9%(+3.15)#15 | 4.3%(+1.80)#4,663 |
| 16. | Viola | 5.9% | 2.9%(+2.97)#16 | 4.3%(+1.63)#4,863 |
| 17. | Lewes | 5.7% | 2.9%(+2.81)#17 | 4.3%(+1.46)#5,042 |
| 18. | Rehoboth Beach | 5.2% | 2.9%(+2.25)#18 | 4.3%(+0.908)#5,762 |
| 19. | Millville | 5.0% | 2.9%(+2.08)#19 | 4.3%(+0.734)#6,022 |
| 20. | Millsboro | 4.8% | 2.9%(+1.88)#20 | 4.3%(+0.533)#6,374 |
| 21. | Wilmington | 4.1% | 2.9%(+1.14)#21 | 4.3%(-0.200)#7,811 |
| 22. | Georgetown | 3.7% | 2.9%(+0.775)#22 | 4.3%(-0.569)#8,634 |
| 23. | Ardencroft | 3.7% | 2.9%(+0.761)#23 | 4.3%(-0.582)#8,660 |
| 24. | Greenville | 3.4% | 2.9%(+0.473)#24 | 4.3%(-0.870)#9,374 |
| 25. | Riverview | 3.4% | 2.9%(+0.462)#25 | 4.3%(-0.881)#9,405 |
| 26. | Bowers | 3.2% | 2.9%(+0.317)#26 | 4.3%(-1.03)#9,782 |
| 27. | North Star | 3.2% | 2.9%(+0.254)#27 | 4.3%(-1.09)#9,933 |
| 28. | Greenwood | 3.1% | 2.9%(+0.178)#28 | 4.3%(-1.17)#10,122 |
| 29. | Elsmere | 3.1% | 2.9%(+0.157)#29 | 4.3%(-1.19)#10,174 |
| 30. | Odessa | 3.1% | 2.9%(+0.145)#30 | 4.3%(-1.20)#10,213 |
| 31. | Dewey Beach | 3.0% | 2.9%(+0.083)#31 | 4.3%(-1.26)#10,387 |
| 32. | Long Neck | 2.9% | 2.9%(-0.045)#32 | 4.3%(-1.39)#10,697 |
| 33. | New Castle | 2.9% | 2.9%(-0.046)#33 | 4.3%(-1.39)#10,703 |
| 34. | Dover | 2.8% | 2.9%(-0.097)#34 | 4.3%(-1.44)#10,834 |
| 35. | Claymont | 2.4% | 2.9%(-0.532)#35 | 4.3%(-1.87)#11,980 |
| 36. | Frederica | 2.2% | 2.9%(-0.662)#36 | 4.3%(-2.00)#12,286 |
| 37. | Bethany Beach | 2.2% | 2.9%(-0.749)#37 | 4.3%(-2.09)#12,491 |
| 38. | Hockessin | 2.0% | 2.9%(-0.930)#38 | 4.3%(-2.27)#12,963 |
| 39. | Edgemoor | 2.0% | 2.9%(-0.936)#39 | 4.3%(-2.28)#12,977 |
| 40. | Wyoming | 1.8% | 2.9%(-1.08)#40 | 4.3%(-2.43)#13,314 |
| 41. | South Bethany | 1.8% | 2.9%(-1.10)#41 | 4.3%(-2.44)#13,349 |
| 42. | Milford | 1.8% | 2.9%(-1.10)#42 | 4.3%(-2.45)#13,362 |
| 43. | Bridgeville | 1.6% | 2.9%(-1.28)#43 | 4.3%(-2.62)#13,759 |
| 44. | Pike Creek | 1.6% | 2.9%(-1.29)#44 | 4.3%(-2.63)#13,784 |
| 45. | Selbyville | 1.5% | 2.9%(-1.45)#45 | 4.3%(-2.80)#14,147 |
| 46. | Glasgow | 1.4% | 2.9%(-1.46)#46 | 4.3%(-2.81)#14,173 |
| 47. | Highland Acres | 1.4% | 2.9%(-1.48)#47 | 4.3%(-2.82)#14,213 |
| 48. | Bear | 1.2% | 2.9%(-1.66)#48 | 4.3%(-3.00)#14,580 |
| 49. | Middletown | 1.2% | 2.9%(-1.71)#49 | 4.3%(-3.05)#14,666 |
| 50. | Pike Creek Valley | 0.99% | 2.9%(-1.92)#50 | 4.3%(-3.26)#15,016 |
| 51. | Fenwick Island | 0.93% | 2.9%(-1.97)#51 | 4.3%(-3.32)#15,118 |
| 52. | Townsend | 0.79% | 2.9%(-2.12)#52 | 4.3%(-3.46)#15,337 |
| 53. | Ocean View | 0.69% | 2.9%(-2.22)#53 | 4.3%(-3.56)#15,467 |
| 54. | Cheswold | 0.53% | 2.9%(-2.37)#54 | 4.3%(-3.72)#15,625 |
| 55. | Wilmington Manor | 0.52% | 2.9%(-2.39)#55 | 4.3%(-3.74)#15,644 |
| 56. | Clayton | 0.50% | 2.9%(-2.41)#56 | 4.3%(-3.75)#15,655 |
| 57. | Brookside | 0.44% | 2.9%(-2.47)#57 | 4.3%(-3.81)#15,697 |
1
Common Questions
What are the Top 10 Cities with the Highest Percentage of Population with a Degree in Visual and Performing Arts in Delaware?
Top 10 Cities with the Highest Percentage of Population with a Degree in Visual and Performing Arts in Delaware are:
#1
27.3%
#2
14.9%
#3
11.8%
#4
10.9%
#5
10.0%
#6
9.9%
#7
9.7%
#8
7.3%
#9
7.3%
#10
7.3%
What city has the Highest Percentage of Population with a Degree in Visual and Performing Arts in Delaware?
Little Creek has the Highest Percentage of Population with a Degree in Visual and Performing Arts in Delaware with 27.3%.
What is the Percentage of Population with a Degree in Visual and Performing Arts in the State of Delaware?
Percentage of Population with a Degree in Visual and Performing Arts in Delaware is 2.9%.
What is the Percentage of Population with a Degree in Visual and Performing Arts in the United States?
Percentage of Population with a Degree in Visual and Performing Arts in the United States is 4.3%.