Twin Lakes, CA Map & Demographics
Twin Lakes Map
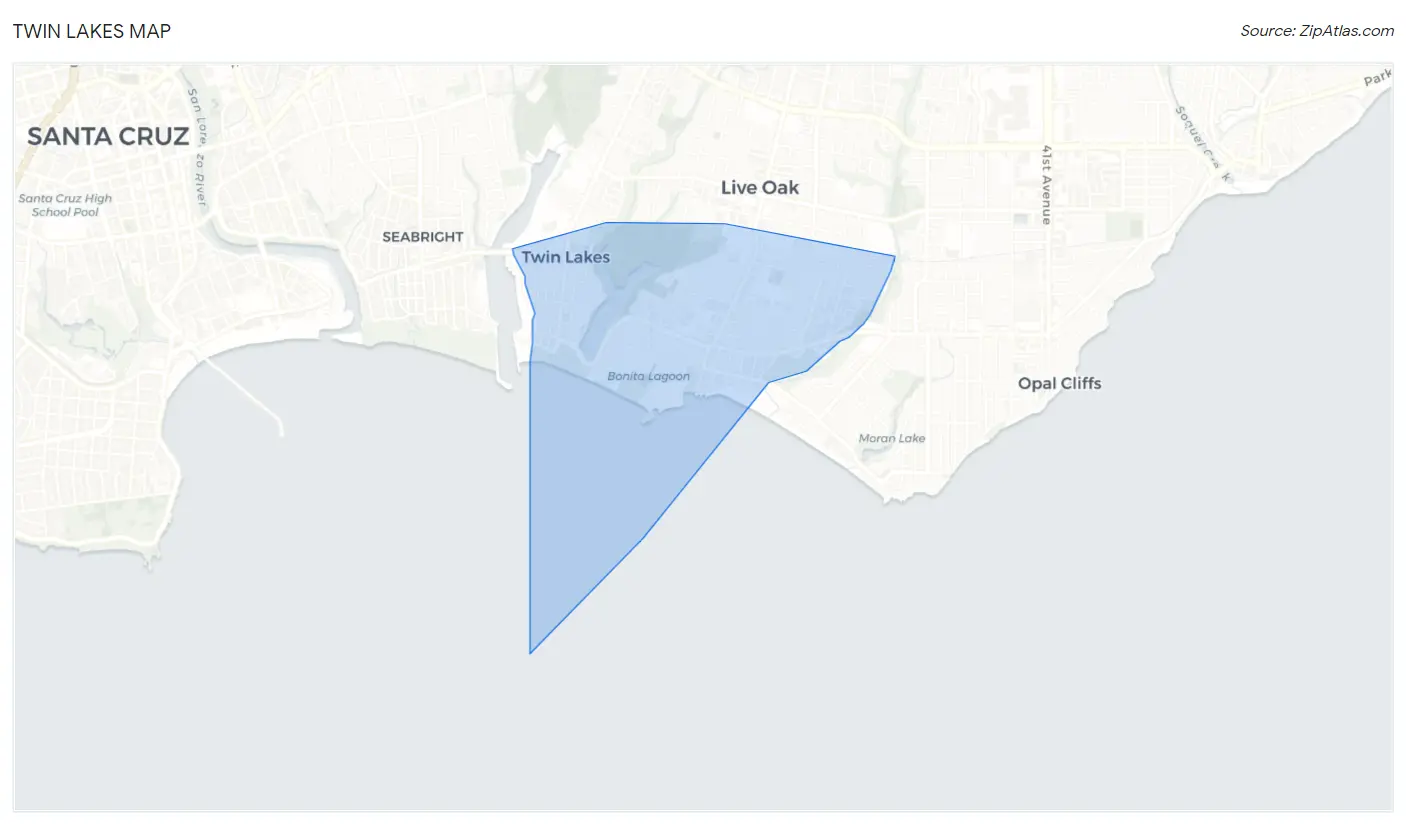
Twin Lakes Overview
$55,434
PER CAPITA INCOME
$72,346
AVG FAMILY INCOME
$71,769
AVG HOUSEHOLD INCOME
19.9%
WAGE / INCOME GAP [ % ]
80.1¢/ $1
WAGE / INCOME GAP [ $ ]
0.51
INEQUALITY / GINI INDEX
5,090
TOTAL POPULATION
2,350
MALE POPULATION
2,740
FEMALE POPULATION
85.77
MALES / 100 FEMALES
116.60
FEMALES / 100 MALES
42.1
MEDIAN AGE
2.8
AVG FAMILY SIZE
2.1
AVG HOUSEHOLD SIZE
2,836
LABOR FORCE [ PEOPLE ]
64.4%
PERCENT IN LABOR FORCE
3.6%
UNEMPLOYMENT RATE
Income in Twin Lakes
Income Overview in Twin Lakes
Per Capita Income in Twin Lakes is $55,434, while median incomes of families and households are $72,346 and $71,769 respectively.
| Characteristic | Number | Measure |
| Per Capita Income | 5,090 | $55,434 |
| Median Family Income | 1,039 | $72,346 |
| Mean Family Income | 1,039 | $120,018 |
| Median Household Income | 2,385 | $71,769 |
| Mean Household Income | 2,385 | $114,224 |
| Income Deficit | 1,039 | $0 |
| Wage / Income Gap (%) | 5,090 | 19.93% |
| Wage / Income Gap ($) | 5,090 | 80.07¢ per $1 |
| Gini / Inequality Index | 5,090 | 0.51 |
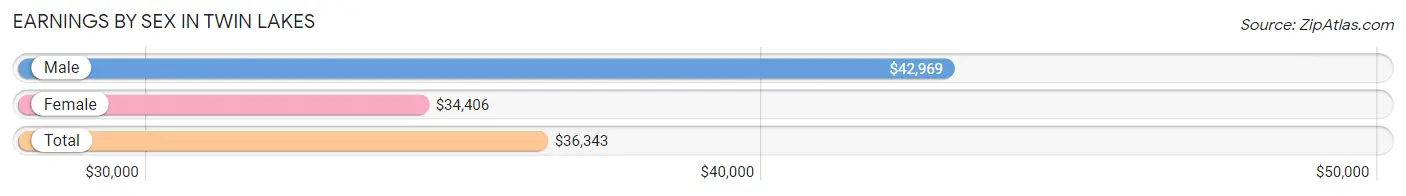
Earnings by Sex in Twin Lakes
Average Earnings in Twin Lakes are $36,343, $42,969 for men and $34,406 for women, a difference of 19.9%.
| Sex | Number | Average Earnings |
| Male | 1,362 (45.6%) | $42,969 |
| Female | 1,624 (54.4%) | $34,406 |
| Total | 2,986 (100.0%) | $36,343 |
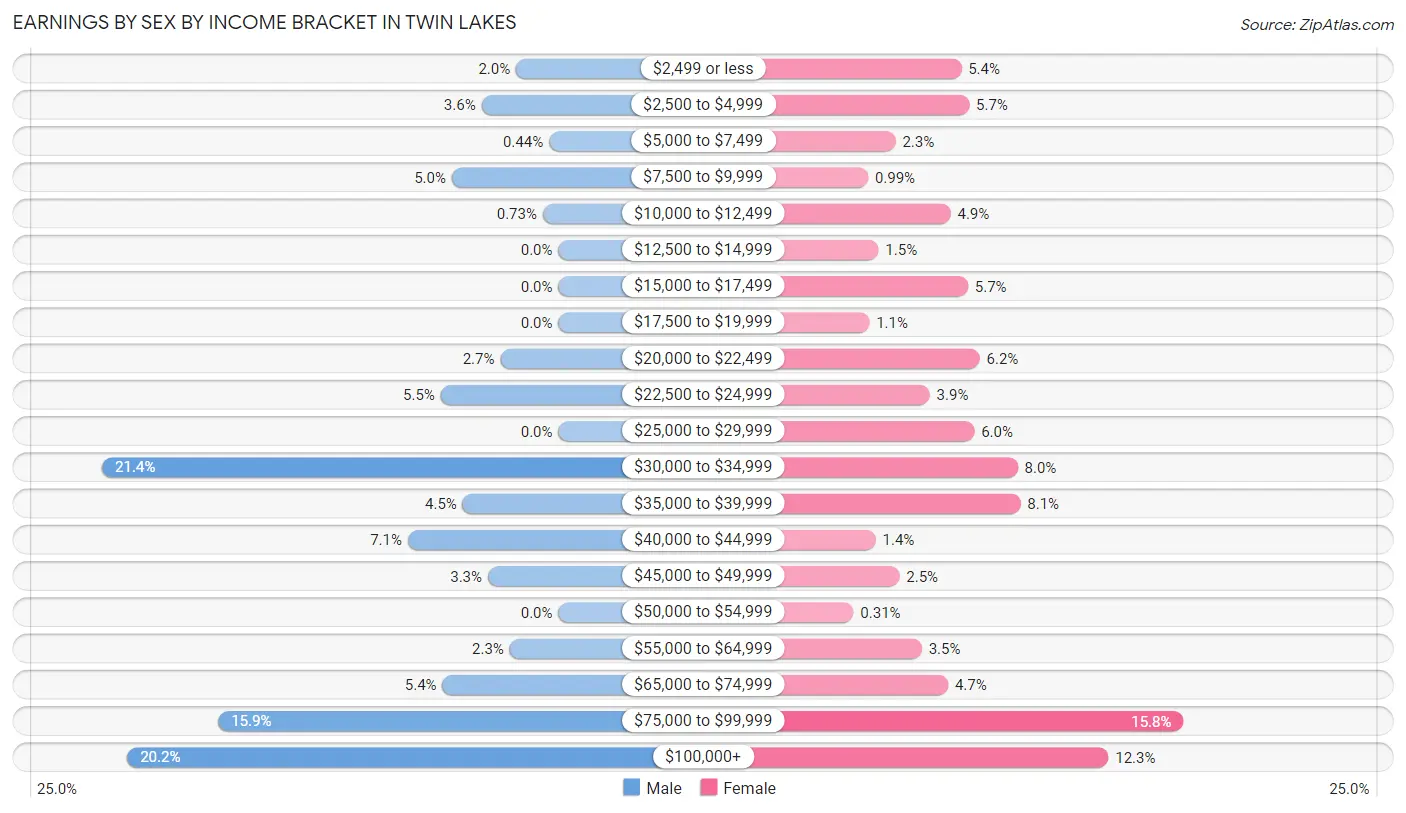
Earnings by Sex by Income Bracket in Twin Lakes
The most common earnings brackets in Twin Lakes are $30,000 to $34,999 for men (291 | 21.4%) and $75,000 to $99,999 for women (256 | 15.8%).
| Income | Male | Female |
| $2,499 or less | 27 (2.0%) | 87 (5.4%) |
| $2,500 to $4,999 | 49 (3.6%) | 93 (5.7%) |
| $5,000 to $7,499 | 6 (0.4%) | 37 (2.3%) |
| $7,500 to $9,999 | 68 (5.0%) | 16 (1.0%) |
| $10,000 to $12,499 | 10 (0.7%) | 79 (4.9%) |
| $12,500 to $14,999 | 0 (0.0%) | 24 (1.5%) |
| $15,000 to $17,499 | 0 (0.0%) | 92 (5.7%) |
| $17,500 to $19,999 | 0 (0.0%) | 17 (1.1%) |
| $20,000 to $22,499 | 37 (2.7%) | 101 (6.2%) |
| $22,500 to $24,999 | 75 (5.5%) | 63 (3.9%) |
| $25,000 to $29,999 | 0 (0.0%) | 97 (6.0%) |
| $30,000 to $34,999 | 291 (21.4%) | 130 (8.0%) |
| $35,000 to $39,999 | 61 (4.5%) | 132 (8.1%) |
| $40,000 to $44,999 | 96 (7.0%) | 22 (1.3%) |
| $45,000 to $49,999 | 45 (3.3%) | 40 (2.5%) |
| $50,000 to $54,999 | 0 (0.0%) | 5 (0.3%) |
| $55,000 to $64,999 | 31 (2.3%) | 57 (3.5%) |
| $65,000 to $74,999 | 74 (5.4%) | 77 (4.7%) |
| $75,000 to $99,999 | 217 (15.9%) | 256 (15.8%) |
| $100,000+ | 275 (20.2%) | 199 (12.2%) |
| Total | 1,362 (100.0%) | 1,624 (100.0%) |
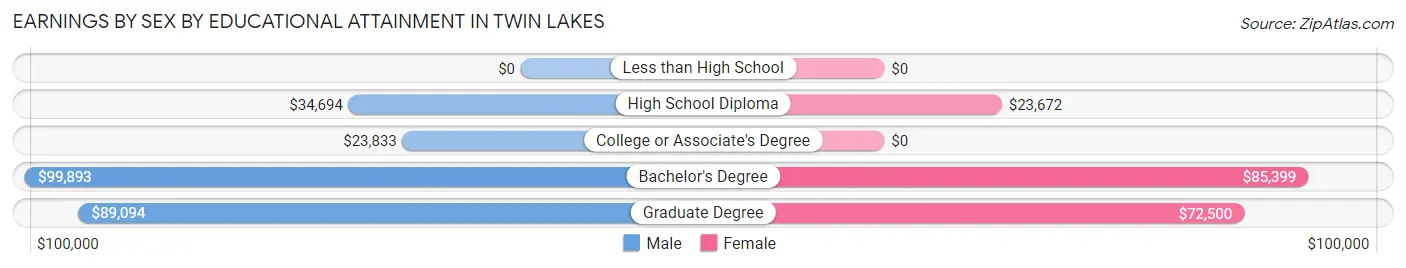
Earnings by Sex by Educational Attainment in Twin Lakes
Average earnings in Twin Lakes are $44,635 for men and $36,985 for women, a difference of 17.1%. Men with an educational attainment of bachelor's degree enjoy the highest average annual earnings of $99,893, while those with college or associate's degree education earn the least with $23,833. Women with an educational attainment of bachelor's degree earn the most with the average annual earnings of $85,399, while those with high school diploma education have the smallest earnings of $23,672.
| Educational Attainment | Male Income | Female Income |
| Less than High School | - | - |
| High School Diploma | $34,694 | $23,672 |
| College or Associate's Degree | $23,833 | $0 |
| Bachelor's Degree | $99,893 | $85,399 |
| Graduate Degree | $89,094 | $72,500 |
| Total | $44,635 | $36,985 |
Family Income in Twin Lakes
Family Income Brackets in Twin Lakes
According to the Twin Lakes family income data, there are 279 families falling into the $50,000 to $74,999 income range, which is the most common income bracket and makes up 26.9% of all families. Conversely, the $10,000 to $14,999 income bracket is the least frequent group with only 7 families (0.7%) belonging to this category.
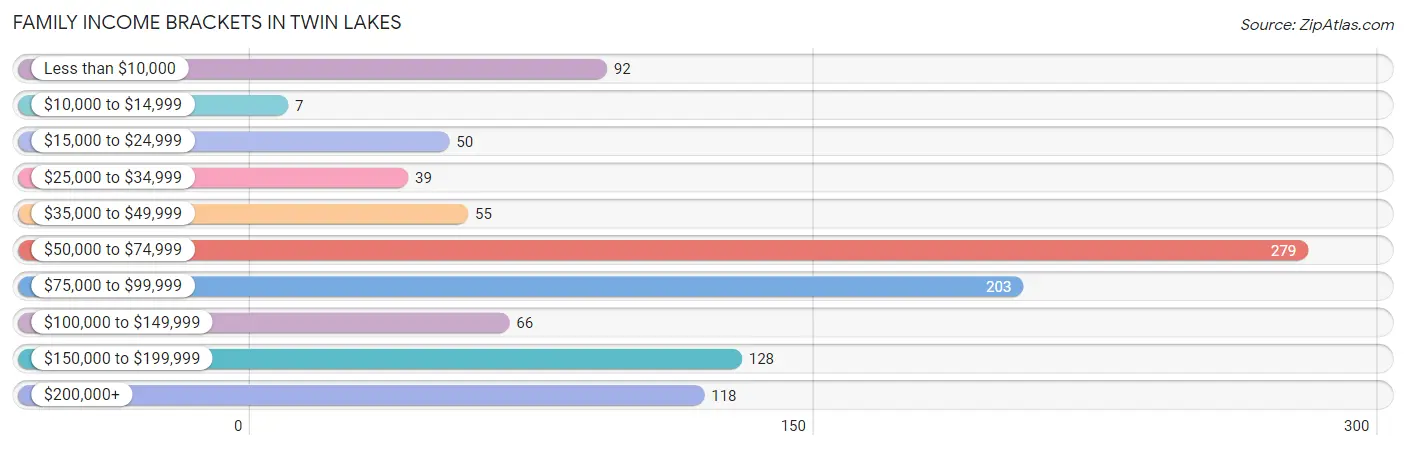
| Income Bracket | # Families | % Families |
| Less than $10,000 | 92 | 8.9% |
| $10,000 to $14,999 | 7 | 0.7% |
| $15,000 to $24,999 | 50 | 4.8% |
| $25,000 to $34,999 | 39 | 3.8% |
| $35,000 to $49,999 | 55 | 5.3% |
| $50,000 to $74,999 | 279 | 26.9% |
| $75,000 to $99,999 | 203 | 19.5% |
| $100,000 to $149,999 | 66 | 6.4% |
| $150,000 to $199,999 | 128 | 12.3% |
| $200,000+ | 118 | 11.4% |
Family Income by Famaliy Size in Twin Lakes
2-person families (651 | 62.7%) account for the highest median family income in Twin Lakes with $78,008 per family, while 2-person families (651 | 62.7%) have the highest median income of $39,004 per family member.
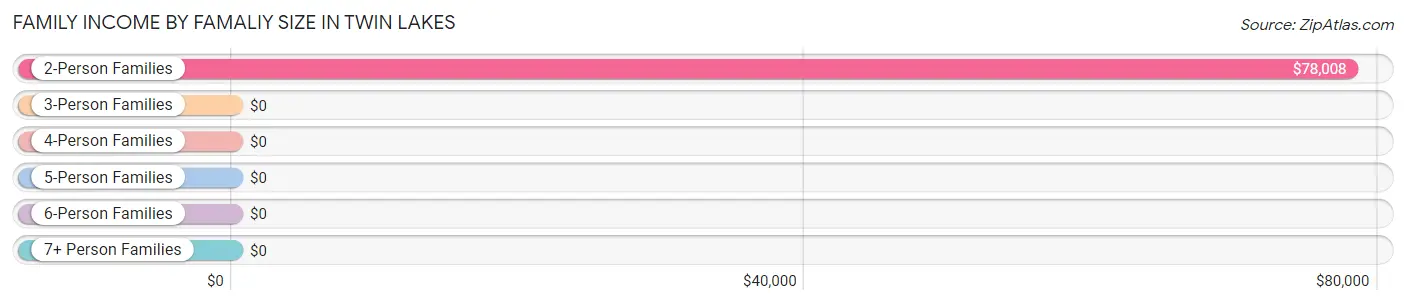
| Income Bracket | # Families | Median Income |
| 2-Person Families | 651 (62.7%) | $78,008 |
| 3-Person Families | 145 (14.0%) | $0 |
| 4-Person Families | 167 (16.1%) | $0 |
| 5-Person Families | 76 (7.3%) | $0 |
| 6-Person Families | 0 (0.0%) | $0 |
| 7+ Person Families | 0 (0.0%) | $0 |
| Total | 1,039 (100.0%) | $72,346 |
Family Income by Number of Earners in Twin Lakes
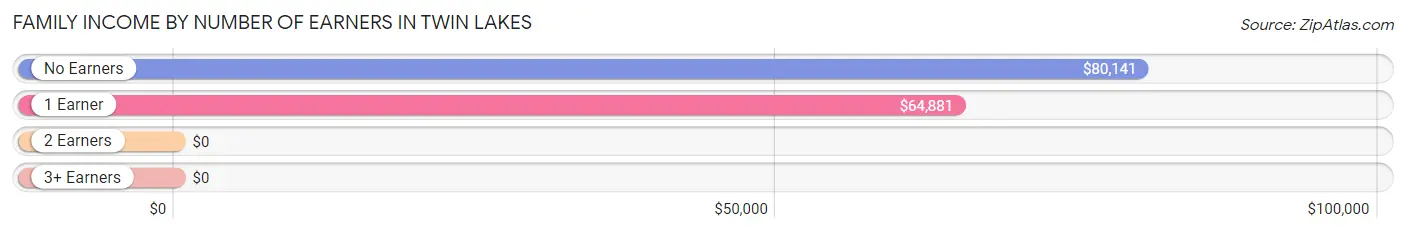
| Number of Earners | # Families | Median Income |
| No Earners | 267 (25.7%) | $80,141 |
| 1 Earner | 396 (38.1%) | $64,881 |
| 2 Earners | 342 (32.9%) | $0 |
| 3+ Earners | 34 (3.3%) | $0 |
| Total | 1,039 (100.0%) | $72,346 |
Household Income in Twin Lakes
Household Income Brackets in Twin Lakes
With 560 households falling in the category, the $50,000 to $74,999 income range is the most frequent in Twin Lakes, accounting for 23.5% of all households. In contrast, only 86 households (3.6%) fall into the $10,000 to $14,999 income bracket, making it the least populous group.
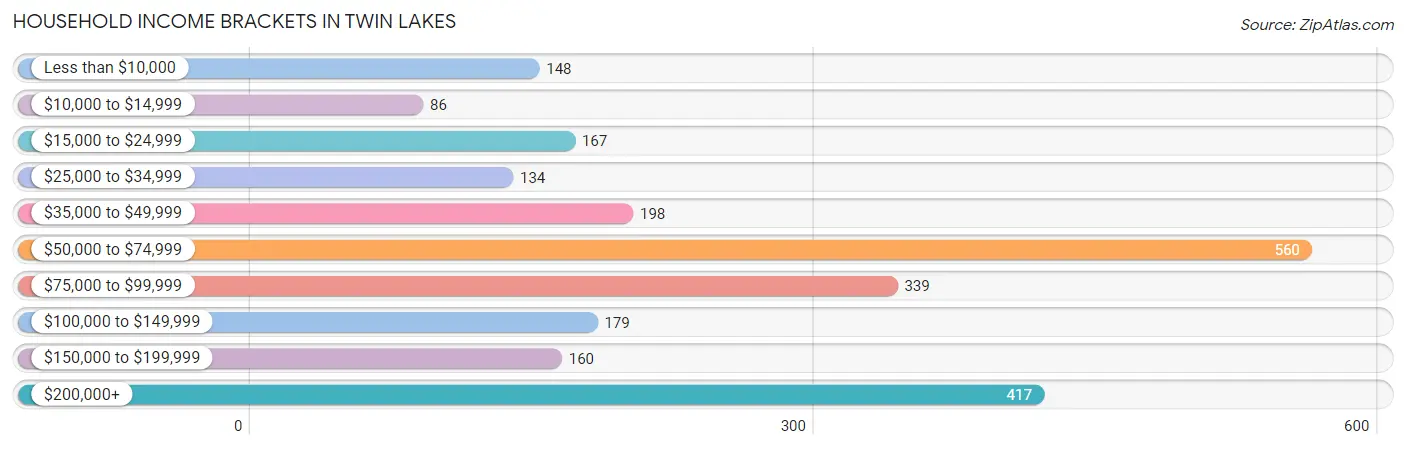
| Income Bracket | # Households | % Households |
| Less than $10,000 | 148 | 6.2% |
| $10,000 to $14,999 | 86 | 3.6% |
| $15,000 to $24,999 | 167 | 7.0% |
| $25,000 to $34,999 | 134 | 5.6% |
| $35,000 to $49,999 | 198 | 8.3% |
| $50,000 to $74,999 | 560 | 23.5% |
| $75,000 to $99,999 | 339 | 14.2% |
| $100,000 to $149,999 | 179 | 7.5% |
| $150,000 to $199,999 | 160 | 6.7% |
| $200,000+ | 417 | 17.5% |
Household Income by Householder Age in Twin Lakes
The median household income in Twin Lakes is $71,769, with the highest median household income of $85,439 found in the 45 to 64 years age bracket for the primary householder. A total of 765 households (32.1%) fall into this category. Meanwhile, the 15 to 24 years age bracket for the primary householder has the lowest median household income of $0, with 107 households (4.5%) in this group.
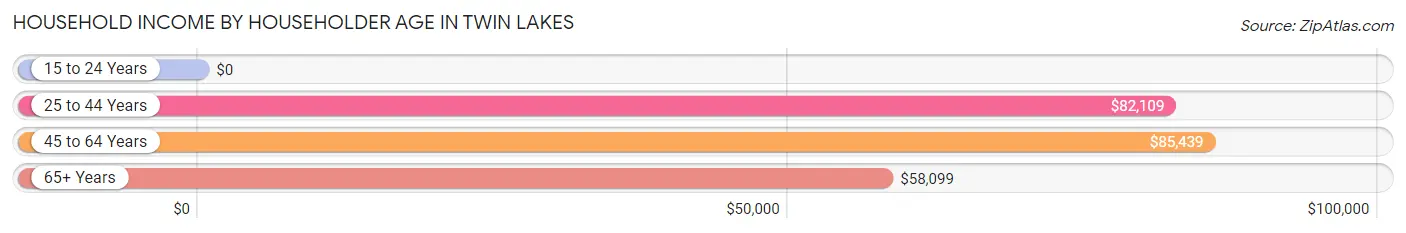
| Income Bracket | # Households | Median Income |
| 15 to 24 Years | 107 (4.5%) | $0 |
| 25 to 44 Years | 861 (36.1%) | $82,109 |
| 45 to 64 Years | 765 (32.1%) | $85,439 |
| 65+ Years | 652 (27.3%) | $58,099 |
| Total | 2,385 (100.0%) | $71,769 |
Poverty in Twin Lakes
Income Below Poverty by Sex and Age in Twin Lakes
With 9.1% poverty level for males and 22.8% for females among the residents of Twin Lakes, 18 to 24 year old males and 5 year old females are the most vulnerable to poverty, with 75 males (52.1%) and 20 females (90.9%) in their respective age groups living below the poverty level.
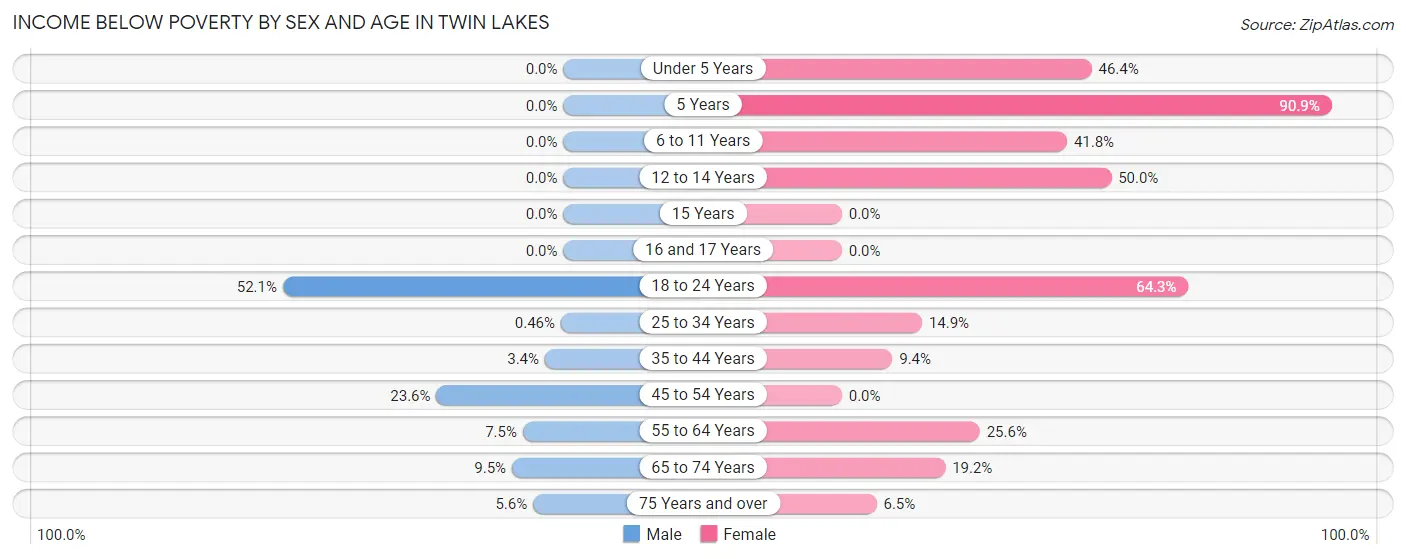
| Age Bracket | Male | Female |
| Under 5 Years | 0 (0.0%) | 51 (46.4%) |
| 5 Years | 0 (0.0%) | 20 (90.9%) |
| 6 to 11 Years | 0 (0.0%) | 84 (41.8%) |
| 12 to 14 Years | 0 (0.0%) | 25 (50.0%) |
| 15 Years | 0 (0.0%) | 0 (0.0%) |
| 16 and 17 Years | 0 (0.0%) | 0 (0.0%) |
| 18 to 24 Years | 75 (52.1%) | 155 (64.3%) |
| 25 to 34 Years | 2 (0.5%) | 86 (14.9%) |
| 35 to 44 Years | 11 (3.4%) | 34 (9.4%) |
| 45 to 54 Years | 62 (23.6%) | 0 (0.0%) |
| 55 to 64 Years | 24 (7.5%) | 86 (25.6%) |
| 65 to 74 Years | 23 (9.5%) | 57 (19.2%) |
| 75 Years and over | 12 (5.6%) | 16 (6.5%) |
| Total | 209 (9.1%) | 614 (22.8%) |
Income Above Poverty by Sex and Age in Twin Lakes
According to the poverty statistics in Twin Lakes, males aged under 5 years and females aged 16 and 17 years are the age groups that are most secure financially, with 100.0% of males and 100.0% of females in these age groups living above the poverty line.
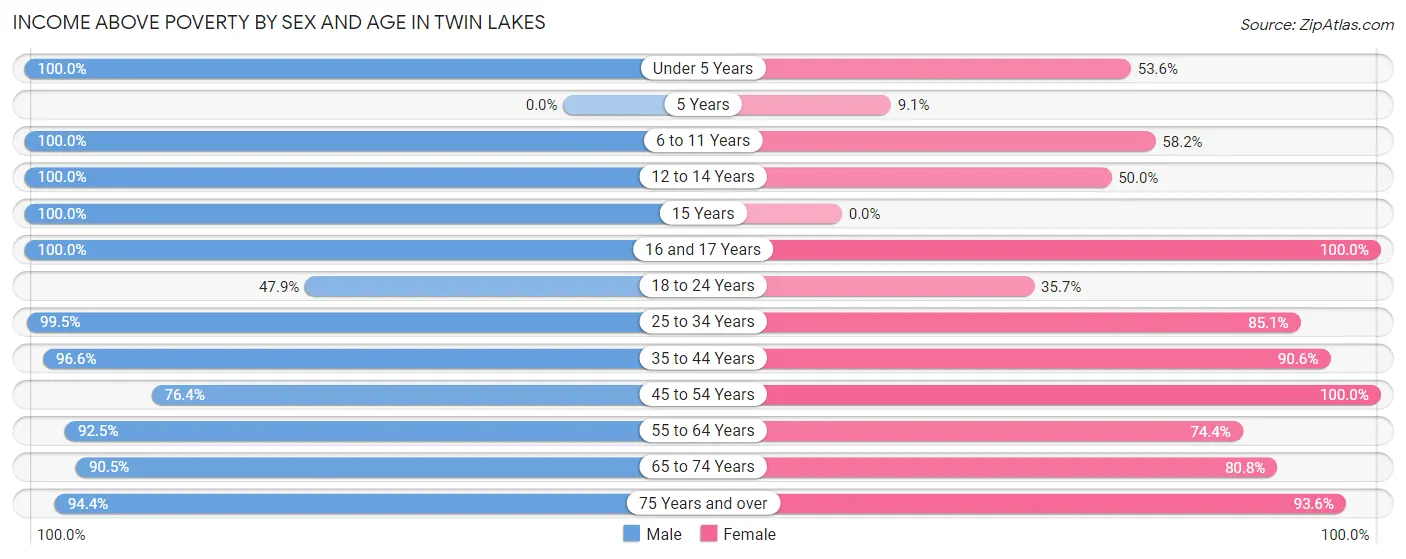
| Age Bracket | Male | Female |
| Under 5 Years | 67 (100.0%) | 59 (53.6%) |
| 5 Years | 0 (0.0%) | 2 (9.1%) |
| 6 to 11 Years | 110 (100.0%) | 117 (58.2%) |
| 12 to 14 Years | 97 (100.0%) | 25 (50.0%) |
| 15 Years | 29 (100.0%) | 0 (0.0%) |
| 16 and 17 Years | 62 (100.0%) | 24 (100.0%) |
| 18 to 24 Years | 69 (47.9%) | 86 (35.7%) |
| 25 to 34 Years | 436 (99.5%) | 492 (85.1%) |
| 35 to 44 Years | 310 (96.6%) | 329 (90.6%) |
| 45 to 54 Years | 201 (76.4%) | 223 (100.0%) |
| 55 to 64 Years | 295 (92.5%) | 250 (74.4%) |
| 65 to 74 Years | 218 (90.5%) | 240 (80.8%) |
| 75 Years and over | 201 (94.4%) | 232 (93.5%) |
| Total | 2,095 (90.9%) | 2,079 (77.2%) |
Income Below Poverty Among Married-Couple Families in Twin Lakes
The poverty statistics for married-couple families in Twin Lakes show that 9.2% or 64 of the total 699 families live below the poverty line. Families with 1 or 2 children have the highest poverty rate of 24.8%, comprising of 57 families. On the other hand, families with 3 or 4 children have the lowest poverty rate of 0.0%, which includes 0 families.
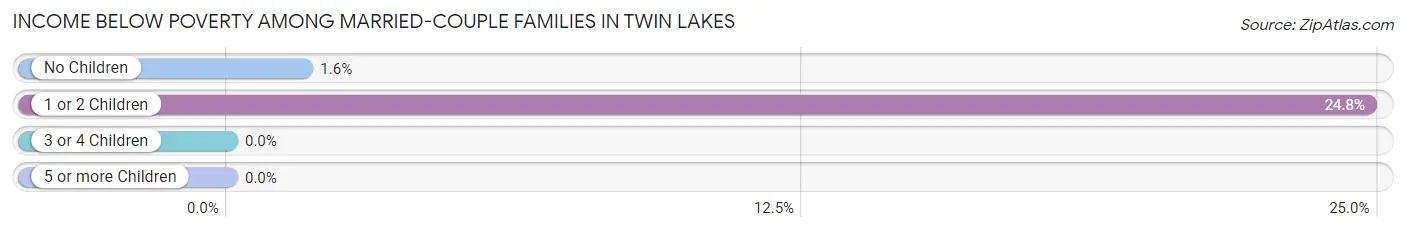
| Children | Above Poverty | Below Poverty |
| No Children | 420 (98.4%) | 7 (1.6%) |
| 1 or 2 Children | 173 (75.2%) | 57 (24.8%) |
| 3 or 4 Children | 42 (100.0%) | 0 (0.0%) |
| 5 or more Children | 0 (0.0%) | 0 (0.0%) |
| Total | 635 (90.8%) | 64 (9.2%) |
Income Below Poverty Among Single-Parent Households in Twin Lakes
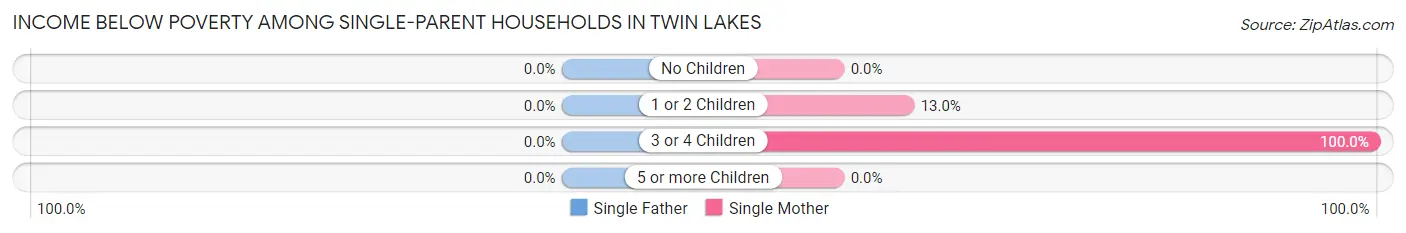
| Children | Single Father | Single Mother |
| No Children | 0 (0.0%) | 0 (0.0%) |
| 1 or 2 Children | 0 (0.0%) | 18 (13.0%) |
| 3 or 4 Children | 0 (0.0%) | 51 (100.0%) |
| 5 or more Children | 0 (0.0%) | 0 (0.0%) |
| Total | 0 (0.0%) | 69 (25.9%) |
Income Below Poverty Among Married-Couple vs Single-Parent Households in Twin Lakes
The poverty data for Twin Lakes shows that 64 of the married-couple family households (9.2%) and 69 of the single-parent households (20.3%) are living below the poverty level. Within the married-couple family households, those with 1 or 2 children have the highest poverty rate, with 57 households (24.8%) falling below the poverty line. Among the single-parent households, those with 3 or 4 children have the highest poverty rate, with 51 household (100.0%) living below poverty.
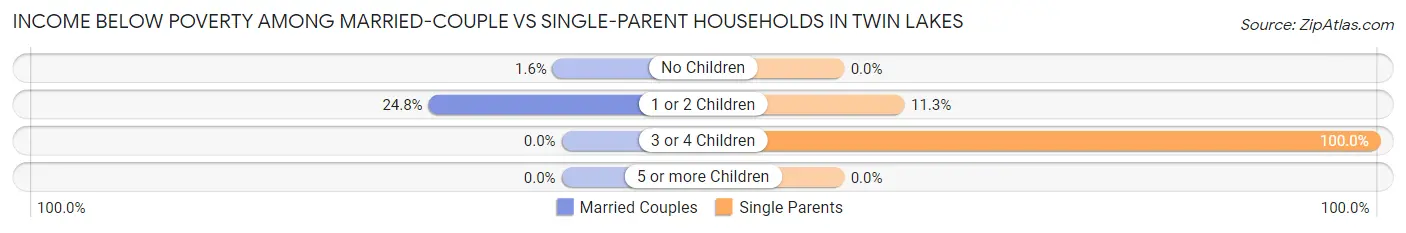
| Children | Married-Couple Families | Single-Parent Households |
| No Children | 7 (1.6%) | 0 (0.0%) |
| 1 or 2 Children | 57 (24.8%) | 18 (11.3%) |
| 3 or 4 Children | 0 (0.0%) | 51 (100.0%) |
| 5 or more Children | 0 (0.0%) | 0 (0.0%) |
| Total | 64 (9.2%) | 69 (20.3%) |
Race in Twin Lakes
The most populous races in Twin Lakes are White / Caucasian (4,208 | 82.7%), Hispanic or Latino (996 | 19.6%), and Two or more Races (331 | 6.5%).
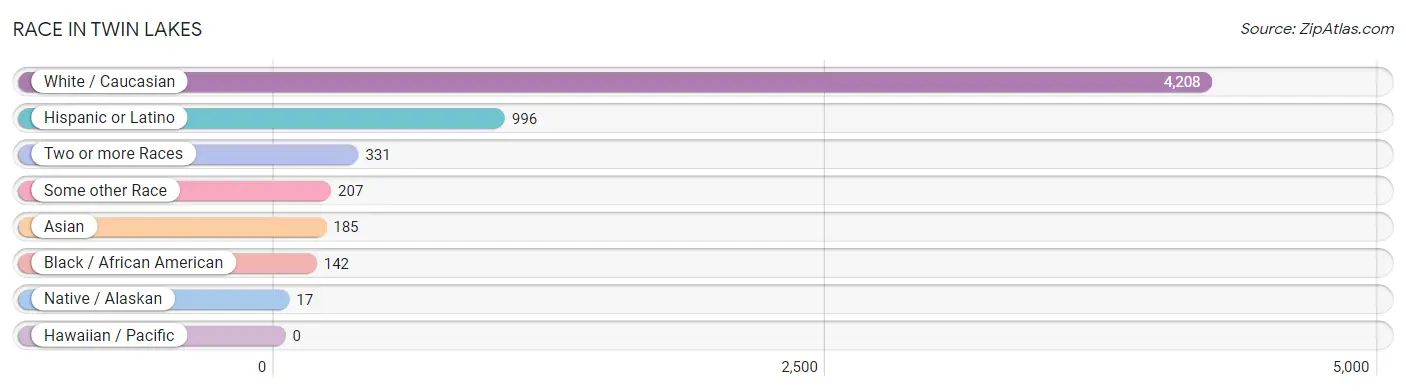
| Race | # Population | % Population |
| Asian | 185 | 3.6% |
| Black / African American | 142 | 2.8% |
| Hawaiian / Pacific | 0 | 0.0% |
| Hispanic or Latino | 996 | 19.6% |
| Native / Alaskan | 17 | 0.3% |
| White / Caucasian | 4,208 | 82.7% |
| Two or more Races | 331 | 6.5% |
| Some other Race | 207 | 4.1% |
| Total | 5,090 | 100.0% |
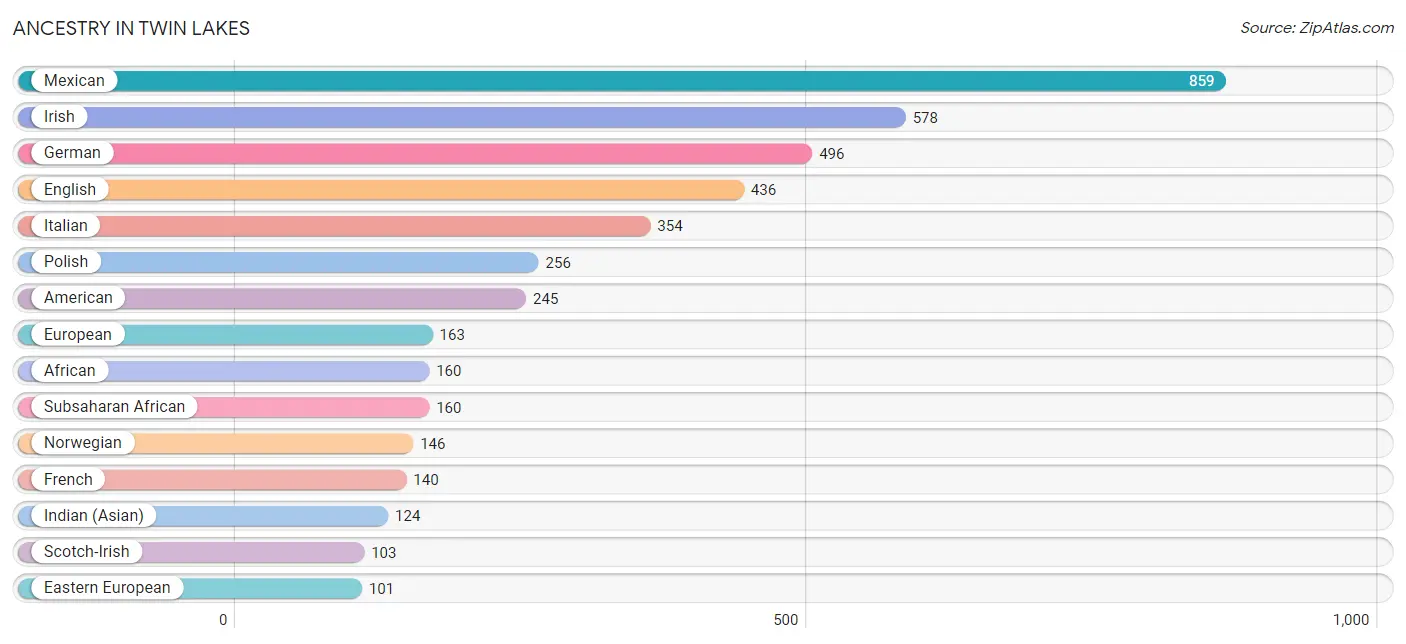
Ancestry in Twin Lakes
The most populous ancestries reported in Twin Lakes are Mexican (859 | 16.9%), Irish (578 | 11.4%), German (496 | 9.7%), English (436 | 8.6%), and Italian (354 | 7.0%), together accounting for 53.5% of all Twin Lakes residents.
| Ancestry | # Population | % Population |
| African | 160 | 3.1% |
| American | 245 | 4.8% |
| Arab | 61 | 1.2% |
| Austrian | 13 | 0.3% |
| Basque | 16 | 0.3% |
| Bhutanese | 5 | 0.1% |
| British | 37 | 0.7% |
| Central American | 16 | 0.3% |
| Chippewa | 3 | 0.1% |
| Cuban | 85 | 1.7% |
| Danish | 16 | 0.3% |
| Dutch | 22 | 0.4% |
| Eastern European | 101 | 2.0% |
| English | 436 | 8.6% |
| European | 163 | 3.2% |
| Finnish | 6 | 0.1% |
| French | 140 | 2.8% |
| French Canadian | 12 | 0.2% |
| German | 496 | 9.7% |
| Greek | 80 | 1.6% |
| Guatemalan | 10 | 0.2% |
| Hungarian | 7 | 0.1% |
| Indian (Asian) | 124 | 2.4% |
| Iranian | 10 | 0.2% |
| Irish | 578 | 11.4% |
| Italian | 354 | 7.0% |
| Korean | 8 | 0.2% |
| Lebanese | 61 | 1.2% |
| Lithuanian | 56 | 1.1% |
| Mexican | 859 | 16.9% |
| Mexican American Indian | 14 | 0.3% |
| Native Hawaiian | 15 | 0.3% |
| Northern European | 6 | 0.1% |
| Norwegian | 146 | 2.9% |
| Peruvian | 5 | 0.1% |
| Polish | 256 | 5.0% |
| Portuguese | 31 | 0.6% |
| Pueblo | 11 | 0.2% |
| Puerto Rican | 31 | 0.6% |
| Romanian | 10 | 0.2% |
| Russian | 29 | 0.6% |
| Salvadoran | 6 | 0.1% |
| Scandinavian | 33 | 0.6% |
| Scotch-Irish | 103 | 2.0% |
| Scottish | 77 | 1.5% |
| South American | 5 | 0.1% |
| Subsaharan African | 160 | 3.1% |
| Swedish | 52 | 1.0% |
| Swiss | 13 | 0.3% |
| Thai | 61 | 1.2% |
| Ukrainian | 39 | 0.8% |
| Welsh | 24 | 0.5% | View All 52 Rows |
Immigrants in Twin Lakes
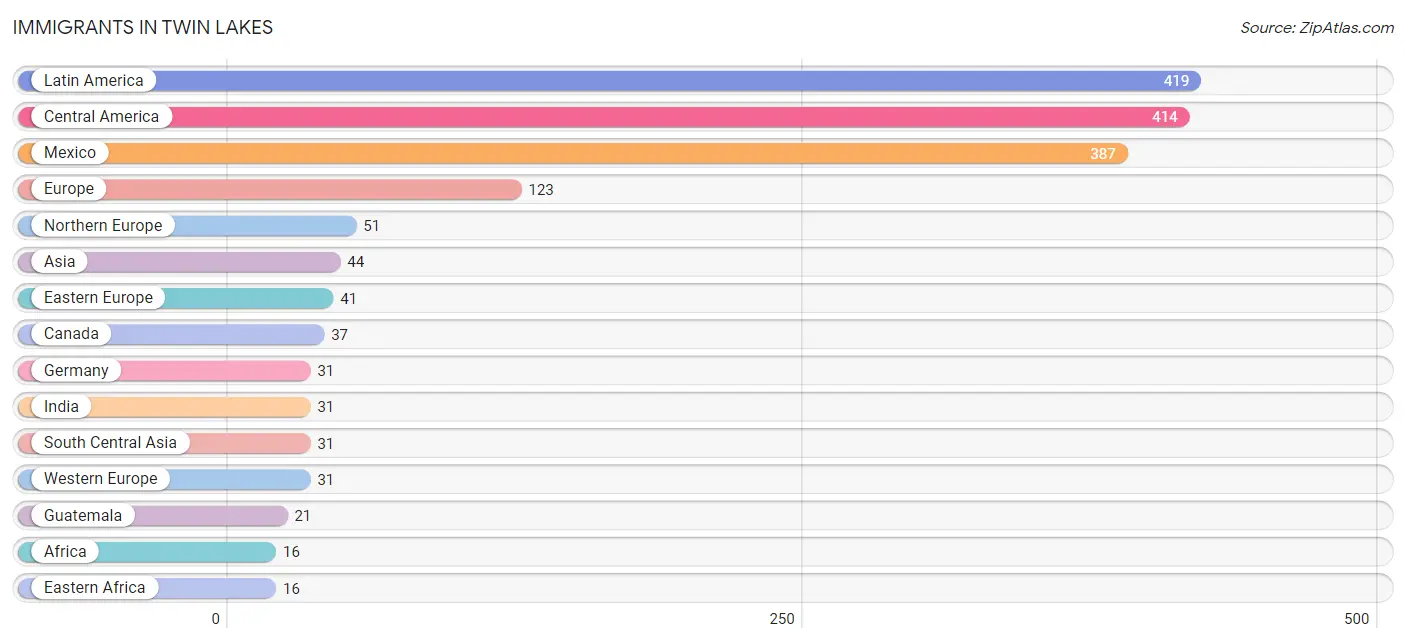
The most numerous immigrant groups reported in Twin Lakes came from Latin America (419 | 8.2%), Central America (414 | 8.1%), Mexico (387 | 7.6%), Europe (123 | 2.4%), and Northern Europe (51 | 1.0%), together accounting for 27.4% of all Twin Lakes residents.
| Immigration Origin | # Population | % Population |
| Africa | 16 | 0.3% |
| Asia | 44 | 0.9% |
| Canada | 37 | 0.7% |
| Central America | 414 | 8.1% |
| Eastern Africa | 16 | 0.3% |
| Eastern Europe | 41 | 0.8% |
| El Salvador | 6 | 0.1% |
| Europe | 123 | 2.4% |
| Germany | 31 | 0.6% |
| Guatemala | 21 | 0.4% |
| Hungary | 7 | 0.1% |
| India | 31 | 0.6% |
| Latin America | 419 | 8.2% |
| Mexico | 387 | 7.6% |
| Northern Europe | 51 | 1.0% |
| Norway | 12 | 0.2% |
| Peru | 5 | 0.1% |
| South America | 5 | 0.1% |
| South Central Asia | 31 | 0.6% |
| Western Europe | 31 | 0.6% | View All 20 Rows |
Sex and Age in Twin Lakes
Sex and Age in Twin Lakes
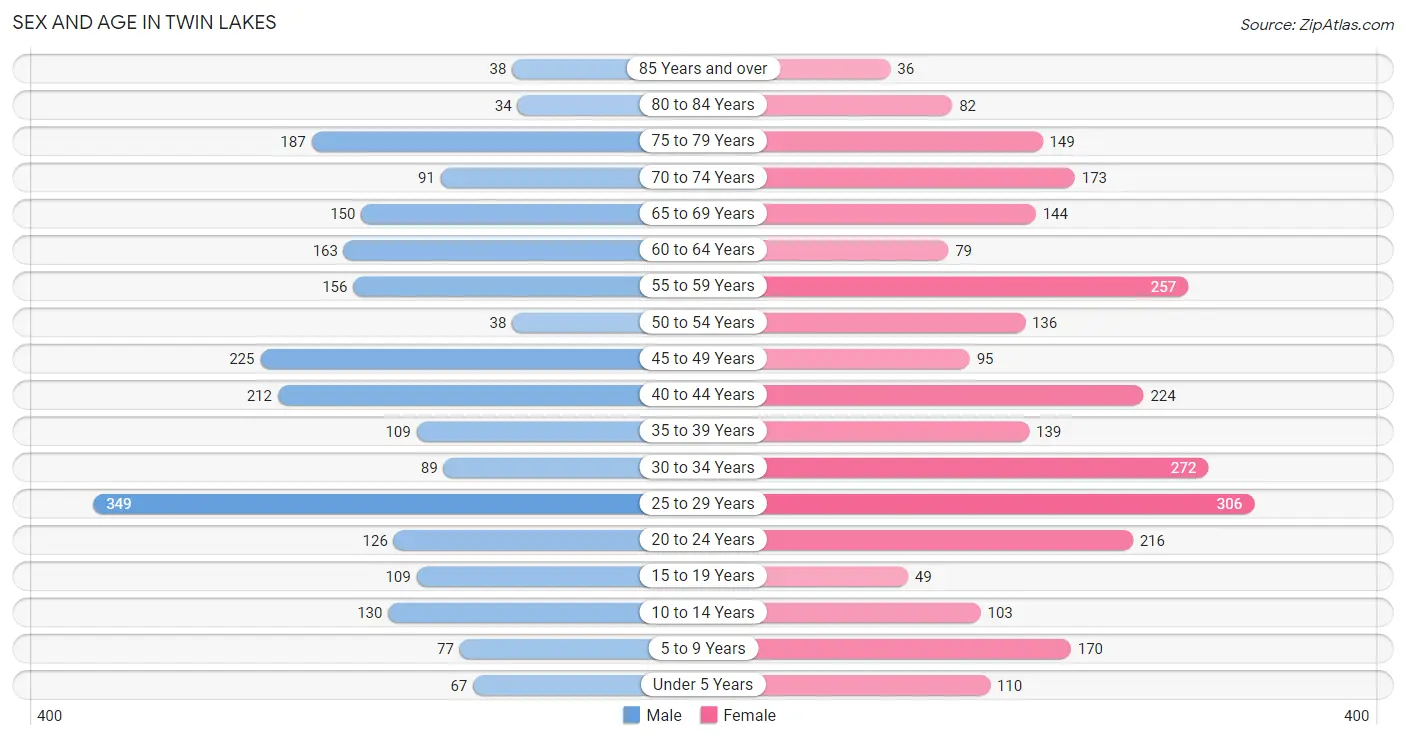
The most populous age groups in Twin Lakes are 25 to 29 Years (349 | 14.8%) for men and 25 to 29 Years (306 | 11.2%) for women.
| Age Bracket | Male | Female |
| Under 5 Years | 67 (2.9%) | 110 (4.0%) |
| 5 to 9 Years | 77 (3.3%) | 170 (6.2%) |
| 10 to 14 Years | 130 (5.5%) | 103 (3.8%) |
| 15 to 19 Years | 109 (4.6%) | 49 (1.8%) |
| 20 to 24 Years | 126 (5.4%) | 216 (7.9%) |
| 25 to 29 Years | 349 (14.8%) | 306 (11.2%) |
| 30 to 34 Years | 89 (3.8%) | 272 (9.9%) |
| 35 to 39 Years | 109 (4.6%) | 139 (5.1%) |
| 40 to 44 Years | 212 (9.0%) | 224 (8.2%) |
| 45 to 49 Years | 225 (9.6%) | 95 (3.5%) |
| 50 to 54 Years | 38 (1.6%) | 136 (5.0%) |
| 55 to 59 Years | 156 (6.6%) | 257 (9.4%) |
| 60 to 64 Years | 163 (6.9%) | 79 (2.9%) |
| 65 to 69 Years | 150 (6.4%) | 144 (5.3%) |
| 70 to 74 Years | 91 (3.9%) | 173 (6.3%) |
| 75 to 79 Years | 187 (8.0%) | 149 (5.4%) |
| 80 to 84 Years | 34 (1.5%) | 82 (3.0%) |
| 85 Years and over | 38 (1.6%) | 36 (1.3%) |
| Total | 2,350 (100.0%) | 2,740 (100.0%) |
Families and Households in Twin Lakes
Median Family Size in Twin Lakes
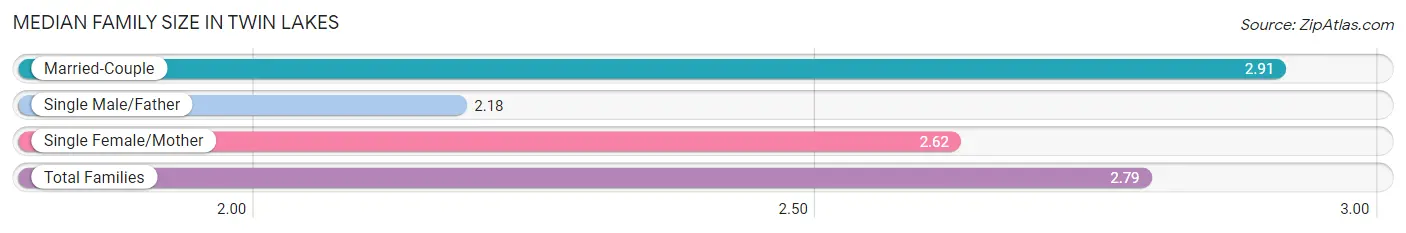
The median family size in Twin Lakes is 2.79 persons per family, with married-couple families (699 | 67.3%) accounting for the largest median family size of 2.91 persons per family. On the other hand, single male/father families (74 | 7.1%) represent the smallest median family size with 2.18 persons per family.
| Family Type | # Families | Family Size |
| Married-Couple | 699 (67.3%) | 2.91 |
| Single Male/Father | 74 (7.1%) | 2.18 |
| Single Female/Mother | 266 (25.6%) | 2.62 |
| Total Families | 1,039 (100.0%) | 2.79 |
Median Household Size in Twin Lakes
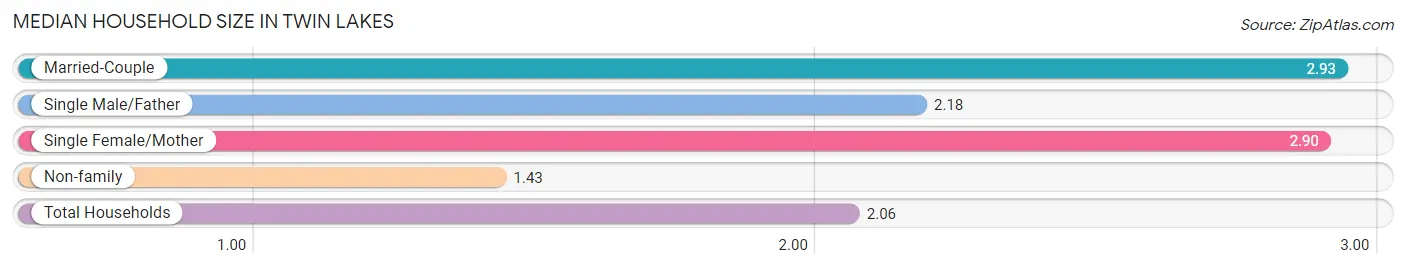
The median household size in Twin Lakes is 2.06 persons per household, with married-couple households (699 | 29.3%) accounting for the largest median household size of 2.93 persons per household. non-family households (1,346 | 56.4%) represent the smallest median household size with 1.43 persons per household.
| Household Type | # Households | Household Size |
| Married-Couple | 699 (29.3%) | 2.93 |
| Single Male/Father | 74 (3.1%) | 2.18 |
| Single Female/Mother | 266 (11.2%) | 2.90 |
| Non-family | 1,346 (56.4%) | 1.43 |
| Total Households | 2,385 (100.0%) | 2.06 |
Household Size by Marriage Status in Twin Lakes
Out of a total of 2,385 households in Twin Lakes, 1,039 (43.6%) are family households, while 1,346 (56.4%) are nonfamily households. The most numerous type of family households are 2-person households, comprising 632, and the most common type of nonfamily households are 1-person households, comprising 886.
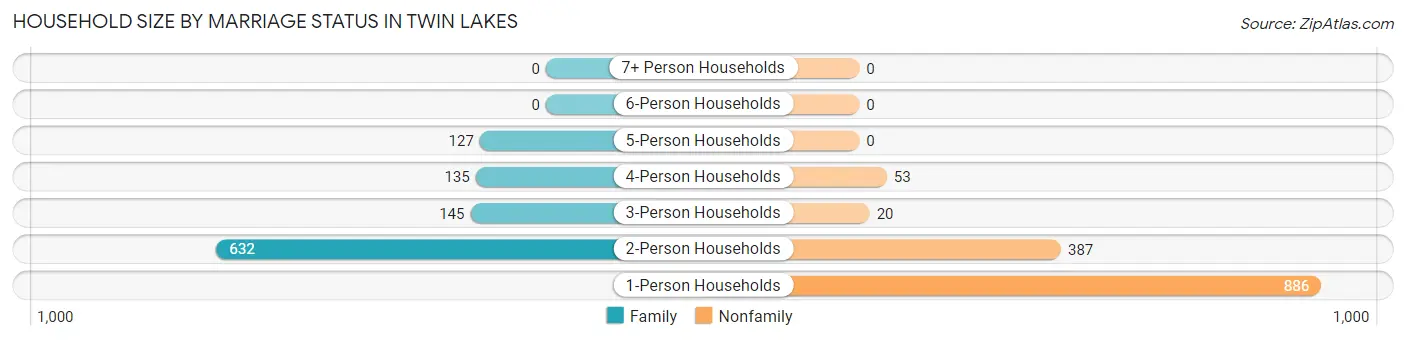
| Household Size | Family Households | Nonfamily Households |
| 1-Person Households | - | 886 (37.1%) |
| 2-Person Households | 632 (26.5%) | 387 (16.2%) |
| 3-Person Households | 145 (6.1%) | 20 (0.8%) |
| 4-Person Households | 135 (5.7%) | 53 (2.2%) |
| 5-Person Households | 127 (5.3%) | 0 (0.0%) |
| 6-Person Households | 0 (0.0%) | 0 (0.0%) |
| 7+ Person Households | 0 (0.0%) | 0 (0.0%) |
| Total | 1,039 (43.6%) | 1,346 (56.4%) |
Female Fertility in Twin Lakes
Fertility by Age in Twin Lakes
Average fertility rate in Twin Lakes is 84.0 births per 1,000 women. Women in the age bracket of 35 to 50 years have the highest fertility rate with 141.0 births per 1,000 women. Women in the age bracket of 35 to 50 years acount for 59.1% of all women with births.
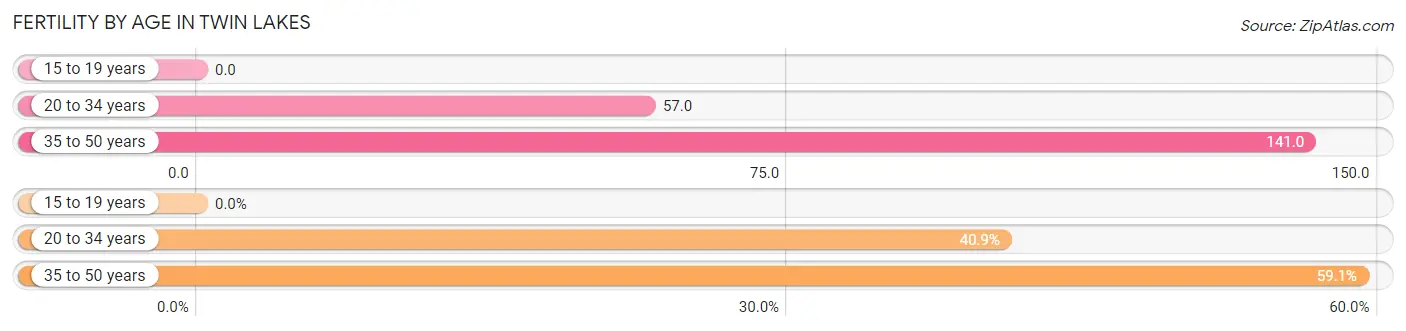
| Age Bracket | Women with Births | Births / 1,000 Women |
| 15 to 19 years | 0 (0.0%) | 0.0 |
| 20 to 34 years | 45 (40.9%) | 57.0 |
| 35 to 50 years | 65 (59.1%) | 141.0 |
| Total | 110 (100.0%) | 84.0 |
Fertility by Age by Marriage Status in Twin Lakes
97.3% of women with births (110) in Twin Lakes are married. The highest percentage of unmarried women with births falls into 20 to 34 years age bracket with 6.7% of them unmarried at the time of birth, while the lowest percentage of unmarried women with births belong to 35 to 50 years age bracket with 0.0% of them unmarried.
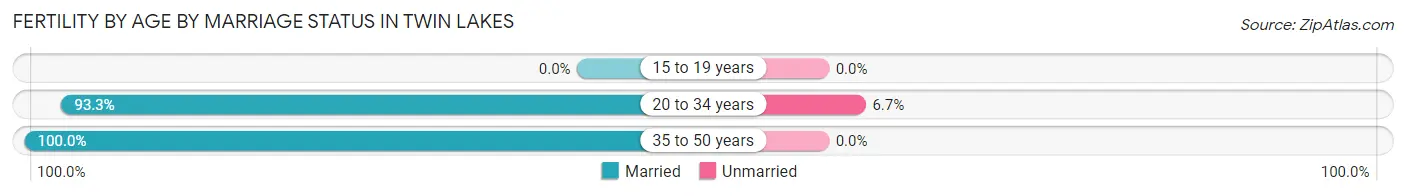
| Age Bracket | Married | Unmarried |
| 15 to 19 years | 0 (0.0%) | 0 (0.0%) |
| 20 to 34 years | 42 (93.3%) | 3 (6.7%) |
| 35 to 50 years | 65 (100.0%) | 0 (0.0%) |
| Total | 107 (97.3%) | 3 (2.7%) |
Fertility by Education in Twin Lakes
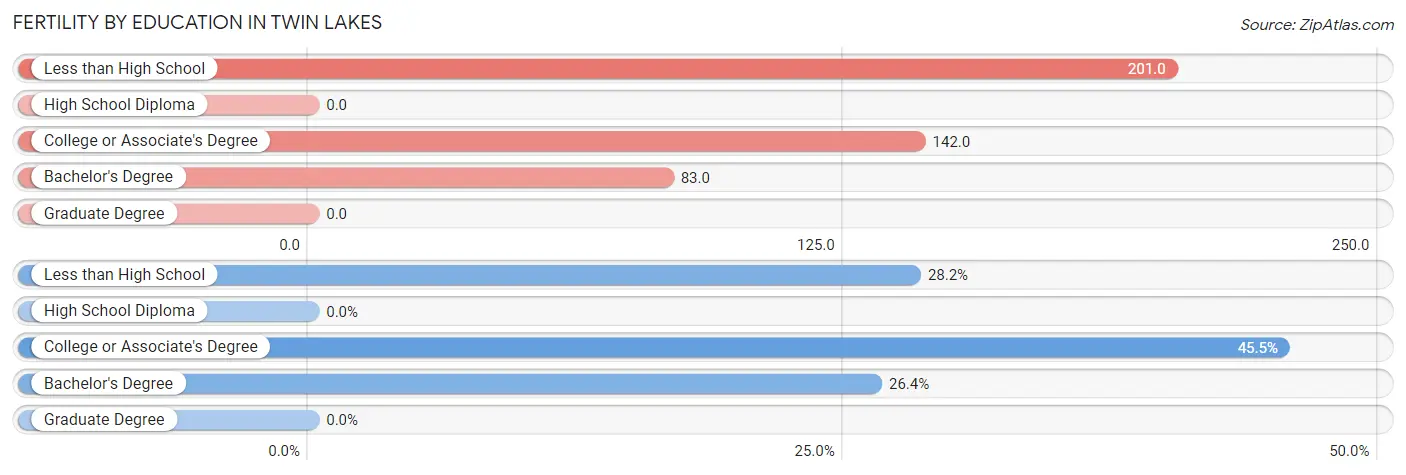
| Educational Attainment | Women with Births | Births / 1,000 Women |
| Less than High School | 31 (28.2%) | 201.0 |
| High School Diploma | 0 (0.0%) | 0.0 |
| College or Associate's Degree | 50 (45.5%) | 142.0 |
| Bachelor's Degree | 29 (26.4%) | 83.0 |
| Graduate Degree | 0 (0.0%) | 0.0 |
| Total | 110 (100.0%) | 84.0 |
Fertility by Education by Marriage Status in Twin Lakes
2.7% of women with births in Twin Lakes are unmarried. Women with the educational attainment of less than high school are most likely to be married with 100.0% of them married at childbirth, while women with the educational attainment of college or associate's degree are least likely to be married with 6.0% of them unmarried at childbirth.
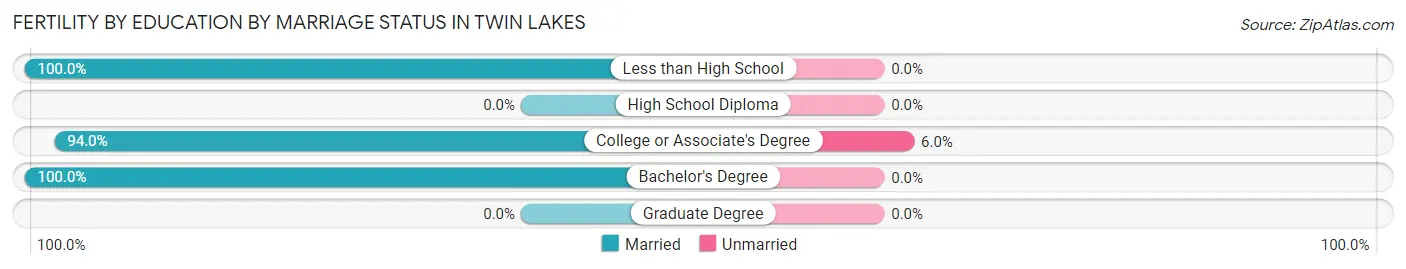
| Educational Attainment | Married | Unmarried |
| Less than High School | 31 (100.0%) | 0 (0.0%) |
| High School Diploma | 0 (0.0%) | 0 (0.0%) |
| College or Associate's Degree | 47 (94.0%) | 3 (6.0%) |
| Bachelor's Degree | 29 (100.0%) | 0 (0.0%) |
| Graduate Degree | 0 (0.0%) | 0 (0.0%) |
| Total | 107 (97.3%) | 3 (2.7%) |
Employment Characteristics in Twin Lakes
Employment by Class of Employer in Twin Lakes
Among the 2,720 employed individuals in Twin Lakes, private company employees (1,394 | 51.2%), self-employed (not incorporated) (433 | 15.9%), and not-for-profit organizations (240 | 8.8%) make up the most common classes of employment.
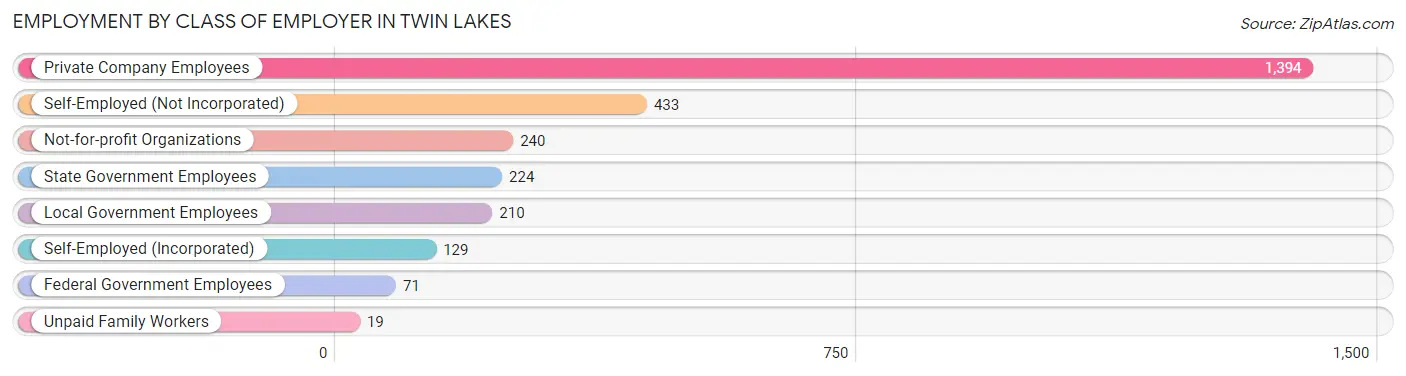
| Employer Class | # Employees | % Employees |
| Private Company Employees | 1,394 | 51.2% |
| Self-Employed (Incorporated) | 129 | 4.7% |
| Self-Employed (Not Incorporated) | 433 | 15.9% |
| Not-for-profit Organizations | 240 | 8.8% |
| Local Government Employees | 210 | 7.7% |
| State Government Employees | 224 | 8.2% |
| Federal Government Employees | 71 | 2.6% |
| Unpaid Family Workers | 19 | 0.7% |
| Total | 2,720 | 100.0% |
Employment Status by Age in Twin Lakes
According to the labor force statistics for Twin Lakes, out of the total population over 16 years of age (4,404), 64.4% or 2,836 individuals are in the labor force, with 3.6% or 102 of them unemployed. The age group with the highest labor force participation rate is 30 to 34 years, with 95.8% or 346 individuals in the labor force. Within the labor force, the 16 to 19 years age range has the highest percentage of unemployed individuals, with 66.0% or 35 of them being unemployed.
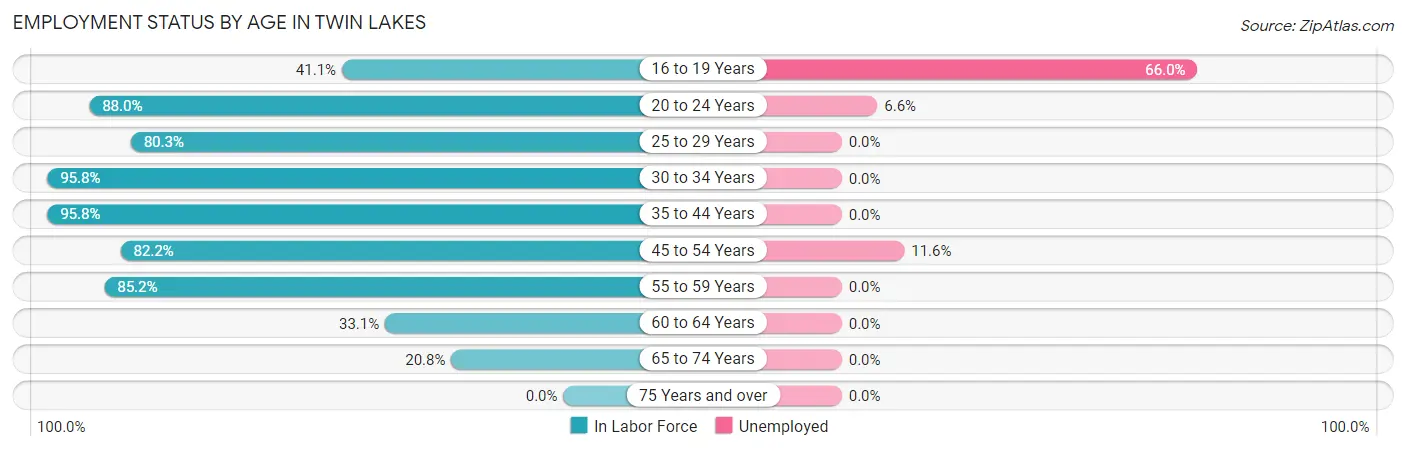
| Age Bracket | In Labor Force | Unemployed |
| 16 to 19 Years | 53 (41.1%) | 35 (66.0%) |
| 20 to 24 Years | 301 (88.0%) | 20 (6.6%) |
| 25 to 29 Years | 526 (80.3%) | 0 (0.0%) |
| 30 to 34 Years | 346 (95.8%) | 0 (0.0%) |
| 35 to 44 Years | 655 (95.8%) | 0 (0.0%) |
| 45 to 54 Years | 406 (82.2%) | 47 (11.6%) |
| 55 to 59 Years | 352 (85.2%) | 0 (0.0%) |
| 60 to 64 Years | 80 (33.1%) | 0 (0.0%) |
| 65 to 74 Years | 116 (20.8%) | 0 (0.0%) |
| 75 Years and over | 0 (0.0%) | 0 (0.0%) |
| Total | 2,836 (64.4%) | 102 (3.6%) |
Employment Status by Educational Attainment in Twin Lakes
According to labor force statistics for Twin Lakes, 83.0% of individuals (2,365) out of the total population between 25 and 64 years of age (2,849) are in the labor force, with 2.0% or 47 of them being unemployed. The group with the highest labor force participation rate are those with the educational attainment of bachelor's degree or higher, with 93.5% or 1,144 individuals in the labor force. Within the labor force, individuals with high school diploma education have the highest percentage of unemployment, with 7.2% or 47 of them being unemployed.
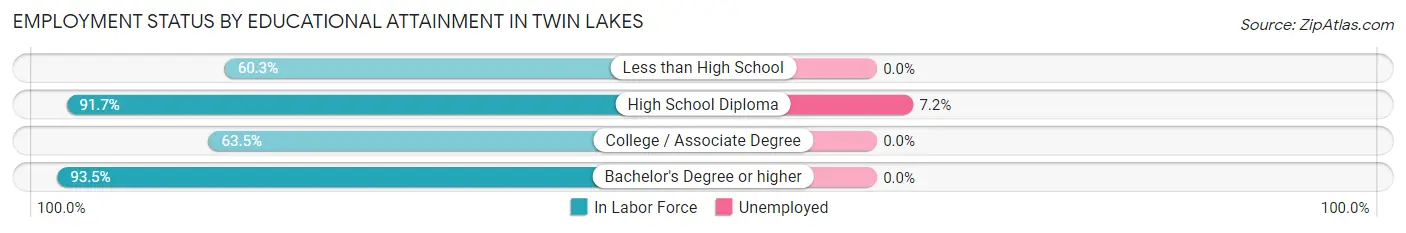
| Educational Attainment | In Labor Force | Unemployed |
| Less than High School | 222 (60.3%) | 0 (0.0%) |
| High School Diploma | 653 (91.7%) | 51 (7.2%) |
| College / Associate Degree | 346 (63.5%) | 0 (0.0%) |
| Bachelor's Degree or higher | 1,144 (93.5%) | 0 (0.0%) |
| Total | 2,365 (83.0%) | 57 (2.0%) |
Employment Occupations by Sex in Twin Lakes
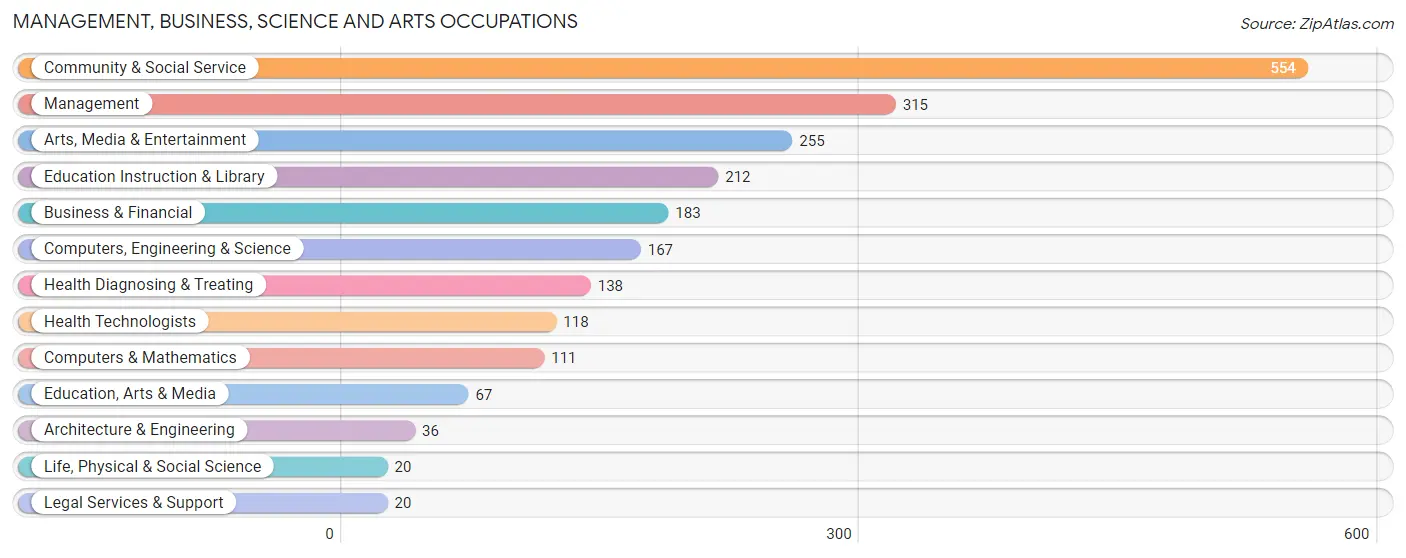
Management, Business, Science and Arts Occupations
The most common Management, Business, Science and Arts occupations in Twin Lakes are Community & Social Service (554 | 20.3%), Management (315 | 11.5%), Arts, Media & Entertainment (255 | 9.3%), Education Instruction & Library (212 | 7.8%), and Business & Financial (183 | 6.7%).
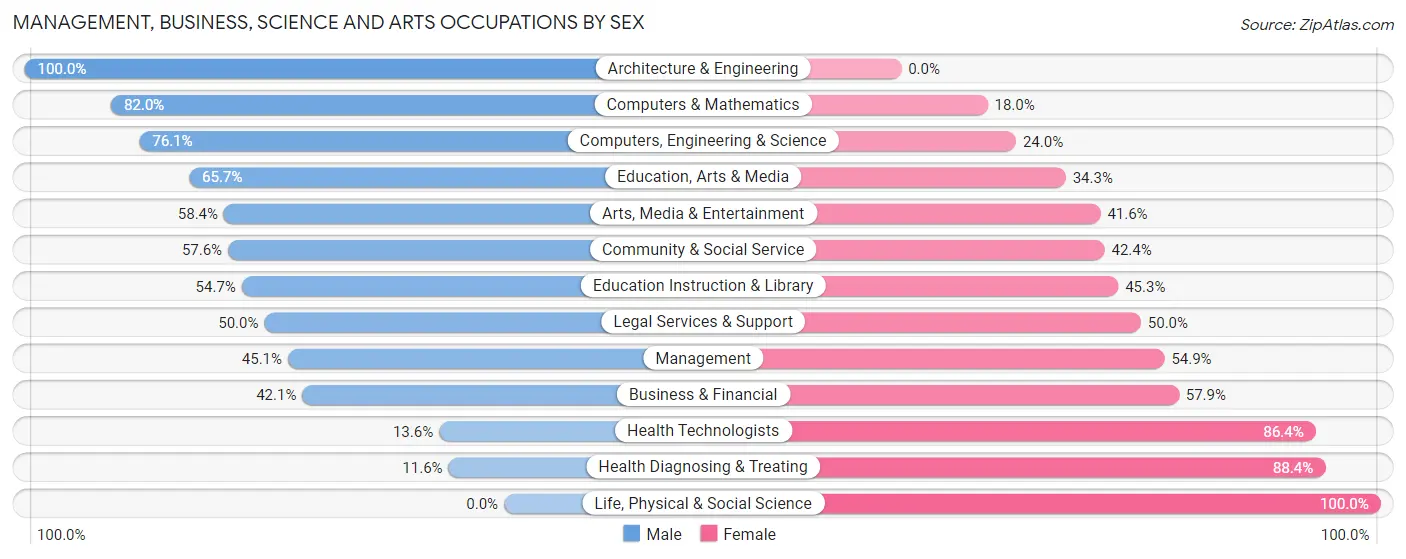
Management, Business, Science and Arts Occupations by Sex
Within the Management, Business, Science and Arts occupations in Twin Lakes, the most male-oriented occupations are Architecture & Engineering (100.0%), Computers & Mathematics (82.0%), and Computers, Engineering & Science (76.0%), while the most female-oriented occupations are Life, Physical & Social Science (100.0%), Health Diagnosing & Treating (88.4%), and Health Technologists (86.4%).
| Occupation | Male | Female |
| Management | 142 (45.1%) | 173 (54.9%) |
| Business & Financial | 77 (42.1%) | 106 (57.9%) |
| Computers, Engineering & Science | 127 (76.0%) | 40 (23.9%) |
| Computers & Mathematics | 91 (82.0%) | 20 (18.0%) |
| Architecture & Engineering | 36 (100.0%) | 0 (0.0%) |
| Life, Physical & Social Science | 0 (0.0%) | 20 (100.0%) |
| Community & Social Service | 319 (57.6%) | 235 (42.4%) |
| Education, Arts & Media | 44 (65.7%) | 23 (34.3%) |
| Legal Services & Support | 10 (50.0%) | 10 (50.0%) |
| Education Instruction & Library | 116 (54.7%) | 96 (45.3%) |
| Arts, Media & Entertainment | 149 (58.4%) | 106 (41.6%) |
| Health Diagnosing & Treating | 16 (11.6%) | 122 (88.4%) |
| Health Technologists | 16 (13.6%) | 102 (86.4%) |
| Total (Category) | 681 (50.2%) | 676 (49.8%) |
| Total (Overall) | 1,274 (46.6%) | 1,459 (53.4%) |
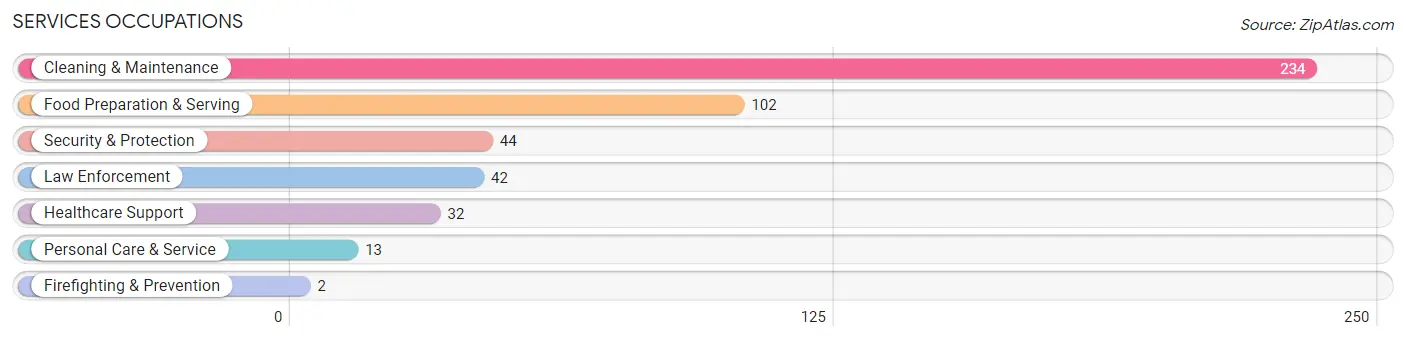
Services Occupations
The most common Services occupations in Twin Lakes are Cleaning & Maintenance (234 | 8.6%), Food Preparation & Serving (102 | 3.7%), Security & Protection (44 | 1.6%), Law Enforcement (42 | 1.5%), and Healthcare Support (32 | 1.2%).
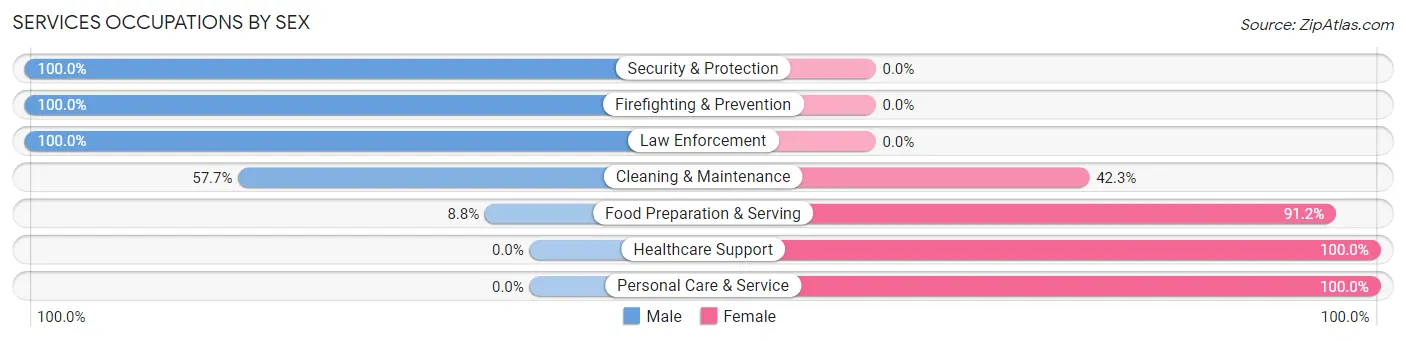
Services Occupations by Sex
Within the Services occupations in Twin Lakes, the most male-oriented occupations are Security & Protection (100.0%), Firefighting & Prevention (100.0%), and Law Enforcement (100.0%), while the most female-oriented occupations are Healthcare Support (100.0%), Personal Care & Service (100.0%), and Food Preparation & Serving (91.2%).
| Occupation | Male | Female |
| Healthcare Support | 0 (0.0%) | 32 (100.0%) |
| Security & Protection | 44 (100.0%) | 0 (0.0%) |
| Firefighting & Prevention | 2 (100.0%) | 0 (0.0%) |
| Law Enforcement | 42 (100.0%) | 0 (0.0%) |
| Food Preparation & Serving | 9 (8.8%) | 93 (91.2%) |
| Cleaning & Maintenance | 135 (57.7%) | 99 (42.3%) |
| Personal Care & Service | 0 (0.0%) | 13 (100.0%) |
| Total (Category) | 188 (44.2%) | 237 (55.8%) |
| Total (Overall) | 1,274 (46.6%) | 1,459 (53.4%) |
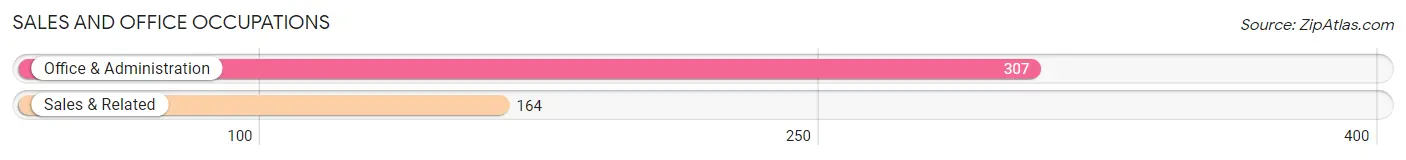
Sales and Office Occupations
The most common Sales and Office occupations in Twin Lakes are Office & Administration (307 | 11.2%), and Sales & Related (164 | 6.0%).
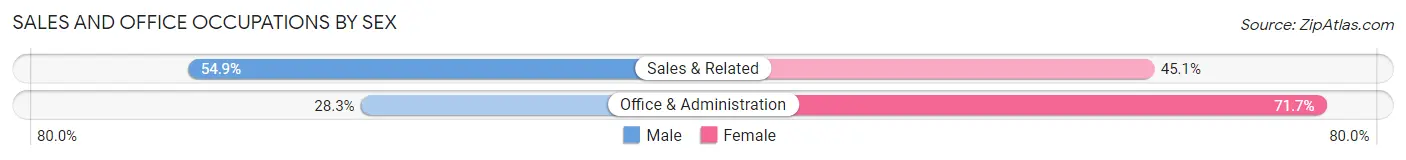
Sales and Office Occupations by Sex
| Occupation | Male | Female |
| Sales & Related | 90 (54.9%) | 74 (45.1%) |
| Office & Administration | 87 (28.3%) | 220 (71.7%) |
| Total (Category) | 177 (37.6%) | 294 (62.4%) |
| Total (Overall) | 1,274 (46.6%) | 1,459 (53.4%) |
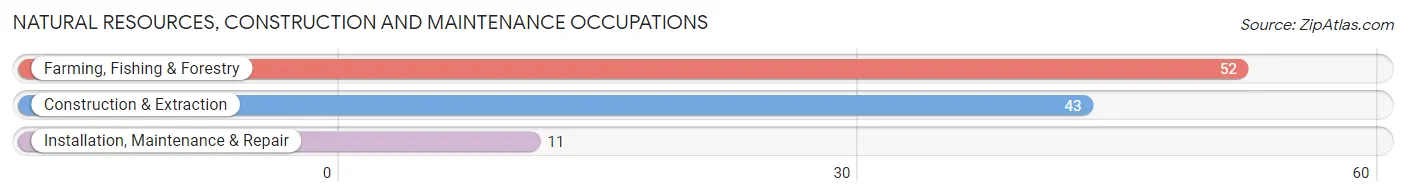
Natural Resources, Construction and Maintenance Occupations
The most common Natural Resources, Construction and Maintenance occupations in Twin Lakes are Farming, Fishing & Forestry (52 | 1.9%), Construction & Extraction (43 | 1.6%), and Installation, Maintenance & Repair (11 | 0.4%).
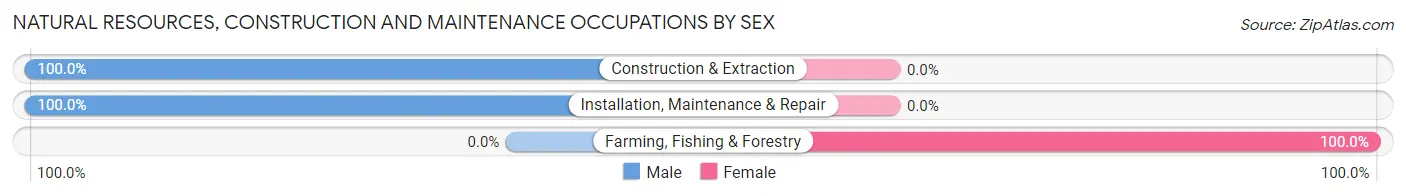
Natural Resources, Construction and Maintenance Occupations by Sex
| Occupation | Male | Female |
| Farming, Fishing & Forestry | 0 (0.0%) | 52 (100.0%) |
| Construction & Extraction | 43 (100.0%) | 0 (0.0%) |
| Installation, Maintenance & Repair | 11 (100.0%) | 0 (0.0%) |
| Total (Category) | 54 (50.9%) | 52 (49.1%) |
| Total (Overall) | 1,274 (46.6%) | 1,459 (53.4%) |
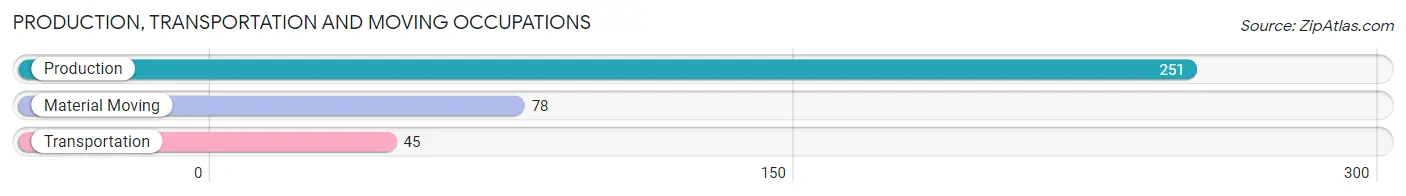
Production, Transportation and Moving Occupations
The most common Production, Transportation and Moving occupations in Twin Lakes are Production (251 | 9.2%), Material Moving (78 | 2.9%), and Transportation (45 | 1.7%).
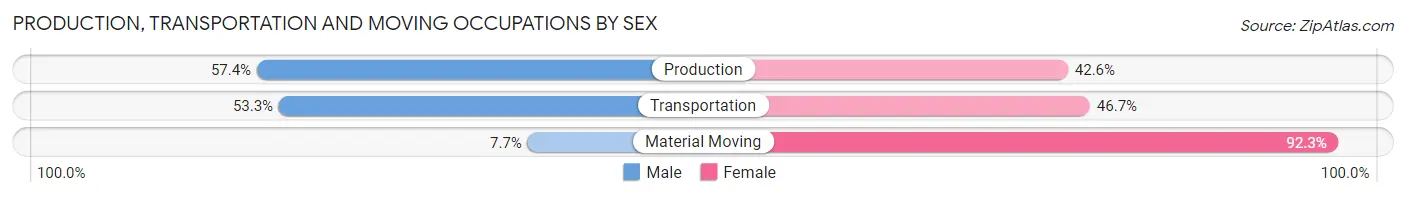
Production, Transportation and Moving Occupations by Sex
| Occupation | Male | Female |
| Production | 144 (57.4%) | 107 (42.6%) |
| Transportation | 24 (53.3%) | 21 (46.7%) |
| Material Moving | 6 (7.7%) | 72 (92.3%) |
| Total (Category) | 174 (46.5%) | 200 (53.5%) |
| Total (Overall) | 1,274 (46.6%) | 1,459 (53.4%) |
Employment Industries by Sex in Twin Lakes
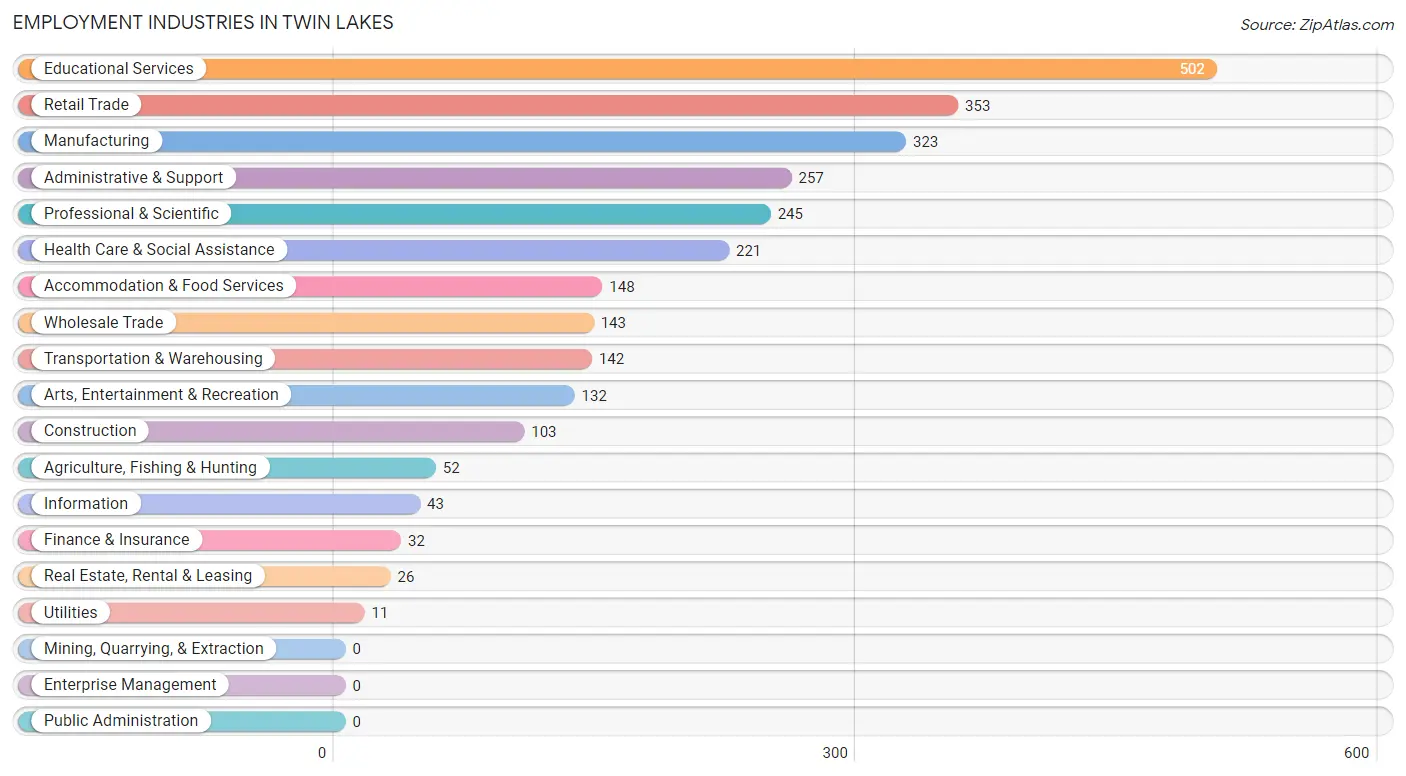
Employment Industries in Twin Lakes
The major employment industries in Twin Lakes include Educational Services (502 | 18.4%), Retail Trade (353 | 12.9%), Manufacturing (323 | 11.8%), Administrative & Support (257 | 9.4%), and Professional & Scientific (245 | 9.0%).
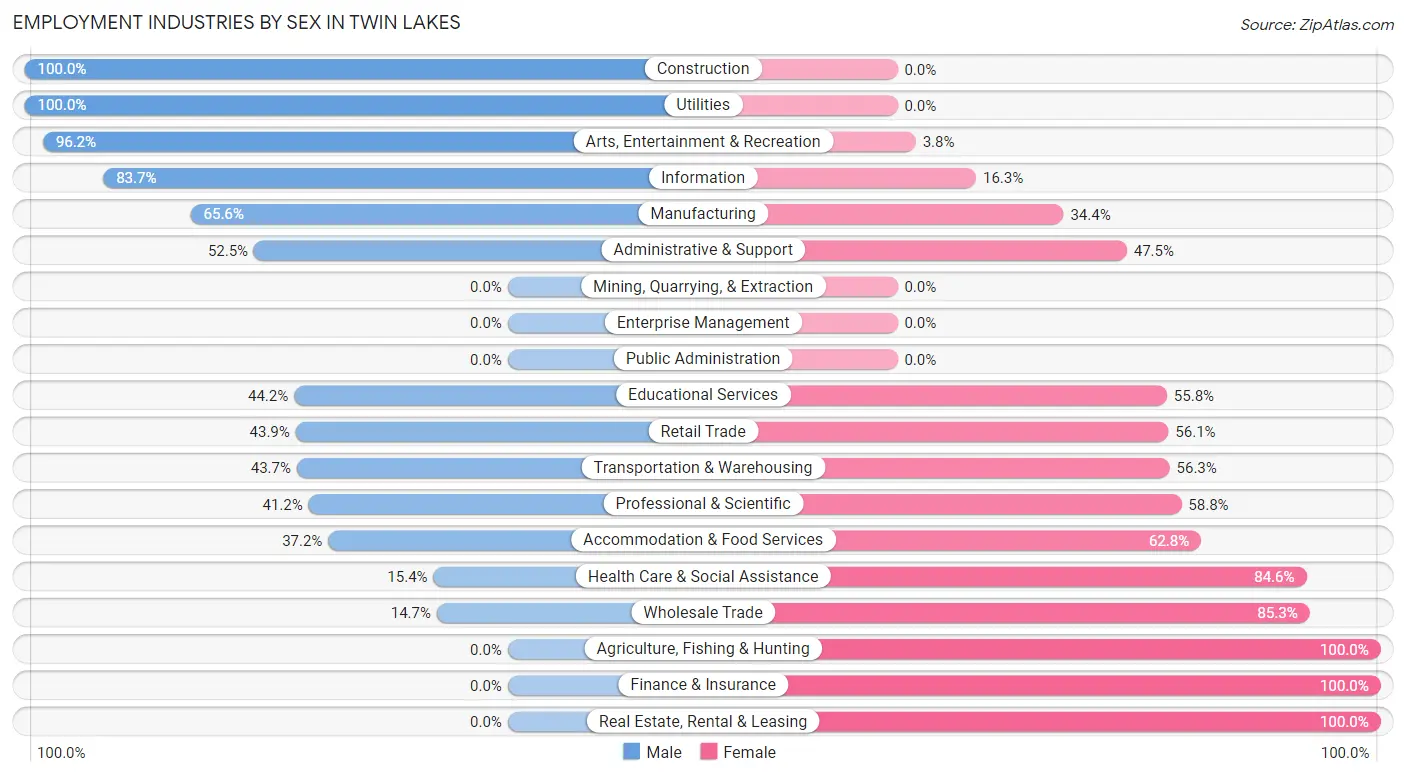
Employment Industries by Sex in Twin Lakes
The Twin Lakes industries that see more men than women are Construction (100.0%), Utilities (100.0%), and Arts, Entertainment & Recreation (96.2%), whereas the industries that tend to have a higher number of women are Agriculture, Fishing & Hunting (100.0%), Finance & Insurance (100.0%), and Real Estate, Rental & Leasing (100.0%).
| Industry | Male | Female |
| Agriculture, Fishing & Hunting | 0 (0.0%) | 52 (100.0%) |
| Mining, Quarrying, & Extraction | 0 (0.0%) | 0 (0.0%) |
| Construction | 103 (100.0%) | 0 (0.0%) |
| Manufacturing | 212 (65.6%) | 111 (34.4%) |
| Wholesale Trade | 21 (14.7%) | 122 (85.3%) |
| Retail Trade | 155 (43.9%) | 198 (56.1%) |
| Transportation & Warehousing | 62 (43.7%) | 80 (56.3%) |
| Utilities | 11 (100.0%) | 0 (0.0%) |
| Information | 36 (83.7%) | 7 (16.3%) |
| Finance & Insurance | 0 (0.0%) | 32 (100.0%) |
| Real Estate, Rental & Leasing | 0 (0.0%) | 26 (100.0%) |
| Professional & Scientific | 101 (41.2%) | 144 (58.8%) |
| Enterprise Management | 0 (0.0%) | 0 (0.0%) |
| Administrative & Support | 135 (52.5%) | 122 (47.5%) |
| Educational Services | 222 (44.2%) | 280 (55.8%) |
| Health Care & Social Assistance | 34 (15.4%) | 187 (84.6%) |
| Arts, Entertainment & Recreation | 127 (96.2%) | 5 (3.8%) |
| Accommodation & Food Services | 55 (37.2%) | 93 (62.8%) |
| Public Administration | 0 (0.0%) | 0 (0.0%) |
| Total | 1,274 (46.6%) | 1,459 (53.4%) |
Education in Twin Lakes
School Enrollment in Twin Lakes
The most common levels of schooling among the 1,018 students in Twin Lakes are college / undergraduate (321 | 31.5%), middle school (233 | 22.9%), and elementary school (183 | 18.0%).
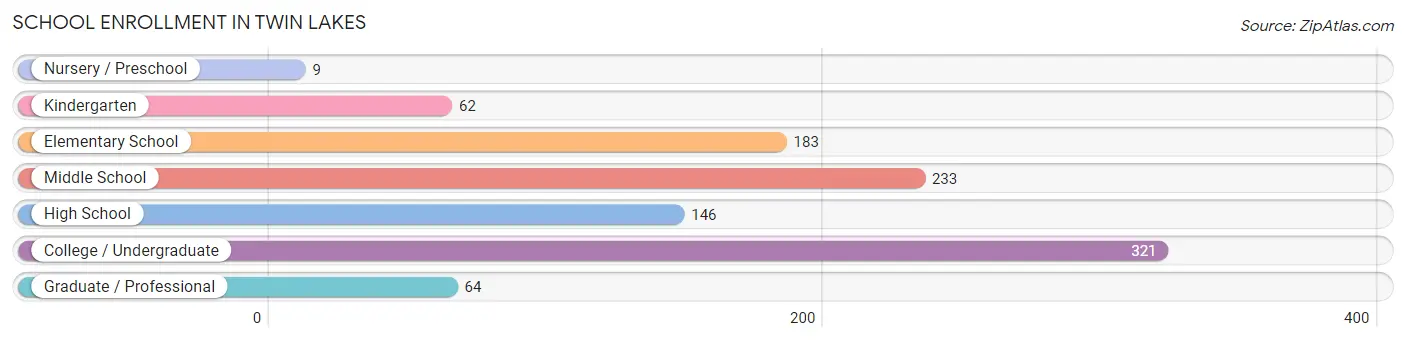
| School Level | # Students | % Students |
| Nursery / Preschool | 9 | 0.9% |
| Kindergarten | 62 | 6.1% |
| Elementary School | 183 | 18.0% |
| Middle School | 233 | 22.9% |
| High School | 146 | 14.3% |
| College / Undergraduate | 321 | 31.5% |
| Graduate / Professional | 64 | 6.3% |
| Total | 1,018 | 100.0% |
School Enrollment by Age by Funding Source in Twin Lakes
Out of a total of 1,018 students who are enrolled in schools in Twin Lakes, 87 (8.5%) attend a private institution, while the remaining 931 (91.5%) are enrolled in public schools. The age group of 3 to 4 year olds has the highest likelihood of being enrolled in private schools, with 7 (100.0% in the age bracket) enrolled. Conversely, the age group of 10 to 14 year olds has the lowest likelihood of being enrolled in a private school, with 233 (100.0% in the age bracket) attending a public institution.
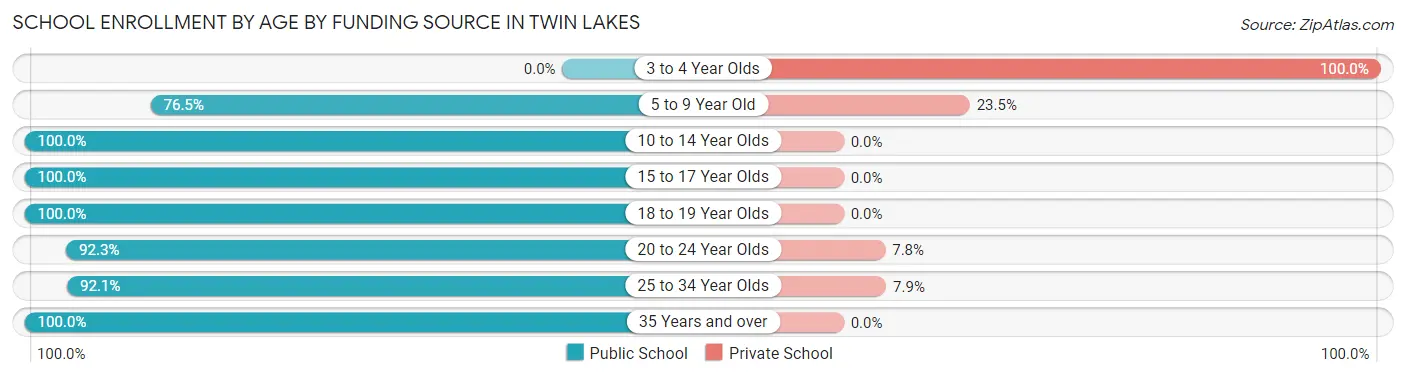
| Age Bracket | Public School | Private School |
| 3 to 4 Year Olds | 0 (0.0%) | 7 (100.0%) |
| 5 to 9 Year Old | 189 (76.5%) | 58 (23.5%) |
| 10 to 14 Year Olds | 233 (100.0%) | 0 (0.0%) |
| 15 to 17 Year Olds | 115 (100.0%) | 0 (0.0%) |
| 18 to 19 Year Olds | 43 (100.0%) | 0 (0.0%) |
| 20 to 24 Year Olds | 131 (92.2%) | 11 (7.7%) |
| 25 to 34 Year Olds | 128 (92.1%) | 11 (7.9%) |
| 35 Years and over | 92 (100.0%) | 0 (0.0%) |
| Total | 931 (91.5%) | 87 (8.5%) |
Educational Attainment by Field of Study in Twin Lakes
Visual & performing arts (386 | 19.2%), social sciences (266 | 13.3%), literature & languages (183 | 9.1%), bio, nature & agricultural (166 | 8.3%), and business (135 | 6.7%) are the most common fields of study among 2,006 individuals in Twin Lakes who have obtained a bachelor's degree or higher.
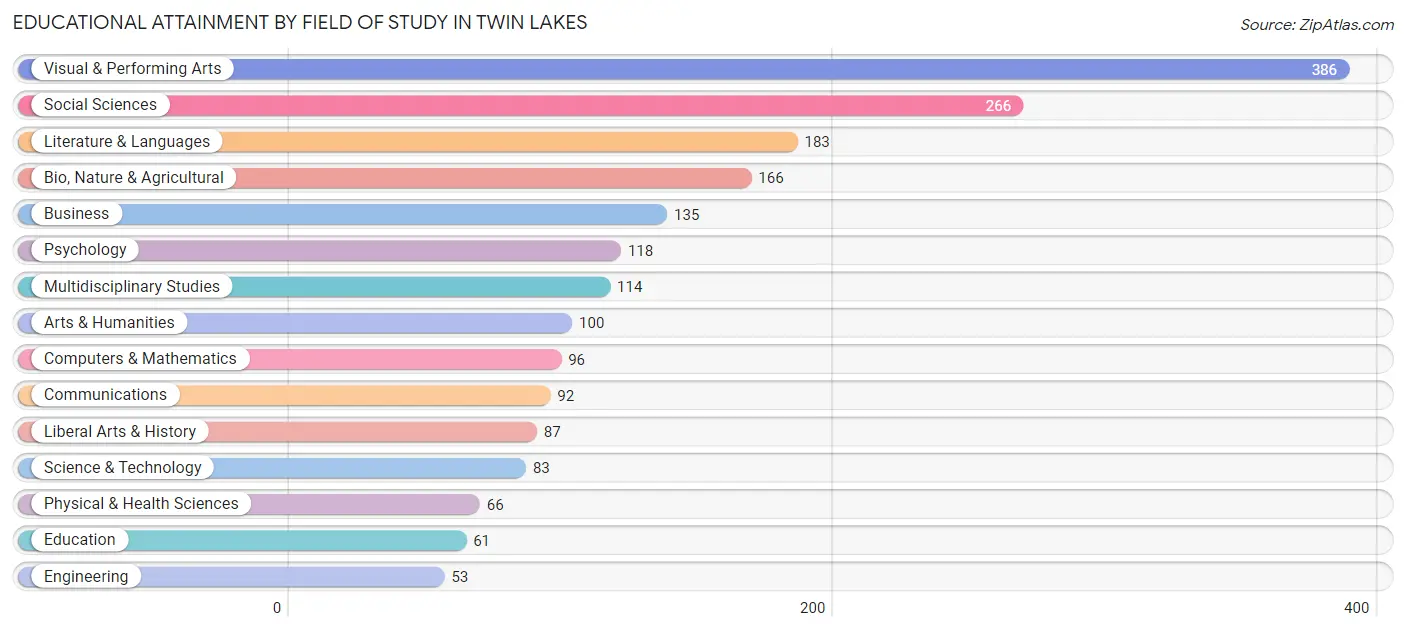
| Field of Study | # Graduates | % Graduates |
| Computers & Mathematics | 96 | 4.8% |
| Bio, Nature & Agricultural | 166 | 8.3% |
| Physical & Health Sciences | 66 | 3.3% |
| Psychology | 118 | 5.9% |
| Social Sciences | 266 | 13.3% |
| Engineering | 53 | 2.6% |
| Multidisciplinary Studies | 114 | 5.7% |
| Science & Technology | 83 | 4.1% |
| Business | 135 | 6.7% |
| Education | 61 | 3.0% |
| Literature & Languages | 183 | 9.1% |
| Liberal Arts & History | 87 | 4.3% |
| Visual & Performing Arts | 386 | 19.2% |
| Communications | 92 | 4.6% |
| Arts & Humanities | 100 | 5.0% |
| Total | 2,006 | 100.0% |
Transportation & Commute in Twin Lakes
Vehicle Availability by Sex in Twin Lakes
The most prevalent vehicle ownership categories in Twin Lakes are males with 2 vehicles (652, accounting for 52.1%) and females with 2 vehicles (725, making up 45.3%).
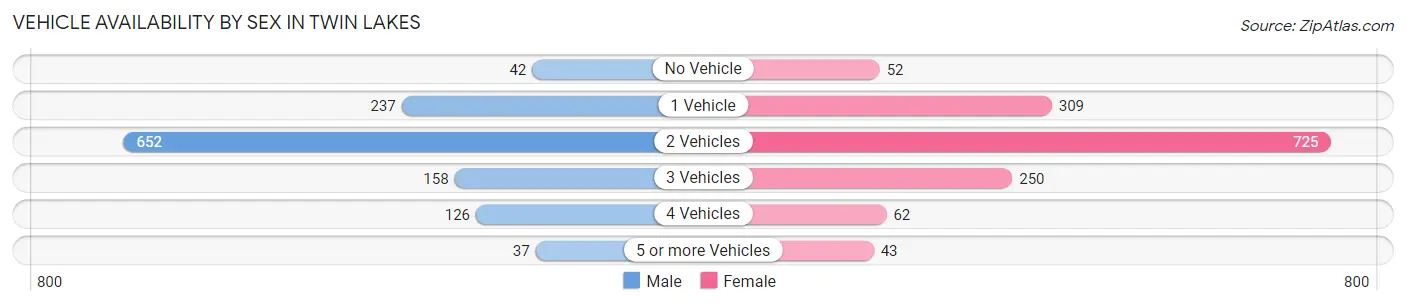
| Vehicles Available | Male | Female |
| No Vehicle | 42 (3.4%) | 52 (3.6%) |
| 1 Vehicle | 237 (18.9%) | 309 (21.4%) |
| 2 Vehicles | 652 (52.1%) | 725 (50.3%) |
| 3 Vehicles | 158 (12.6%) | 250 (17.3%) |
| 4 Vehicles | 126 (10.1%) | 62 (4.3%) |
| 5 or more Vehicles | 37 (3.0%) | 43 (3.0%) |
| Total | 1,252 (100.0%) | 1,441 (100.0%) |
Commute Time in Twin Lakes
The most frequently occuring commute durations in Twin Lakes are 20 to 24 minutes (477 commuters, 19.3%), 15 to 19 minutes (435 commuters, 17.6%), and 25 to 29 minutes (351 commuters, 14.2%).
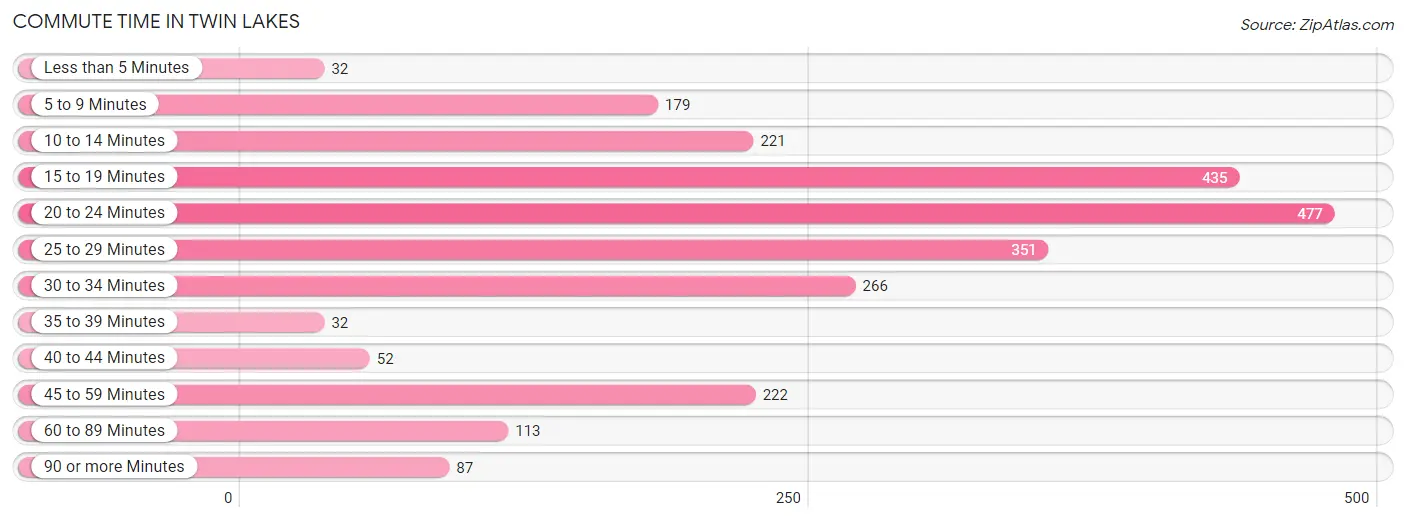
| Commute Time | # Commuters | % Commuters |
| Less than 5 Minutes | 32 | 1.3% |
| 5 to 9 Minutes | 179 | 7.3% |
| 10 to 14 Minutes | 221 | 9.0% |
| 15 to 19 Minutes | 435 | 17.6% |
| 20 to 24 Minutes | 477 | 19.3% |
| 25 to 29 Minutes | 351 | 14.2% |
| 30 to 34 Minutes | 266 | 10.8% |
| 35 to 39 Minutes | 32 | 1.3% |
| 40 to 44 Minutes | 52 | 2.1% |
| 45 to 59 Minutes | 222 | 9.0% |
| 60 to 89 Minutes | 113 | 4.6% |
| 90 or more Minutes | 87 | 3.5% |
Commute Time by Sex in Twin Lakes
The most common commute times in Twin Lakes are 15 to 19 minutes (255 commuters, 21.9%) for males and 20 to 24 minutes (322 commuters, 24.7%) for females.
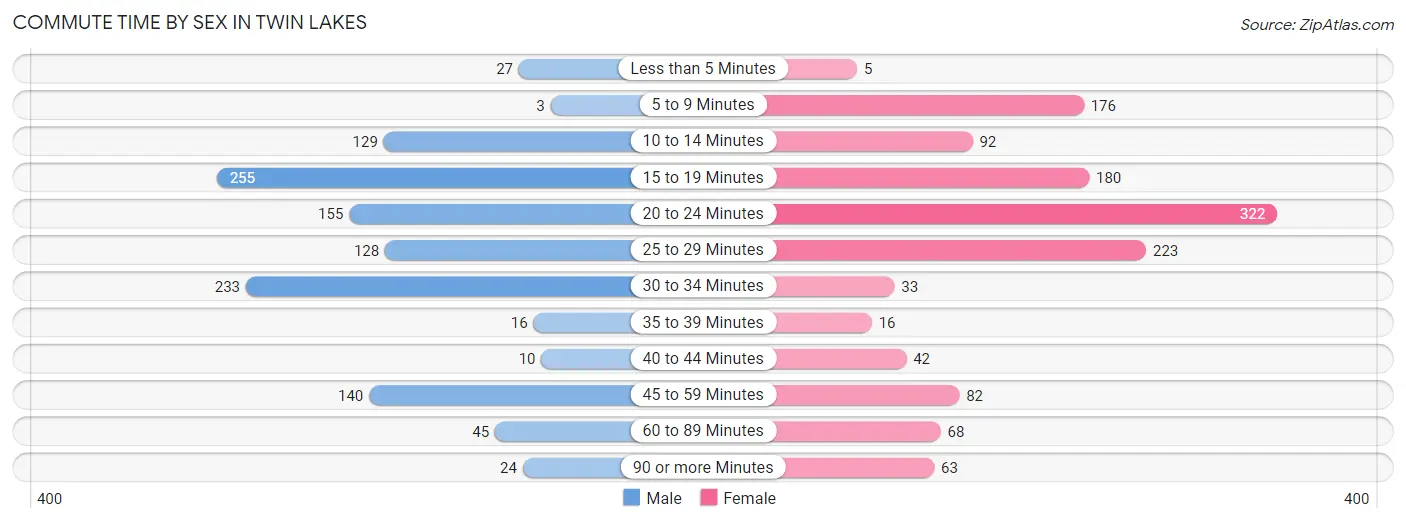
| Commute Time | Male | Female |
| Less than 5 Minutes | 27 (2.3%) | 5 (0.4%) |
| 5 to 9 Minutes | 3 (0.3%) | 176 (13.5%) |
| 10 to 14 Minutes | 129 (11.1%) | 92 (7.1%) |
| 15 to 19 Minutes | 255 (21.9%) | 180 (13.8%) |
| 20 to 24 Minutes | 155 (13.3%) | 322 (24.7%) |
| 25 to 29 Minutes | 128 (11.0%) | 223 (17.1%) |
| 30 to 34 Minutes | 233 (20.0%) | 33 (2.5%) |
| 35 to 39 Minutes | 16 (1.4%) | 16 (1.2%) |
| 40 to 44 Minutes | 10 (0.9%) | 42 (3.2%) |
| 45 to 59 Minutes | 140 (12.0%) | 82 (6.3%) |
| 60 to 89 Minutes | 45 (3.9%) | 68 (5.2%) |
| 90 or more Minutes | 24 (2.1%) | 63 (4.8%) |
Time of Departure to Work by Sex in Twin Lakes
The most frequent times of departure to work in Twin Lakes are 7:30 AM to 7:59 AM (297, 25.5%) for males and 7:30 AM to 7:59 AM (273, 21.0%) for females.
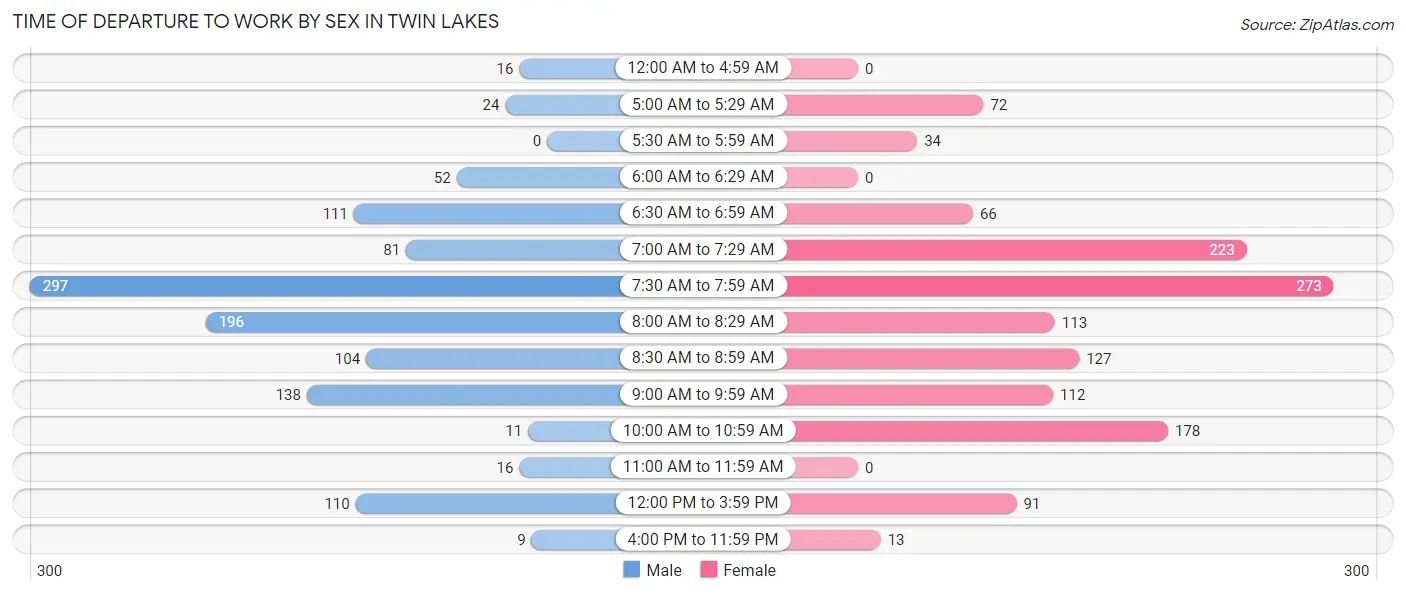
| Time of Departure | Male | Female |
| 12:00 AM to 4:59 AM | 16 (1.4%) | 0 (0.0%) |
| 5:00 AM to 5:29 AM | 24 (2.1%) | 72 (5.5%) |
| 5:30 AM to 5:59 AM | 0 (0.0%) | 34 (2.6%) |
| 6:00 AM to 6:29 AM | 52 (4.5%) | 0 (0.0%) |
| 6:30 AM to 6:59 AM | 111 (9.5%) | 66 (5.1%) |
| 7:00 AM to 7:29 AM | 81 (7.0%) | 223 (17.1%) |
| 7:30 AM to 7:59 AM | 297 (25.5%) | 273 (21.0%) |
| 8:00 AM to 8:29 AM | 196 (16.8%) | 113 (8.7%) |
| 8:30 AM to 8:59 AM | 104 (8.9%) | 127 (9.8%) |
| 9:00 AM to 9:59 AM | 138 (11.8%) | 112 (8.6%) |
| 10:00 AM to 10:59 AM | 11 (0.9%) | 178 (13.7%) |
| 11:00 AM to 11:59 AM | 16 (1.4%) | 0 (0.0%) |
| 12:00 PM to 3:59 PM | 110 (9.4%) | 91 (7.0%) |
| 4:00 PM to 11:59 PM | 9 (0.8%) | 13 (1.0%) |
| Total | 1,165 (100.0%) | 1,302 (100.0%) |
Housing Occupancy in Twin Lakes
Occupancy by Ownership in Twin Lakes
Of the total 2,385 dwellings in Twin Lakes, owner-occupied units account for 903 (37.9%), while renter-occupied units make up 1,482 (62.1%).
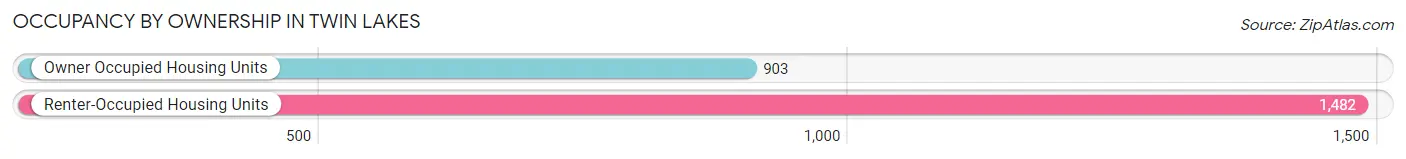
| Occupancy | # Housing Units | % Housing Units |
| Owner Occupied Housing Units | 903 | 37.9% |
| Renter-Occupied Housing Units | 1,482 | 62.1% |
| Total Occupied Housing Units | 2,385 | 100.0% |
Occupancy by Household Size in Twin Lakes
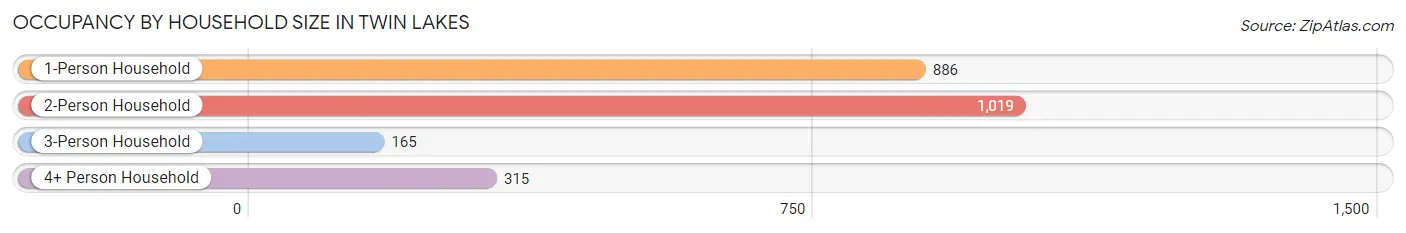
| Household Size | # Housing Units | % Housing Units |
| 1-Person Household | 886 | 37.1% |
| 2-Person Household | 1,019 | 42.7% |
| 3-Person Household | 165 | 6.9% |
| 4+ Person Household | 315 | 13.2% |
| Total Housing Units | 2,385 | 100.0% |
Occupancy by Ownership by Household Size in Twin Lakes
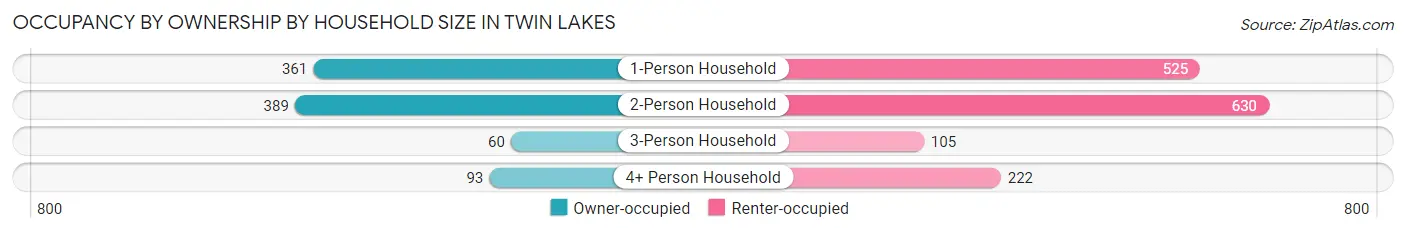
| Household Size | Owner-occupied | Renter-occupied |
| 1-Person Household | 361 (40.7%) | 525 (59.3%) |
| 2-Person Household | 389 (38.2%) | 630 (61.8%) |
| 3-Person Household | 60 (36.4%) | 105 (63.6%) |
| 4+ Person Household | 93 (29.5%) | 222 (70.5%) |
| Total Housing Units | 903 (37.9%) | 1,482 (62.1%) |
Occupancy by Educational Attainment in Twin Lakes
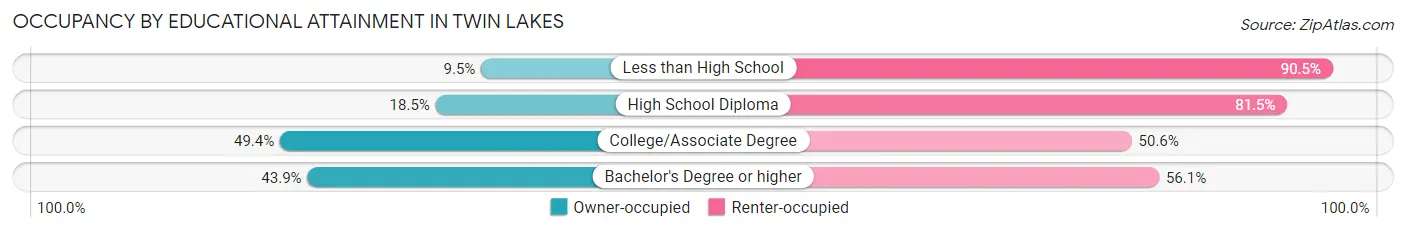
| Household Size | Owner-occupied | Renter-occupied |
| Less than High School | 23 (9.5%) | 220 (90.5%) |
| High School Diploma | 69 (18.5%) | 304 (81.5%) |
| College/Associate Degree | 308 (49.4%) | 316 (50.6%) |
| Bachelor's Degree or higher | 503 (43.9%) | 642 (56.1%) |
Occupancy by Age of Householder in Twin Lakes
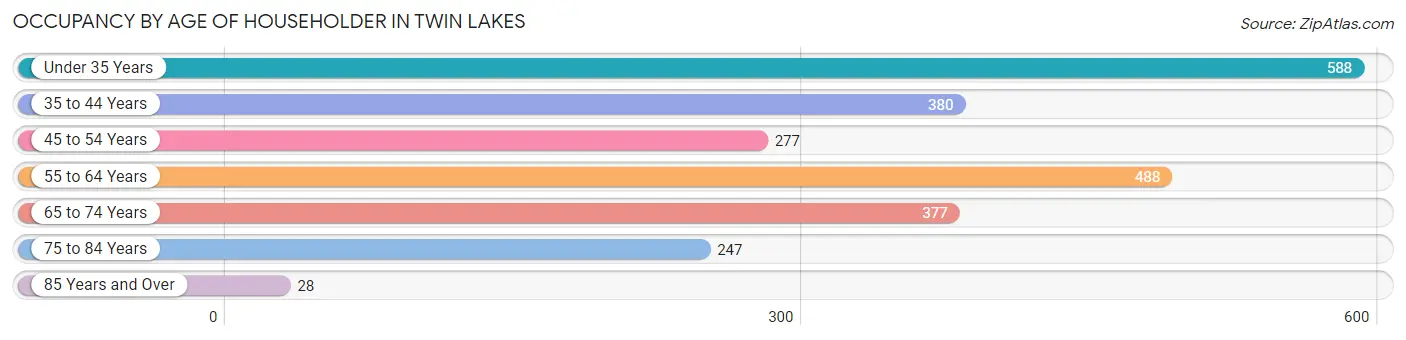
| Age Bracket | # Households | % Households |
| Under 35 Years | 588 | 24.6% |
| 35 to 44 Years | 380 | 15.9% |
| 45 to 54 Years | 277 | 11.6% |
| 55 to 64 Years | 488 | 20.5% |
| 65 to 74 Years | 377 | 15.8% |
| 75 to 84 Years | 247 | 10.4% |
| 85 Years and Over | 28 | 1.2% |
| Total | 2,385 | 100.0% |
Housing Finances in Twin Lakes
Median Income by Occupancy in Twin Lakes
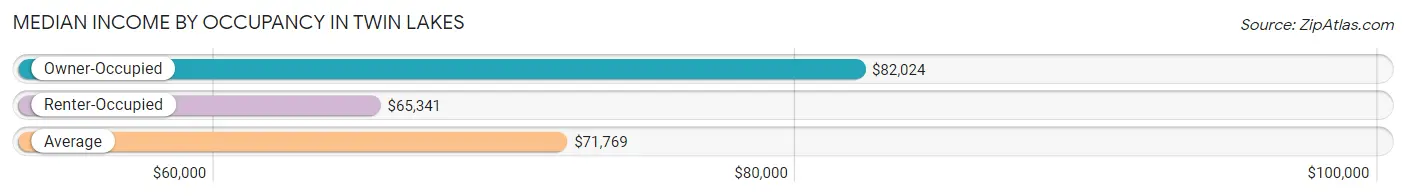
| Occupancy Type | # Households | Median Income |
| Owner-Occupied | 903 (37.9%) | $82,024 |
| Renter-Occupied | 1,482 (62.1%) | $65,341 |
| Average | 2,385 (100.0%) | $71,769 |
Occupancy by Householder Income Bracket in Twin Lakes
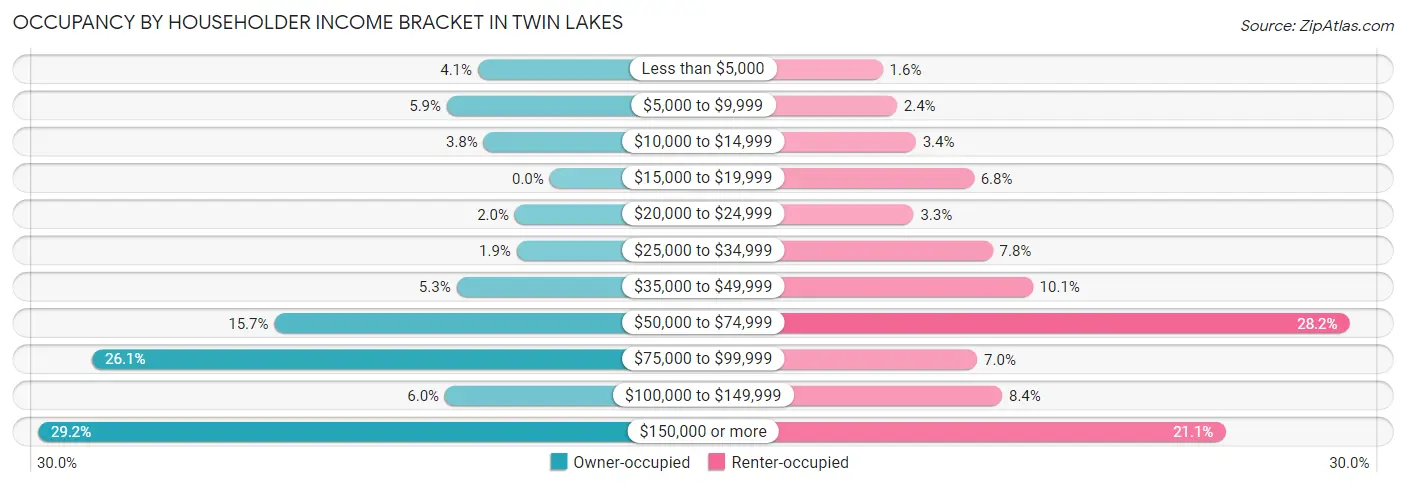
| Income Bracket | Owner-occupied | Renter-occupied |
| Less than $5,000 | 37 (4.1%) | 23 (1.5%) |
| $5,000 to $9,999 | 53 (5.9%) | 35 (2.4%) |
| $10,000 to $14,999 | 34 (3.8%) | 51 (3.4%) |
| $15,000 to $19,999 | 0 (0.0%) | 100 (6.8%) |
| $20,000 to $24,999 | 18 (2.0%) | 49 (3.3%) |
| $25,000 to $34,999 | 17 (1.9%) | 116 (7.8%) |
| $35,000 to $49,999 | 48 (5.3%) | 150 (10.1%) |
| $50,000 to $74,999 | 142 (15.7%) | 418 (28.2%) |
| $75,000 to $99,999 | 236 (26.1%) | 103 (7.0%) |
| $100,000 to $149,999 | 54 (6.0%) | 124 (8.4%) |
| $150,000 or more | 264 (29.2%) | 313 (21.1%) |
| Total | 903 (100.0%) | 1,482 (100.0%) |
Monthly Housing Cost Tiers in Twin Lakes
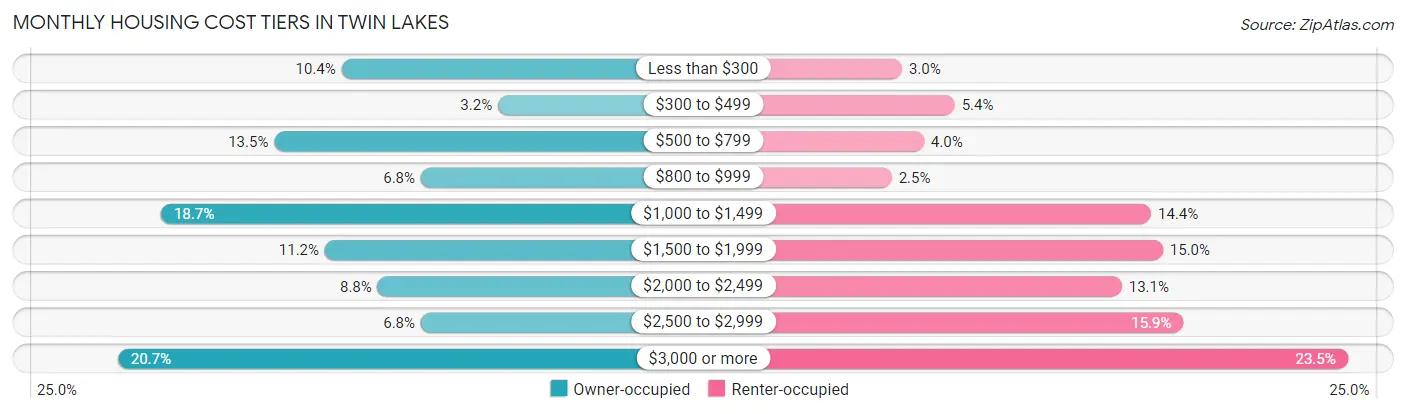
| Monthly Cost | Owner-occupied | Renter-occupied |
| Less than $300 | 94 (10.4%) | 44 (3.0%) |
| $300 to $499 | 29 (3.2%) | 80 (5.4%) |
| $500 to $799 | 122 (13.5%) | 59 (4.0%) |
| $800 to $999 | 61 (6.8%) | 37 (2.5%) |
| $1,000 to $1,499 | 169 (18.7%) | 214 (14.4%) |
| $1,500 to $1,999 | 101 (11.2%) | 222 (15.0%) |
| $2,000 to $2,499 | 79 (8.7%) | 194 (13.1%) |
| $2,500 to $2,999 | 61 (6.8%) | 236 (15.9%) |
| $3,000 or more | 187 (20.7%) | 348 (23.5%) |
| Total | 903 (100.0%) | 1,482 (100.0%) |
Physical Housing Characteristics in Twin Lakes
Housing Structures in Twin Lakes
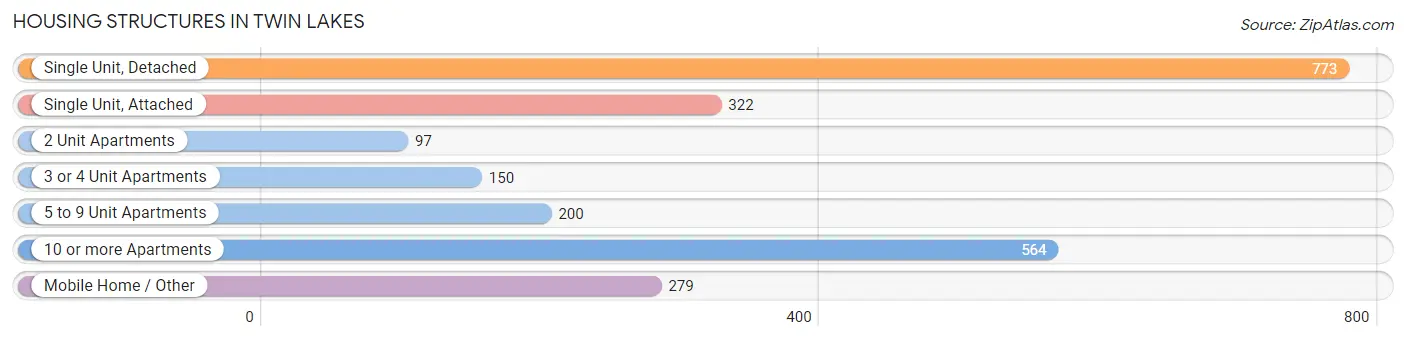
| Structure Type | # Housing Units | % Housing Units |
| Single Unit, Detached | 773 | 32.4% |
| Single Unit, Attached | 322 | 13.5% |
| 2 Unit Apartments | 97 | 4.1% |
| 3 or 4 Unit Apartments | 150 | 6.3% |
| 5 to 9 Unit Apartments | 200 | 8.4% |
| 10 or more Apartments | 564 | 23.6% |
| Mobile Home / Other | 279 | 11.7% |
| Total | 2,385 | 100.0% |
Housing Structures by Occupancy in Twin Lakes
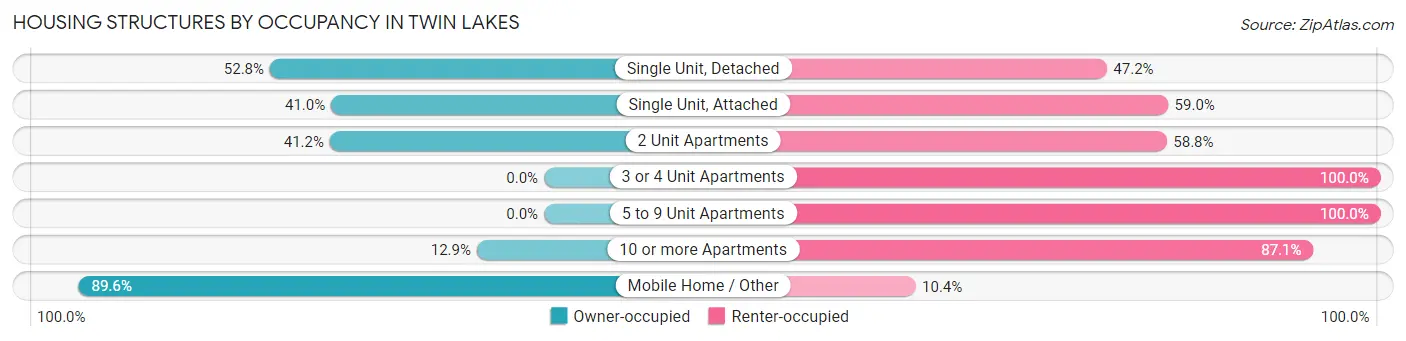
| Structure Type | Owner-occupied | Renter-occupied |
| Single Unit, Detached | 408 (52.8%) | 365 (47.2%) |
| Single Unit, Attached | 132 (41.0%) | 190 (59.0%) |
| 2 Unit Apartments | 40 (41.2%) | 57 (58.8%) |
| 3 or 4 Unit Apartments | 0 (0.0%) | 150 (100.0%) |
| 5 to 9 Unit Apartments | 0 (0.0%) | 200 (100.0%) |
| 10 or more Apartments | 73 (12.9%) | 491 (87.1%) |
| Mobile Home / Other | 250 (89.6%) | 29 (10.4%) |
| Total | 903 (37.9%) | 1,482 (62.1%) |
Housing Structures by Number of Rooms in Twin Lakes
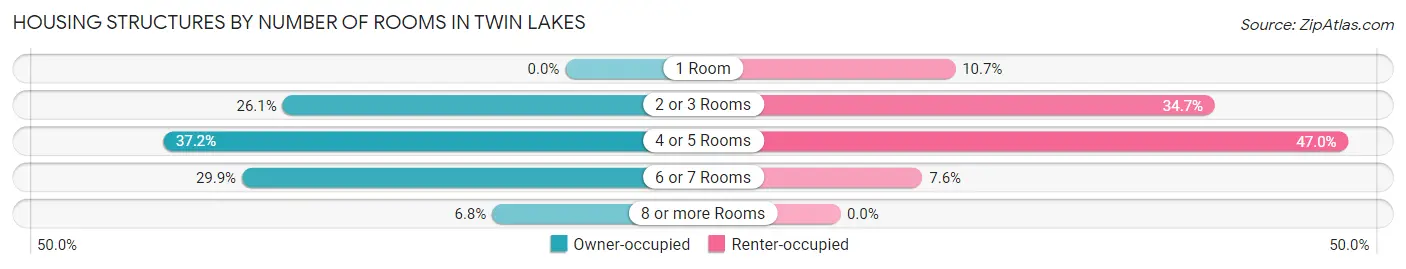
| Number of Rooms | Owner-occupied | Renter-occupied |
| 1 Room | 0 (0.0%) | 158 (10.7%) |
| 2 or 3 Rooms | 236 (26.1%) | 514 (34.7%) |
| 4 or 5 Rooms | 336 (37.2%) | 697 (47.0%) |
| 6 or 7 Rooms | 270 (29.9%) | 113 (7.6%) |
| 8 or more Rooms | 61 (6.8%) | 0 (0.0%) |
| Total | 903 (100.0%) | 1,482 (100.0%) |
Housing Structure by Heating Type in Twin Lakes
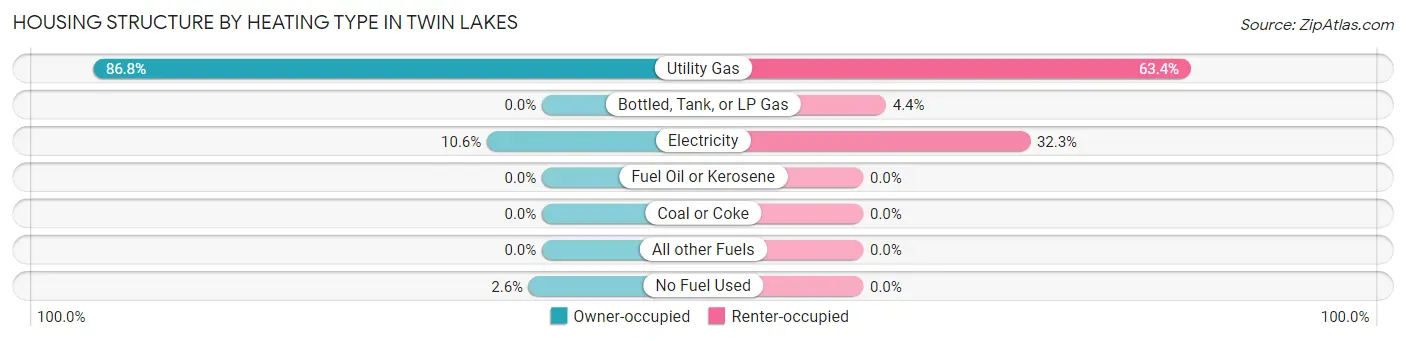
| Heating Type | Owner-occupied | Renter-occupied |
| Utility Gas | 784 (86.8%) | 939 (63.4%) |
| Bottled, Tank, or LP Gas | 0 (0.0%) | 65 (4.4%) |
| Electricity | 96 (10.6%) | 478 (32.3%) |
| Fuel Oil or Kerosene | 0 (0.0%) | 0 (0.0%) |
| Coal or Coke | 0 (0.0%) | 0 (0.0%) |
| All other Fuels | 0 (0.0%) | 0 (0.0%) |
| No Fuel Used | 23 (2.5%) | 0 (0.0%) |
| Total | 903 (100.0%) | 1,482 (100.0%) |
Household Vehicle Usage in Twin Lakes
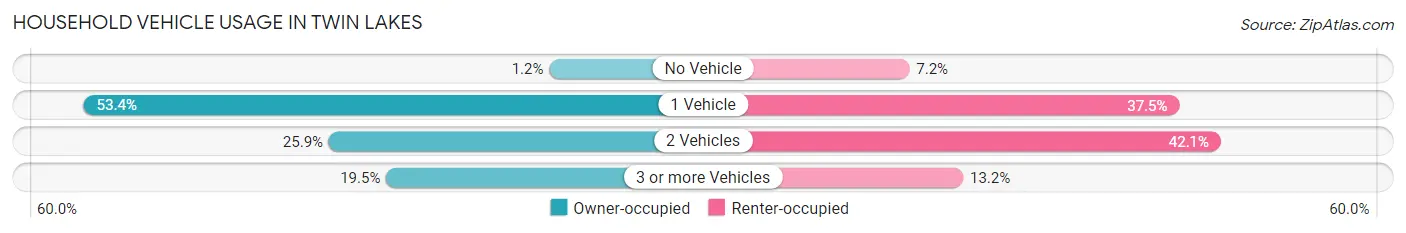
| Vehicles per Household | Owner-occupied | Renter-occupied |
| No Vehicle | 11 (1.2%) | 107 (7.2%) |
| 1 Vehicle | 482 (53.4%) | 555 (37.4%) |
| 2 Vehicles | 234 (25.9%) | 624 (42.1%) |
| 3 or more Vehicles | 176 (19.5%) | 196 (13.2%) |
| Total | 903 (100.0%) | 1,482 (100.0%) |
Real Estate & Mortgages in Twin Lakes
Real Estate and Mortgage Overview in Twin Lakes
| Characteristic | Without Mortgage | With Mortgage |
| Housing Units | 441 | 462 |
| Median Property Value | $690,300 | $1,051,300 |
| Median Household Income | $80,064 | $175 |
| Monthly Housing Costs | $844 | $167 |
| Real Estate Taxes | $6,250 | $0 |
Property Value by Mortgage Status in Twin Lakes
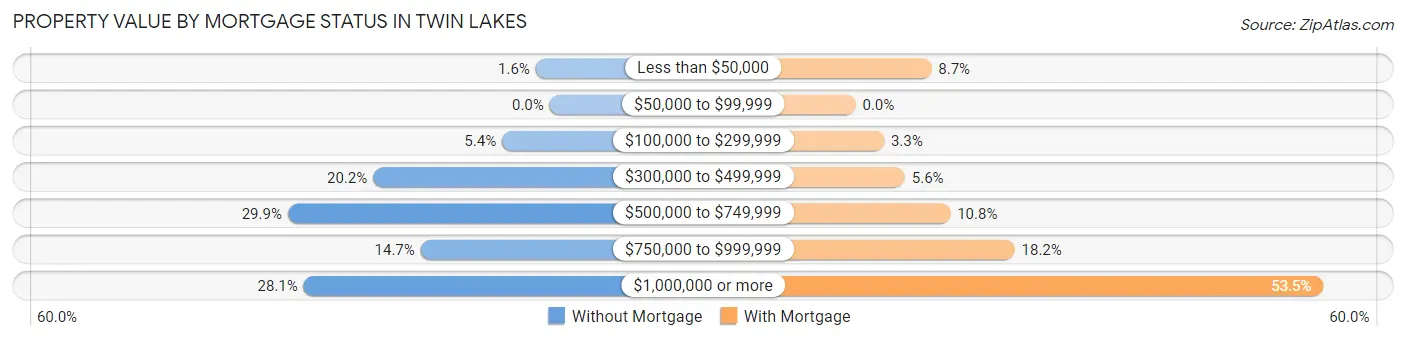
| Property Value | Without Mortgage | With Mortgage |
| Less than $50,000 | 7 (1.6%) | 40 (8.7%) |
| $50,000 to $99,999 | 0 (0.0%) | 0 (0.0%) |
| $100,000 to $299,999 | 24 (5.4%) | 15 (3.3%) |
| $300,000 to $499,999 | 89 (20.2%) | 26 (5.6%) |
| $500,000 to $749,999 | 132 (29.9%) | 50 (10.8%) |
| $750,000 to $999,999 | 65 (14.7%) | 84 (18.2%) |
| $1,000,000 or more | 124 (28.1%) | 247 (53.5%) |
| Total | 441 (100.0%) | 462 (100.0%) |
Household Income by Mortgage Status in Twin Lakes
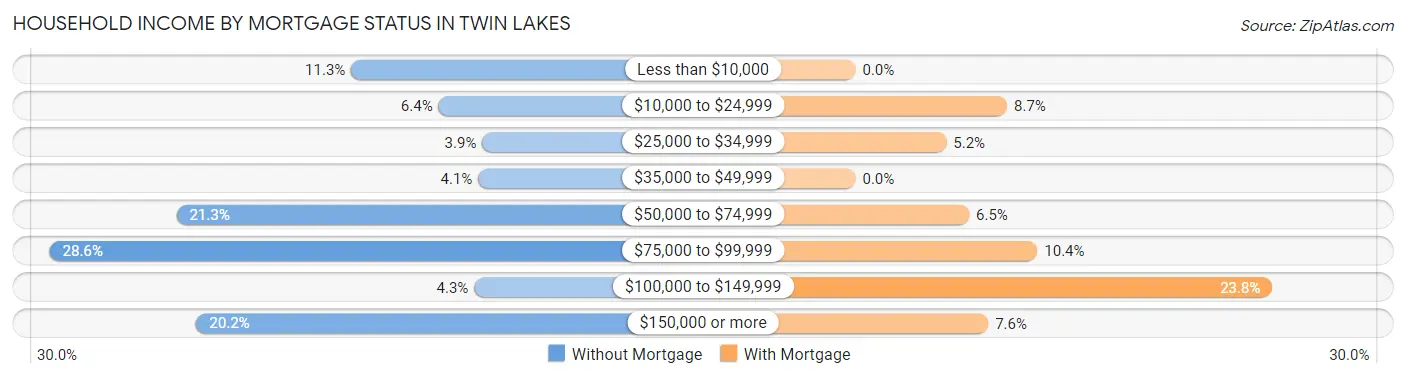
| Household Income | Without Mortgage | With Mortgage |
| Less than $10,000 | 50 (11.3%) | 0 (0.0%) |
| $10,000 to $24,999 | 28 (6.4%) | 40 (8.7%) |
| $25,000 to $34,999 | 17 (3.8%) | 24 (5.2%) |
| $35,000 to $49,999 | 18 (4.1%) | 0 (0.0%) |
| $50,000 to $74,999 | 94 (21.3%) | 30 (6.5%) |
| $75,000 to $99,999 | 126 (28.6%) | 48 (10.4%) |
| $100,000 to $149,999 | 19 (4.3%) | 110 (23.8%) |
| $150,000 or more | 89 (20.2%) | 35 (7.6%) |
| Total | 441 (100.0%) | 462 (100.0%) |
Property Value to Household Income Ratio in Twin Lakes
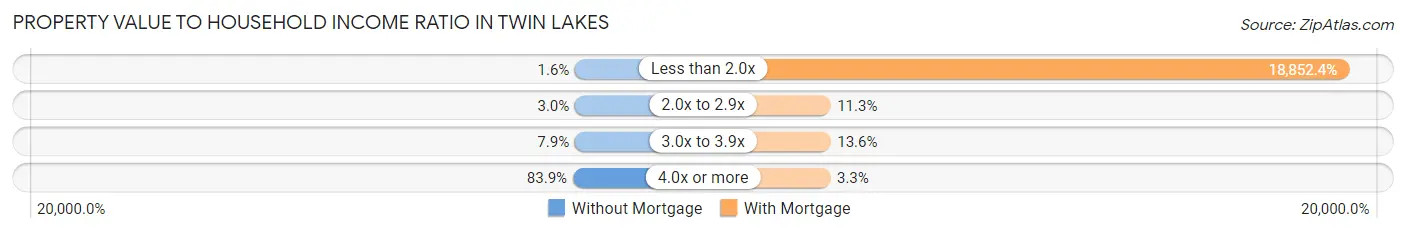
| Value-to-Income Ratio | Without Mortgage | With Mortgage |
| Less than 2.0x | 7 (1.6%) | 87,098 (18,852.4%) |
| 2.0x to 2.9x | 13 (2.9%) | 52 (11.3%) |
| 3.0x to 3.9x | 35 (7.9%) | 63 (13.6%) |
| 4.0x or more | 370 (83.9%) | 15 (3.3%) |
| Total | 441 (100.0%) | 462 (100.0%) |
Real Estate Taxes by Mortgage Status in Twin Lakes
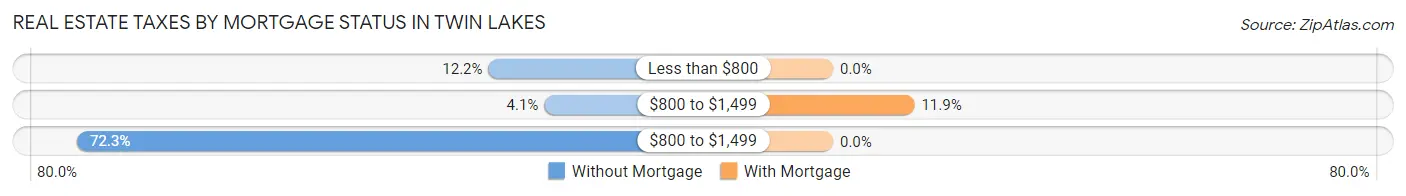
| Property Taxes | Without Mortgage | With Mortgage |
| Less than $800 | 54 (12.2%) | 0 (0.0%) |
| $800 to $1,499 | 18 (4.1%) | 55 (11.9%) |
| $800 to $1,499 | 319 (72.3%) | 0 (0.0%) |
| Total | 441 (100.0%) | 462 (100.0%) |
Health & Disability in Twin Lakes
Health Insurance Coverage by Age in Twin Lakes
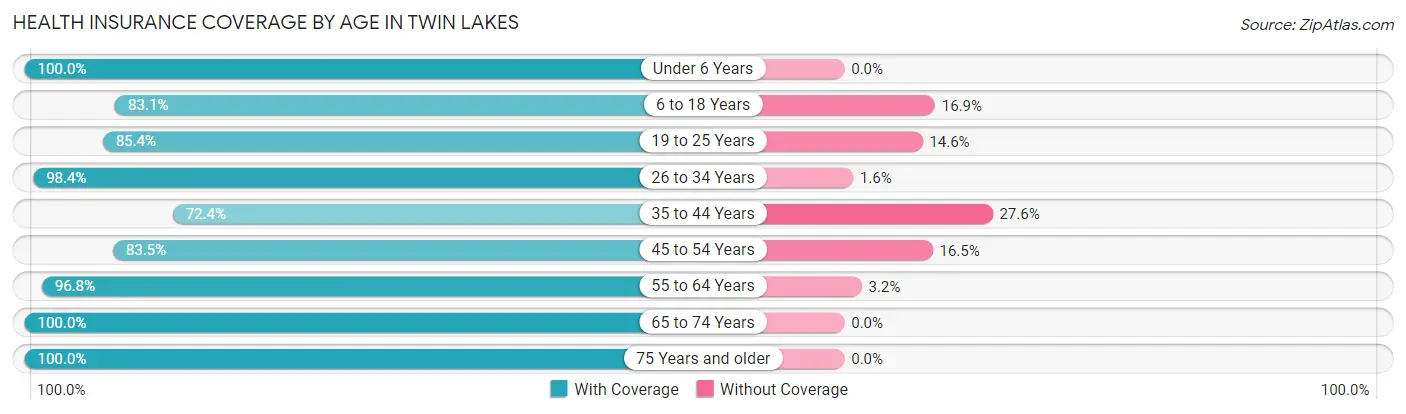
| Age Bracket | With Coverage | Without Coverage |
| Under 6 Years | 199 (100.0%) | 0 (0.0%) |
| 6 to 18 Years | 497 (83.1%) | 101 (16.9%) |
| 19 to 25 Years | 381 (85.4%) | 65 (14.6%) |
| 26 to 34 Years | 915 (98.4%) | 15 (1.6%) |
| 35 to 44 Years | 495 (72.4%) | 189 (27.6%) |
| 45 to 54 Years | 406 (83.5%) | 80 (16.5%) |
| 55 to 64 Years | 634 (96.8%) | 21 (3.2%) |
| 65 to 74 Years | 538 (100.0%) | 0 (0.0%) |
| 75 Years and older | 461 (100.0%) | 0 (0.0%) |
| Total | 4,526 (90.6%) | 471 (9.4%) |
Health Insurance Coverage by Citizenship Status in Twin Lakes
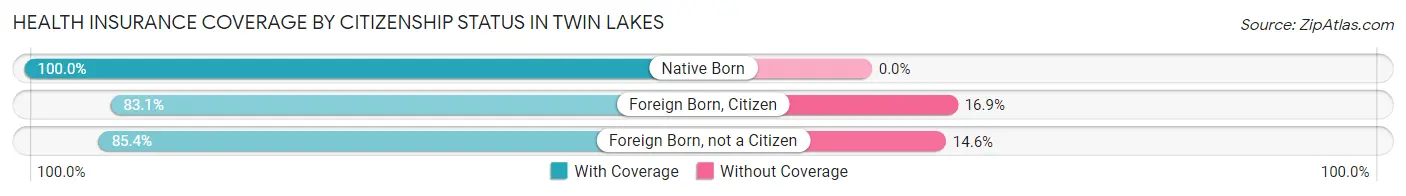
| Citizenship Status | With Coverage | Without Coverage |
| Native Born | 199 (100.0%) | 0 (0.0%) |
| Foreign Born, Citizen | 497 (83.1%) | 101 (16.9%) |
| Foreign Born, not a Citizen | 381 (85.4%) | 65 (14.6%) |
Health Insurance Coverage by Household Income in Twin Lakes
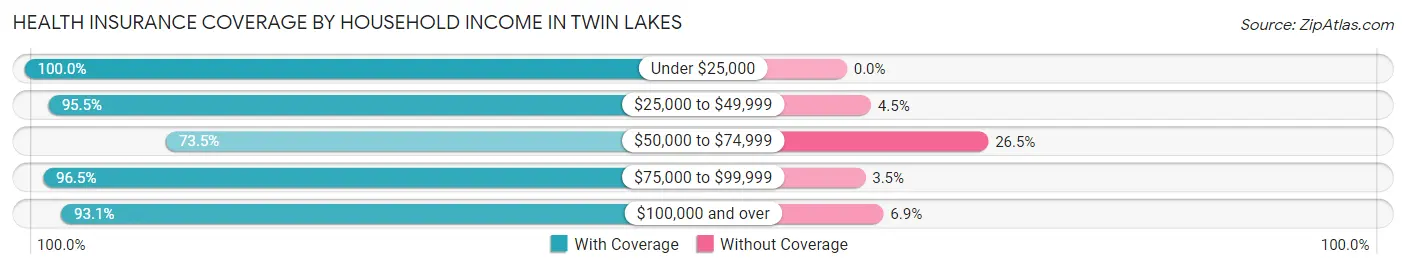
| Household Income | With Coverage | Without Coverage |
| Under $25,000 | 687 (100.0%) | 0 (0.0%) |
| $25,000 to $49,999 | 612 (95.5%) | 29 (4.5%) |
| $50,000 to $74,999 | 813 (73.5%) | 293 (26.5%) |
| $75,000 to $99,999 | 586 (96.5%) | 21 (3.5%) |
| $100,000 and over | 1,737 (93.1%) | 128 (6.9%) |
Public vs Private Health Insurance Coverage by Age in Twin Lakes
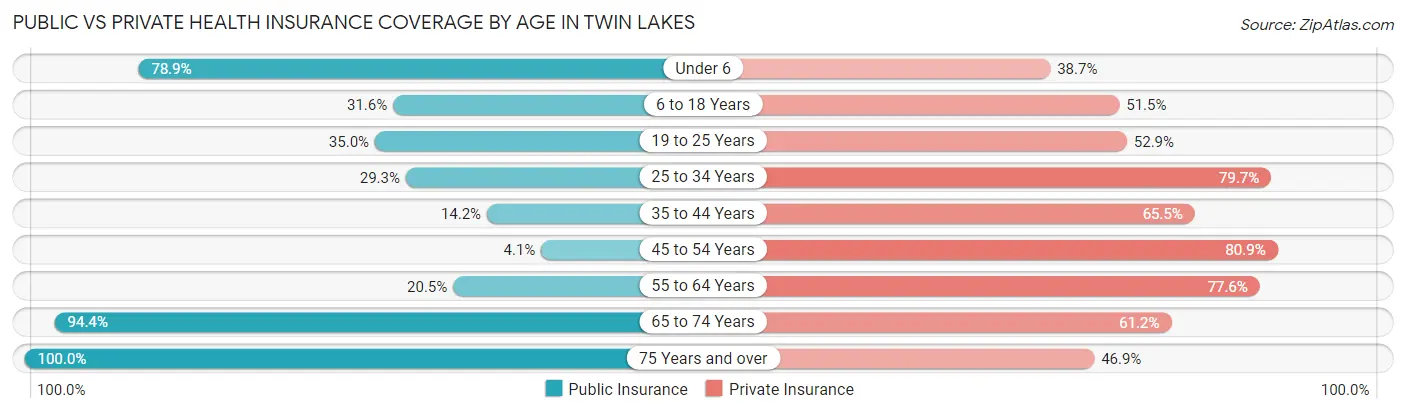
| Age Bracket | Public Insurance | Private Insurance |
| Under 6 | 157 (78.9%) | 77 (38.7%) |
| 6 to 18 Years | 189 (31.6%) | 308 (51.5%) |
| 19 to 25 Years | 156 (35.0%) | 236 (52.9%) |
| 25 to 34 Years | 272 (29.2%) | 741 (79.7%) |
| 35 to 44 Years | 97 (14.2%) | 448 (65.5%) |
| 45 to 54 Years | 20 (4.1%) | 393 (80.9%) |
| 55 to 64 Years | 134 (20.5%) | 508 (77.6%) |
| 65 to 74 Years | 508 (94.4%) | 329 (61.2%) |
| 75 Years and over | 461 (100.0%) | 216 (46.9%) |
| Total | 1,994 (39.9%) | 3,256 (65.2%) |
Disability Status by Sex by Age in Twin Lakes
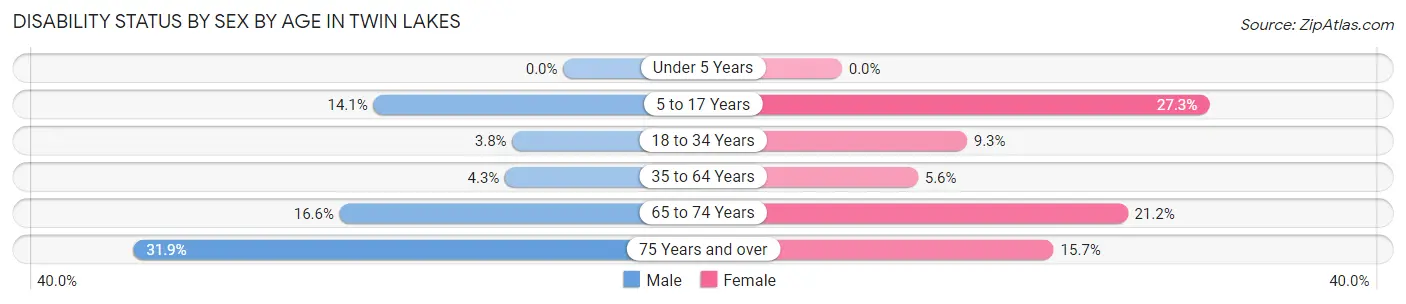
| Age Bracket | Male | Female |
| Under 5 Years | 0 (0.0%) | 0 (0.0%) |
| 5 to 17 Years | 42 (14.1%) | 81 (27.3%) |
| 18 to 34 Years | 22 (3.8%) | 76 (9.3%) |
| 35 to 64 Years | 39 (4.3%) | 52 (5.6%) |
| 65 to 74 Years | 40 (16.6%) | 63 (21.2%) |
| 75 Years and over | 68 (31.9%) | 39 (15.7%) |
Disability Class by Sex by Age in Twin Lakes
Disability Class: Hearing Difficulty
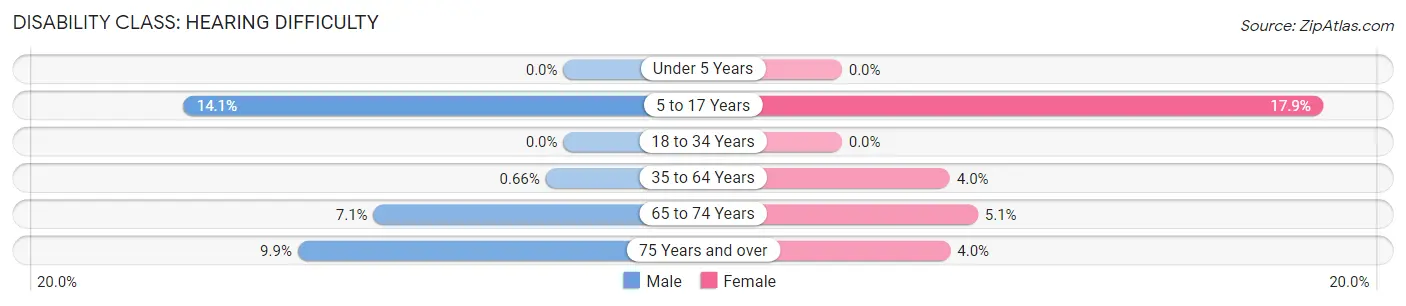
| Age Bracket | Male | Female |
| Under 5 Years | 0 (0.0%) | 0 (0.0%) |
| 5 to 17 Years | 42 (14.1%) | 53 (17.8%) |
| 18 to 34 Years | 0 (0.0%) | 0 (0.0%) |
| 35 to 64 Years | 6 (0.7%) | 37 (4.0%) |
| 65 to 74 Years | 17 (7.0%) | 15 (5.1%) |
| 75 Years and over | 21 (9.9%) | 10 (4.0%) |
Disability Class: Vision Difficulty
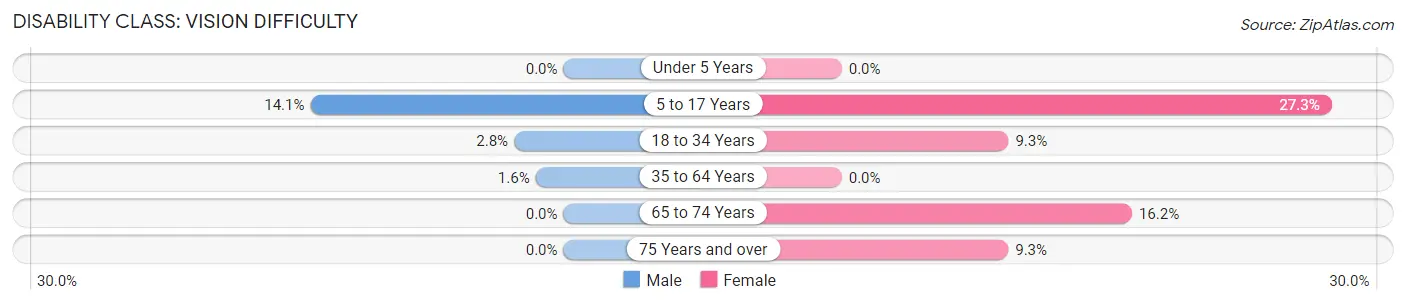
| Age Bracket | Male | Female |
| Under 5 Years | 0 (0.0%) | 0 (0.0%) |
| 5 to 17 Years | 42 (14.1%) | 81 (27.3%) |
| 18 to 34 Years | 16 (2.8%) | 76 (9.3%) |
| 35 to 64 Years | 14 (1.5%) | 0 (0.0%) |
| 65 to 74 Years | 0 (0.0%) | 48 (16.2%) |
| 75 Years and over | 0 (0.0%) | 23 (9.3%) |
Disability Class: Cognitive Difficulty
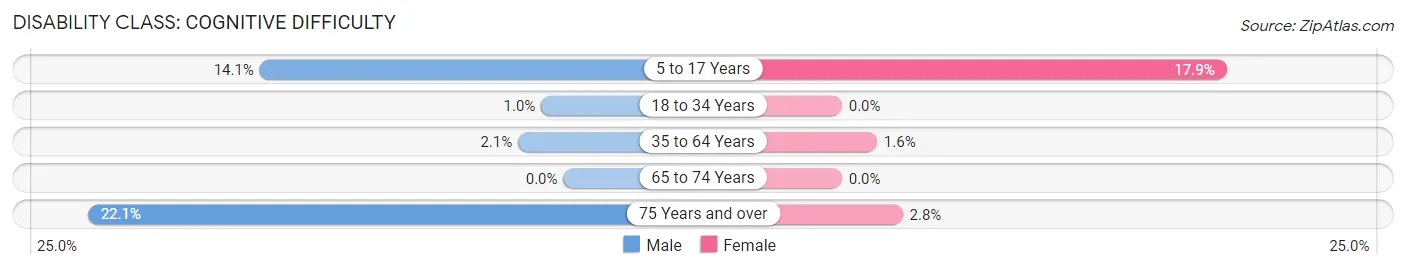
| Age Bracket | Male | Female |
| 5 to 17 Years | 42 (14.1%) | 53 (17.8%) |
| 18 to 34 Years | 6 (1.0%) | 0 (0.0%) |
| 35 to 64 Years | 19 (2.1%) | 15 (1.6%) |
| 65 to 74 Years | 0 (0.0%) | 0 (0.0%) |
| 75 Years and over | 47 (22.1%) | 7 (2.8%) |
Disability Class: Ambulatory Difficulty
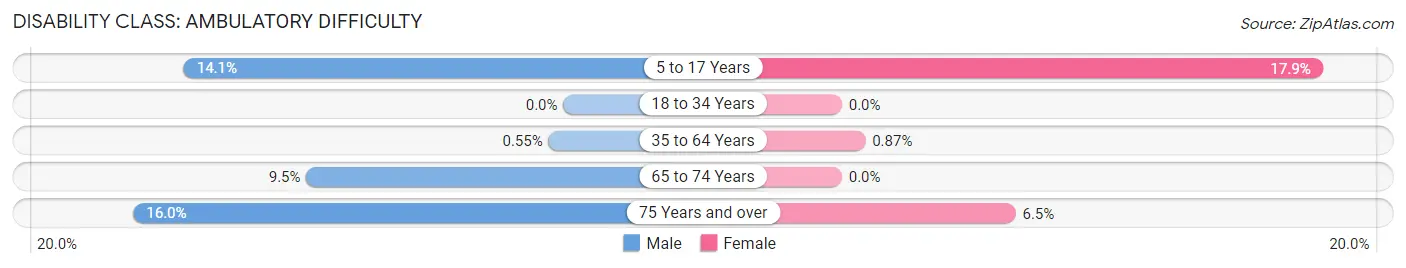
| Age Bracket | Male | Female |
| 5 to 17 Years | 42 (14.1%) | 53 (17.8%) |
| 18 to 34 Years | 0 (0.0%) | 0 (0.0%) |
| 35 to 64 Years | 5 (0.5%) | 8 (0.9%) |
| 65 to 74 Years | 23 (9.5%) | 0 (0.0%) |
| 75 Years and over | 34 (16.0%) | 16 (6.5%) |
Disability Class: Self-Care Difficulty
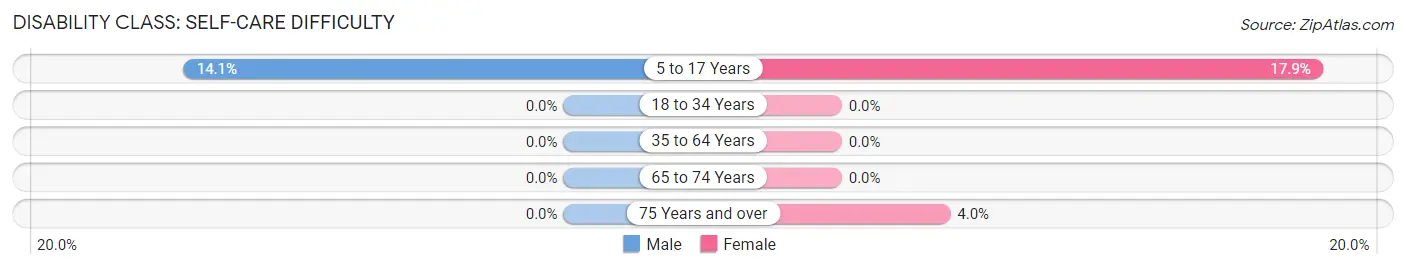
| Age Bracket | Male | Female |
| 5 to 17 Years | 42 (14.1%) | 53 (17.8%) |
| 18 to 34 Years | 0 (0.0%) | 0 (0.0%) |
| 35 to 64 Years | 0 (0.0%) | 0 (0.0%) |
| 65 to 74 Years | 0 (0.0%) | 0 (0.0%) |
| 75 Years and over | 0 (0.0%) | 10 (4.0%) |
Technology Access in Twin Lakes
Computing Device Access in Twin Lakes
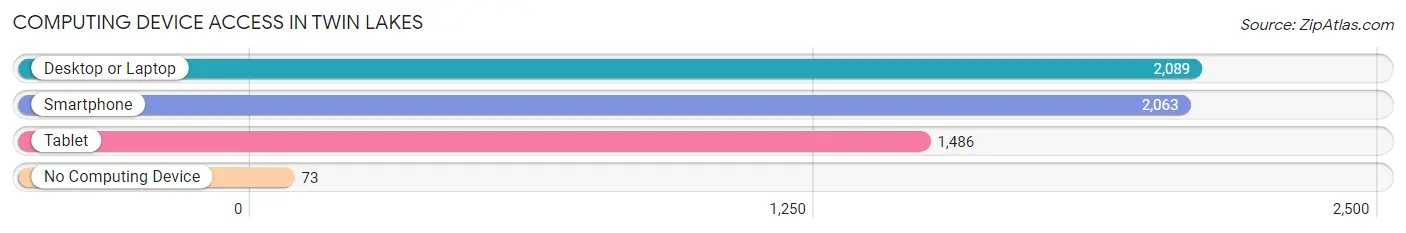
| Device Type | # Households | % Households |
| Desktop or Laptop | 2,089 | 87.6% |
| Smartphone | 2,063 | 86.5% |
| Tablet | 1,486 | 62.3% |
| No Computing Device | 73 | 3.1% |
| Total | 2,385 | 100.0% |
Internet Access in Twin Lakes
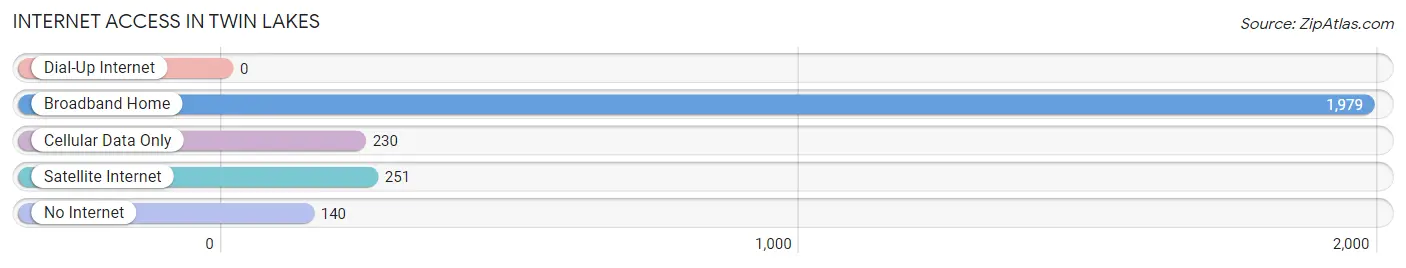
| Internet Type | # Households | % Households |
| Dial-Up Internet | 0 | 0.0% |
| Broadband Home | 1,979 | 83.0% |
| Cellular Data Only | 230 | 9.6% |
| Satellite Internet | 251 | 10.5% |
| No Internet | 140 | 5.9% |
| Total | 2,385 | 100.0% |
Twin Lakes Summary
Twin Lakes is a small unincorporated community located in the Sierra Nevada Mountains of California, in Mono County. It is situated at an elevation of 8,000 feet, and is surrounded by the Ansel Adams Wilderness and the John Muir Wilderness. The community is located on the eastern side of the Sierra Nevada, and is approximately 25 miles south of the town of Mammoth Lakes.
History
Twin Lakes was first settled in the late 1800s by miners and ranchers. The area was originally known as “Twin Lakes Station”, and was a stop on the stagecoach route between Mono County and Yosemite National Park. The area was also used as a summer campground for Native Americans, and was a popular destination for early settlers.
In the early 1900s, the area was developed as a resort community, and the Twin Lakes Resort was built. The resort included a hotel, cabins, a general store, and a post office. The resort was a popular destination for tourists, and was a popular spot for fishing, hunting, and camping.
In the 1950s, the resort was sold to the California Department of Fish and Game, and the area was developed as a state park. The park was later renamed the Twin Lakes State Park, and is still open to the public today.
Geography
Twin Lakes is located in the Sierra Nevada Mountains of California, in Mono County. It is situated at an elevation of 8,000 feet, and is surrounded by the Ansel Adams Wilderness and the John Muir Wilderness. The community is located on the eastern side of the Sierra Nevada, and is approximately 25 miles south of the town of Mammoth Lakes.
The area is characterized by its mountainous terrain, with peaks reaching up to 11,000 feet. The area is also home to numerous lakes, including Twin Lakes, Lake Mary, and Lake George. The area is also home to a variety of wildlife, including deer, bear, and mountain lions.
Economy
The economy of Twin Lakes is largely based on tourism. The area is a popular destination for hikers, campers, and fishermen, and the Twin Lakes State Park is a popular destination for visitors. The area is also home to a variety of businesses, including restaurants, lodging, and retail stores.
Demographics
As of the 2010 census, the population of Twin Lakes was 545. The population is largely white (93.3%), with a small percentage of Hispanic (3.3%) and Native American (1.8%) residents. The median household income is $45,000, and the median age is 44.
Twin Lakes is a small, rural community with a unique history and culture. The area is a popular destination for outdoor enthusiasts, and is home to a variety of businesses. The area is also home to a diverse population, and is a great place to live and work.
Common Questions
What is Per Capita Income in Twin Lakes?
Per Capita income in Twin Lakes is $55,434.
What is the Median Family Income in Twin Lakes?
Median Family Income in Twin Lakes is $72,346.
What is the Median Household income in Twin Lakes?
Median Household Income in Twin Lakes is $71,769.
What is Income or Wage Gap in Twin Lakes?
Income or Wage Gap in Twin Lakes is 19.9%.
Women in Twin Lakes earn 80.1 cents for every dollar earned by a man.
What is Inequality or Gini Index in Twin Lakes?
Inequality or Gini Index in Twin Lakes is 0.51.
What is the Total Population of Twin Lakes?
Total Population of Twin Lakes is 5,090.
What is the Total Male Population of Twin Lakes?
Total Male Population of Twin Lakes is 2,350.
What is the Total Female Population of Twin Lakes?
Total Female Population of Twin Lakes is 2,740.
What is the Ratio of Males per 100 Females in Twin Lakes?
There are 85.77 Males per 100 Females in Twin Lakes.
What is the Ratio of Females per 100 Males in Twin Lakes?
There are 116.60 Females per 100 Males in Twin Lakes.
What is the Median Population Age in Twin Lakes?
Median Population Age in Twin Lakes is 42.1 Years.
What is the Average Family Size in Twin Lakes
Average Family Size in Twin Lakes is 2.8 People.
What is the Average Household Size in Twin Lakes
Average Household Size in Twin Lakes is 2.1 People.
How Large is the Labor Force in Twin Lakes?
There are 2,836 People in the Labor Forcein in Twin Lakes.
What is the Percentage of People in the Labor Force in Twin Lakes?
64.4% of People are in the Labor Force in Twin Lakes.
What is the Unemployment Rate in Twin Lakes?
Unemployment Rate in Twin Lakes is 3.6%.