Cities with the Highest Percentage of Population with a Degree in Visual and Performing Arts in Utah
RELATED REPORTS & OPTIONS
Visual and Performing Arts
Utah
Compare Cities
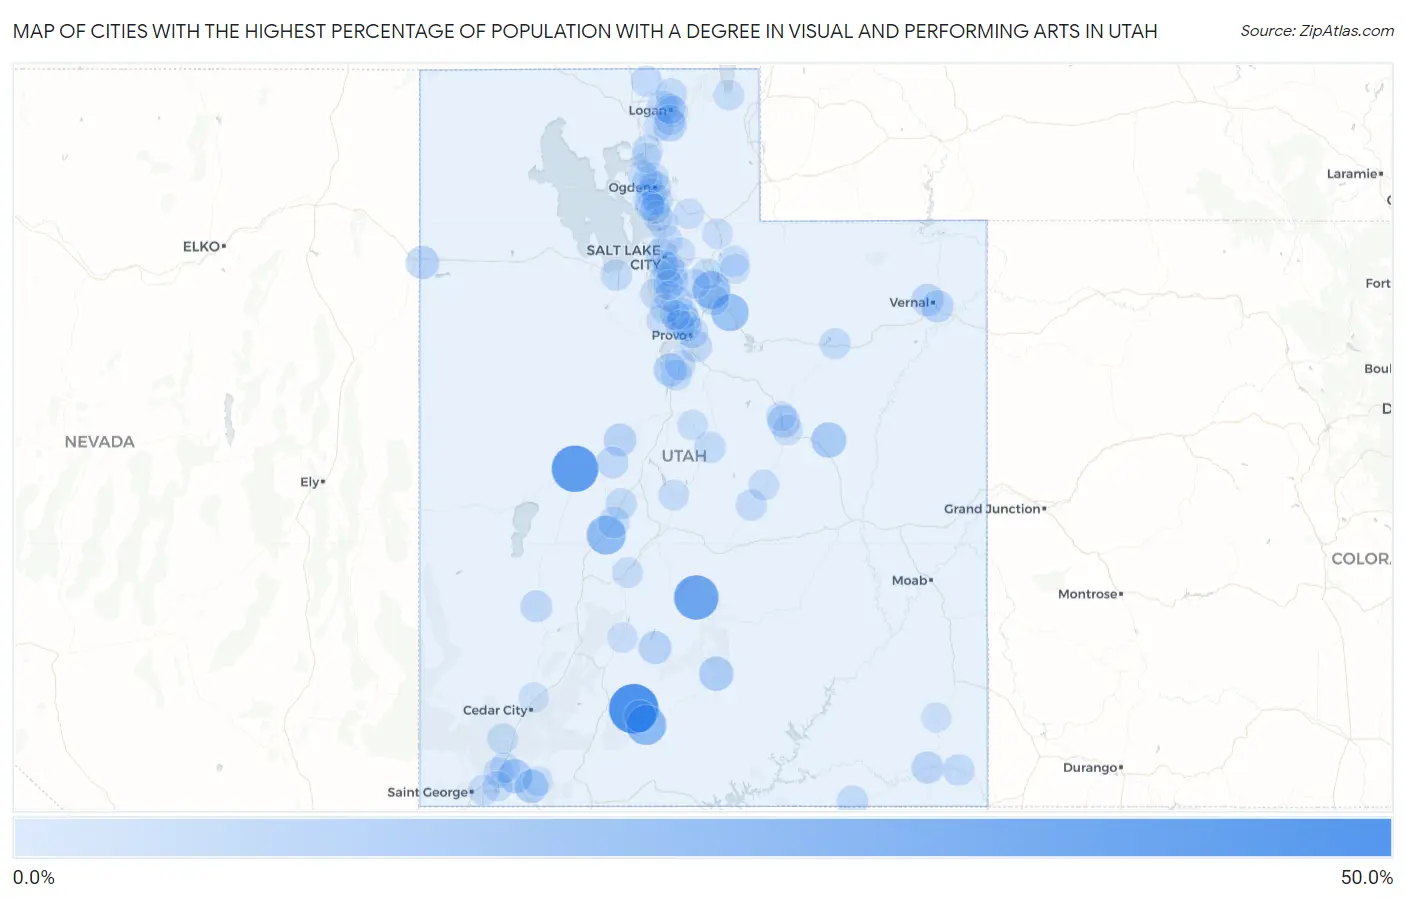
Map of Cities with the Highest Percentage of Population with a Degree in Visual and Performing Arts in Utah
0.0%
50.0%
Cities with the Highest Percentage of Population with a Degree in Visual and Performing Arts in Utah
| City | % Graduates | vs State | vs National | |
| 1. | Bryce Canyon City | 46.9% | 4.3%(+42.6)#1 | 4.3%(+42.6)#142 |
| 2. | Hinckley | 40.4% | 4.3%(+36.1)#2 | 4.3%(+36.1)#173 |
| 3. | Fremont | 35.3% | 4.3%(+31.0)#3 | 4.3%(+31.0)#224 |
| 4. | Cannonville | 25.0% | 4.3%(+20.7)#4 | 4.3%(+20.7)#430 |
| 5. | Meadow | 23.1% | 4.3%(+18.8)#5 | 4.3%(+18.8)#487 |
| 6. | Interlaken | 20.4% | 4.3%(+16.2)#6 | 4.3%(+16.2)#606 |
| 7. | Independence | 19.4% | 4.3%(+15.1)#7 | 4.3%(+15.1)#680 |
| 8. | Hobble Creek | 15.4% | 4.3%(+11.1)#8 | 4.3%(+11.1)#1,027 |
| 9. | East Carbon | 14.6% | 4.3%(+10.4)#9 | 4.3%(+10.4)#1,109 |
| 10. | Boulder | 12.9% | 4.3%(+8.65)#10 | 4.3%(+8.65)#1,358 |
| 11. | Virgin | 12.2% | 4.3%(+7.97)#11 | 4.3%(+7.97)#1,475 |
| 12. | Rockville | 11.4% | 4.3%(+7.11)#12 | 4.3%(+7.11)#1,643 |
| 13. | Wendover | 10.3% | 4.3%(+6.09)#13 | 4.3%(+6.09)#1,947 |
| 14. | Genola | 10.1% | 4.3%(+5.84)#14 | 4.3%(+5.84)#2,029 |
| 15. | Antimony | 10.0% | 4.3%(+5.75)#15 | 4.3%(+5.75)#2,081 |
| 16. | Hyrum | 9.6% | 4.3%(+5.38)#16 | 4.3%(+5.38)#2,201 |
| 17. | Leamington | 9.4% | 4.3%(+5.12)#17 | 4.3%(+5.12)#2,300 |
| 18. | Lindon | 9.2% | 4.3%(+4.98)#18 | 4.3%(+4.98)#2,345 |
| 19. | Spring Glen | 9.2% | 4.3%(+4.92)#19 | 4.3%(+4.92)#2,370 |
| 20. | Maeser | 8.8% | 4.3%(+4.56)#20 | 4.3%(+4.56)#2,550 |
| 21. | Tropic | 8.6% | 4.3%(+4.34)#21 | 4.3%(+4.34)#2,646 |
| 22. | Naples | 8.5% | 4.3%(+4.27)#22 | 4.3%(+4.27)#2,689 |
| 23. | Bluff | 8.2% | 4.3%(+3.97)#23 | 4.3%(+3.97)#2,861 |
| 24. | Ogden | 7.9% | 4.3%(+3.68)#24 | 4.3%(+3.68)#3,013 |
| 25. | White | 7.8% | 4.3%(+3.57)#25 | 4.3%(+3.57)#3,075 |
| 26. | Oak City | 7.5% | 4.3%(+3.21)#26 | 4.3%(+3.21)#3,313 |
| 27. | Milford | 7.4% | 4.3%(+3.12)#27 | 4.3%(+3.12)#3,385 |
| 28. | Springville | 7.3% | 4.3%(+3.04)#28 | 4.3%(+3.04)#3,453 |
| 29. | Spring City | 6.9% | 4.3%(+2.66)#29 | 4.3%(+2.66)#3,772 |
| 30. | Montezuma Creek | 6.9% | 4.3%(+2.64)#30 | 4.3%(+2.64)#3,791 |
| 31. | Fillmore | 6.8% | 4.3%(+2.58)#31 | 4.3%(+2.59)#3,846 |
| 32. | Salt Lake City | 6.7% | 4.3%(+2.47)#32 | 4.3%(+2.47)#3,982 |
| 33. | Provo | 6.7% | 4.3%(+2.43)#33 | 4.3%(+2.43)#4,016 |
| 34. | Oljato Monument Valley | 6.7% | 4.3%(+2.41)#34 | 4.3%(+2.41)#4,028 |
| 35. | Stansbury Park | 6.6% | 4.3%(+2.35)#35 | 4.3%(+2.35)#4,116 |
| 36. | Benson | 6.4% | 4.3%(+2.15)#36 | 4.3%(+2.16)#4,284 |
| 37. | Holden | 6.4% | 4.3%(+2.11)#37 | 4.3%(+2.11)#4,328 |
| 38. | Oakley | 6.2% | 4.3%(+1.95)#38 | 4.3%(+1.95)#4,506 |
| 39. | Ferron | 6.2% | 4.3%(+1.90)#39 | 4.3%(+1.90)#4,535 |
| 40. | Clarkston | 6.1% | 4.3%(+1.89)#40 | 4.3%(+1.89)#4,551 |
| 41. | Cottonwood Heights | 6.1% | 4.3%(+1.83)#41 | 4.3%(+1.83)#4,619 |
| 42. | Santaquin | 6.0% | 4.3%(+1.79)#42 | 4.3%(+1.80)#4,673 |
| 43. | Sunset | 6.0% | 4.3%(+1.77)#43 | 4.3%(+1.77)#4,690 |
| 44. | Pleasant Grove | 6.0% | 4.3%(+1.75)#44 | 4.3%(+1.75)#4,717 |
| 45. | Marriott Slaterville | 5.9% | 4.3%(+1.67)#45 | 4.3%(+1.67)#4,789 |
| 46. | Duchesne | 5.9% | 4.3%(+1.63)#46 | 4.3%(+1.63)#4,834 |
| 47. | Washington | 5.8% | 4.3%(+1.52)#47 | 4.3%(+1.52)#4,971 |
| 48. | Smithfield | 5.8% | 4.3%(+1.50)#48 | 4.3%(+1.50)#4,998 |
| 49. | River Heights | 5.7% | 4.3%(+1.49)#49 | 4.3%(+1.49)#5,013 |
| 50. | Payson | 5.7% | 4.3%(+1.44)#50 | 4.3%(+1.44)#5,078 |
| 51. | Midvale | 5.6% | 4.3%(+1.39)#51 | 4.3%(+1.39)#5,133 |
| 52. | Charleston | 5.6% | 4.3%(+1.30)#52 | 4.3%(+1.30)#5,241 |
| 53. | Riverdale | 5.5% | 4.3%(+1.22)#53 | 4.3%(+1.22)#5,341 |
| 54. | Millcreek | 5.4% | 4.3%(+1.16)#54 | 4.3%(+1.16)#5,418 |
| 55. | Park City | 5.4% | 4.3%(+1.10)#55 | 4.3%(+1.10)#5,515 |
| 56. | Castle Dale | 5.3% | 4.3%(+1.03)#56 | 4.3%(+1.03)#5,588 |
| 57. | South Weber | 5.2% | 4.3%(+0.957)#57 | 4.3%(+0.958)#5,696 |
| 58. | Alpine | 5.1% | 4.3%(+0.852)#58 | 4.3%(+0.853)#5,839 |
| 59. | Orem | 5.1% | 4.3%(+0.812)#59 | 4.3%(+0.813)#5,902 |
| 60. | New Harmony | 5.1% | 4.3%(+0.797)#60 | 4.3%(+0.798)#5,927 |
| 61. | Joseph | 5.0% | 4.3%(+0.747)#61 | 4.3%(+0.748)#6,002 |
| 62. | Gunnison | 5.0% | 4.3%(+0.722)#62 | 4.3%(+0.723)#6,042 |
| 63. | Riverton | 4.9% | 4.3%(+0.660)#63 | 4.3%(+0.661)#6,142 |
| 64. | Laketown | 4.9% | 4.3%(+0.649)#64 | 4.3%(+0.650)#6,168 |
| 65. | Farmington | 4.9% | 4.3%(+0.624)#65 | 4.3%(+0.625)#6,220 |
| 66. | Leeds | 4.8% | 4.3%(+0.586)#66 | 4.3%(+0.587)#6,278 |
| 67. | Morgan | 4.8% | 4.3%(+0.558)#67 | 4.3%(+0.559)#6,332 |
| 68. | Toquerville | 4.8% | 4.3%(+0.557)#68 | 4.3%(+0.558)#6,333 |
| 69. | Coalville | 4.8% | 4.3%(+0.532)#69 | 4.3%(+0.533)#6,375 |
| 70. | Price | 4.8% | 4.3%(+0.498)#70 | 4.3%(+0.499)#6,450 |
| 71. | Holladay | 4.7% | 4.3%(+0.453)#71 | 4.3%(+0.454)#6,517 |
| 72. | Bountiful | 4.6% | 4.3%(+0.388)#72 | 4.3%(+0.389)#6,645 |
| 73. | Saratoga Springs | 4.6% | 4.3%(+0.381)#73 | 4.3%(+0.382)#6,655 |
| 74. | Draper | 4.6% | 4.3%(+0.374)#74 | 4.3%(+0.375)#6,665 |
| 75. | Perry | 4.6% | 4.3%(+0.373)#75 | 4.3%(+0.374)#6,669 |
| 76. | Wellsville | 4.6% | 4.3%(+0.302)#76 | 4.3%(+0.303)#6,801 |
| 77. | Circleville | 4.5% | 4.3%(+0.241)#77 | 4.3%(+0.242)#6,920 |
| 78. | Nibley | 4.5% | 4.3%(+0.213)#78 | 4.3%(+0.214)#6,973 |
| 79. | Alta | 4.4% | 4.3%(+0.191)#79 | 4.3%(+0.192)#7,017 |
| 80. | East Basin | 4.4% | 4.3%(+0.187)#80 | 4.3%(+0.188)#7,028 |
| 81. | Logan | 4.3% | 4.3%(+0.055)#81 | 4.3%(+0.056)#7,285 |
| 82. | Kaysville | 4.3% | 4.3%(+0.032)#82 | 4.3%(+0.033)#7,334 |
| 83. | Hurricane | 4.3% | 4.3%(+0.017)#83 | 4.3%(+0.018)#7,368 |
| 84. | Fountain Green | 4.3% | 4.3%(+0.012)#84 | 4.3%(+0.013)#7,375 |
| 85. | Emigration Canyon | 4.2% | 4.3%(-0.081)#85 | 4.3%(-0.080)#7,557 |
| 86. | Layton | 4.1% | 4.3%(-0.115)#86 | 4.3%(-0.114)#7,635 |
| 87. | Enoch | 4.1% | 4.3%(-0.190)#87 | 4.3%(-0.189)#7,793 |
| 88. | Vineyard | 4.0% | 4.3%(-0.203)#88 | 4.3%(-0.202)#7,820 |
| 89. | Helper | 4.0% | 4.3%(-0.281)#89 | 4.3%(-0.280)#7,988 |
| 90. | Lehi | 3.9% | 4.3%(-0.307)#90 | 4.3%(-0.306)#8,040 |
| 91. | Harrisville | 3.9% | 4.3%(-0.331)#91 | 4.3%(-0.331)#8,090 |
| 92. | Sandy | 3.9% | 4.3%(-0.343)#92 | 4.3%(-0.342)#8,136 |
| 93. | Blanding | 3.9% | 4.3%(-0.347)#93 | 4.3%(-0.346)#8,144 |
| 94. | American Fork | 3.9% | 4.3%(-0.357)#94 | 4.3%(-0.356)#8,173 |
| 95. | Plain City | 3.9% | 4.3%(-0.390)#95 | 4.3%(-0.389)#8,240 |
| 96. | South Salt Lake | 3.8% | 4.3%(-0.410)#96 | 4.3%(-0.409)#8,308 |
| 97. | Willard | 3.8% | 4.3%(-0.436)#97 | 4.3%(-0.435)#8,363 |
| 98. | Marion | 3.8% | 4.3%(-0.449)#98 | 4.3%(-0.448)#8,388 |
| 99. | Clearfield | 3.8% | 4.3%(-0.478)#99 | 4.3%(-0.477)#8,441 |
| 100. | Springdale | 3.8% | 4.3%(-0.479)#100 | 4.3%(-0.479)#8,448 |
Common Questions
What are the Top 10 Cities with the Highest Percentage of Population with a Degree in Visual and Performing Arts in Utah?
Top 10 Cities with the Highest Percentage of Population with a Degree in Visual and Performing Arts in Utah are:
#1
46.9%
#2
40.4%
#3
35.3%
#4
25.0%
#5
23.1%
#6
20.4%
#7
19.4%
#8
14.6%
#9
12.9%
#10
12.2%
What city has the Highest Percentage of Population with a Degree in Visual and Performing Arts in Utah?
Bryce Canyon City has the Highest Percentage of Population with a Degree in Visual and Performing Arts in Utah with 46.9%.
What is the Percentage of Population with a Degree in Visual and Performing Arts in the State of Utah?
Percentage of Population with a Degree in Visual and Performing Arts in Utah is 4.3%.
What is the Percentage of Population with a Degree in Visual and Performing Arts in the United States?
Percentage of Population with a Degree in Visual and Performing Arts in the United States is 4.3%.