Cities with the Highest Percentage of Population with a Degree in Visual and Performing Arts in Arkansas
RELATED REPORTS & OPTIONS
Visual and Performing Arts
Arkansas
Compare Cities
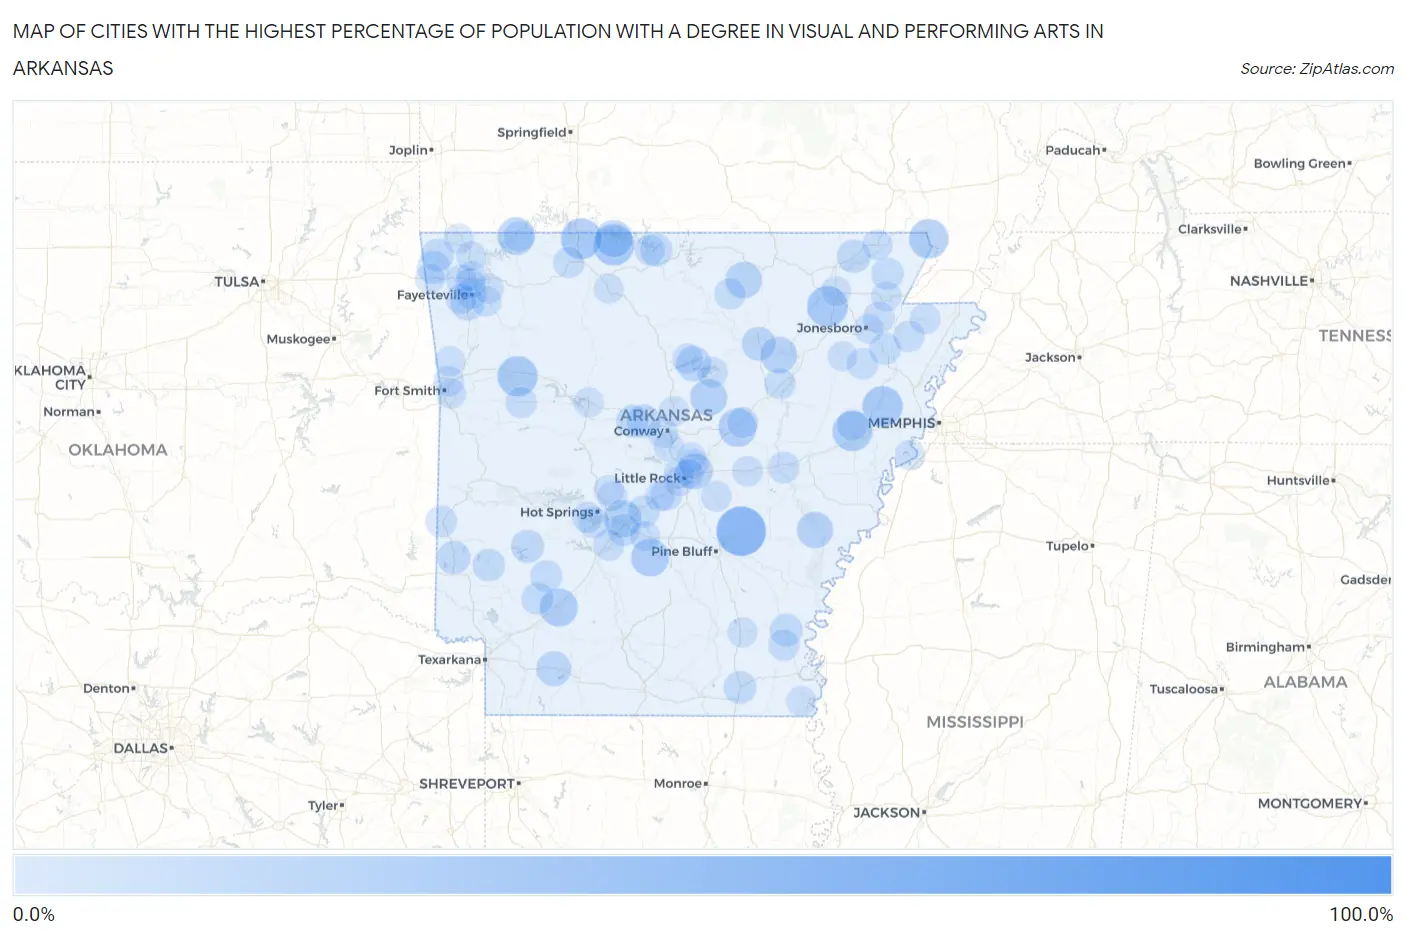
Map of Cities with the Highest Percentage of Population with a Degree in Visual and Performing Arts in Arkansas
0.0%
100.0%
Cities with the Highest Percentage of Population with a Degree in Visual and Performing Arts in Arkansas
| City | % Graduates | vs State | vs National | |
| 1. | Summers | 100.0% | 3.1%(+96.9)#1 | 4.3%(+95.7)#11 |
| 2. | Bismarck | 100.0% | 3.1%(+96.9)#2 | 4.3%(+95.7)#26 |
| 3. | Wabbaseka | 50.0% | 3.1%(+46.9)#3 | 4.3%(+45.7)#110 |
| 4. | Lead Hill | 28.6% | 3.1%(+25.5)#4 | 4.3%(+24.3)#337 |
| 5. | Omaha | 28.6% | 3.1%(+25.5)#5 | 4.3%(+24.3)#344 |
| 6. | Minturn | 28.6% | 3.1%(+25.5)#6 | 4.3%(+24.3)#347 |
| 7. | Parkin | 27.3% | 3.1%(+24.2)#7 | 4.3%(+23.0)#368 |
| 8. | Wiederkehr Village | 27.3% | 3.1%(+24.2)#8 | 4.3%(+23.0)#374 |
| 9. | Caldwell | 26.3% | 3.1%(+23.2)#9 | 4.3%(+22.1)#391 |
| 10. | St Francis | 25.0% | 3.1%(+21.9)#10 | 4.3%(+20.7)#431 |
| 11. | Mcrae | 22.9% | 3.1%(+19.8)#11 | 4.3%(+18.6)#492 |
| 12. | Prescott | 22.5% | 3.1%(+19.4)#12 | 4.3%(+18.2)#502 |
| 13. | Leola | 21.7% | 3.1%(+18.7)#13 | 4.3%(+17.5)#539 |
| 14. | Beaver | 21.1% | 3.1%(+18.0)#14 | 4.3%(+16.8)#574 |
| 15. | Magnet Cove | 20.6% | 3.1%(+17.5)#15 | 4.3%(+16.4)#593 |
| 16. | Diamond City | 20.2% | 3.1%(+17.1)#16 | 4.3%(+16.0)#616 |
| 17. | Rose Bud | 19.5% | 3.1%(+16.4)#17 | 4.3%(+15.2)#671 |
| 18. | St Charles | 18.2% | 3.1%(+15.1)#18 | 4.3%(+13.9)#764 |
| 19. | Oil Trough | 18.2% | 3.1%(+15.1)#19 | 4.3%(+13.9)#765 |
| 20. | Franklin | 18.2% | 3.1%(+15.1)#20 | 4.3%(+13.9)#769 |
| 21. | Mcalmont | 16.7% | 3.1%(+13.6)#21 | 4.3%(+12.4)#867 |
| 22. | Higden | 15.2% | 3.1%(+12.1)#22 | 4.3%(+10.9)#1,044 |
| 23. | Buckner | 14.8% | 3.1%(+11.7)#23 | 4.3%(+10.6)#1,084 |
| 24. | Southside | 12.2% | 3.1%(+9.18)#24 | 4.3%(+8.00)#1,466 |
| 25. | Plumerville | 11.9% | 3.1%(+8.83)#25 | 4.3%(+7.65)#1,540 |
| 26. | Greenland | 11.7% | 3.1%(+8.62)#26 | 4.3%(+7.44)#1,589 |
| 27. | Biggers | 11.1% | 3.1%(+8.04)#27 | 4.3%(+6.86)#1,702 |
| 28. | Gillham | 11.1% | 3.1%(+8.04)#28 | 4.3%(+6.86)#1,716 |
| 29. | Kirby | 10.5% | 3.1%(+7.45)#29 | 4.3%(+6.27)#1,891 |
| 30. | Gentry | 10.4% | 3.1%(+7.31)#30 | 4.3%(+6.13)#1,935 |
| 31. | Mcgehee | 9.5% | 3.1%(+6.48)#31 | 4.3%(+5.30)#2,224 |
| 32. | Hamburg | 9.5% | 3.1%(+6.47)#32 | 4.3%(+5.29)#2,225 |
| 33. | Morrilton | 9.5% | 3.1%(+6.42)#33 | 4.3%(+5.25)#2,251 |
| 34. | Decatur | 9.2% | 3.1%(+6.14)#34 | 4.3%(+4.96)#2,353 |
| 35. | Lakeview | 9.2% | 3.1%(+6.14)#35 | 4.3%(+4.96)#2,354 |
| 36. | Dierks | 9.0% | 3.1%(+5.94)#36 | 4.3%(+4.76)#2,446 |
| 37. | Lafe | 8.7% | 3.1%(+5.62)#37 | 4.3%(+4.44)#2,606 |
| 38. | Malvern | 8.6% | 3.1%(+5.52)#38 | 4.3%(+4.34)#2,644 |
| 39. | Blevins | 8.1% | 3.1%(+5.03)#39 | 4.3%(+3.86)#2,912 |
| 40. | Delight | 8.0% | 3.1%(+4.93)#40 | 4.3%(+3.75)#2,974 |
| 41. | Haskell | 7.3% | 3.1%(+4.23)#41 | 4.3%(+3.05)#3,446 |
| 42. | Trumann | 7.3% | 3.1%(+4.18)#42 | 4.3%(+3.00)#3,484 |
| 43. | Fredonia Biscoe | 7.1% | 3.1%(+4.07)#43 | 4.3%(+2.89)#3,598 |
| 44. | Brookland | 6.7% | 3.1%(+3.68)#44 | 4.3%(+2.50)#3,954 |
| 45. | Dermott | 6.5% | 3.1%(+3.43)#45 | 4.3%(+2.25)#4,198 |
| 46. | Cove | 6.5% | 3.1%(+3.38)#46 | 4.3%(+2.20)#4,241 |
| 47. | Harrisburg | 6.4% | 3.1%(+3.33)#47 | 4.3%(+2.15)#4,288 |
| 48. | Caraway | 6.3% | 3.1%(+3.24)#48 | 4.3%(+2.06)#4,375 |
| 49. | Alexander | 6.3% | 3.1%(+3.22)#49 | 4.3%(+2.04)#4,393 |
| 50. | Paris | 6.1% | 3.1%(+3.07)#50 | 4.3%(+1.90)#4,541 |
| 51. | Midway | 6.1% | 3.1%(+3.02)#51 | 4.3%(+1.85)#4,597 |
| 52. | Bradford | 5.9% | 3.1%(+2.81)#52 | 4.3%(+1.63)#4,841 |
| 53. | Lake Hamilton | 5.8% | 3.1%(+2.75)#53 | 4.3%(+1.57)#4,922 |
| 54. | Rockwell | 5.8% | 3.1%(+2.74)#54 | 4.3%(+1.56)#4,924 |
| 55. | Alpena | 5.7% | 3.1%(+2.64)#55 | 4.3%(+1.46)#5,052 |
| 56. | Melbourne | 5.6% | 3.1%(+2.48)#56 | 4.3%(+1.30)#5,223 |
| 57. | Colt | 5.6% | 3.1%(+2.48)#57 | 4.3%(+1.30)#5,240 |
| 58. | Tontitown | 5.3% | 3.1%(+2.22)#58 | 4.3%(+1.04)#5,573 |
| 59. | Garner | 5.3% | 3.1%(+2.19)#59 | 4.3%(+1.01)#5,637 |
| 60. | Fayetteville | 5.2% | 3.1%(+2.12)#60 | 4.3%(+0.939)#5,722 |
| 61. | Heber Springs | 4.9% | 3.1%(+1.80)#61 | 4.3%(+0.623)#6,222 |
| 62. | Manila | 4.9% | 3.1%(+1.79)#62 | 4.3%(+0.609)#6,242 |
| 63. | Carlisle | 4.8% | 3.1%(+1.76)#63 | 4.3%(+0.581)#6,293 |
| 64. | Conway | 4.8% | 3.1%(+1.75)#64 | 4.3%(+0.567)#6,314 |
| 65. | Johnson | 4.8% | 3.1%(+1.70)#65 | 4.3%(+0.522)#6,391 |
| 66. | Elkins | 4.6% | 3.1%(+1.57)#66 | 4.3%(+0.391)#6,643 |
| 67. | Keo | 4.6% | 3.1%(+1.54)#67 | 4.3%(+0.363)#6,689 |
| 68. | Farmington | 4.5% | 3.1%(+1.42)#68 | 4.3%(+0.238)#6,930 |
| 69. | Holiday Island | 4.4% | 3.1%(+1.37)#69 | 4.3%(+0.196)#7,004 |
| 70. | Bull Shoals | 4.4% | 3.1%(+1.37)#70 | 4.3%(+0.192)#7,008 |
| 71. | Van Buren | 4.3% | 3.1%(+1.27)#71 | 4.3%(+0.088)#7,220 |
| 72. | Cammack Village | 4.3% | 3.1%(+1.21)#72 | 4.3%(+0.034)#7,329 |
| 73. | Poyen | 4.3% | 3.1%(+1.18)#73 | 4.3%(+0.003)#7,403 |
| 74. | Fairfield Bay | 4.2% | 3.1%(+1.13)#74 | 4.3%(-0.053)#7,502 |
| 75. | Horseshoe Lake | 4.2% | 3.1%(+1.09)#75 | 4.3%(-0.085)#7,580 |
| 76. | Corning | 4.1% | 3.1%(+1.00)#76 | 4.3%(-0.174)#7,770 |
| 77. | Bryant | 4.0% | 3.1%(+0.934)#77 | 4.3%(-0.245)#7,909 |
| 78. | Paragould | 3.9% | 3.1%(+0.849)#78 | 4.3%(-0.330)#8,089 |
| 79. | Bella Vista | 3.8% | 3.1%(+0.766)#79 | 4.3%(-0.413)#8,319 |
| 80. | Mayflower | 3.8% | 3.1%(+0.744)#80 | 4.3%(-0.435)#8,361 |
| 81. | Cedarville | 3.8% | 3.1%(+0.744)#81 | 4.3%(-0.435)#8,364 |
| 82. | Springdale | 3.8% | 3.1%(+0.733)#82 | 4.3%(-0.446)#8,381 |
| 83. | Little Rock | 3.7% | 3.1%(+0.650)#83 | 4.3%(-0.529)#8,541 |
| 84. | Hot Springs Village | 3.7% | 3.1%(+0.579)#84 | 4.3%(-0.600)#8,702 |
| 85. | Greenbrier | 3.6% | 3.1%(+0.556)#85 | 4.3%(-0.623)#8,759 |
| 86. | Fountain Lake | 3.6% | 3.1%(+0.498)#86 | 4.3%(-0.681)#8,888 |
| 87. | Russellville | 3.6% | 3.1%(+0.485)#87 | 4.3%(-0.694)#8,933 |
| 88. | Rogers | 3.5% | 3.1%(+0.430)#88 | 4.3%(-0.749)#9,074 |
| 89. | Monticello | 3.4% | 3.1%(+0.349)#89 | 4.3%(-0.830)#9,261 |
| 90. | Goshen | 3.4% | 3.1%(+0.314)#90 | 4.3%(-0.865)#9,361 |
| 91. | Western Grove | 3.3% | 3.1%(+0.260)#91 | 4.3%(-0.919)#9,511 |
| 92. | Gibson | 3.3% | 3.1%(+0.255)#92 | 4.3%(-0.924)#9,531 |
| 93. | Jonesboro | 3.3% | 3.1%(+0.250)#93 | 4.3%(-0.929)#9,539 |
| 94. | Eudora | 3.3% | 3.1%(+0.206)#94 | 4.3%(-0.973)#9,639 |
| 95. | Siloam Springs | 3.3% | 3.1%(+0.185)#95 | 4.3%(-0.994)#9,702 |
| 96. | Sherwood | 3.2% | 3.1%(+0.152)#96 | 4.3%(-1.03)#9,788 |
| 97. | Walnut Ridge | 3.2% | 3.1%(+0.095)#97 | 4.3%(-1.08)#9,916 |
| 98. | Weiner | 3.2% | 3.1%(+0.085)#98 | 4.3%(-1.09)#9,946 |
| 99. | North Little Rock | 3.2% | 3.1%(+0.080)#99 | 4.3%(-1.10)#9,961 |
| 100. | Fort Smith | 3.1% | 3.1%(+0.058)#100 | 4.3%(-1.12)#10,010 |
Common Questions
What are the Top 10 Cities with the Highest Percentage of Population with a Degree in Visual and Performing Arts in Arkansas?
Top 10 Cities with the Highest Percentage of Population with a Degree in Visual and Performing Arts in Arkansas are:
#1
50.0%
#2
28.6%
#3
28.6%
#4
28.6%
#5
27.3%
#6
27.3%
#7
26.3%
#8
25.0%
#9
22.9%
#10
22.5%
What city has the Highest Percentage of Population with a Degree in Visual and Performing Arts in Arkansas?
Wabbaseka has the Highest Percentage of Population with a Degree in Visual and Performing Arts in Arkansas with 50.0%.
What is the Percentage of Population with a Degree in Visual and Performing Arts in the State of Arkansas?
Percentage of Population with a Degree in Visual and Performing Arts in Arkansas is 3.1%.
What is the Percentage of Population with a Degree in Visual and Performing Arts in the United States?
Percentage of Population with a Degree in Visual and Performing Arts in the United States is 4.3%.