Mesa Vista, CA Map & Demographics
Mesa Vista Map
Mesa Vista Overview
$79,559
PER CAPITA INCOME
$123,750
AVG FAMILY INCOME
$132,500
AVG HOUSEHOLD INCOME
0.47
INEQUALITY / GINI INDEX
246
TOTAL POPULATION
127
MALE POPULATION
119
FEMALE POPULATION
106.72
MALES / 100 FEMALES
93.70
FEMALES / 100 MALES
46.5
MEDIAN AGE
4.4
AVG FAMILY SIZE
3.7
AVG HOUSEHOLD SIZE
140
LABOR FORCE [ PEOPLE ]
66.4%
PERCENT IN LABOR FORCE
3.6%
UNEMPLOYMENT RATE
Income in Mesa Vista
Income Overview in Mesa Vista
Per Capita Income in Mesa Vista is $79,559, while median incomes of families and households are $123,750 and $132,500 respectively.
| Characteristic | Number | Measure |
| Per Capita Income | 246 | $79,559 |
| Median Family Income | 51 | $123,750 |
| Mean Family Income | 51 | $155,543 |
| Median Household Income | 66 | $132,500 |
| Mean Household Income | 66 | $194,665 |
| Income Deficit | 51 | $0 |
| Wage / Income Gap (%) | 246 | 0.00% |
| Wage / Income Gap ($) | 246 | 100.00¢ per $1 |
| Gini / Inequality Index | 246 | 0.47 |
Earnings by Sex in Mesa Vista
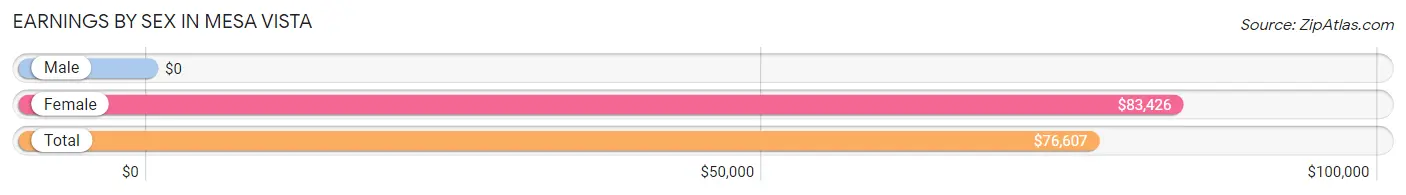
| Sex | Number | Average Earnings |
| Male | 83 (61.5%) | $0 |
| Female | 52 (38.5%) | $83,426 |
| Total | 135 (100.0%) | $76,607 |
Earnings by Sex by Income Bracket in Mesa Vista
The most common earnings brackets in Mesa Vista are $2,499 or less for men (25 | 30.1%) and $75,000 to $99,999 for women (36 | 69.2%).
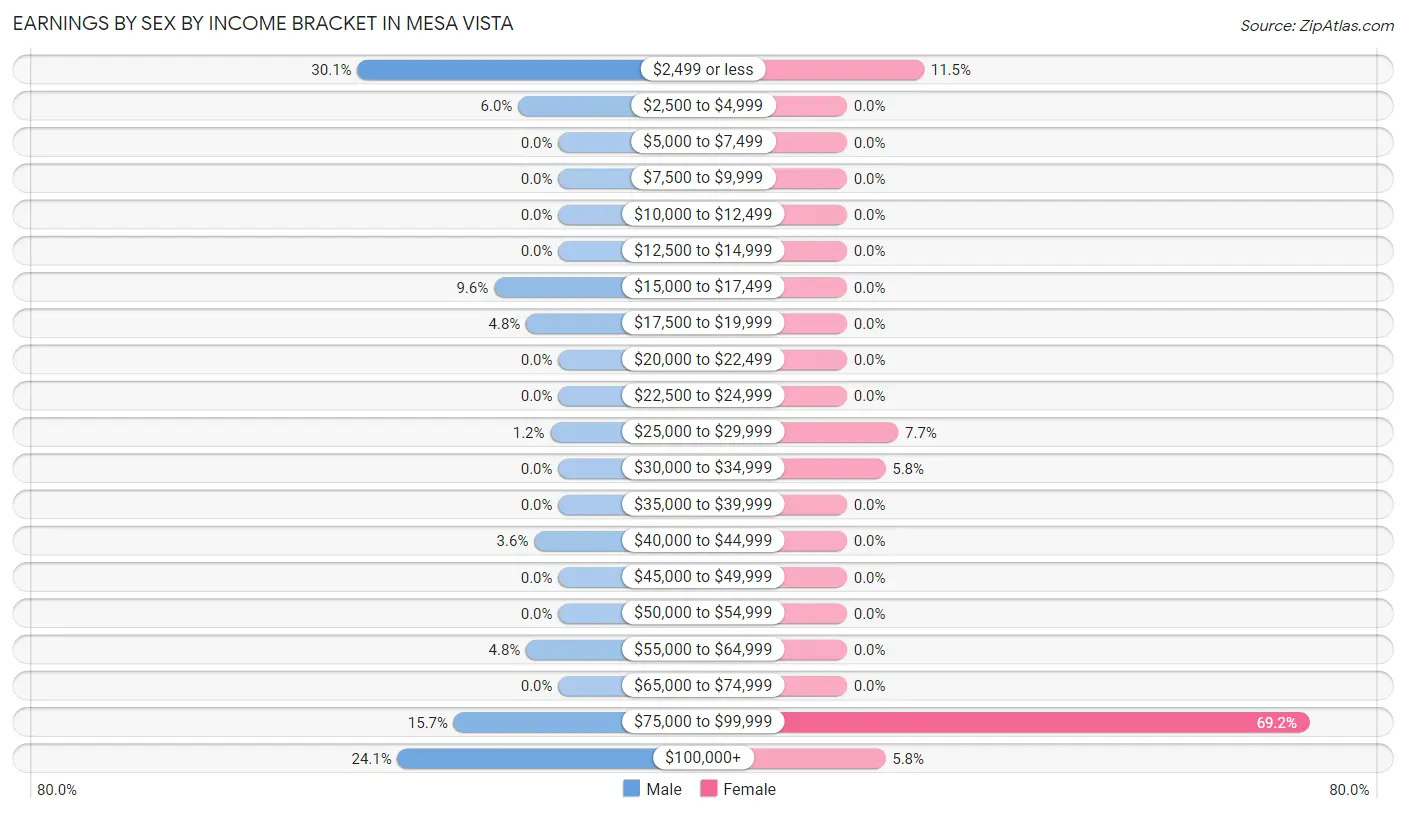
| Income | Male | Female |
| $2,499 or less | 25 (30.1%) | 6 (11.5%) |
| $2,500 to $4,999 | 5 (6.0%) | 0 (0.0%) |
| $5,000 to $7,499 | 0 (0.0%) | 0 (0.0%) |
| $7,500 to $9,999 | 0 (0.0%) | 0 (0.0%) |
| $10,000 to $12,499 | 0 (0.0%) | 0 (0.0%) |
| $12,500 to $14,999 | 0 (0.0%) | 0 (0.0%) |
| $15,000 to $17,499 | 8 (9.6%) | 0 (0.0%) |
| $17,500 to $19,999 | 4 (4.8%) | 0 (0.0%) |
| $20,000 to $22,499 | 0 (0.0%) | 0 (0.0%) |
| $22,500 to $24,999 | 0 (0.0%) | 0 (0.0%) |
| $25,000 to $29,999 | 1 (1.2%) | 4 (7.7%) |
| $30,000 to $34,999 | 0 (0.0%) | 3 (5.8%) |
| $35,000 to $39,999 | 0 (0.0%) | 0 (0.0%) |
| $40,000 to $44,999 | 3 (3.6%) | 0 (0.0%) |
| $45,000 to $49,999 | 0 (0.0%) | 0 (0.0%) |
| $50,000 to $54,999 | 0 (0.0%) | 0 (0.0%) |
| $55,000 to $64,999 | 4 (4.8%) | 0 (0.0%) |
| $65,000 to $74,999 | 0 (0.0%) | 0 (0.0%) |
| $75,000 to $99,999 | 13 (15.7%) | 36 (69.2%) |
| $100,000+ | 20 (24.1%) | 3 (5.8%) |
| Total | 83 (100.0%) | 52 (100.0%) |
Earnings by Sex by Educational Attainment in Mesa Vista
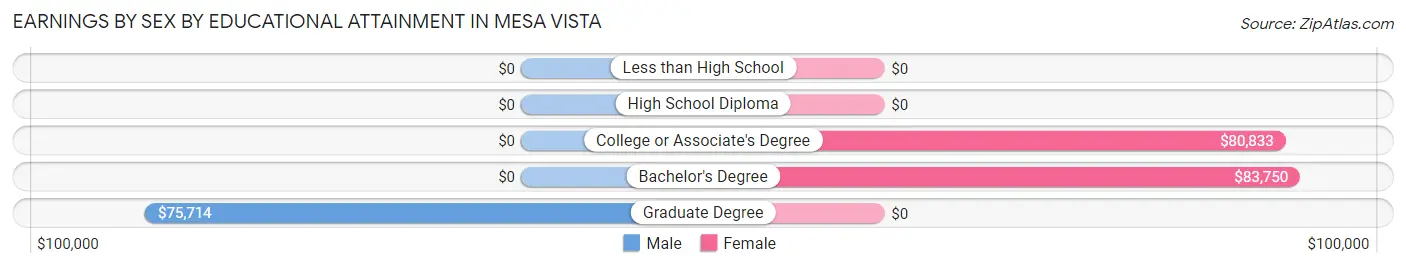
| Educational Attainment | Male Income | Female Income |
| Less than High School | - | - |
| High School Diploma | - | - |
| College or Associate's Degree | - | - |
| Bachelor's Degree | - | - |
| Graduate Degree | $75,714 | $0 |
| Total | - | - |
Family Income in Mesa Vista
Family Income Brackets in Mesa Vista
According to the Mesa Vista family income data, there are 31 families falling into the $100,000 to $149,999 income range, which is the most common income bracket and makes up 60.8% of all families.
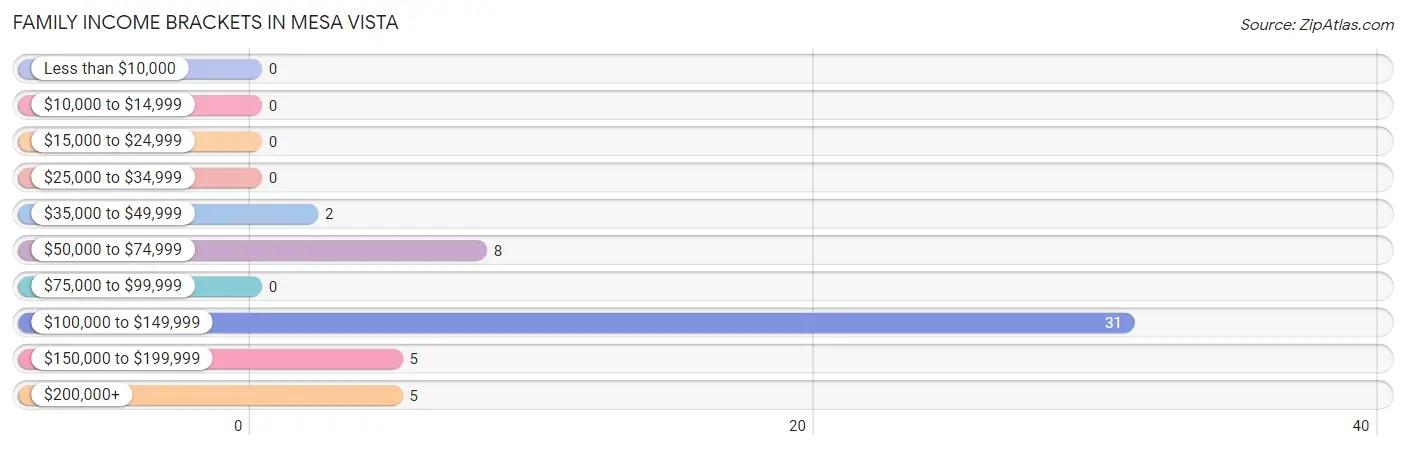
| Income Bracket | # Families | % Families |
| Less than $10,000 | 0 | 0.0% |
| $10,000 to $14,999 | 0 | 0.0% |
| $15,000 to $24,999 | 0 | 0.0% |
| $25,000 to $34,999 | 0 | 0.0% |
| $35,000 to $49,999 | 2 | 3.9% |
| $50,000 to $74,999 | 8 | 15.7% |
| $75,000 to $99,999 | 0 | 0.0% |
| $100,000 to $149,999 | 31 | 60.8% |
| $150,000 to $199,999 | 5 | 9.8% |
| $200,000+ | 5 | 9.8% |
Family Income by Famaliy Size in Mesa Vista
2-person families (37 | 72.6%) account for the highest median family income in Mesa Vista with $109,750 per family, while 2-person families (37 | 72.6%) have the highest median income of $54,875 per family member.
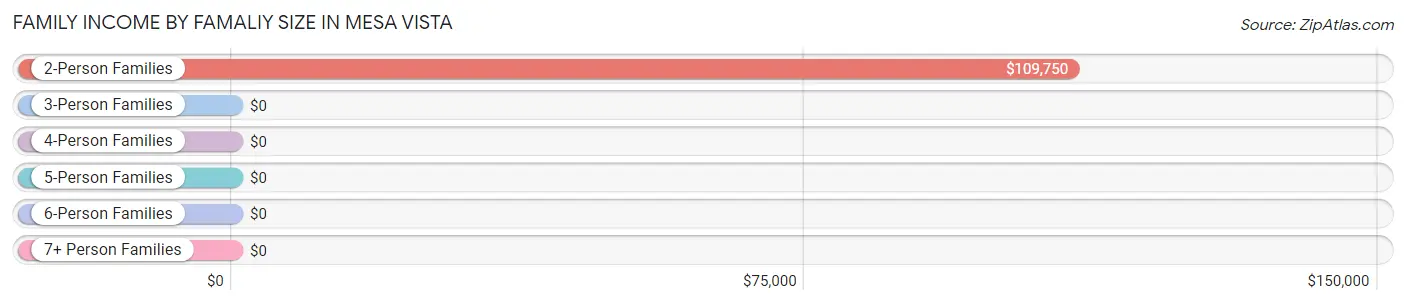
| Income Bracket | # Families | Median Income |
| 2-Person Families | 37 (72.6%) | $109,750 |
| 3-Person Families | 4 (7.8%) | $0 |
| 4-Person Families | 5 (9.8%) | $0 |
| 5-Person Families | 5 (9.8%) | $0 |
| 6-Person Families | 0 (0.0%) | $0 |
| 7+ Person Families | 0 (0.0%) | $0 |
| Total | 51 (100.0%) | $123,750 |
Family Income by Number of Earners in Mesa Vista
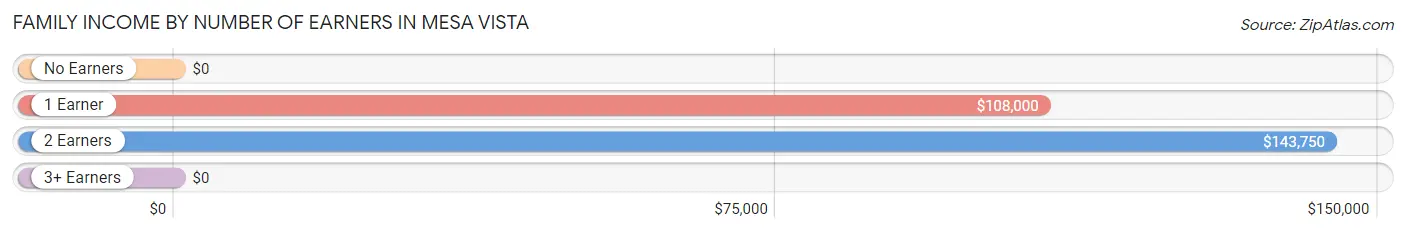
| Number of Earners | # Families | Median Income |
| No Earners | 11 (21.6%) | $0 |
| 1 Earner | 10 (19.6%) | $108,000 |
| 2 Earners | 26 (51.0%) | $143,750 |
| 3+ Earners | 4 (7.8%) | $0 |
| Total | 51 (100.0%) | $123,750 |
Household Income in Mesa Vista
Household Income Brackets in Mesa Vista
With 31 households falling in the category, the $100,000 to $149,999 income range is the most frequent in Mesa Vista, accounting for 47.0% of all households.
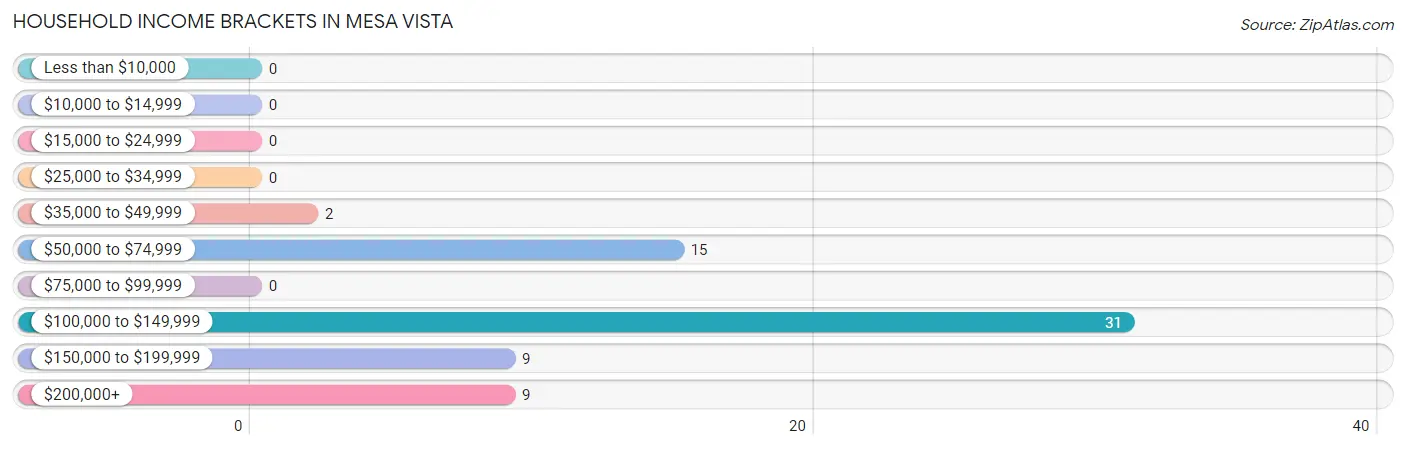
| Income Bracket | # Households | % Households |
| Less than $10,000 | 0 | 0.0% |
| $10,000 to $14,999 | 0 | 0.0% |
| $15,000 to $24,999 | 0 | 0.0% |
| $25,000 to $34,999 | 0 | 0.0% |
| $35,000 to $49,999 | 2 | 3.0% |
| $50,000 to $74,999 | 15 | 22.7% |
| $75,000 to $99,999 | 0 | 0.0% |
| $100,000 to $149,999 | 31 | 47.0% |
| $150,000 to $199,999 | 9 | 13.6% |
| $200,000+ | 9 | 13.6% |
Household Income by Householder Age in Mesa Vista
The median household income in Mesa Vista is $132,500, with the highest median household income of $141,111 found in the 65+ years age bracket for the primary householder. A total of 48 households (72.7%) fall into this category.
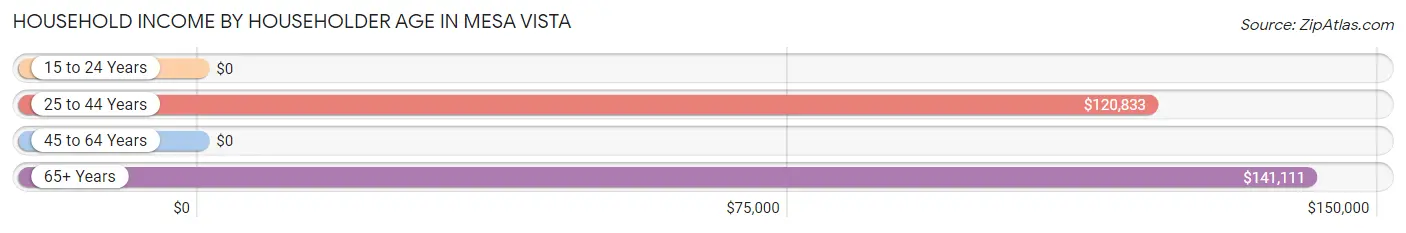
| Income Bracket | # Households | Median Income |
| 15 to 24 Years | 0 (0.0%) | $0 |
| 25 to 44 Years | 8 (12.1%) | $120,833 |
| 45 to 64 Years | 10 (15.1%) | $0 |
| 65+ Years | 48 (72.7%) | $141,111 |
| Total | 66 (100.0%) | $132,500 |
Poverty in Mesa Vista
Income Below Poverty by Sex and Age in Mesa Vista
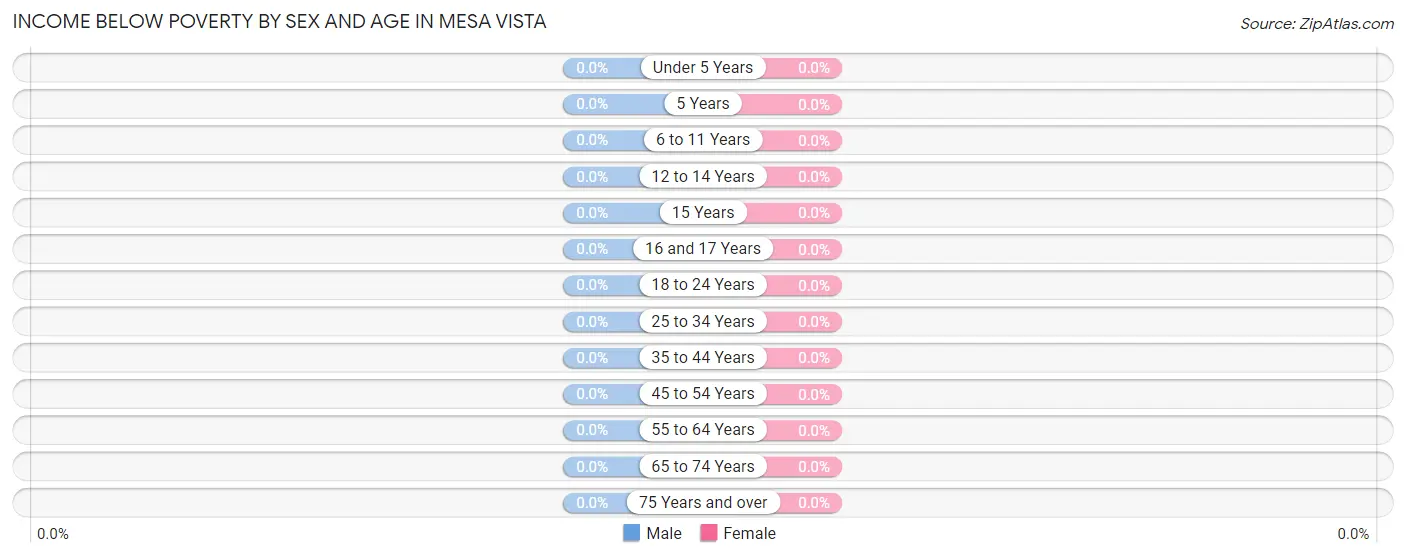
| Age Bracket | Male | Female |
| Under 5 Years | 0 (0.0%) | 0 (0.0%) |
| 5 Years | 0 (0.0%) | 0 (0.0%) |
| 6 to 11 Years | 0 (0.0%) | 0 (0.0%) |
| 12 to 14 Years | 0 (0.0%) | 0 (0.0%) |
| 15 Years | 0 (0.0%) | 0 (0.0%) |
| 16 and 17 Years | 0 (0.0%) | 0 (0.0%) |
| 18 to 24 Years | 0 (0.0%) | 0 (0.0%) |
| 25 to 34 Years | 0 (0.0%) | 0 (0.0%) |
| 35 to 44 Years | 0 (0.0%) | 0 (0.0%) |
| 45 to 54 Years | 0 (0.0%) | 0 (0.0%) |
| 55 to 64 Years | 0 (0.0%) | 0 (0.0%) |
| 65 to 74 Years | 0 (0.0%) | 0 (0.0%) |
| 75 Years and over | 0 (0.0%) | 0 (0.0%) |
| Total | 0 (0.0%) | 0 (0.0%) |
Income Above Poverty by Sex and Age in Mesa Vista
According to the poverty statistics in Mesa Vista, males aged under 5 years and females aged under 5 years are the age groups that are most secure financially, with 100.0% of males and 100.0% of females in these age groups living above the poverty line.
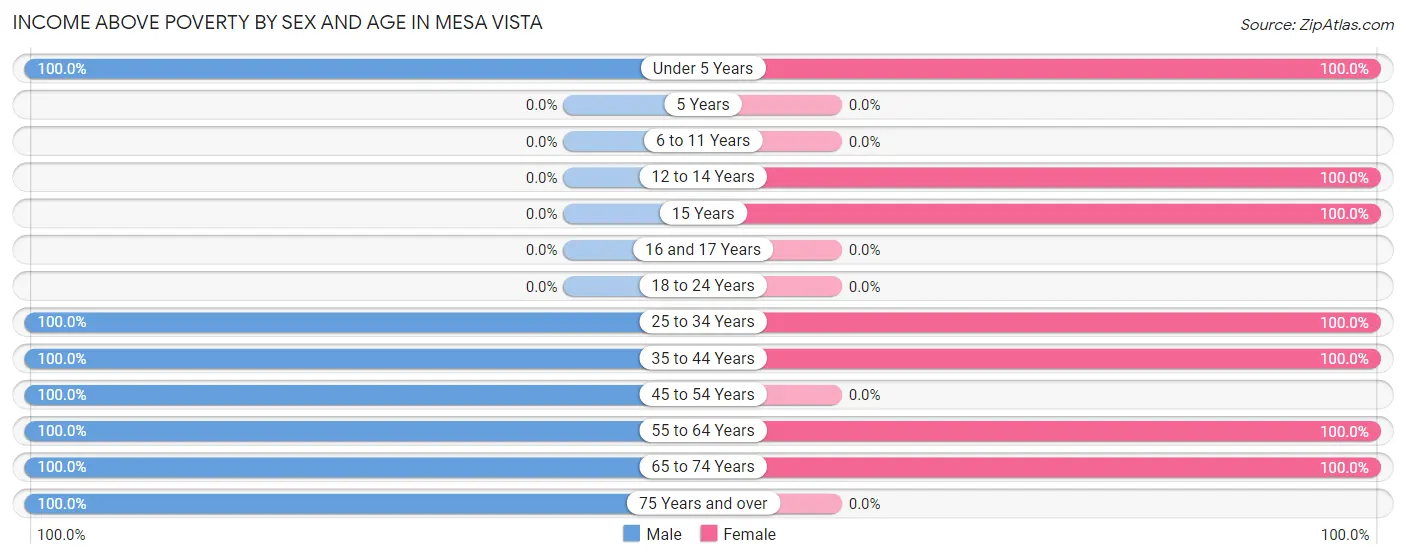
| Age Bracket | Male | Female |
| Under 5 Years | 23 (100.0%) | 9 (100.0%) |
| 5 Years | 0 (0.0%) | 0 (0.0%) |
| 6 to 11 Years | 0 (0.0%) | 0 (0.0%) |
| 12 to 14 Years | 0 (0.0%) | 1 (100.0%) |
| 15 Years | 0 (0.0%) | 2 (100.0%) |
| 16 and 17 Years | 0 (0.0%) | 0 (0.0%) |
| 18 to 24 Years | 0 (0.0%) | 0 (0.0%) |
| 25 to 34 Years | 28 (100.0%) | 3 (100.0%) |
| 35 to 44 Years | 22 (100.0%) | 33 (100.0%) |
| 45 to 54 Years | 3 (100.0%) | 0 (0.0%) |
| 55 to 64 Years | 4 (100.0%) | 14 (100.0%) |
| 65 to 74 Years | 43 (100.0%) | 57 (100.0%) |
| 75 Years and over | 4 (100.0%) | 0 (0.0%) |
| Total | 127 (100.0%) | 119 (100.0%) |
Income Below Poverty Among Married-Couple Families in Mesa Vista
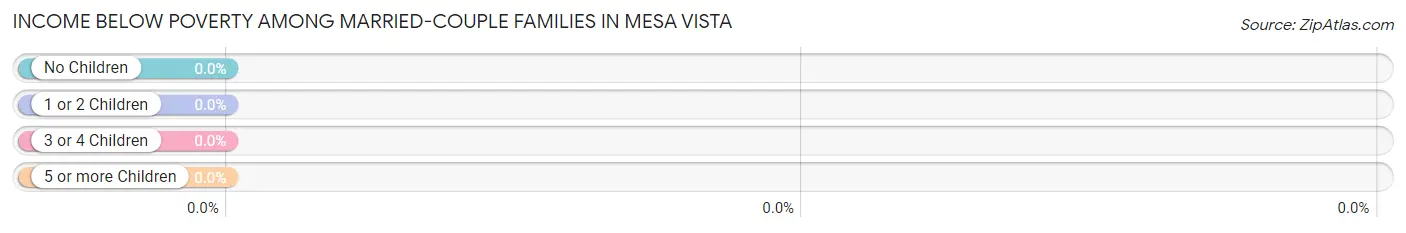
| Children | Above Poverty | Below Poverty |
| No Children | 39 (100.0%) | 0 (0.0%) |
| 1 or 2 Children | 10 (100.0%) | 0 (0.0%) |
| 3 or 4 Children | 0 (0.0%) | 0 (0.0%) |
| 5 or more Children | 0 (0.0%) | 0 (0.0%) |
| Total | 49 (100.0%) | 0 (0.0%) |
Income Below Poverty Among Single-Parent Households in Mesa Vista
| Children | Single Father | Single Mother |
| No Children | 0 (0.0%) | 0 (0.0%) |
| 1 or 2 Children | 0 (0.0%) | 0 (0.0%) |
| 3 or 4 Children | 0 (0.0%) | 0 (0.0%) |
| 5 or more Children | 0 (0.0%) | 0 (0.0%) |
| Total | 0 (0.0%) | 0 (0.0%) |
Income Below Poverty Among Married-Couple vs Single-Parent Households in Mesa Vista
| Children | Married-Couple Families | Single-Parent Households |
| No Children | 0 (0.0%) | 0 (0.0%) |
| 1 or 2 Children | 0 (0.0%) | 0 (0.0%) |
| 3 or 4 Children | 0 (0.0%) | 0 (0.0%) |
| 5 or more Children | 0 (0.0%) | 0 (0.0%) |
| Total | 0 (0.0%) | 0 (0.0%) |
Race in Mesa Vista
The most populous races in Mesa Vista are White / Caucasian (217 | 88.2%), Two or more Races (16 | 6.5%), and Hispanic or Latino (14 | 5.7%).
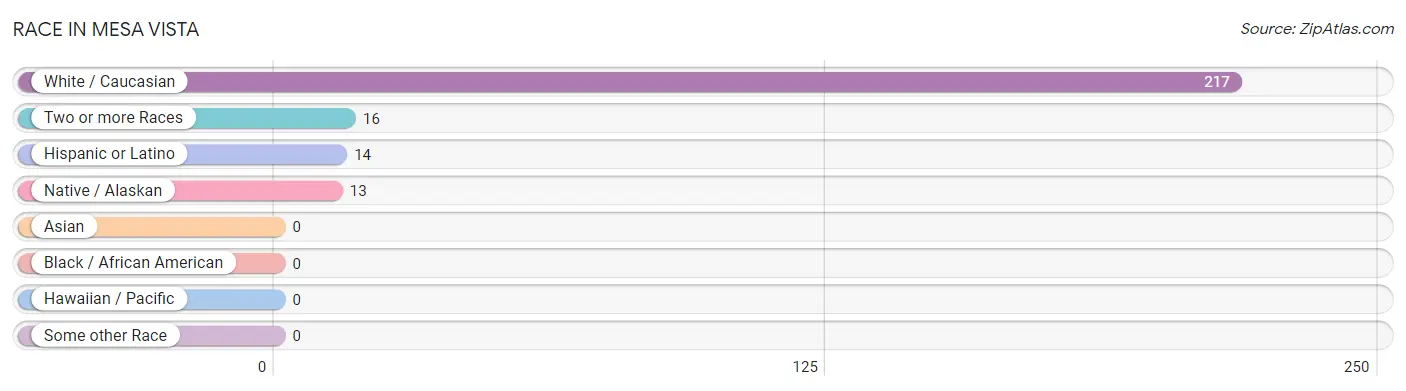
| Race | # Population | % Population |
| Asian | 0 | 0.0% |
| Black / African American | 0 | 0.0% |
| Hawaiian / Pacific | 0 | 0.0% |
| Hispanic or Latino | 14 | 5.7% |
| Native / Alaskan | 13 | 5.3% |
| White / Caucasian | 217 | 88.2% |
| Two or more Races | 16 | 6.5% |
| Some other Race | 0 | 0.0% |
| Total | 246 | 100.0% |
Ancestry in Mesa Vista
The most populous ancestries reported in Mesa Vista are German (61 | 24.8%), Italian (42 | 17.1%), English (31 | 12.6%), Greek (28 | 11.4%), and Irish (17 | 6.9%), together accounting for 72.8% of all Mesa Vista residents.
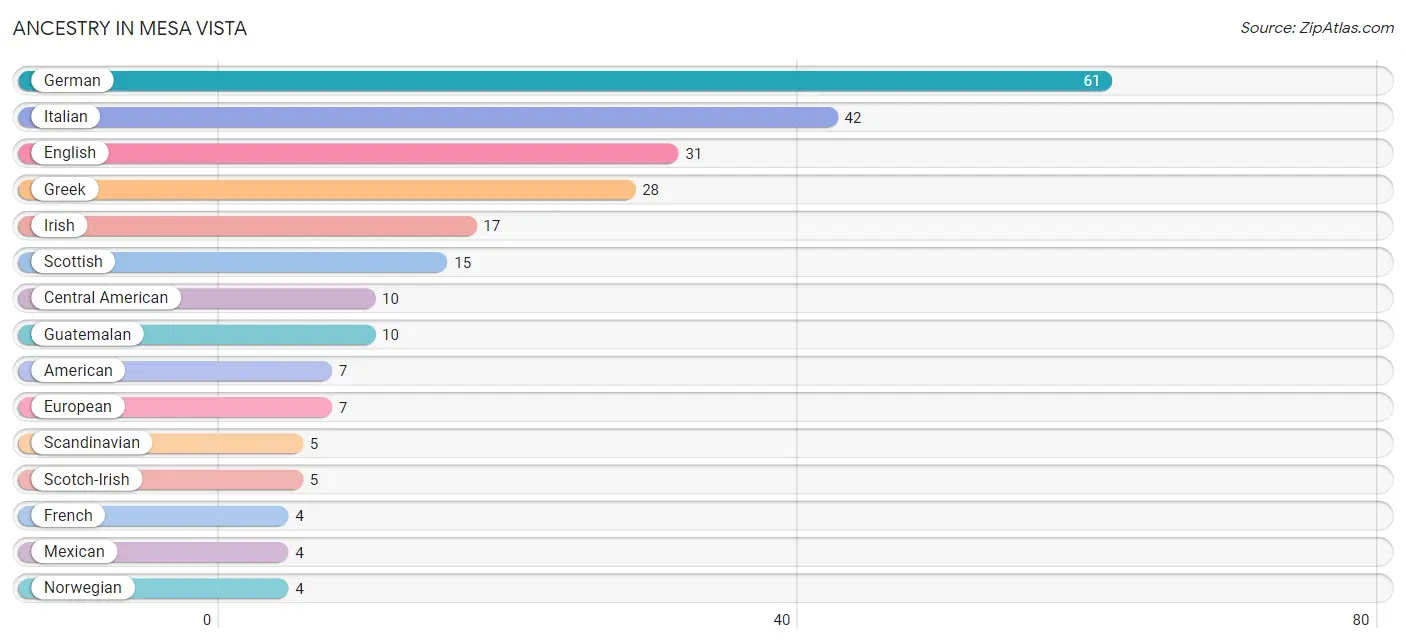
| Ancestry | # Population | % Population |
| American | 7 | 2.9% |
| Austrian | 3 | 1.2% |
| Central American | 10 | 4.1% |
| Dutch | 1 | 0.4% |
| English | 31 | 12.6% |
| European | 7 | 2.9% |
| French | 4 | 1.6% |
| German | 61 | 24.8% |
| Greek | 28 | 11.4% |
| Guatemalan | 10 | 4.1% |
| Irish | 17 | 6.9% |
| Italian | 42 | 17.1% |
| Mexican | 4 | 1.6% |
| Norwegian | 4 | 1.6% |
| Scandinavian | 5 | 2.0% |
| Scotch-Irish | 5 | 2.0% |
| Scottish | 15 | 6.1% |
| Swiss | 4 | 1.6% | View All 18 Rows |
Immigrants in Mesa Vista
The most numerous immigrant groups reported in Mesa Vista came from Asia (6 | 2.4%), India (6 | 2.4%), and South Central Asia (6 | 2.4%), together accounting for 7.3% of all Mesa Vista residents.
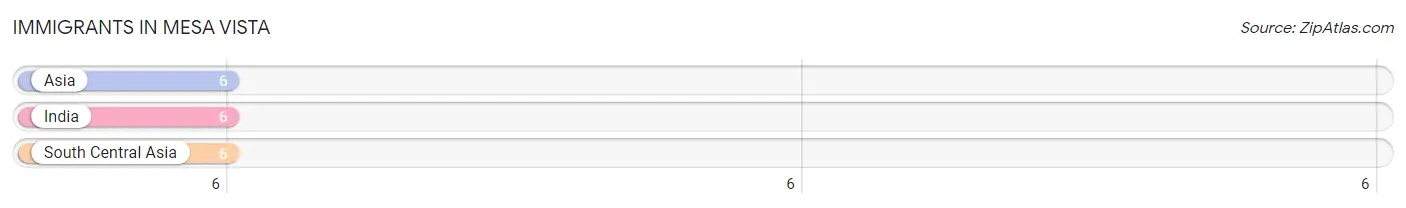
| Immigration Origin | # Population | % Population |
| Asia | 6 | 2.4% |
| India | 6 | 2.4% |
| South Central Asia | 6 | 2.4% | View All 3 Rows |
Sex and Age in Mesa Vista
Sex and Age in Mesa Vista
The most populous age groups in Mesa Vista are 25 to 29 Years (25 | 19.7%) for men and 70 to 74 Years (49 | 41.2%) for women.
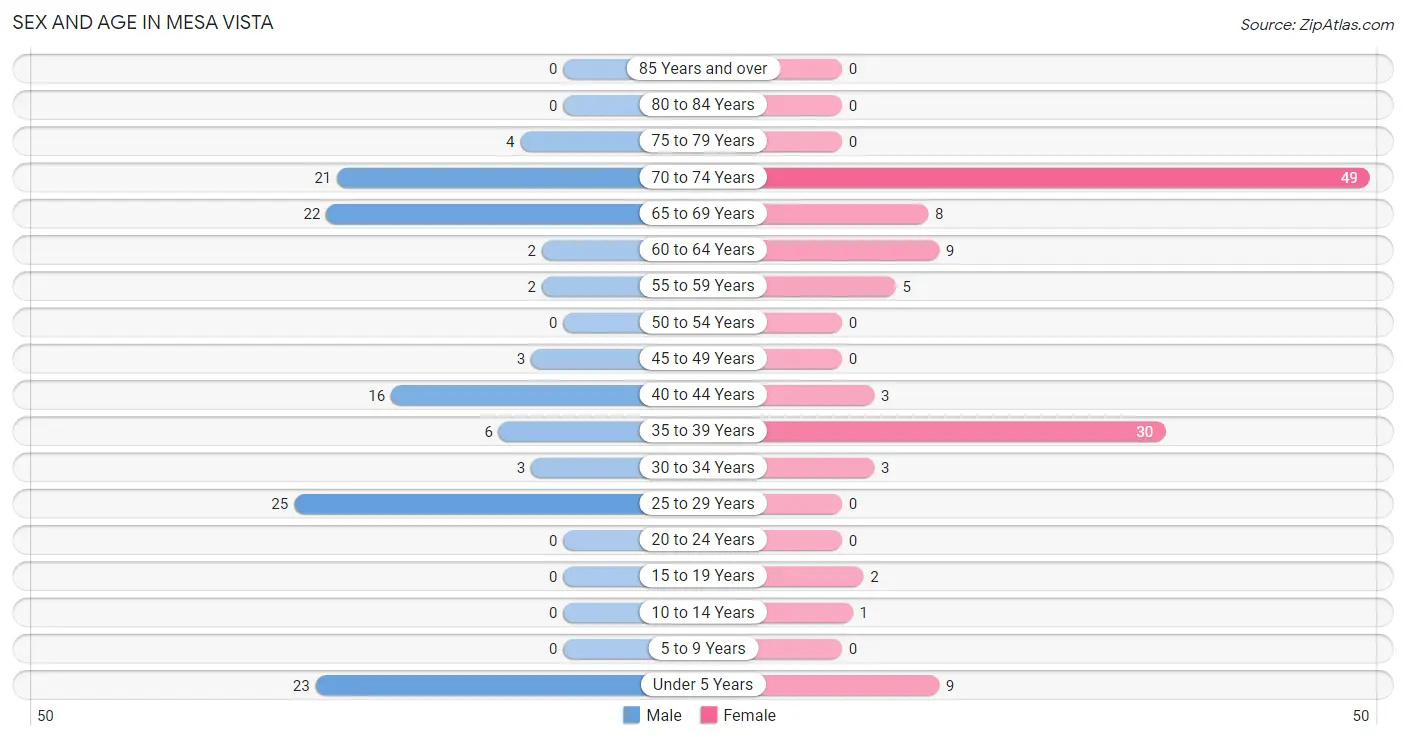
| Age Bracket | Male | Female |
| Under 5 Years | 23 (18.1%) | 9 (7.6%) |
| 5 to 9 Years | 0 (0.0%) | 0 (0.0%) |
| 10 to 14 Years | 0 (0.0%) | 1 (0.8%) |
| 15 to 19 Years | 0 (0.0%) | 2 (1.7%) |
| 20 to 24 Years | 0 (0.0%) | 0 (0.0%) |
| 25 to 29 Years | 25 (19.7%) | 0 (0.0%) |
| 30 to 34 Years | 3 (2.4%) | 3 (2.5%) |
| 35 to 39 Years | 6 (4.7%) | 30 (25.2%) |
| 40 to 44 Years | 16 (12.6%) | 3 (2.5%) |
| 45 to 49 Years | 3 (2.4%) | 0 (0.0%) |
| 50 to 54 Years | 0 (0.0%) | 0 (0.0%) |
| 55 to 59 Years | 2 (1.6%) | 5 (4.2%) |
| 60 to 64 Years | 2 (1.6%) | 9 (7.6%) |
| 65 to 69 Years | 22 (17.3%) | 8 (6.7%) |
| 70 to 74 Years | 21 (16.5%) | 49 (41.2%) |
| 75 to 79 Years | 4 (3.2%) | 0 (0.0%) |
| 80 to 84 Years | 0 (0.0%) | 0 (0.0%) |
| 85 Years and over | 0 (0.0%) | 0 (0.0%) |
| Total | 127 (100.0%) | 119 (100.0%) |
Families and Households in Mesa Vista
Median Family Size in Mesa Vista
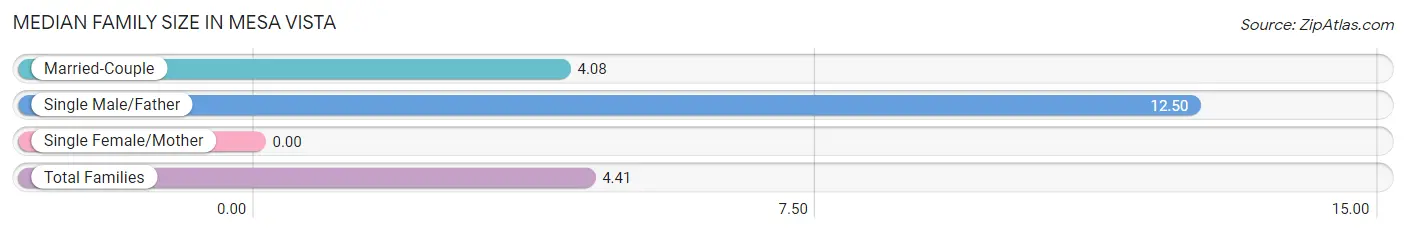
| Family Type | # Families | Family Size |
| Married-Couple | 49 (96.1%) | 4.08 |
| Single Male/Father | 2 (3.9%) | 12.50 |
| Single Female/Mother | 0 (0.0%) | - |
| Total Families | 51 (100.0%) | 4.41 |
Median Household Size in Mesa Vista
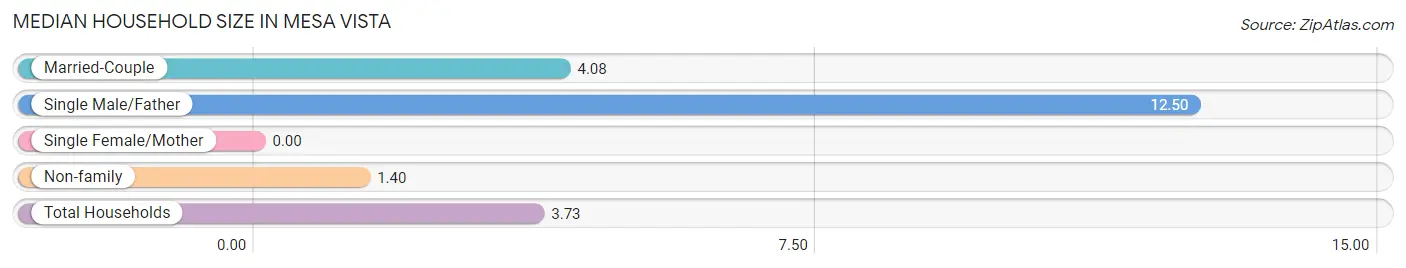
| Household Type | # Households | Household Size |
| Married-Couple | 49 (74.2%) | 4.08 |
| Single Male/Father | 2 (3.0%) | 12.50 |
| Single Female/Mother | 0 (0.0%) | - |
| Non-family | 15 (22.7%) | 1.40 |
| Total Households | 66 (100.0%) | 3.73 |
Household Size by Marriage Status in Mesa Vista
Out of a total of 66 households in Mesa Vista, 51 (77.3%) are family households, while 15 (22.7%) are nonfamily households. The most numerous type of family households are 2-person households, comprising 37, and the most common type of nonfamily households are 1-person households, comprising 11.
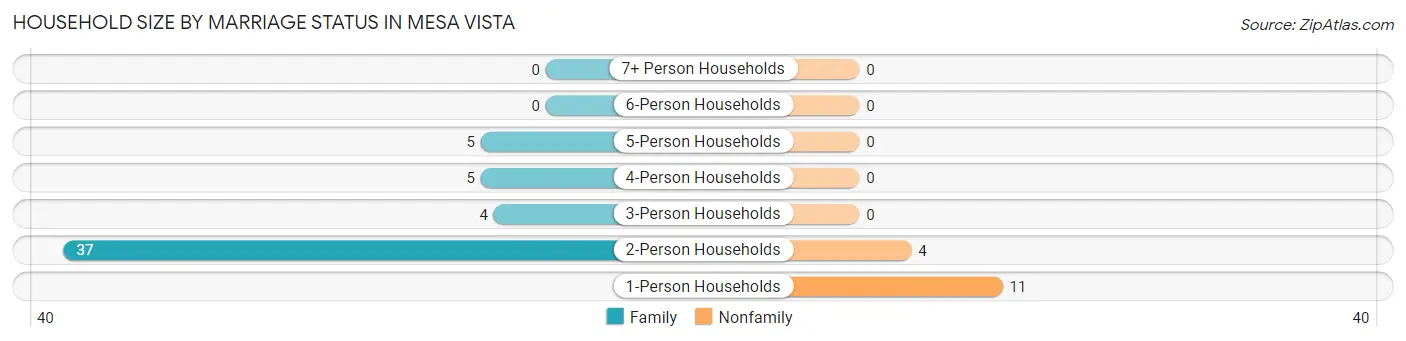
| Household Size | Family Households | Nonfamily Households |
| 1-Person Households | - | 11 (16.7%) |
| 2-Person Households | 37 (56.1%) | 4 (6.1%) |
| 3-Person Households | 4 (6.1%) | 0 (0.0%) |
| 4-Person Households | 5 (7.6%) | 0 (0.0%) |
| 5-Person Households | 5 (7.6%) | 0 (0.0%) |
| 6-Person Households | 0 (0.0%) | 0 (0.0%) |
| 7+ Person Households | 0 (0.0%) | 0 (0.0%) |
| Total | 51 (77.3%) | 15 (22.7%) |
Female Fertility in Mesa Vista
Fertility by Age in Mesa Vista
Average fertility rate in Mesa Vista is 789.0 births per 1,000 women. Women in the age bracket of 35 to 50 years have the highest fertility rate with 909.0 births per 1,000 women. Women in the age bracket of 35 to 50 years acount for 100.0% of all women with births.
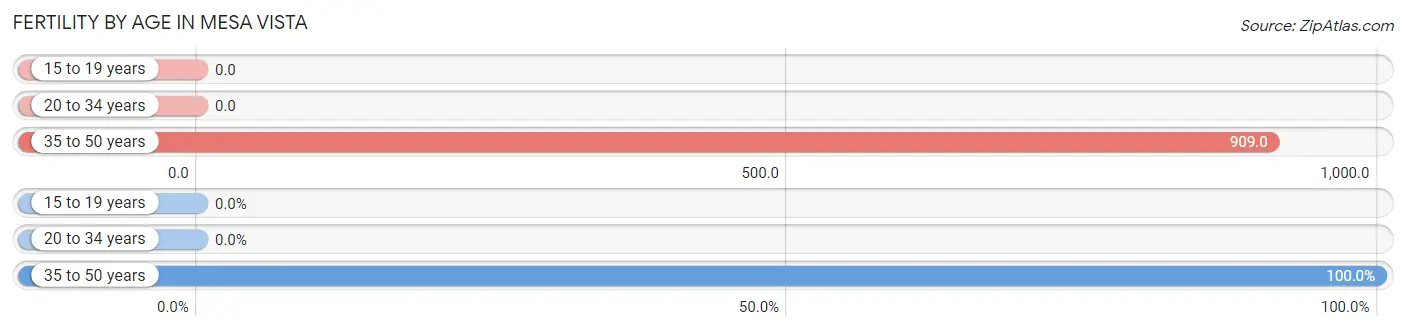
| Age Bracket | Women with Births | Births / 1,000 Women |
| 15 to 19 years | 0 (0.0%) | 0.0 |
| 20 to 34 years | 0 (0.0%) | 0.0 |
| 35 to 50 years | 30 (100.0%) | 909.0 |
| Total | 30 (100.0%) | 789.0 |
Fertility by Age by Marriage Status in Mesa Vista
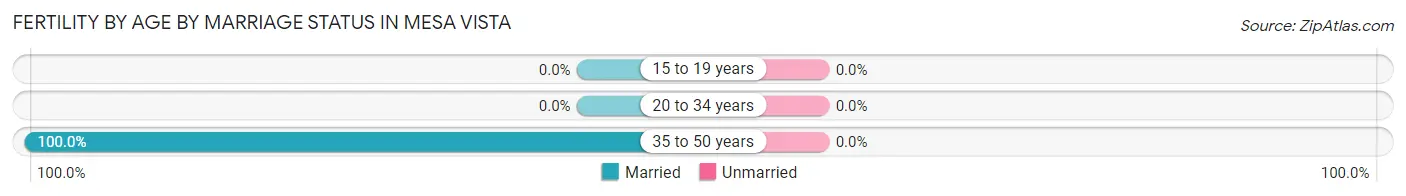
| Age Bracket | Married | Unmarried |
| 15 to 19 years | 0 (0.0%) | 0 (0.0%) |
| 20 to 34 years | 0 (0.0%) | 0 (0.0%) |
| 35 to 50 years | 30 (100.0%) | 0 (0.0%) |
| Total | 30 (100.0%) | 0 (0.0%) |
Fertility by Education in Mesa Vista
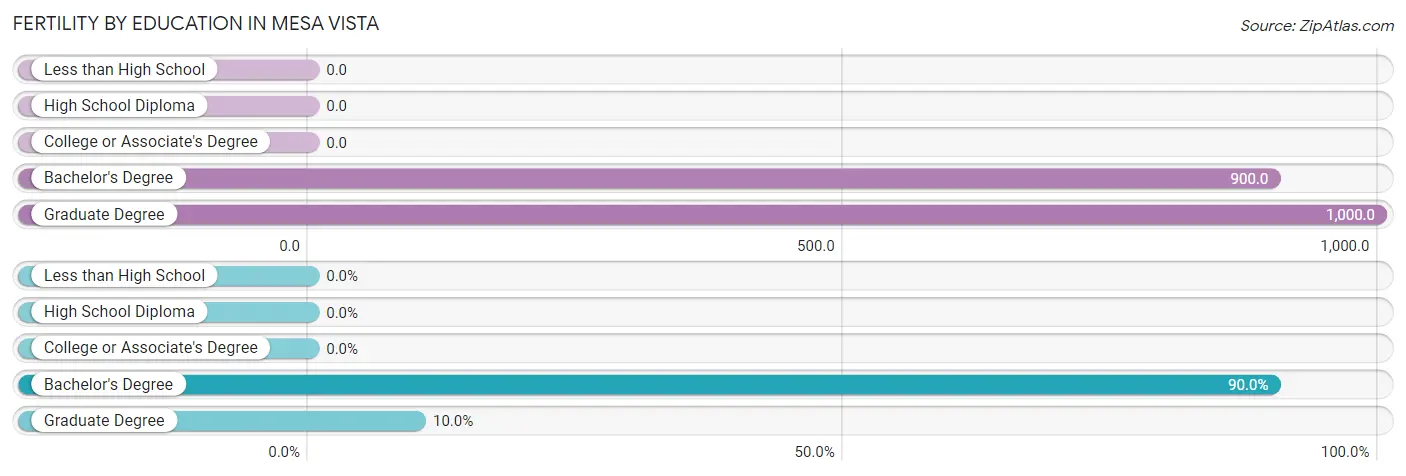
| Educational Attainment | Women with Births | Births / 1,000 Women |
| Less than High School | 0 (0.0%) | 0.0 |
| High School Diploma | 0 (0.0%) | 0.0 |
| College or Associate's Degree | 0 (0.0%) | 0.0 |
| Bachelor's Degree | 27 (90.0%) | 900.0 |
| Graduate Degree | 3 (10.0%) | 1,000.0 |
| Total | 30 (100.0%) | 789.0 |
Fertility by Education by Marriage Status in Mesa Vista
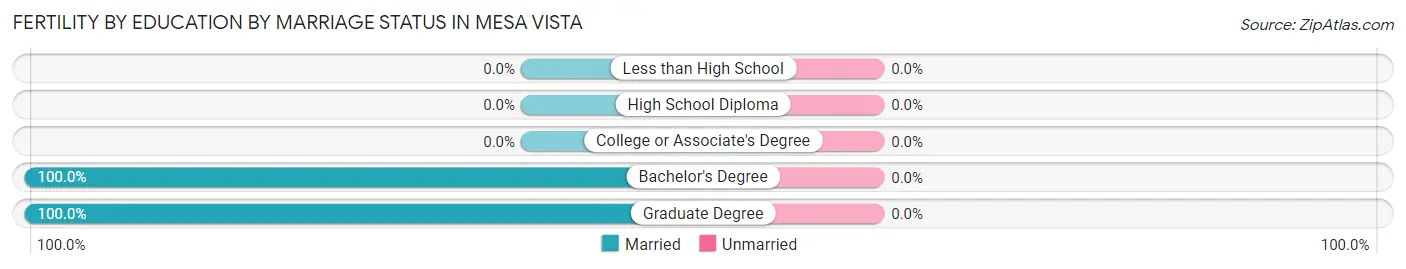
| Educational Attainment | Married | Unmarried |
| Less than High School | 0 (0.0%) | 0 (0.0%) |
| High School Diploma | 0 (0.0%) | 0 (0.0%) |
| College or Associate's Degree | 0 (0.0%) | 0 (0.0%) |
| Bachelor's Degree | 27 (100.0%) | 0 (0.0%) |
| Graduate Degree | 3 (100.0%) | 0 (0.0%) |
| Total | 30 (100.0%) | 0 (0.0%) |
Employment Characteristics in Mesa Vista
Employment by Class of Employer in Mesa Vista
Among the 129 employed individuals in Mesa Vista, private company employees (93 | 72.1%), local government employees (10 | 7.7%), and state government employees (7 | 5.4%) make up the most common classes of employment.
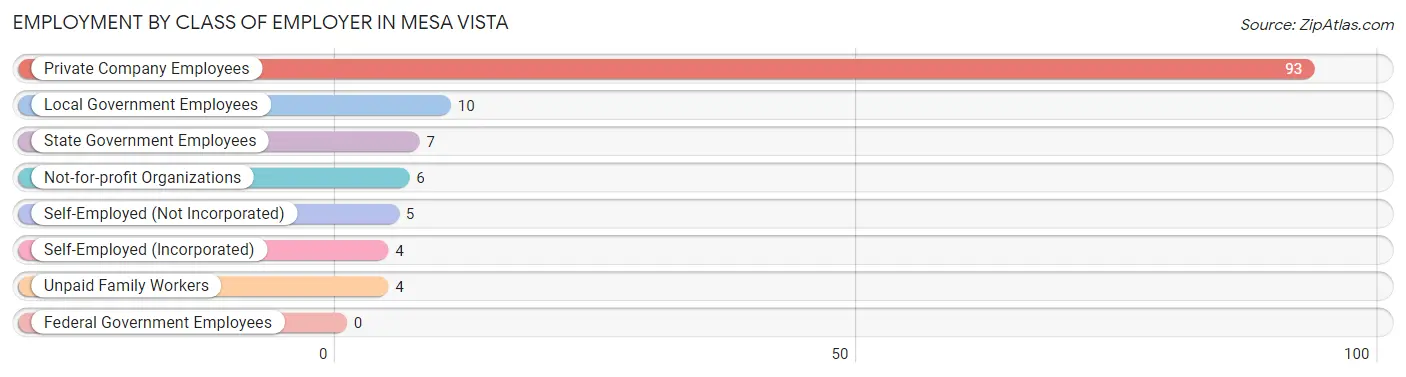
| Employer Class | # Employees | % Employees |
| Private Company Employees | 93 | 72.1% |
| Self-Employed (Incorporated) | 4 | 3.1% |
| Self-Employed (Not Incorporated) | 5 | 3.9% |
| Not-for-profit Organizations | 6 | 4.6% |
| Local Government Employees | 10 | 7.7% |
| State Government Employees | 7 | 5.4% |
| Federal Government Employees | 0 | 0.0% |
| Unpaid Family Workers | 4 | 3.1% |
| Total | 129 | 100.0% |
Employment Status by Age in Mesa Vista
According to the labor force statistics for Mesa Vista, out of the total population over 16 years of age (211), 66.4% or 140 individuals are in the labor force, with 3.6% or 5 of them unemployed. The age group with the highest labor force participation rate is 25 to 29 years, with 100.0% or 25 individuals in the labor force. Within the labor force, the 45 to 54 years age range has the highest percentage of unemployed individuals, with 66.7% or 2 of them being unemployed.
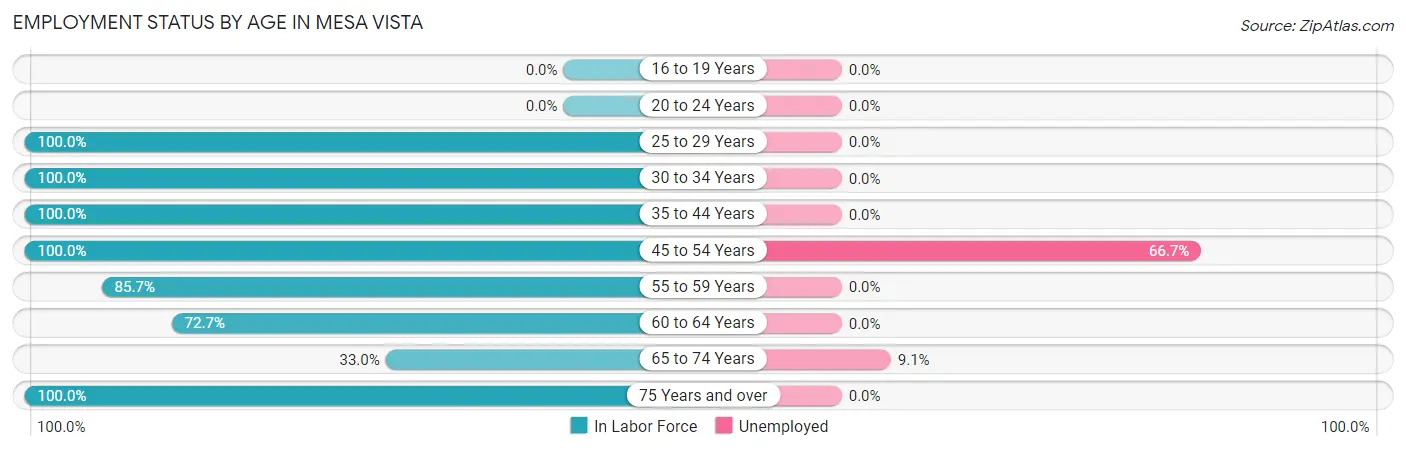
| Age Bracket | In Labor Force | Unemployed |
| 16 to 19 Years | 0 (0.0%) | 0 (0.0%) |
| 20 to 24 Years | 0 (0.0%) | 0 (0.0%) |
| 25 to 29 Years | 25 (100.0%) | 0 (0.0%) |
| 30 to 34 Years | 6 (100.0%) | 0 (0.0%) |
| 35 to 44 Years | 55 (100.0%) | 0 (0.0%) |
| 45 to 54 Years | 3 (100.0%) | 2 (66.7%) |
| 55 to 59 Years | 6 (85.7%) | 0 (0.0%) |
| 60 to 64 Years | 8 (72.7%) | 0 (0.0%) |
| 65 to 74 Years | 33 (33.0%) | 3 (9.1%) |
| 75 Years and over | 4 (100.0%) | 0 (0.0%) |
| Total | 140 (66.4%) | 5 (3.6%) |
Employment Status by Educational Attainment in Mesa Vista
According to labor force statistics for Mesa Vista, 96.3% of individuals (103) out of the total population between 25 and 64 years of age (107) are in the labor force, with 1.9% or 2 of them being unemployed. The group with the highest labor force participation rate are those with the educational attainment of less than high school, with 100.0% or 6 individuals in the labor force. Within the labor force, individuals with college / associate degree education have the highest percentage of unemployment, with 6.7% or 2 of them being unemployed.
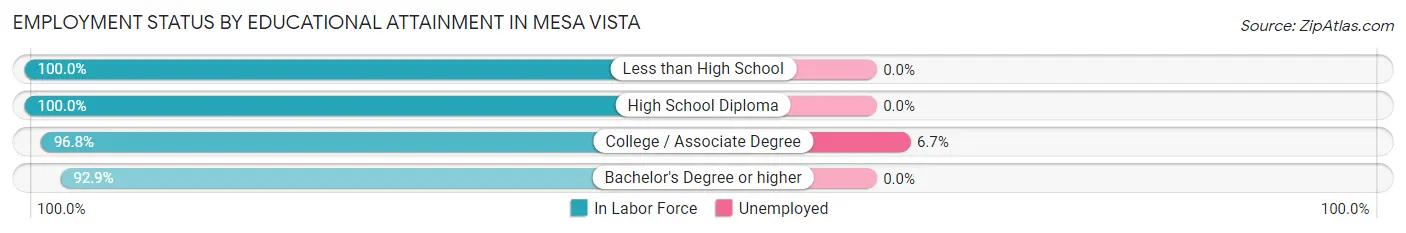
| Educational Attainment | In Labor Force | Unemployed |
| Less than High School | 6 (100.0%) | 0 (0.0%) |
| High School Diploma | 28 (100.0%) | 0 (0.0%) |
| College / Associate Degree | 30 (96.8%) | 2 (6.7%) |
| Bachelor's Degree or higher | 39 (92.9%) | 0 (0.0%) |
| Total | 103 (96.3%) | 2 (1.9%) |
Employment Occupations by Sex in Mesa Vista
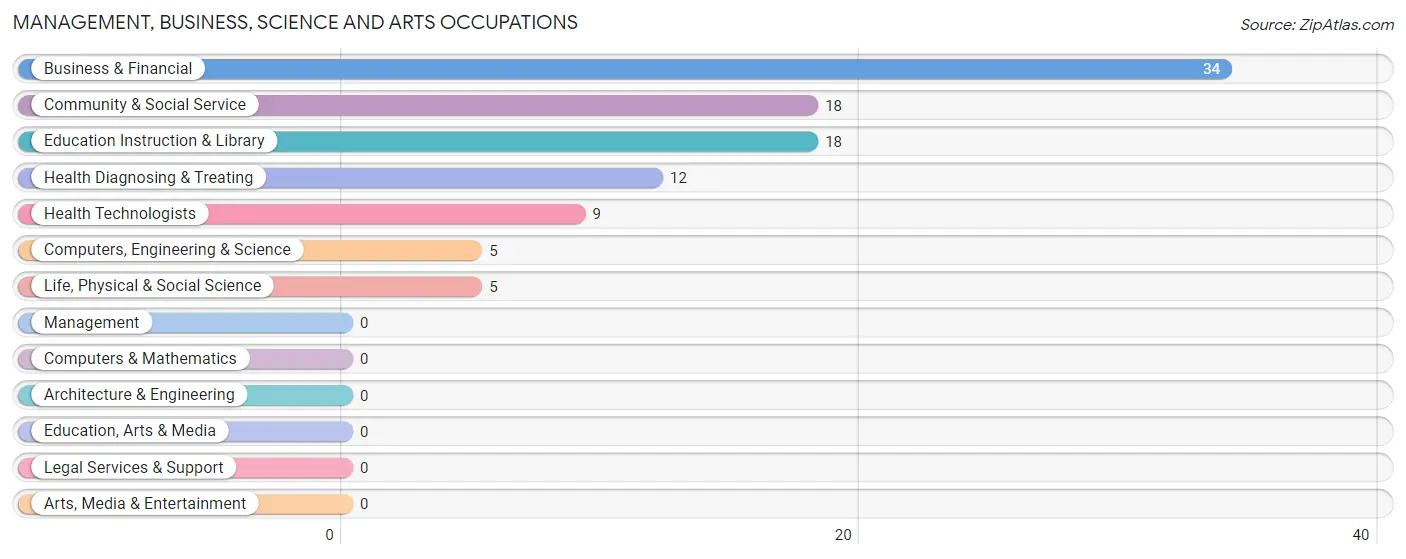
Management, Business, Science and Arts Occupations
The most common Management, Business, Science and Arts occupations in Mesa Vista are Business & Financial (34 | 25.2%), Community & Social Service (18 | 13.3%), Education Instruction & Library (18 | 13.3%), Health Diagnosing & Treating (12 | 8.9%), and Health Technologists (9 | 6.7%).
Management, Business, Science and Arts Occupations by Sex
Within the Management, Business, Science and Arts occupations in Mesa Vista, the most male-oriented occupations are Computers, Engineering & Science (100.0%), Life, Physical & Social Science (100.0%), and Health Technologists (66.7%), while the most female-oriented occupations are Business & Financial (88.2%), Community & Social Service (50.0%), and Education Instruction & Library (50.0%).
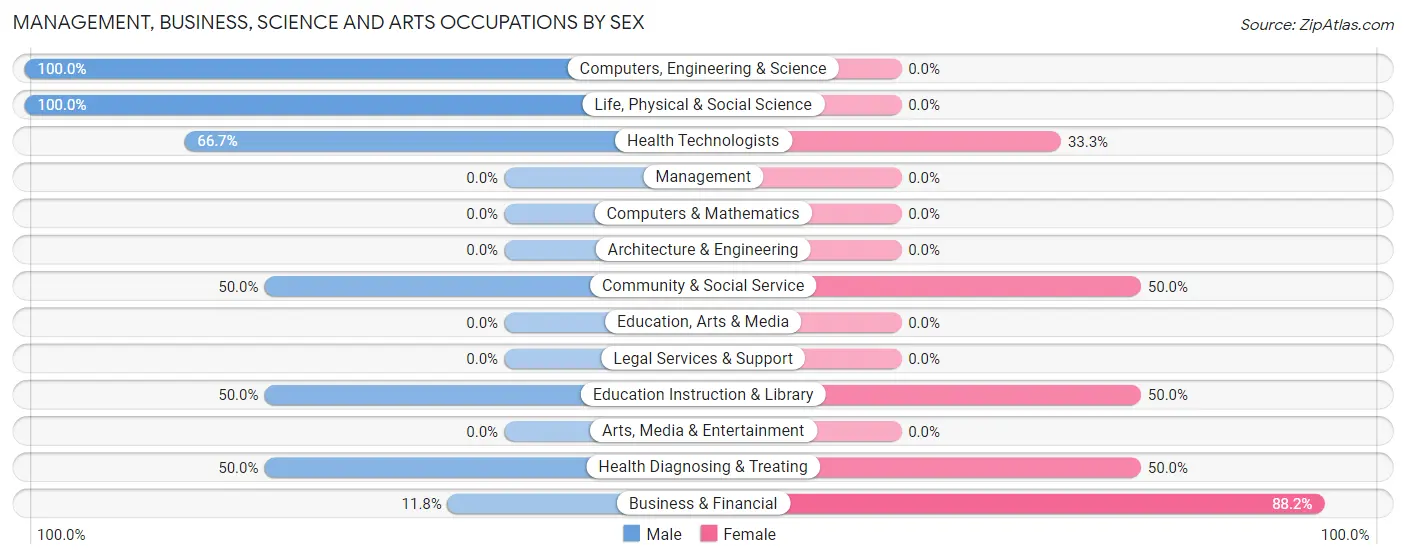
| Occupation | Male | Female |
| Management | 0 (0.0%) | 0 (0.0%) |
| Business & Financial | 4 (11.8%) | 30 (88.2%) |
| Computers, Engineering & Science | 5 (100.0%) | 0 (0.0%) |
| Computers & Mathematics | 0 (0.0%) | 0 (0.0%) |
| Architecture & Engineering | 0 (0.0%) | 0 (0.0%) |
| Life, Physical & Social Science | 5 (100.0%) | 0 (0.0%) |
| Community & Social Service | 9 (50.0%) | 9 (50.0%) |
| Education, Arts & Media | 0 (0.0%) | 0 (0.0%) |
| Legal Services & Support | 0 (0.0%) | 0 (0.0%) |
| Education Instruction & Library | 9 (50.0%) | 9 (50.0%) |
| Arts, Media & Entertainment | 0 (0.0%) | 0 (0.0%) |
| Health Diagnosing & Treating | 6 (50.0%) | 6 (50.0%) |
| Health Technologists | 6 (66.7%) | 3 (33.3%) |
| Total (Category) | 24 (34.8%) | 45 (65.2%) |
| Total (Overall) | 83 (61.5%) | 52 (38.5%) |
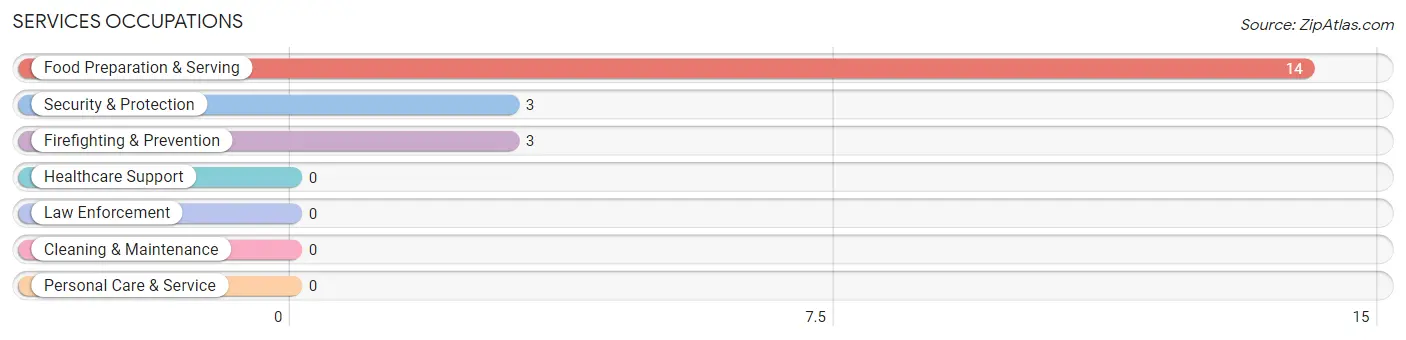
Services Occupations
The most common Services occupations in Mesa Vista are Food Preparation & Serving (14 | 10.4%), Security & Protection (3 | 2.2%), and Firefighting & Prevention (3 | 2.2%).
Services Occupations by Sex
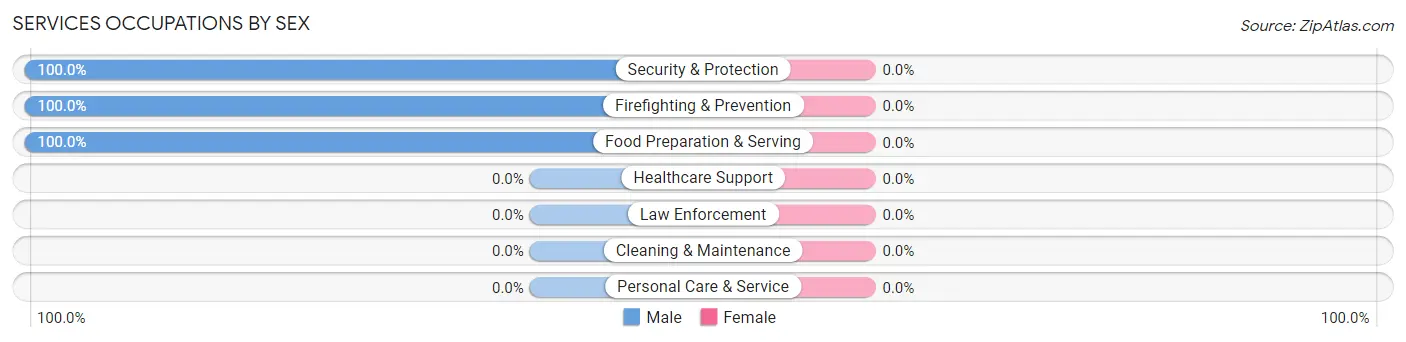
| Occupation | Male | Female |
| Healthcare Support | 0 (0.0%) | 0 (0.0%) |
| Security & Protection | 3 (100.0%) | 0 (0.0%) |
| Firefighting & Prevention | 3 (100.0%) | 0 (0.0%) |
| Law Enforcement | 0 (0.0%) | 0 (0.0%) |
| Food Preparation & Serving | 14 (100.0%) | 0 (0.0%) |
| Cleaning & Maintenance | 0 (0.0%) | 0 (0.0%) |
| Personal Care & Service | 0 (0.0%) | 0 (0.0%) |
| Total (Category) | 17 (100.0%) | 0 (0.0%) |
| Total (Overall) | 83 (61.5%) | 52 (38.5%) |
Sales and Office Occupations
The most common Sales and Office occupations in Mesa Vista are Sales & Related (4 | 3.0%), and Office & Administration (3 | 2.2%).
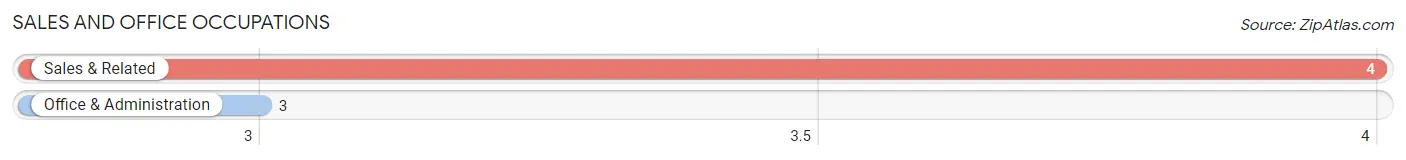
Sales and Office Occupations by Sex

| Occupation | Male | Female |
| Sales & Related | 4 (100.0%) | 0 (0.0%) |
| Office & Administration | 0 (0.0%) | 3 (100.0%) |
| Total (Category) | 4 (57.1%) | 3 (42.9%) |
| Total (Overall) | 83 (61.5%) | 52 (38.5%) |
Natural Resources, Construction and Maintenance Occupations
The most common Natural Resources, Construction and Maintenance occupations in Mesa Vista are Farming, Fishing & Forestry (4 | 3.0%), Construction & Extraction (2 | 1.5%), and Installation, Maintenance & Repair (2 | 1.5%).
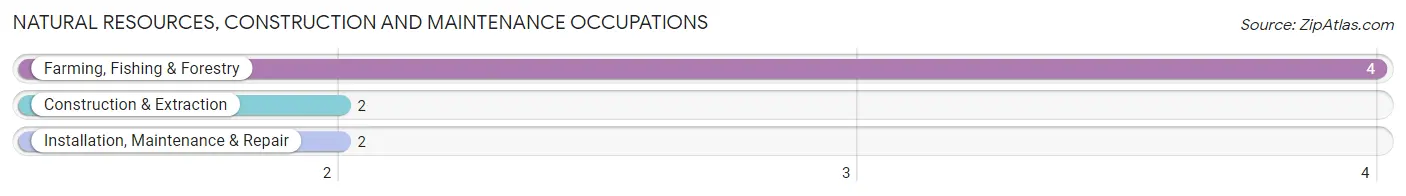
Natural Resources, Construction and Maintenance Occupations by Sex

| Occupation | Male | Female |
| Farming, Fishing & Forestry | 4 (100.0%) | 0 (0.0%) |
| Construction & Extraction | 2 (100.0%) | 0 (0.0%) |
| Installation, Maintenance & Repair | 2 (100.0%) | 0 (0.0%) |
| Total (Category) | 8 (100.0%) | 0 (0.0%) |
| Total (Overall) | 83 (61.5%) | 52 (38.5%) |
Production, Transportation and Moving Occupations
The most common Production, Transportation and Moving occupations in Mesa Vista are Transportation (25 | 18.5%), and Production (9 | 6.7%).
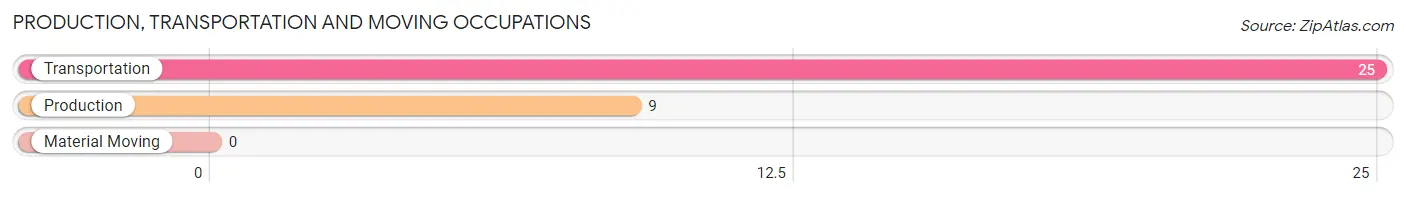
Production, Transportation and Moving Occupations by Sex
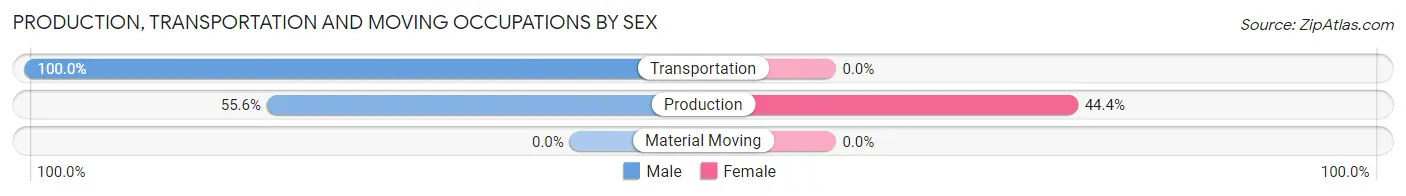
| Occupation | Male | Female |
| Production | 5 (55.6%) | 4 (44.4%) |
| Transportation | 25 (100.0%) | 0 (0.0%) |
| Material Moving | 0 (0.0%) | 0 (0.0%) |
| Total (Category) | 30 (88.2%) | 4 (11.8%) |
| Total (Overall) | 83 (61.5%) | 52 (38.5%) |
Employment Industries by Sex in Mesa Vista
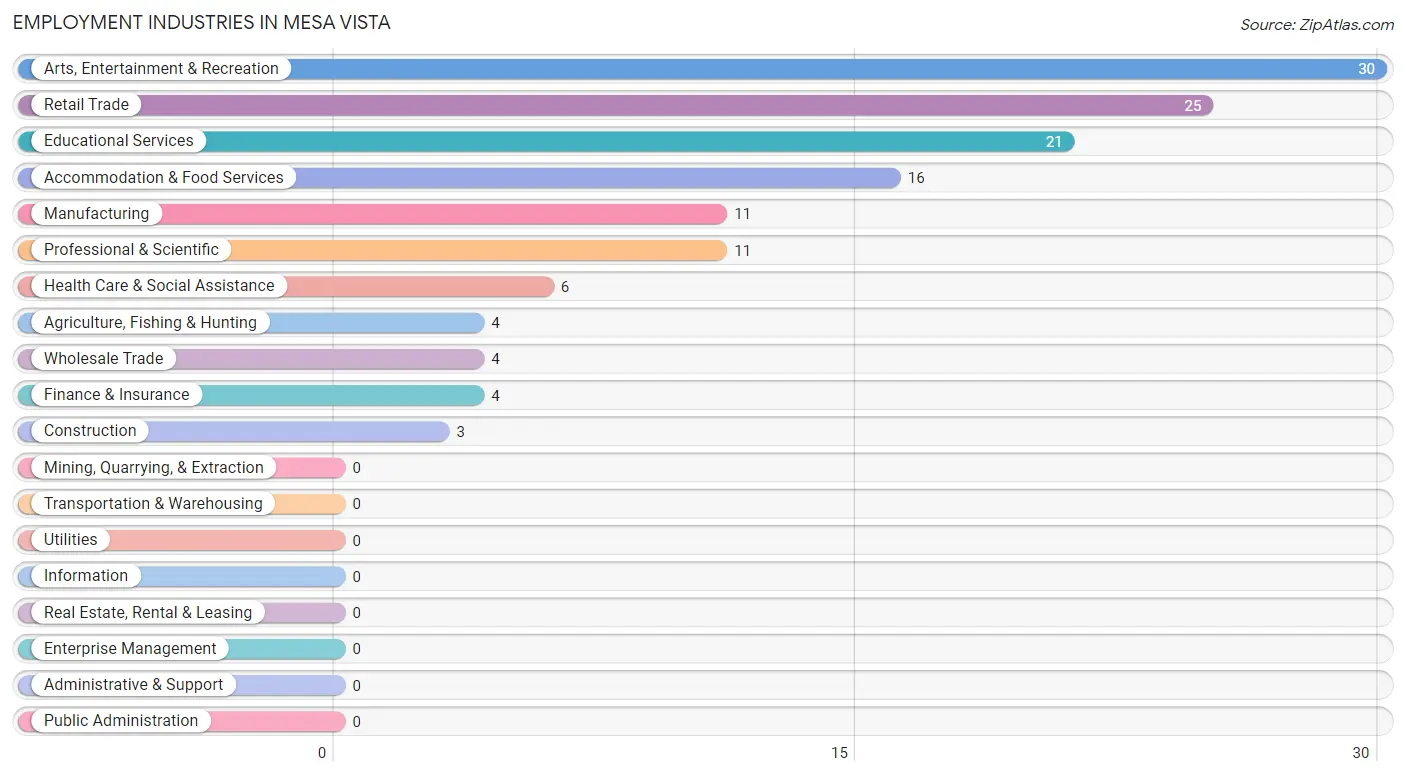
Employment Industries in Mesa Vista
The major employment industries in Mesa Vista include Arts, Entertainment & Recreation (30 | 22.2%), Retail Trade (25 | 18.5%), Educational Services (21 | 15.6%), Accommodation & Food Services (16 | 11.8%), and Manufacturing (11 | 8.2%).
Employment Industries by Sex in Mesa Vista
The Mesa Vista industries that see more men than women are Agriculture, Fishing & Hunting (100.0%), Construction (100.0%), and Wholesale Trade (100.0%), whereas the industries that tend to have a higher number of women are Health Care & Social Assistance (100.0%), Arts, Entertainment & Recreation (90.0%), and Manufacturing (63.6%).
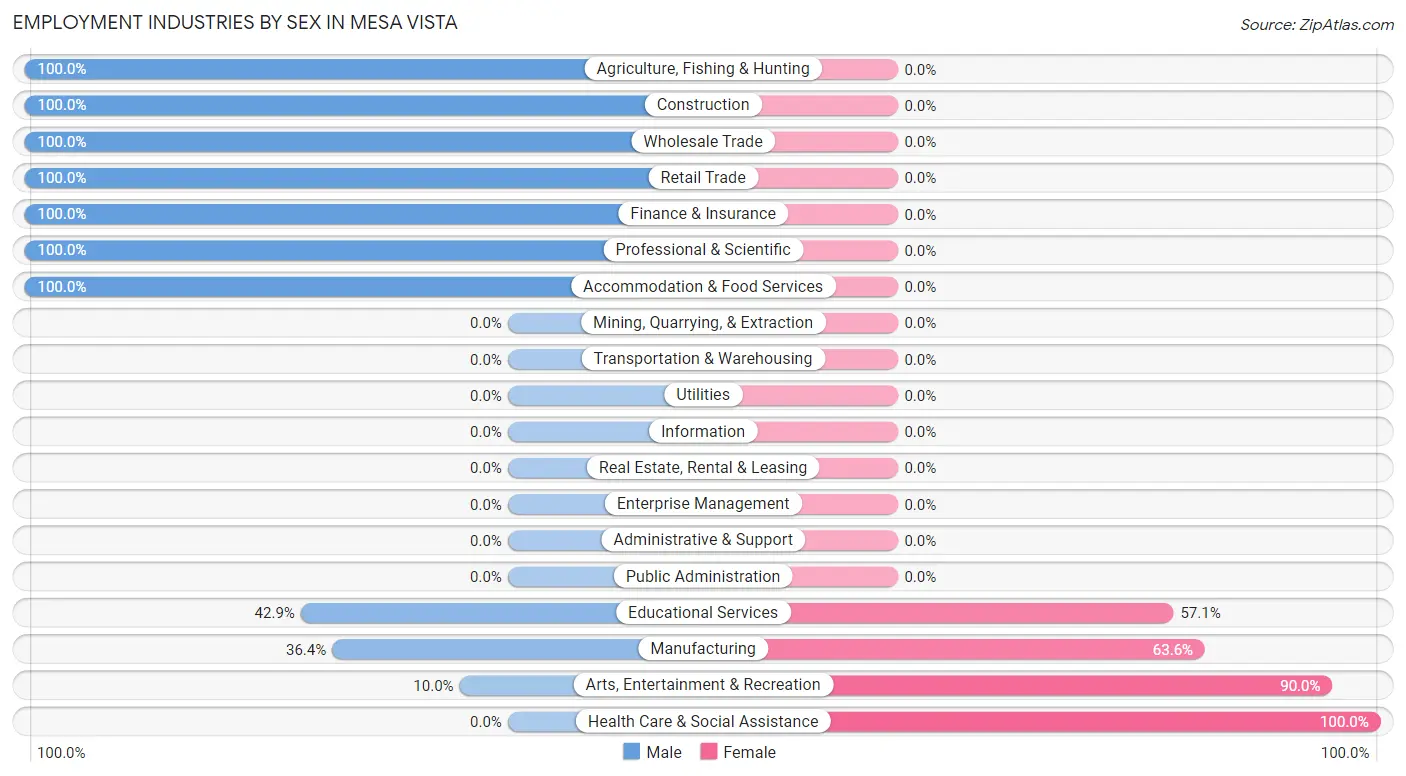
| Industry | Male | Female |
| Agriculture, Fishing & Hunting | 4 (100.0%) | 0 (0.0%) |
| Mining, Quarrying, & Extraction | 0 (0.0%) | 0 (0.0%) |
| Construction | 3 (100.0%) | 0 (0.0%) |
| Manufacturing | 4 (36.4%) | 7 (63.6%) |
| Wholesale Trade | 4 (100.0%) | 0 (0.0%) |
| Retail Trade | 25 (100.0%) | 0 (0.0%) |
| Transportation & Warehousing | 0 (0.0%) | 0 (0.0%) |
| Utilities | 0 (0.0%) | 0 (0.0%) |
| Information | 0 (0.0%) | 0 (0.0%) |
| Finance & Insurance | 4 (100.0%) | 0 (0.0%) |
| Real Estate, Rental & Leasing | 0 (0.0%) | 0 (0.0%) |
| Professional & Scientific | 11 (100.0%) | 0 (0.0%) |
| Enterprise Management | 0 (0.0%) | 0 (0.0%) |
| Administrative & Support | 0 (0.0%) | 0 (0.0%) |
| Educational Services | 9 (42.9%) | 12 (57.1%) |
| Health Care & Social Assistance | 0 (0.0%) | 6 (100.0%) |
| Arts, Entertainment & Recreation | 3 (10.0%) | 27 (90.0%) |
| Accommodation & Food Services | 16 (100.0%) | 0 (0.0%) |
| Public Administration | 0 (0.0%) | 0 (0.0%) |
| Total | 83 (61.5%) | 52 (38.5%) |
Education in Mesa Vista
School Enrollment in Mesa Vista
The most common levels of schooling among the 6 students in Mesa Vista are college / undergraduate (3 | 50.0%), high school (2 | 33.3%), and middle school (1 | 16.7%).
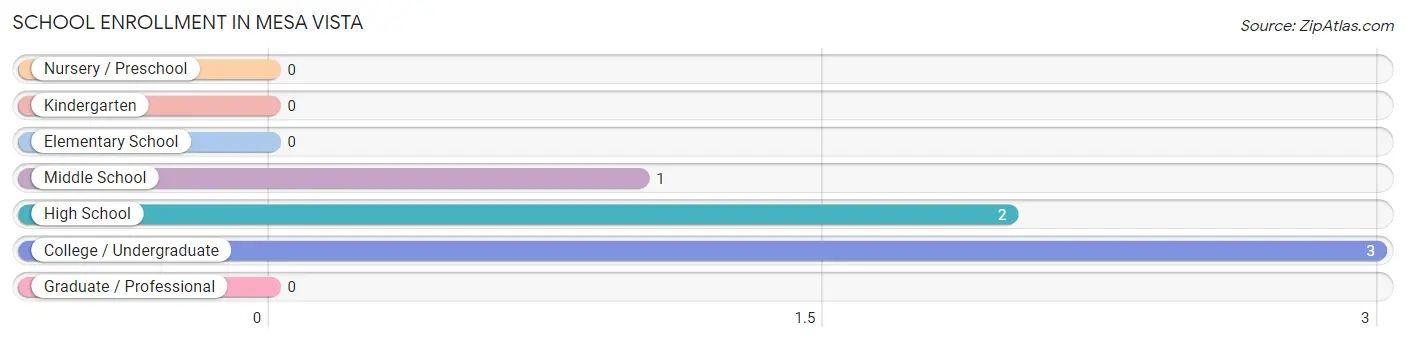
| School Level | # Students | % Students |
| Nursery / Preschool | 0 | 0.0% |
| Kindergarten | 0 | 0.0% |
| Elementary School | 0 | 0.0% |
| Middle School | 1 | 16.7% |
| High School | 2 | 33.3% |
| College / Undergraduate | 3 | 50.0% |
| Graduate / Professional | 0 | 0.0% |
| Total | 6 | 100.0% |
School Enrollment by Age by Funding Source in Mesa Vista
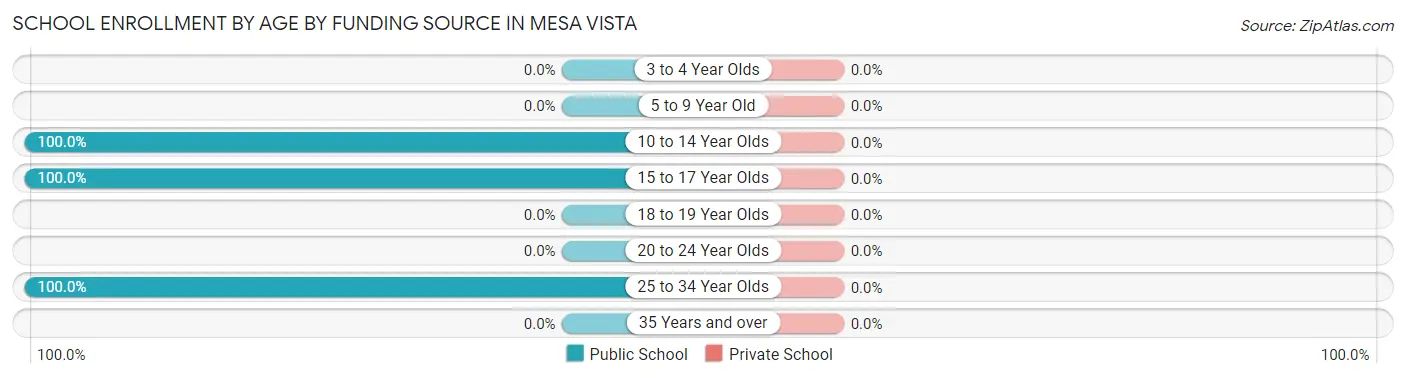
| Age Bracket | Public School | Private School |
| 3 to 4 Year Olds | 0 (0.0%) | 0 (0.0%) |
| 5 to 9 Year Old | 0 (0.0%) | 0 (0.0%) |
| 10 to 14 Year Olds | 1 (100.0%) | 0 (0.0%) |
| 15 to 17 Year Olds | 2 (100.0%) | 0 (0.0%) |
| 18 to 19 Year Olds | 0 (0.0%) | 0 (0.0%) |
| 20 to 24 Year Olds | 0 (0.0%) | 0 (0.0%) |
| 25 to 34 Year Olds | 3 (100.0%) | 0 (0.0%) |
| 35 Years and over | 0 (0.0%) | 0 (0.0%) |
| Total | 6 (100.0%) | 0 (0.0%) |
Educational Attainment by Field of Study in Mesa Vista
Visual & performing arts (27 | 29.0%), bio, nature & agricultural (19 | 20.4%), liberal arts & history (13 | 14.0%), social sciences (10 | 10.7%), and education (8 | 8.6%) are the most common fields of study among 93 individuals in Mesa Vista who have obtained a bachelor's degree or higher.
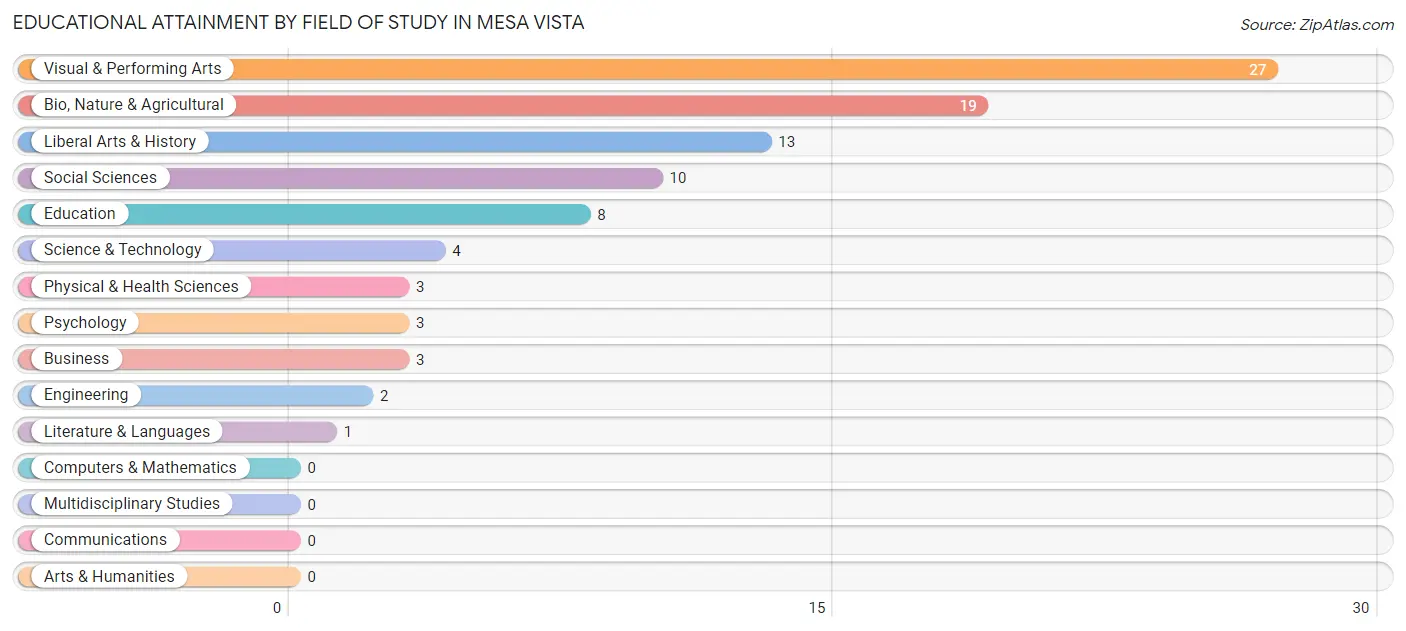
| Field of Study | # Graduates | % Graduates |
| Computers & Mathematics | 0 | 0.0% |
| Bio, Nature & Agricultural | 19 | 20.4% |
| Physical & Health Sciences | 3 | 3.2% |
| Psychology | 3 | 3.2% |
| Social Sciences | 10 | 10.7% |
| Engineering | 2 | 2.1% |
| Multidisciplinary Studies | 0 | 0.0% |
| Science & Technology | 4 | 4.3% |
| Business | 3 | 3.2% |
| Education | 8 | 8.6% |
| Literature & Languages | 1 | 1.1% |
| Liberal Arts & History | 13 | 14.0% |
| Visual & Performing Arts | 27 | 29.0% |
| Communications | 0 | 0.0% |
| Arts & Humanities | 0 | 0.0% |
| Total | 93 | 100.0% |
Transportation & Commute in Mesa Vista
Vehicle Availability by Sex in Mesa Vista
The most prevalent vehicle ownership categories in Mesa Vista are males with 5 or more vehicles (29, accounting for 37.7%) and females with 5 or more vehicles (3, making up 55.8%).
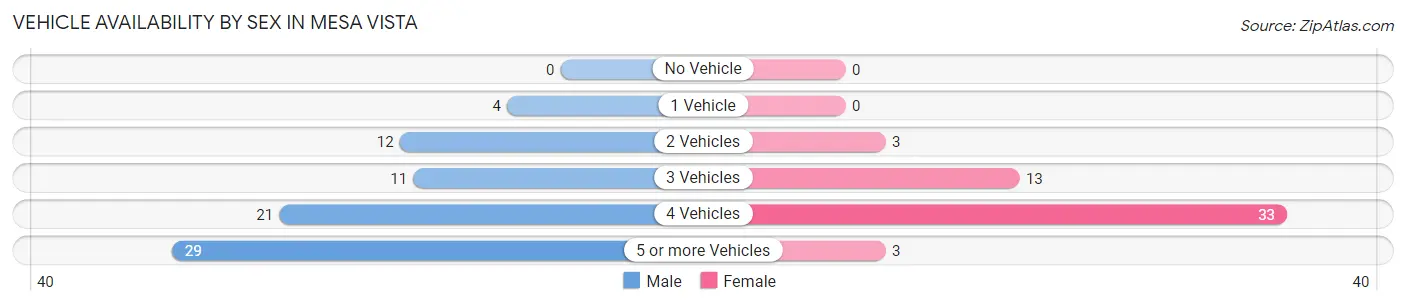
| Vehicles Available | Male | Female |
| No Vehicle | 0 (0.0%) | 0 (0.0%) |
| 1 Vehicle | 4 (5.2%) | 0 (0.0%) |
| 2 Vehicles | 12 (15.6%) | 3 (5.8%) |
| 3 Vehicles | 11 (14.3%) | 13 (25.0%) |
| 4 Vehicles | 21 (27.3%) | 33 (63.5%) |
| 5 or more Vehicles | 29 (37.7%) | 3 (5.8%) |
| Total | 77 (100.0%) | 52 (100.0%) |
Commute Time in Mesa Vista
The most frequently occuring commute durations in Mesa Vista are 30 to 34 minutes (53 commuters, 46.1%), 40 to 44 minutes (27 commuters, 23.5%), and 20 to 24 minutes (12 commuters, 10.4%).
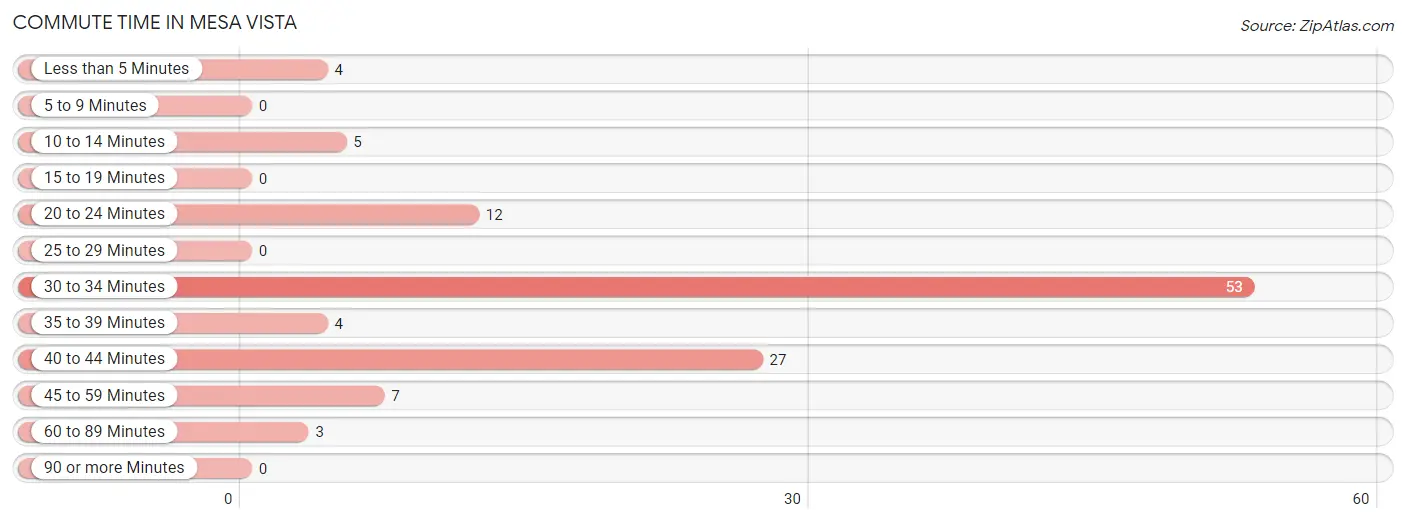
| Commute Time | # Commuters | % Commuters |
| Less than 5 Minutes | 4 | 3.5% |
| 5 to 9 Minutes | 0 | 0.0% |
| 10 to 14 Minutes | 5 | 4.3% |
| 15 to 19 Minutes | 0 | 0.0% |
| 20 to 24 Minutes | 12 | 10.4% |
| 25 to 29 Minutes | 0 | 0.0% |
| 30 to 34 Minutes | 53 | 46.1% |
| 35 to 39 Minutes | 4 | 3.5% |
| 40 to 44 Minutes | 27 | 23.5% |
| 45 to 59 Minutes | 7 | 6.1% |
| 60 to 89 Minutes | 3 | 2.6% |
| 90 or more Minutes | 0 | 0.0% |
Commute Time by Sex in Mesa Vista
The most common commute times in Mesa Vista are 30 to 34 minutes (50 commuters, 74.6%) for males and 40 to 44 minutes (27 commuters, 56.2%) for females.
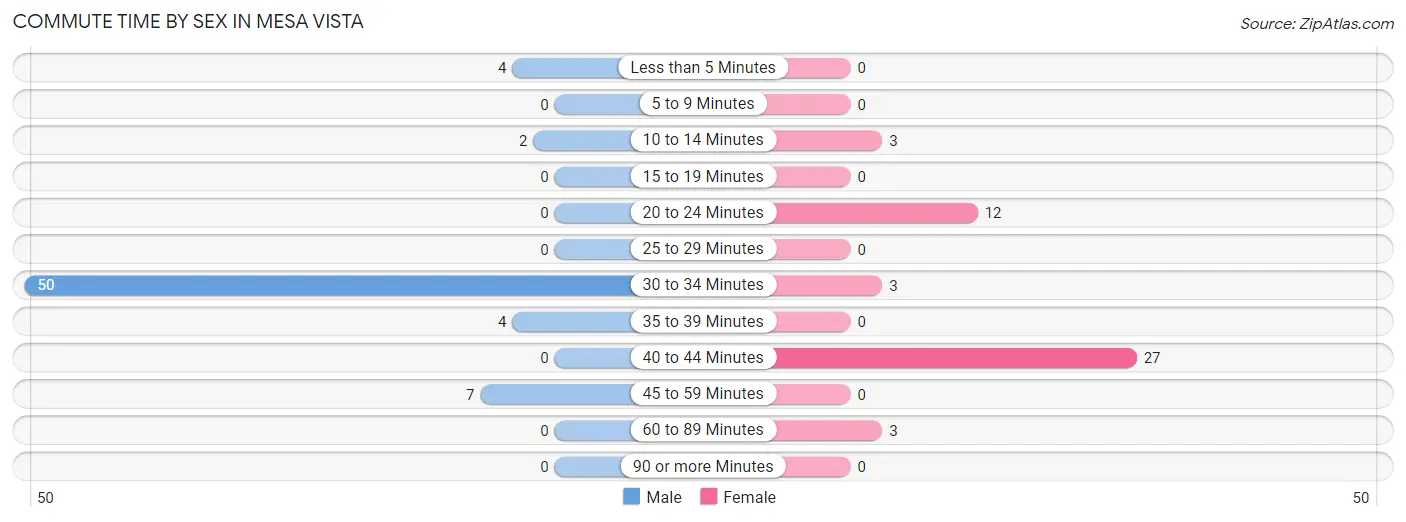
| Commute Time | Male | Female |
| Less than 5 Minutes | 4 (6.0%) | 0 (0.0%) |
| 5 to 9 Minutes | 0 (0.0%) | 0 (0.0%) |
| 10 to 14 Minutes | 2 (3.0%) | 3 (6.2%) |
| 15 to 19 Minutes | 0 (0.0%) | 0 (0.0%) |
| 20 to 24 Minutes | 0 (0.0%) | 12 (25.0%) |
| 25 to 29 Minutes | 0 (0.0%) | 0 (0.0%) |
| 30 to 34 Minutes | 50 (74.6%) | 3 (6.2%) |
| 35 to 39 Minutes | 4 (6.0%) | 0 (0.0%) |
| 40 to 44 Minutes | 0 (0.0%) | 27 (56.2%) |
| 45 to 59 Minutes | 7 (10.4%) | 0 (0.0%) |
| 60 to 89 Minutes | 0 (0.0%) | 3 (6.2%) |
| 90 or more Minutes | 0 (0.0%) | 0 (0.0%) |
Time of Departure to Work by Sex in Mesa Vista
The most frequent times of departure to work in Mesa Vista are 7:00 AM to 7:29 AM (43, 64.2%) for males and 12:00 PM to 3:59 PM (27, 56.2%) for females.
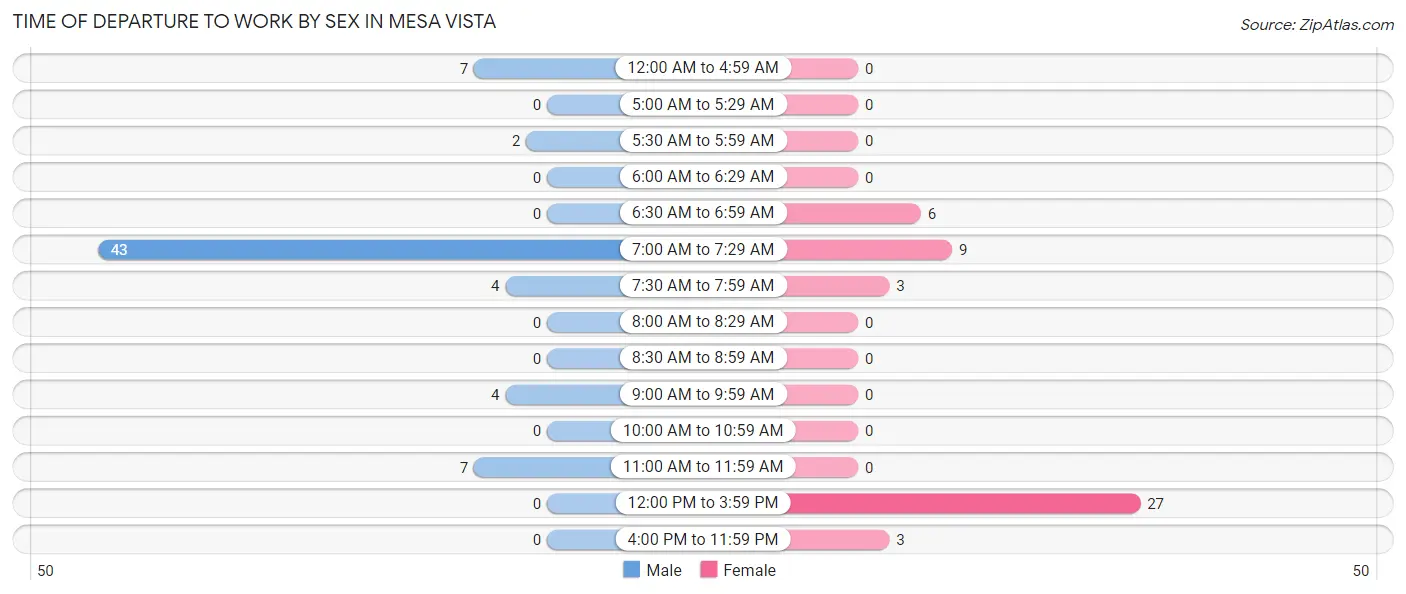
| Time of Departure | Male | Female |
| 12:00 AM to 4:59 AM | 7 (10.4%) | 0 (0.0%) |
| 5:00 AM to 5:29 AM | 0 (0.0%) | 0 (0.0%) |
| 5:30 AM to 5:59 AM | 2 (3.0%) | 0 (0.0%) |
| 6:00 AM to 6:29 AM | 0 (0.0%) | 0 (0.0%) |
| 6:30 AM to 6:59 AM | 0 (0.0%) | 6 (12.5%) |
| 7:00 AM to 7:29 AM | 43 (64.2%) | 9 (18.8%) |
| 7:30 AM to 7:59 AM | 4 (6.0%) | 3 (6.2%) |
| 8:00 AM to 8:29 AM | 0 (0.0%) | 0 (0.0%) |
| 8:30 AM to 8:59 AM | 0 (0.0%) | 0 (0.0%) |
| 9:00 AM to 9:59 AM | 4 (6.0%) | 0 (0.0%) |
| 10:00 AM to 10:59 AM | 0 (0.0%) | 0 (0.0%) |
| 11:00 AM to 11:59 AM | 7 (10.4%) | 0 (0.0%) |
| 12:00 PM to 3:59 PM | 0 (0.0%) | 27 (56.2%) |
| 4:00 PM to 11:59 PM | 0 (0.0%) | 3 (6.2%) |
| Total | 67 (100.0%) | 48 (100.0%) |
Housing Occupancy in Mesa Vista
Occupancy by Ownership in Mesa Vista
Of the total 66 dwellings in Mesa Vista, owner-occupied units account for 63 (95.5%), while renter-occupied units make up 3 (4.5%).
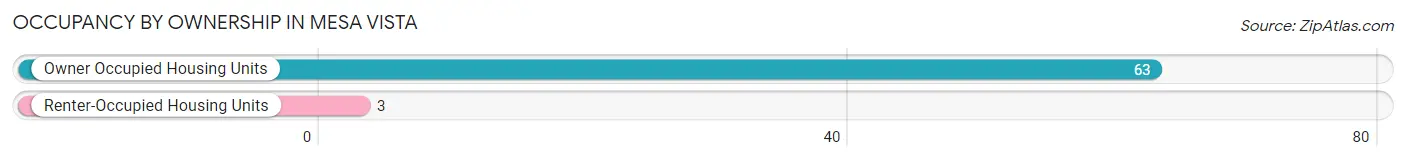
| Occupancy | # Housing Units | % Housing Units |
| Owner Occupied Housing Units | 63 | 95.5% |
| Renter-Occupied Housing Units | 3 | 4.5% |
| Total Occupied Housing Units | 66 | 100.0% |
Occupancy by Household Size in Mesa Vista
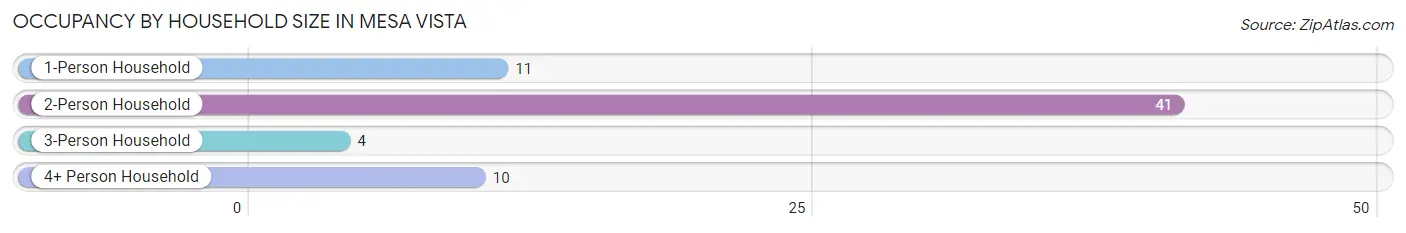
| Household Size | # Housing Units | % Housing Units |
| 1-Person Household | 11 | 16.7% |
| 2-Person Household | 41 | 62.1% |
| 3-Person Household | 4 | 6.1% |
| 4+ Person Household | 10 | 15.1% |
| Total Housing Units | 66 | 100.0% |
Occupancy by Ownership by Household Size in Mesa Vista
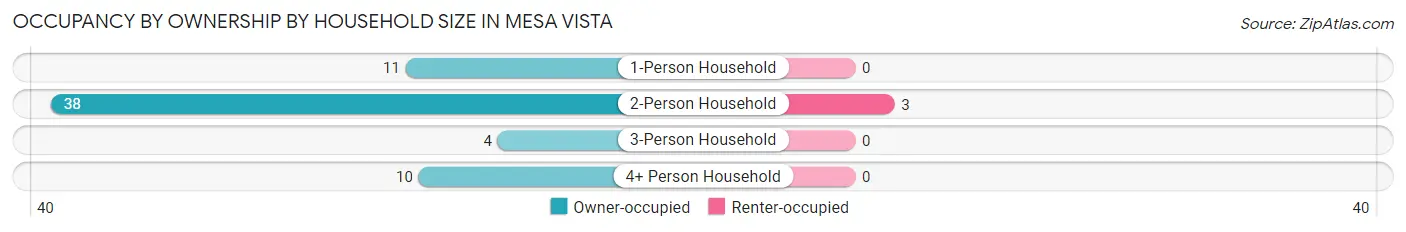
| Household Size | Owner-occupied | Renter-occupied |
| 1-Person Household | 11 (100.0%) | 0 (0.0%) |
| 2-Person Household | 38 (92.7%) | 3 (7.3%) |
| 3-Person Household | 4 (100.0%) | 0 (0.0%) |
| 4+ Person Household | 10 (100.0%) | 0 (0.0%) |
| Total Housing Units | 63 (95.5%) | 3 (4.5%) |
Occupancy by Educational Attainment in Mesa Vista
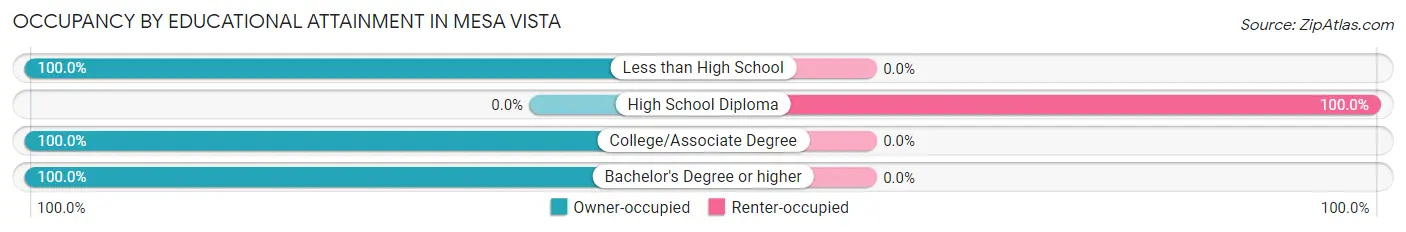
| Household Size | Owner-occupied | Renter-occupied |
| Less than High School | 4 (100.0%) | 0 (0.0%) |
| High School Diploma | 0 (0.0%) | 3 (100.0%) |
| College/Associate Degree | 19 (100.0%) | 0 (0.0%) |
| Bachelor's Degree or higher | 40 (100.0%) | 0 (0.0%) |
Occupancy by Age of Householder in Mesa Vista
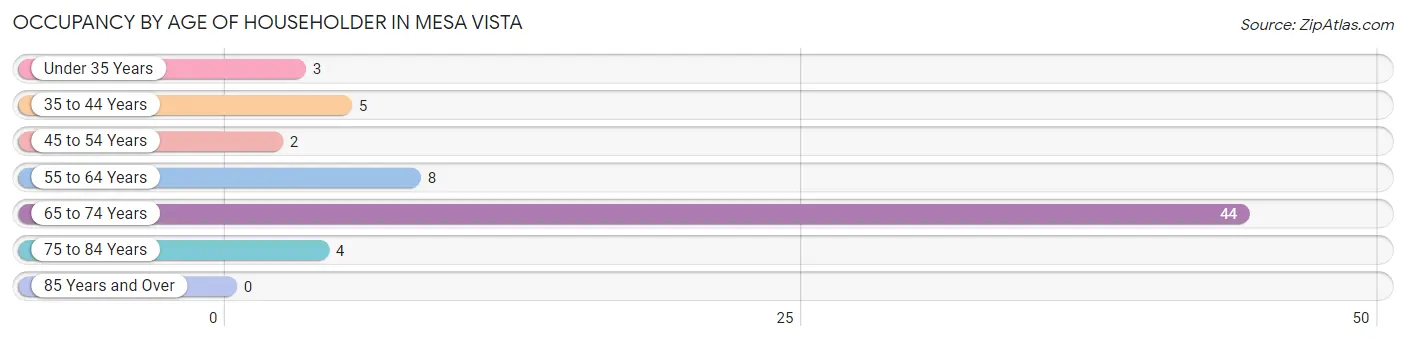
| Age Bracket | # Households | % Households |
| Under 35 Years | 3 | 4.5% |
| 35 to 44 Years | 5 | 7.6% |
| 45 to 54 Years | 2 | 3.0% |
| 55 to 64 Years | 8 | 12.1% |
| 65 to 74 Years | 44 | 66.7% |
| 75 to 84 Years | 4 | 6.1% |
| 85 Years and Over | 0 | 0.0% |
| Total | 66 | 100.0% |
Housing Finances in Mesa Vista
Median Income by Occupancy in Mesa Vista
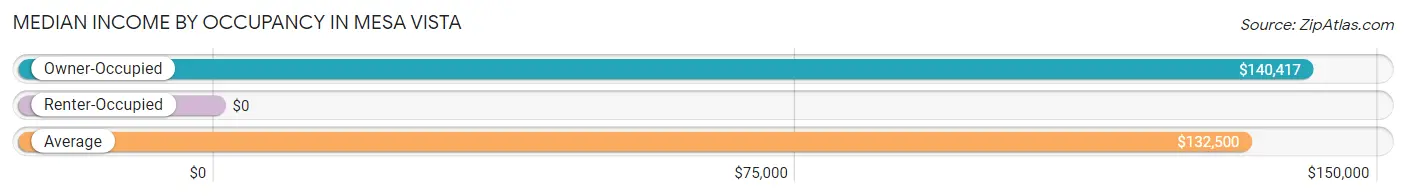
| Occupancy Type | # Households | Median Income |
| Owner-Occupied | 63 (95.5%) | $140,417 |
| Renter-Occupied | 3 (4.5%) | $0 |
| Average | 66 (100.0%) | $132,500 |
Occupancy by Householder Income Bracket in Mesa Vista
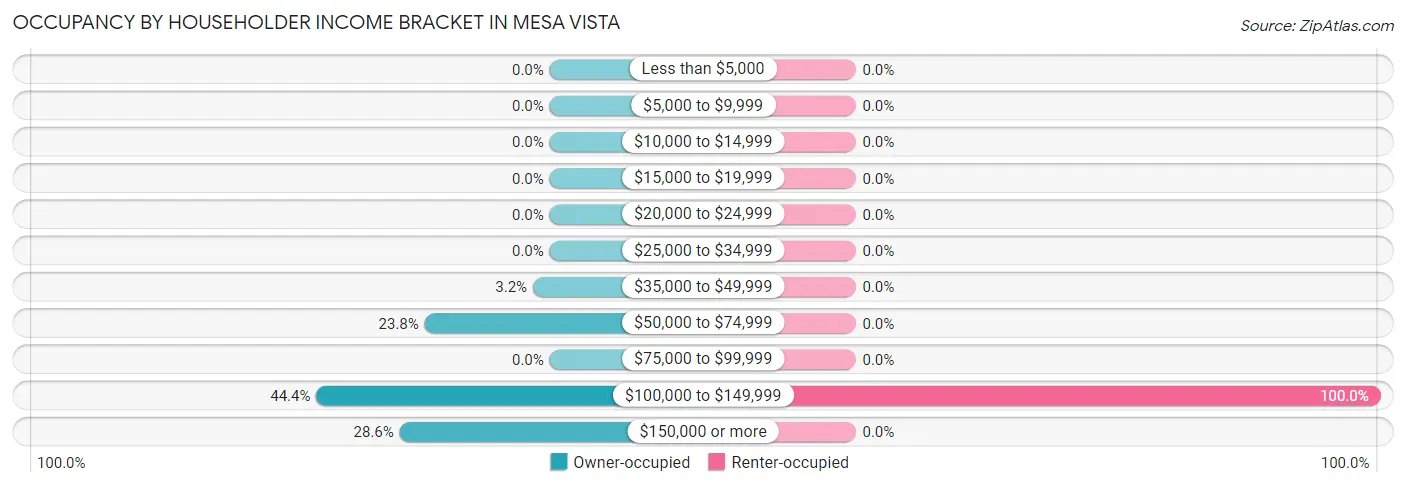
| Income Bracket | Owner-occupied | Renter-occupied |
| Less than $5,000 | 0 (0.0%) | 0 (0.0%) |
| $5,000 to $9,999 | 0 (0.0%) | 0 (0.0%) |
| $10,000 to $14,999 | 0 (0.0%) | 0 (0.0%) |
| $15,000 to $19,999 | 0 (0.0%) | 0 (0.0%) |
| $20,000 to $24,999 | 0 (0.0%) | 0 (0.0%) |
| $25,000 to $34,999 | 0 (0.0%) | 0 (0.0%) |
| $35,000 to $49,999 | 2 (3.2%) | 0 (0.0%) |
| $50,000 to $74,999 | 15 (23.8%) | 0 (0.0%) |
| $75,000 to $99,999 | 0 (0.0%) | 0 (0.0%) |
| $100,000 to $149,999 | 28 (44.4%) | 3 (100.0%) |
| $150,000 or more | 18 (28.6%) | 0 (0.0%) |
| Total | 63 (100.0%) | 3 (100.0%) |
Monthly Housing Cost Tiers in Mesa Vista
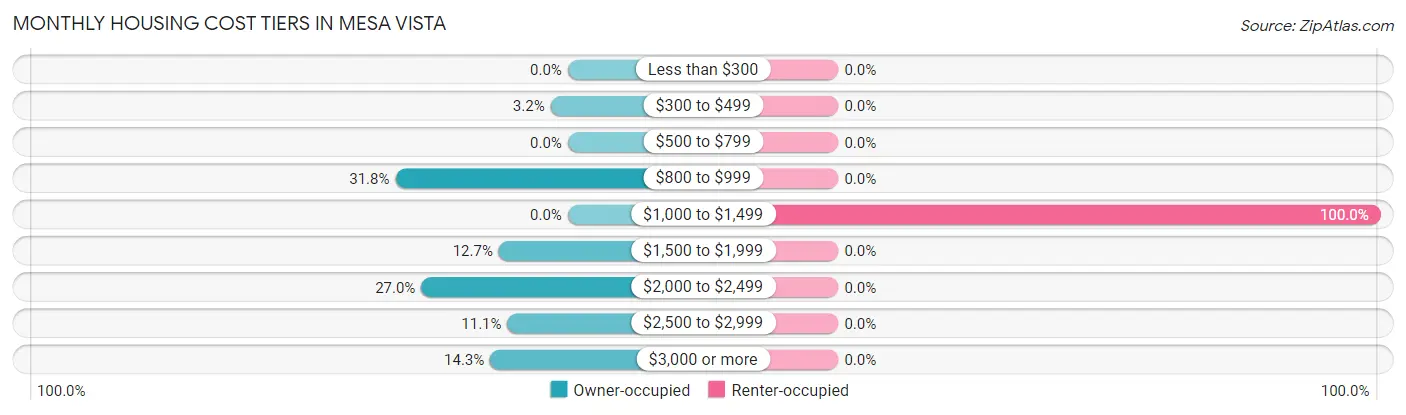
| Monthly Cost | Owner-occupied | Renter-occupied |
| Less than $300 | 0 (0.0%) | 0 (0.0%) |
| $300 to $499 | 2 (3.2%) | 0 (0.0%) |
| $500 to $799 | 0 (0.0%) | 0 (0.0%) |
| $800 to $999 | 20 (31.8%) | 0 (0.0%) |
| $1,000 to $1,499 | 0 (0.0%) | 3 (100.0%) |
| $1,500 to $1,999 | 8 (12.7%) | 0 (0.0%) |
| $2,000 to $2,499 | 17 (27.0%) | 0 (0.0%) |
| $2,500 to $2,999 | 7 (11.1%) | 0 (0.0%) |
| $3,000 or more | 9 (14.3%) | 0 (0.0%) |
| Total | 63 (100.0%) | 3 (100.0%) |
Physical Housing Characteristics in Mesa Vista
Housing Structures in Mesa Vista
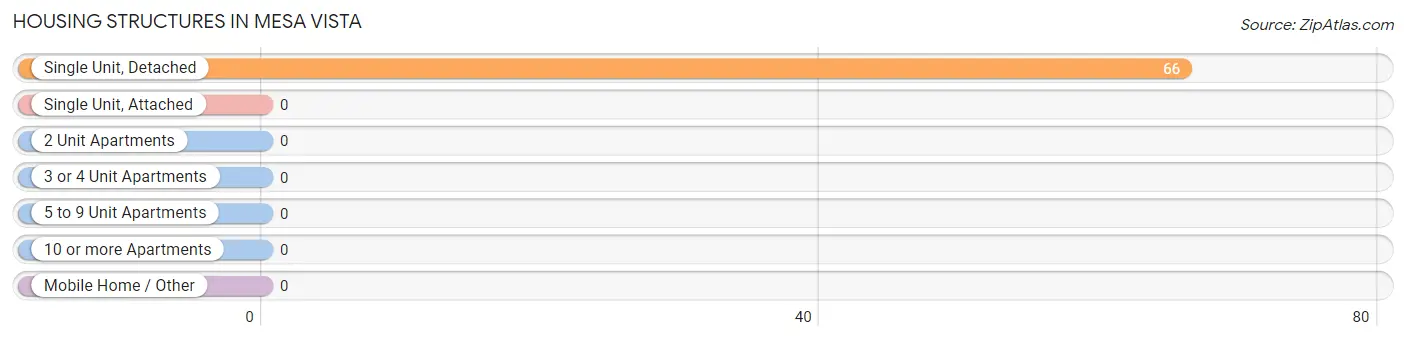
| Structure Type | # Housing Units | % Housing Units |
| Single Unit, Detached | 66 | 100.0% |
| Single Unit, Attached | 0 | 0.0% |
| 2 Unit Apartments | 0 | 0.0% |
| 3 or 4 Unit Apartments | 0 | 0.0% |
| 5 to 9 Unit Apartments | 0 | 0.0% |
| 10 or more Apartments | 0 | 0.0% |
| Mobile Home / Other | 0 | 0.0% |
| Total | 66 | 100.0% |
Housing Structures by Occupancy in Mesa Vista
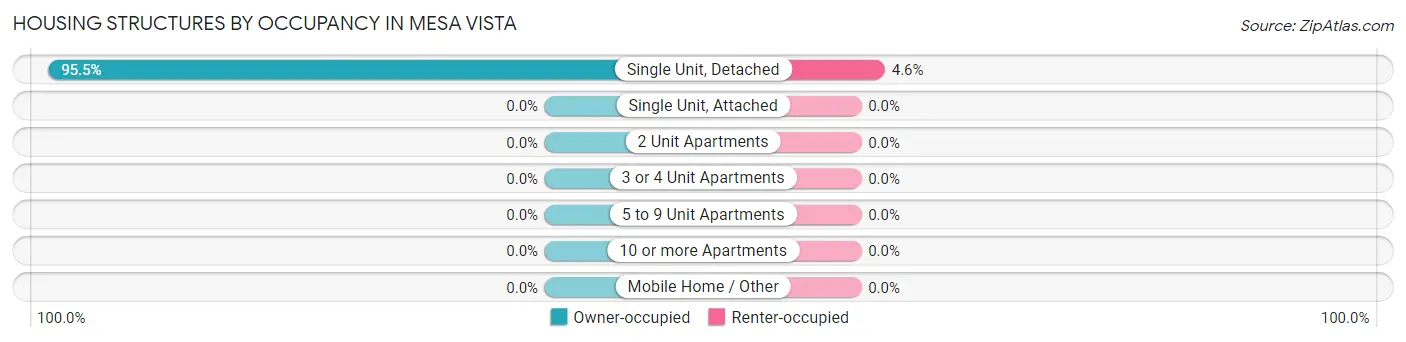
| Structure Type | Owner-occupied | Renter-occupied |
| Single Unit, Detached | 63 (95.5%) | 3 (4.5%) |
| Single Unit, Attached | 0 (0.0%) | 0 (0.0%) |
| 2 Unit Apartments | 0 (0.0%) | 0 (0.0%) |
| 3 or 4 Unit Apartments | 0 (0.0%) | 0 (0.0%) |
| 5 to 9 Unit Apartments | 0 (0.0%) | 0 (0.0%) |
| 10 or more Apartments | 0 (0.0%) | 0 (0.0%) |
| Mobile Home / Other | 0 (0.0%) | 0 (0.0%) |
| Total | 63 (95.5%) | 3 (4.5%) |
Housing Structures by Number of Rooms in Mesa Vista
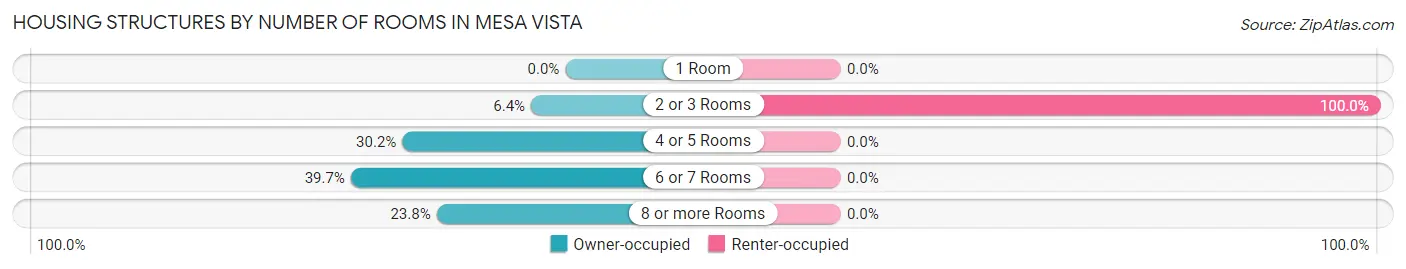
| Number of Rooms | Owner-occupied | Renter-occupied |
| 1 Room | 0 (0.0%) | 0 (0.0%) |
| 2 or 3 Rooms | 4 (6.4%) | 3 (100.0%) |
| 4 or 5 Rooms | 19 (30.2%) | 0 (0.0%) |
| 6 or 7 Rooms | 25 (39.7%) | 0 (0.0%) |
| 8 or more Rooms | 15 (23.8%) | 0 (0.0%) |
| Total | 63 (100.0%) | 3 (100.0%) |
Housing Structure by Heating Type in Mesa Vista
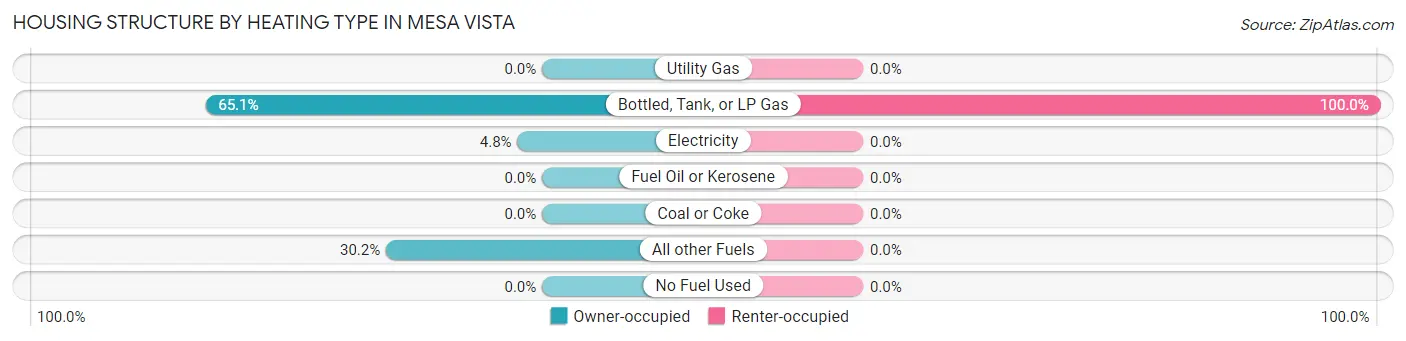
| Heating Type | Owner-occupied | Renter-occupied |
| Utility Gas | 0 (0.0%) | 0 (0.0%) |
| Bottled, Tank, or LP Gas | 41 (65.1%) | 3 (100.0%) |
| Electricity | 3 (4.8%) | 0 (0.0%) |
| Fuel Oil or Kerosene | 0 (0.0%) | 0 (0.0%) |
| Coal or Coke | 0 (0.0%) | 0 (0.0%) |
| All other Fuels | 19 (30.2%) | 0 (0.0%) |
| No Fuel Used | 0 (0.0%) | 0 (0.0%) |
| Total | 63 (100.0%) | 3 (100.0%) |
Household Vehicle Usage in Mesa Vista
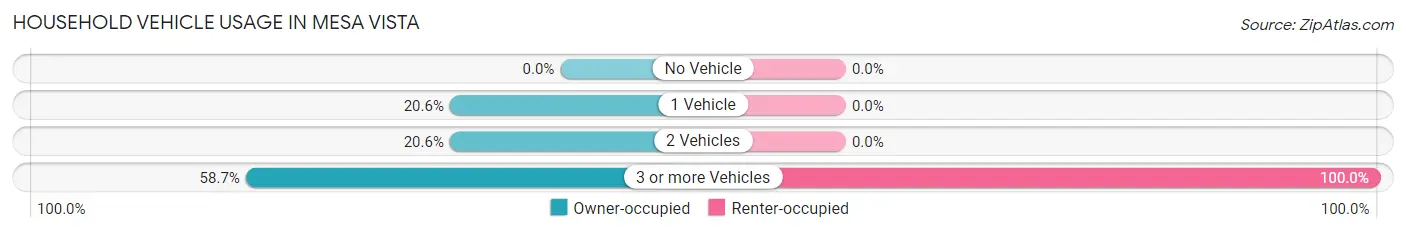
| Vehicles per Household | Owner-occupied | Renter-occupied |
| No Vehicle | 0 (0.0%) | 0 (0.0%) |
| 1 Vehicle | 13 (20.6%) | 0 (0.0%) |
| 2 Vehicles | 13 (20.6%) | 0 (0.0%) |
| 3 or more Vehicles | 37 (58.7%) | 3 (100.0%) |
| Total | 63 (100.0%) | 3 (100.0%) |
Real Estate & Mortgages in Mesa Vista
Real Estate and Mortgage Overview in Mesa Vista
| Characteristic | Without Mortgage | With Mortgage |
| Housing Units | 26 | 37 |
| Median Property Value | $700,000 | $567,300 |
| Median Household Income | $58,750 | $14 |
| Monthly Housing Costs | $869 | $9 |
| Real Estate Taxes | $3,917 | $0 |
Property Value by Mortgage Status in Mesa Vista
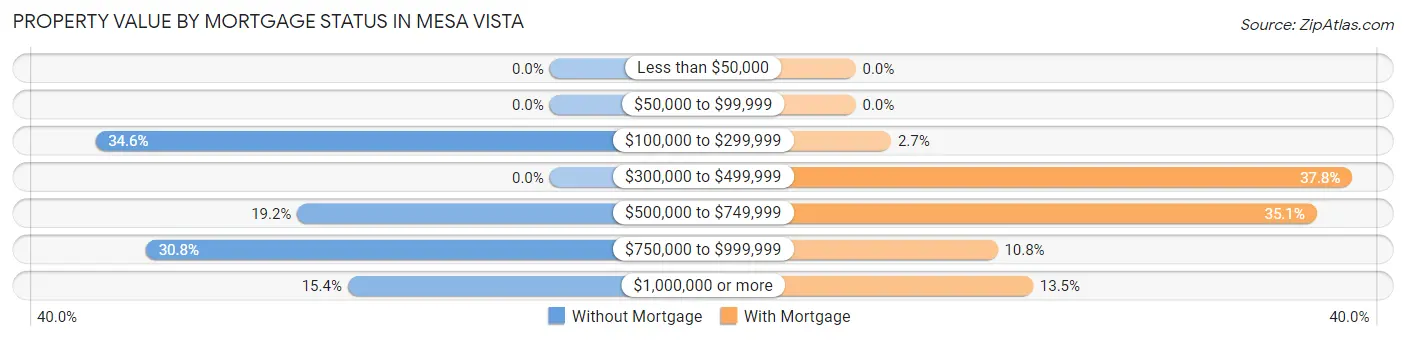
| Property Value | Without Mortgage | With Mortgage |
| Less than $50,000 | 0 (0.0%) | 0 (0.0%) |
| $50,000 to $99,999 | 0 (0.0%) | 0 (0.0%) |
| $100,000 to $299,999 | 9 (34.6%) | 1 (2.7%) |
| $300,000 to $499,999 | 0 (0.0%) | 14 (37.8%) |
| $500,000 to $749,999 | 5 (19.2%) | 13 (35.1%) |
| $750,000 to $999,999 | 8 (30.8%) | 4 (10.8%) |
| $1,000,000 or more | 4 (15.4%) | 5 (13.5%) |
| Total | 26 (100.0%) | 37 (100.0%) |
Household Income by Mortgage Status in Mesa Vista
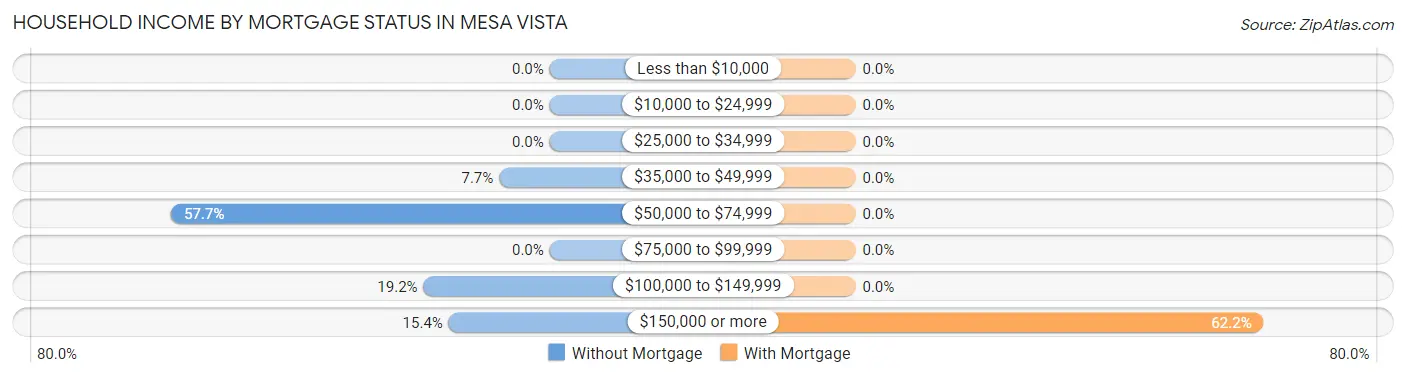
| Household Income | Without Mortgage | With Mortgage |
| Less than $10,000 | 0 (0.0%) | 0 (0.0%) |
| $10,000 to $24,999 | 0 (0.0%) | 0 (0.0%) |
| $25,000 to $34,999 | 0 (0.0%) | 0 (0.0%) |
| $35,000 to $49,999 | 2 (7.7%) | 0 (0.0%) |
| $50,000 to $74,999 | 15 (57.7%) | 0 (0.0%) |
| $75,000 to $99,999 | 0 (0.0%) | 0 (0.0%) |
| $100,000 to $149,999 | 5 (19.2%) | 0 (0.0%) |
| $150,000 or more | 4 (15.4%) | 23 (62.2%) |
| Total | 26 (100.0%) | 37 (100.0%) |
Property Value to Household Income Ratio in Mesa Vista
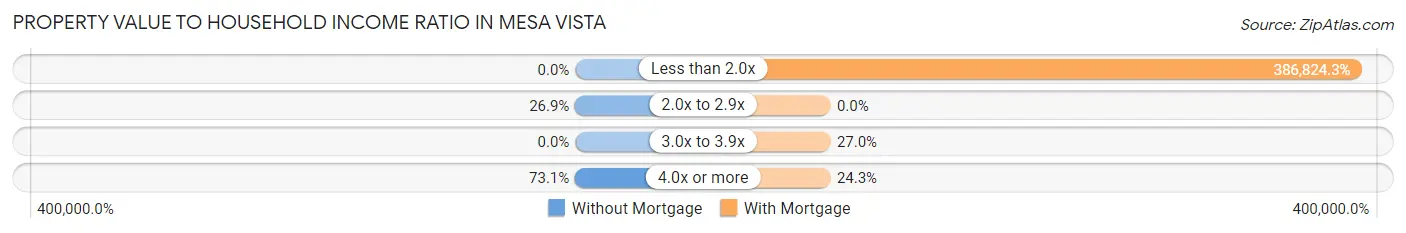
| Value-to-Income Ratio | Without Mortgage | With Mortgage |
| Less than 2.0x | 0 (0.0%) | 143,125 (386,824.3%) |
| 2.0x to 2.9x | 7 (26.9%) | 0 (0.0%) |
| 3.0x to 3.9x | 0 (0.0%) | 10 (27.0%) |
| 4.0x or more | 19 (73.1%) | 9 (24.3%) |
| Total | 26 (100.0%) | 37 (100.0%) |
Real Estate Taxes by Mortgage Status in Mesa Vista
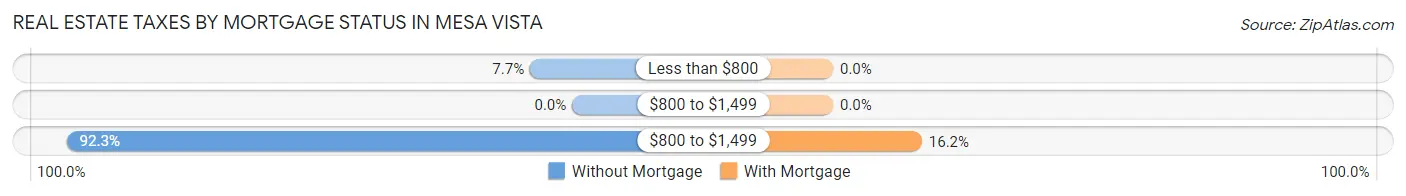
| Property Taxes | Without Mortgage | With Mortgage |
| Less than $800 | 2 (7.7%) | 0 (0.0%) |
| $800 to $1,499 | 0 (0.0%) | 0 (0.0%) |
| $800 to $1,499 | 24 (92.3%) | 6 (16.2%) |
| Total | 26 (100.0%) | 37 (100.0%) |
Health & Disability in Mesa Vista
Health Insurance Coverage by Age in Mesa Vista
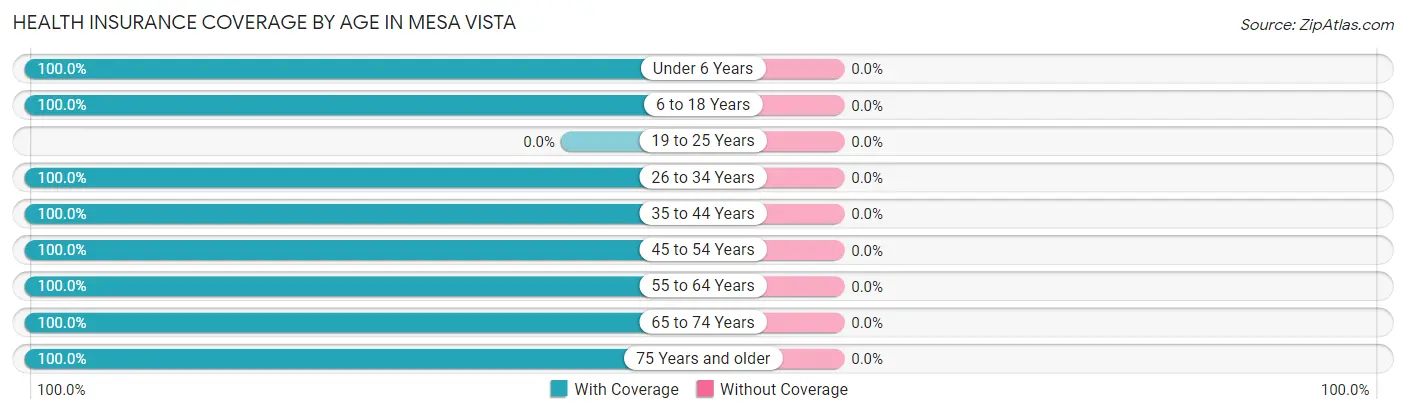
| Age Bracket | With Coverage | Without Coverage |
| Under 6 Years | 32 (100.0%) | 0 (0.0%) |
| 6 to 18 Years | 3 (100.0%) | 0 (0.0%) |
| 19 to 25 Years | 0 (0.0%) | 0 (0.0%) |
| 26 to 34 Years | 31 (100.0%) | 0 (0.0%) |
| 35 to 44 Years | 55 (100.0%) | 0 (0.0%) |
| 45 to 54 Years | 3 (100.0%) | 0 (0.0%) |
| 55 to 64 Years | 18 (100.0%) | 0 (0.0%) |
| 65 to 74 Years | 100 (100.0%) | 0 (0.0%) |
| 75 Years and older | 4 (100.0%) | 0 (0.0%) |
| Total | 246 (100.0%) | 0 (0.0%) |
Health Insurance Coverage by Citizenship Status in Mesa Vista

| Citizenship Status | With Coverage | Without Coverage |
| Native Born | 32 (100.0%) | 0 (0.0%) |
| Foreign Born, Citizen | 3 (100.0%) | 0 (0.0%) |
| Foreign Born, not a Citizen | 0 (0.0%) | 0 (0.0%) |
Health Insurance Coverage by Household Income in Mesa Vista
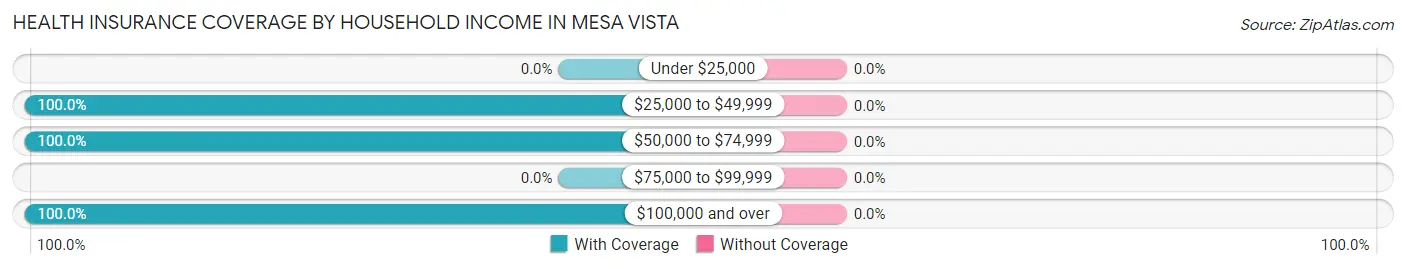
| Household Income | With Coverage | Without Coverage |
| Under $25,000 | 0 (0.0%) | 0 (0.0%) |
| $25,000 to $49,999 | 25 (100.0%) | 0 (0.0%) |
| $50,000 to $74,999 | 24 (100.0%) | 0 (0.0%) |
| $75,000 to $99,999 | 0 (0.0%) | 0 (0.0%) |
| $100,000 and over | 197 (100.0%) | 0 (0.0%) |
Public vs Private Health Insurance Coverage by Age in Mesa Vista
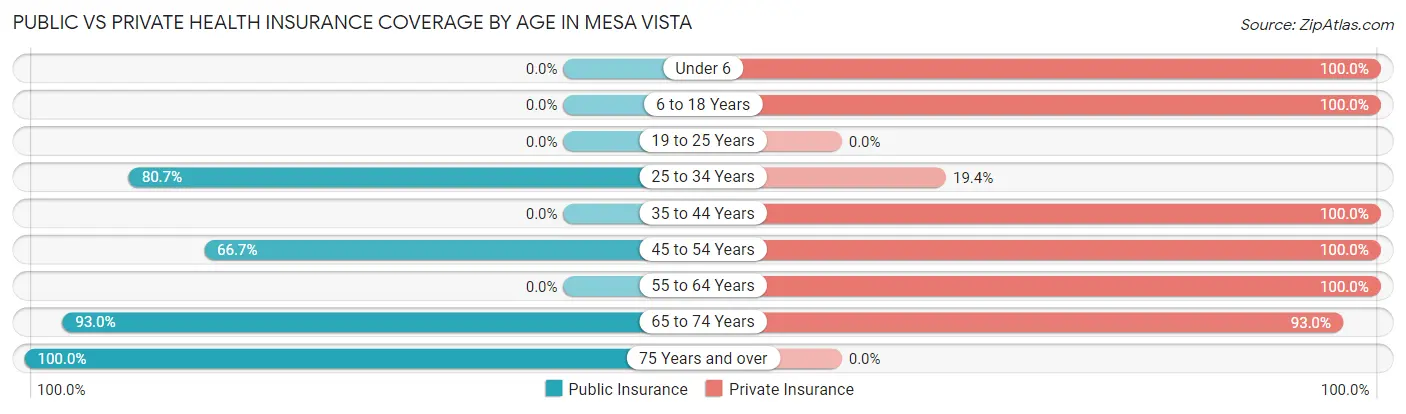
| Age Bracket | Public Insurance | Private Insurance |
| Under 6 | 0 (0.0%) | 32 (100.0%) |
| 6 to 18 Years | 0 (0.0%) | 3 (100.0%) |
| 19 to 25 Years | 0 (0.0%) | 0 (0.0%) |
| 25 to 34 Years | 25 (80.6%) | 6 (19.4%) |
| 35 to 44 Years | 0 (0.0%) | 55 (100.0%) |
| 45 to 54 Years | 2 (66.7%) | 3 (100.0%) |
| 55 to 64 Years | 0 (0.0%) | 18 (100.0%) |
| 65 to 74 Years | 93 (93.0%) | 93 (93.0%) |
| 75 Years and over | 4 (100.0%) | 0 (0.0%) |
| Total | 124 (50.4%) | 210 (85.4%) |
Disability Status by Sex by Age in Mesa Vista
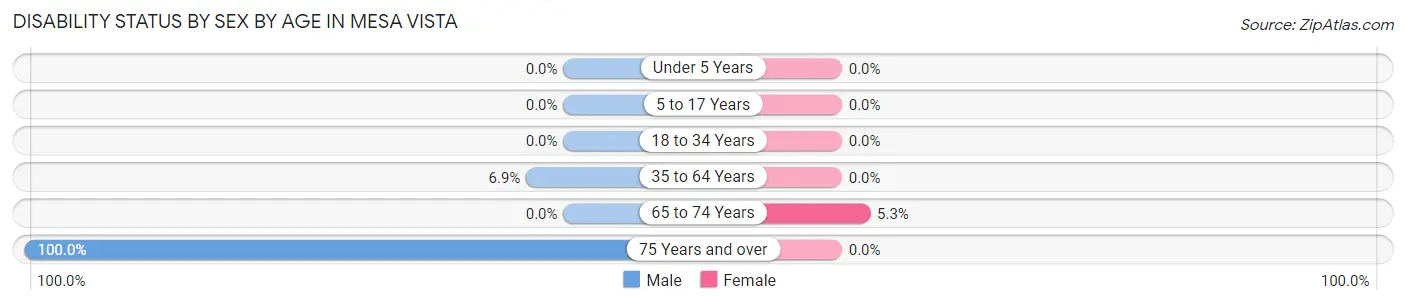
| Age Bracket | Male | Female |
| Under 5 Years | 0 (0.0%) | 0 (0.0%) |
| 5 to 17 Years | 0 (0.0%) | 0 (0.0%) |
| 18 to 34 Years | 0 (0.0%) | 0 (0.0%) |
| 35 to 64 Years | 2 (6.9%) | 0 (0.0%) |
| 65 to 74 Years | 0 (0.0%) | 3 (5.3%) |
| 75 Years and over | 4 (100.0%) | 0 (0.0%) |
Disability Class by Sex by Age in Mesa Vista
Disability Class: Hearing Difficulty
| Age Bracket | Male | Female |
| Under 5 Years | 0 (0.0%) | 0 (0.0%) |
| 5 to 17 Years | 0 (0.0%) | 0 (0.0%) |
| 18 to 34 Years | 0 (0.0%) | 0 (0.0%) |
| 35 to 64 Years | 0 (0.0%) | 0 (0.0%) |
| 65 to 74 Years | 0 (0.0%) | 0 (0.0%) |
| 75 Years and over | 0 (0.0%) | 0 (0.0%) |
Disability Class: Vision Difficulty
| Age Bracket | Male | Female |
| Under 5 Years | 0 (0.0%) | 0 (0.0%) |
| 5 to 17 Years | 0 (0.0%) | 0 (0.0%) |
| 18 to 34 Years | 0 (0.0%) | 0 (0.0%) |
| 35 to 64 Years | 0 (0.0%) | 0 (0.0%) |
| 65 to 74 Years | 0 (0.0%) | 0 (0.0%) |
| 75 Years and over | 0 (0.0%) | 0 (0.0%) |
Disability Class: Cognitive Difficulty
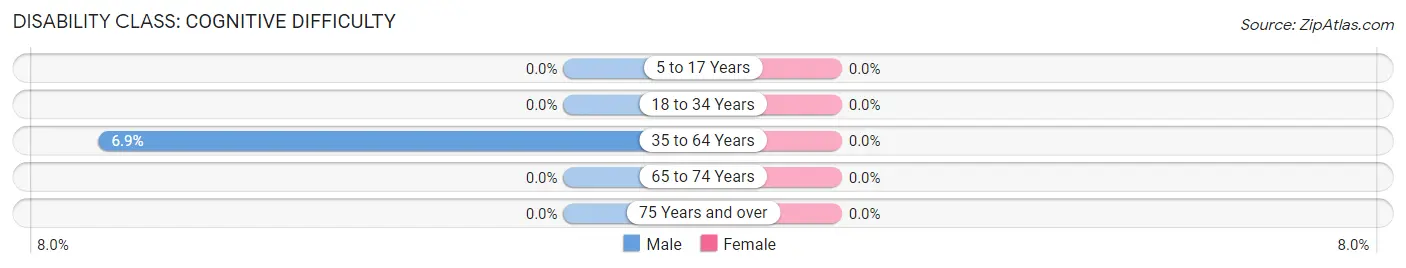
| Age Bracket | Male | Female |
| 5 to 17 Years | 0 (0.0%) | 0 (0.0%) |
| 18 to 34 Years | 0 (0.0%) | 0 (0.0%) |
| 35 to 64 Years | 2 (6.9%) | 0 (0.0%) |
| 65 to 74 Years | 0 (0.0%) | 0 (0.0%) |
| 75 Years and over | 0 (0.0%) | 0 (0.0%) |
Disability Class: Ambulatory Difficulty
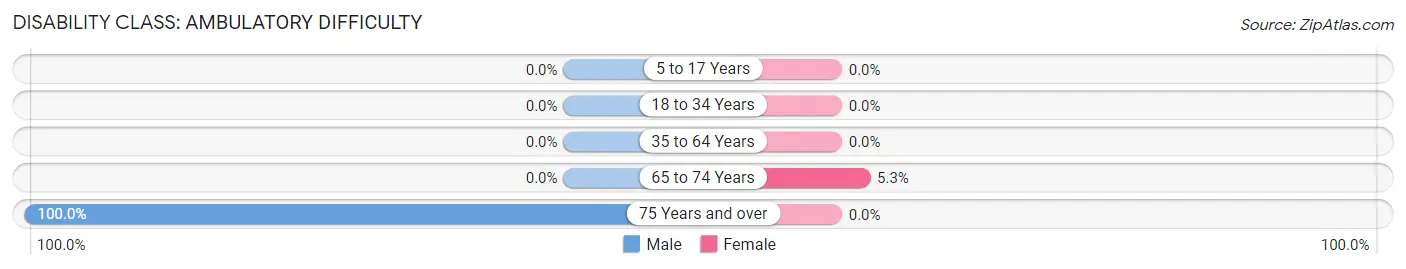
| Age Bracket | Male | Female |
| 5 to 17 Years | 0 (0.0%) | 0 (0.0%) |
| 18 to 34 Years | 0 (0.0%) | 0 (0.0%) |
| 35 to 64 Years | 0 (0.0%) | 0 (0.0%) |
| 65 to 74 Years | 0 (0.0%) | 3 (5.3%) |
| 75 Years and over | 4 (100.0%) | 0 (0.0%) |
Disability Class: Self-Care Difficulty
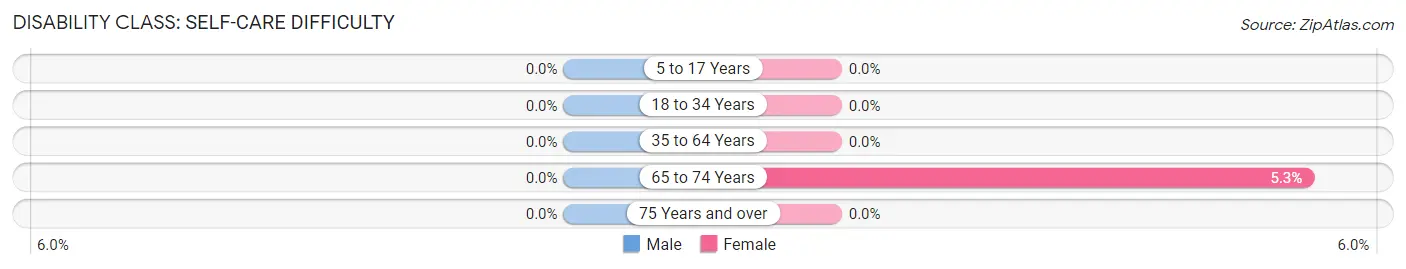
| Age Bracket | Male | Female |
| 5 to 17 Years | 0 (0.0%) | 0 (0.0%) |
| 18 to 34 Years | 0 (0.0%) | 0 (0.0%) |
| 35 to 64 Years | 0 (0.0%) | 0 (0.0%) |
| 65 to 74 Years | 0 (0.0%) | 3 (5.3%) |
| 75 Years and over | 0 (0.0%) | 0 (0.0%) |
Technology Access in Mesa Vista
Computing Device Access in Mesa Vista
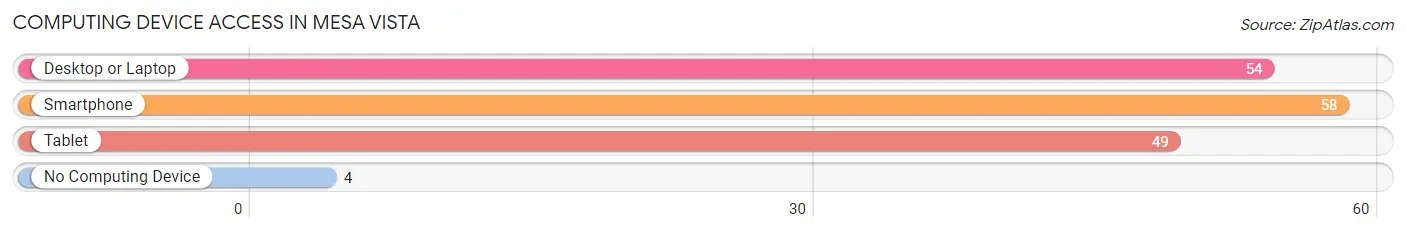
| Device Type | # Households | % Households |
| Desktop or Laptop | 54 | 81.8% |
| Smartphone | 58 | 87.9% |
| Tablet | 49 | 74.2% |
| No Computing Device | 4 | 6.1% |
| Total | 66 | 100.0% |
Internet Access in Mesa Vista
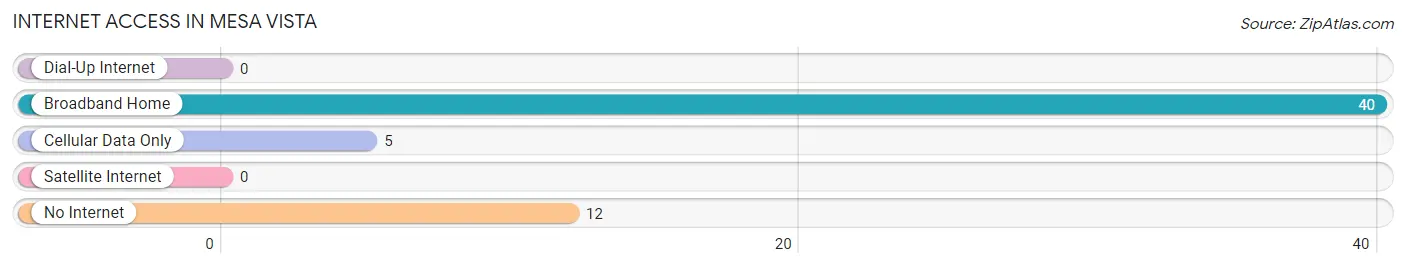
| Internet Type | # Households | % Households |
| Dial-Up Internet | 0 | 0.0% |
| Broadband Home | 40 | 60.6% |
| Cellular Data Only | 5 | 7.6% |
| Satellite Internet | 0 | 0.0% |
| No Internet | 12 | 18.2% |
| Total | 66 | 100.0% |
Mesa Vista Summary
Mesa Vista is a small unincorporated community located in San Diego County, California. It is situated in the foothills of the Laguna Mountains, approximately 25 miles east of San Diego. The community is home to a population of approximately 1,000 people, and is known for its rural atmosphere and scenic views.
History
Mesa Vista was first settled in the late 1800s by ranchers and farmers. The area was originally part of the Rancho Jamul Mexican land grant, and was later divided into several smaller parcels. In the early 1900s, the area was home to a number of small farms and ranches, and was known for its production of citrus fruits, avocados, and other crops.
In the 1950s, the area began to experience rapid growth as more people moved to the area. The population of Mesa Vista increased from just over 200 people in 1950 to nearly 1,000 people by 2000. During this time, the community also saw the development of several new neighborhoods and businesses.
Geography
Mesa Vista is located in the foothills of the Laguna Mountains, approximately 25 miles east of San Diego. The community is situated at an elevation of approximately 1,500 feet, and is surrounded by rolling hills and open space. The area is known for its scenic views of the surrounding mountains and valleys.
The climate in Mesa Vista is mild and temperate, with average temperatures ranging from the mid-50s to the mid-70s throughout the year. The area receives an average of 12 inches of rain per year, and is known for its sunny days and cool nights.
Economy
Mesa Vista is primarily a residential community, and the majority of its residents are employed in the nearby cities of San Diego and El Cajon. The area is also home to a number of small businesses, including restaurants, retail stores, and service providers.
The local economy is largely driven by tourism, as the area is known for its scenic views and outdoor activities. The nearby Cleveland National Forest and Anza-Borrego Desert State Park attract visitors from all over the world.
Demographics
As of the 2010 census, the population of Mesa Vista was 1,037. The racial makeup of the community was 79.3% White, 0.7% African American, 0.7% Native American, 0.7% Asian, 0.2% Pacific Islander, and 17.2% from other races. The median household income was $50,000, and the median age was 40.
Mesa Vista is a small, close-knit community with a strong sense of community. The area is known for its rural atmosphere and scenic views, and is a popular destination for outdoor enthusiasts.
Common Questions
What is Per Capita Income in Mesa Vista?
Per Capita income in Mesa Vista is $79,559.
What is the Median Family Income in Mesa Vista?
Median Family Income in Mesa Vista is $123,750.
What is the Median Household income in Mesa Vista?
Median Household Income in Mesa Vista is $132,500.
What is Inequality or Gini Index in Mesa Vista?
Inequality or Gini Index in Mesa Vista is 0.47.
What is the Total Population of Mesa Vista?
Total Population of Mesa Vista is 246.
What is the Total Male Population of Mesa Vista?
Total Male Population of Mesa Vista is 127.
What is the Total Female Population of Mesa Vista?
Total Female Population of Mesa Vista is 119.
What is the Ratio of Males per 100 Females in Mesa Vista?
There are 106.72 Males per 100 Females in Mesa Vista.
What is the Ratio of Females per 100 Males in Mesa Vista?
There are 93.70 Females per 100 Males in Mesa Vista.
What is the Median Population Age in Mesa Vista?
Median Population Age in Mesa Vista is 46.5 Years.
What is the Average Family Size in Mesa Vista
Average Family Size in Mesa Vista is 4.4 People.
What is the Average Household Size in Mesa Vista
Average Household Size in Mesa Vista is 3.7 People.
How Large is the Labor Force in Mesa Vista?
There are 140 People in the Labor Forcein in Mesa Vista.
What is the Percentage of People in the Labor Force in Mesa Vista?
66.4% of People are in the Labor Force in Mesa Vista.
What is the Unemployment Rate in Mesa Vista?
Unemployment Rate in Mesa Vista is 3.6%.