Cities with the Highest Percentage of Population with a Degree in Visual and Performing Arts in Maryland
RELATED REPORTS & OPTIONS
Visual and Performing Arts
Maryland
Compare Cities
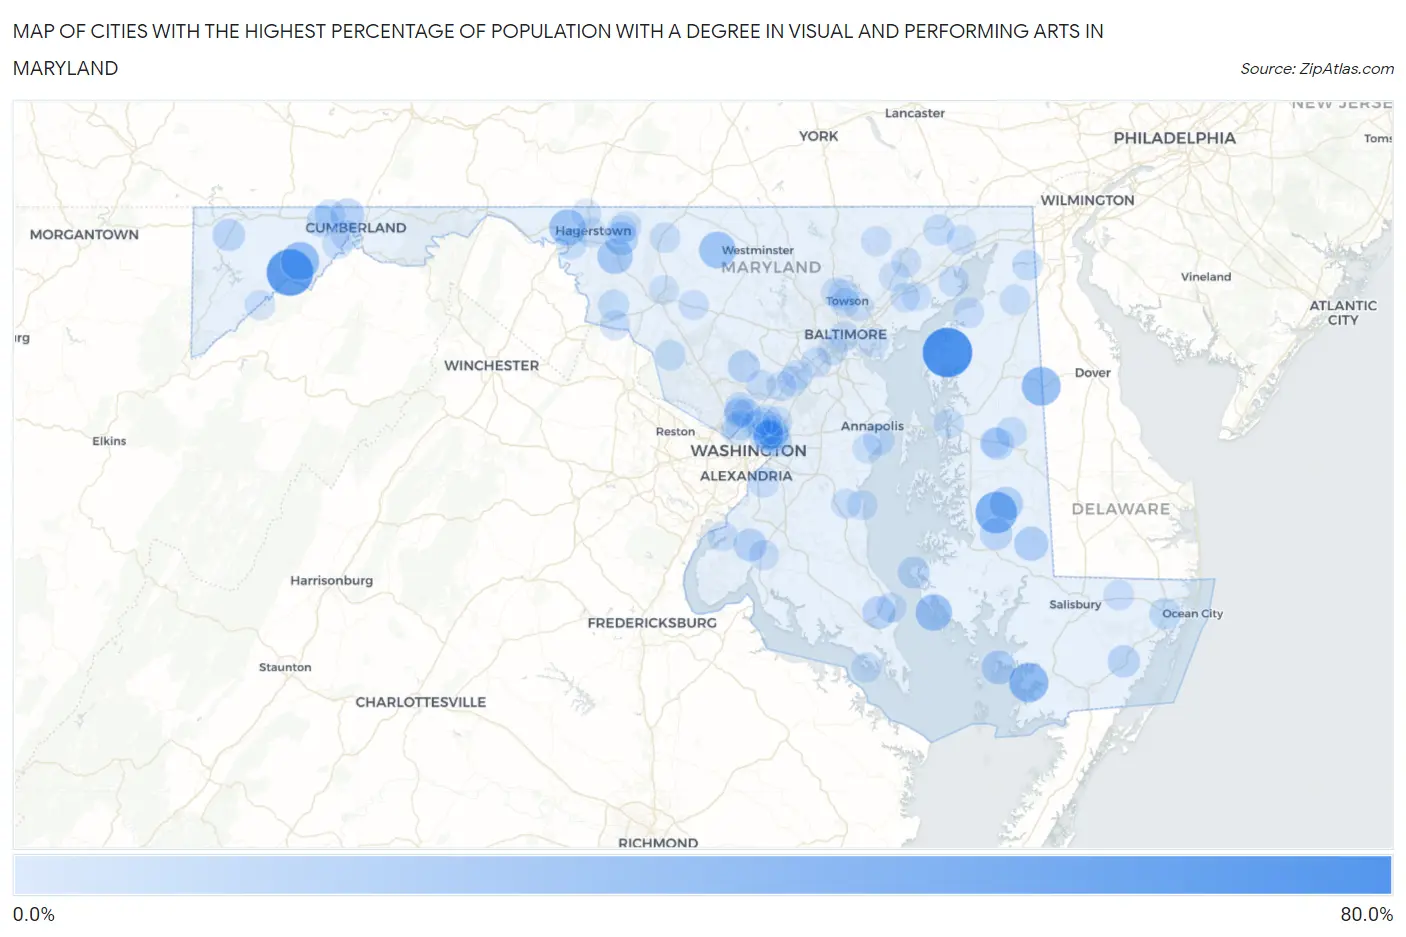
Map of Cities with the Highest Percentage of Population with a Degree in Visual and Performing Arts in Maryland
0.0%
80.0%
Cities with the Highest Percentage of Population with a Degree in Visual and Performing Arts in Maryland
| City | % Graduates | vs State | vs National | |
| 1. | Fairlee | 77.8% | 3.8%(+74.0)#1 | 4.3%(+73.5)#56 |
| 2. | Franklin | 66.7% | 3.8%(+62.8)#2 | 4.3%(+62.4)#63 |
| 3. | Choptank | 47.1% | 3.8%(+43.2)#3 | 4.3%(+42.8)#141 |
| 4. | Fairmount | 38.4% | 3.8%(+34.5)#4 | 4.3%(+34.1)#187 |
| 5. | Marydel | 37.5% | 3.8%(+33.7)#5 | 4.3%(+33.2)#199 |
| 6. | Moscow | 35.3% | 3.8%(+31.5)#6 | 4.3%(+31.0)#222 |
| 7. | Still Pond | 35.0% | 3.8%(+31.2)#7 | 4.3%(+30.7)#229 |
| 8. | Union Bridge | 29.1% | 3.8%(+25.3)#8 | 4.3%(+24.9)#327 |
| 9. | Fishing Creek | 28.9% | 3.8%(+25.1)#9 | 4.3%(+24.7)#331 |
| 10. | Wilson Conococheague | 28.1% | 3.8%(+24.3)#10 | 4.3%(+23.8)#355 |
| 11. | Mount Lena | 25.0% | 3.8%(+21.2)#11 | 4.3%(+20.7)#424 |
| 12. | Deal Island | 20.0% | 3.8%(+16.2)#12 | 4.3%(+15.7)#630 |
| 13. | Brookview | 20.0% | 3.8%(+16.2)#13 | 4.3%(+15.7)#643 |
| 14. | Preston | 18.8% | 3.8%(+14.9)#14 | 4.3%(+14.5)#725 |
| 15. | Jugtown | 17.9% | 3.8%(+14.1)#15 | 4.3%(+13.7)#783 |
| 16. | Corriganville | 16.7% | 3.8%(+12.8)#16 | 4.3%(+12.4)#876 |
| 17. | Pomfret | 15.6% | 3.8%(+11.8)#17 | 4.3%(+11.3)#998 |
| 18. | Solomons | 15.5% | 3.8%(+11.7)#18 | 4.3%(+11.3)#1,009 |
| 19. | Hillsboro | 14.3% | 3.8%(+10.5)#19 | 4.3%(+10.0)#1,163 |
| 20. | Crumpton | 14.1% | 3.8%(+10.3)#20 | 4.3%(+9.83)#1,188 |
| 21. | Secretary | 14.0% | 3.8%(+10.2)#21 | 4.3%(+9.78)#1,194 |
| 22. | Snow Hill | 13.6% | 3.8%(+9.80)#22 | 4.3%(+9.37)#1,248 |
| 23. | Accident | 13.6% | 3.8%(+9.74)#23 | 4.3%(+9.31)#1,255 |
| 24. | Brookeville | 13.3% | 3.8%(+9.43)#24 | 4.3%(+9.00)#1,314 |
| 25. | Taylors Island | 12.8% | 3.8%(+8.94)#25 | 4.3%(+8.51)#1,379 |
| 26. | Mount Rainier | 11.6% | 3.8%(+7.78)#26 | 4.3%(+7.35)#1,608 |
| 27. | Zihlman | 11.5% | 3.8%(+7.65)#27 | 4.3%(+7.22)#1,628 |
| 28. | Cottage City | 11.5% | 3.8%(+7.64)#28 | 4.3%(+7.21)#1,630 |
| 29. | Berlin | 9.9% | 3.8%(+6.10)#29 | 4.3%(+5.68)#2,097 |
| 30. | Lutherville | 9.4% | 3.8%(+5.59)#30 | 4.3%(+5.16)#2,282 |
| 31. | Highland Beach | 9.3% | 3.8%(+5.48)#31 | 4.3%(+5.05)#2,327 |
| 32. | Mount Savage | 9.3% | 3.8%(+5.44)#32 | 4.3%(+5.01)#2,341 |
| 33. | Burkittsville | 9.1% | 3.8%(+5.27)#33 | 4.3%(+4.84)#2,421 |
| 34. | Darlington | 8.9% | 3.8%(+5.11)#34 | 4.3%(+4.68)#2,493 |
| 35. | Ridgely | 8.9% | 3.8%(+5.09)#35 | 4.3%(+4.67)#2,497 |
| 36. | Williamsport | 8.9% | 3.8%(+5.04)#36 | 4.3%(+4.61)#2,525 |
| 37. | Cheverly | 8.8% | 3.8%(+4.97)#37 | 4.3%(+4.54)#2,557 |
| 38. | North Kensington | 8.6% | 3.8%(+4.73)#38 | 4.3%(+4.31)#2,668 |
| 39. | Chesapeake City | 8.4% | 3.8%(+4.59)#39 | 4.3%(+4.16)#2,738 |
| 40. | Edmonston | 8.4% | 3.8%(+4.57)#40 | 4.3%(+4.14)#2,743 |
| 41. | Friendship Heights Village | 8.4% | 3.8%(+4.54)#41 | 4.3%(+4.11)#2,759 |
| 42. | Langley Park | 8.3% | 3.8%(+4.48)#42 | 4.3%(+4.05)#2,812 |
| 43. | Aberdeen Proving Ground | 8.3% | 3.8%(+4.44)#43 | 4.3%(+4.01)#2,834 |
| 44. | Cecilton | 8.2% | 3.8%(+4.36)#44 | 4.3%(+3.94)#2,878 |
| 45. | Brentwood | 8.1% | 3.8%(+4.31)#45 | 4.3%(+3.89)#2,899 |
| 46. | Bladensburg | 8.1% | 3.8%(+4.24)#46 | 4.3%(+3.81)#2,929 |
| 47. | Riverdale Park | 8.0% | 3.8%(+4.20)#47 | 4.3%(+3.77)#2,949 |
| 48. | Hyattsville | 8.0% | 3.8%(+4.16)#48 | 4.3%(+3.73)#2,983 |
| 49. | North Brentwood | 7.9% | 3.8%(+4.03)#49 | 4.3%(+3.61)#3,054 |
| 50. | Barnesville | 7.8% | 3.8%(+3.97)#50 | 4.3%(+3.54)#3,094 |
| 51. | Betterton | 7.5% | 3.8%(+3.72)#51 | 4.3%(+3.30)#3,265 |
| 52. | Baltimore | 7.4% | 3.8%(+3.58)#52 | 4.3%(+3.15)#3,370 |
| 53. | Thurmont | 7.3% | 3.8%(+3.50)#53 | 4.3%(+3.07)#3,426 |
| 54. | Lansdowne | 7.2% | 3.8%(+3.37)#54 | 4.3%(+2.94)#3,526 |
| 55. | Bowling Green | 7.1% | 3.8%(+3.32)#55 | 4.3%(+2.89)#3,564 |
| 56. | Chesapeake Ranch Estates | 7.1% | 3.8%(+3.26)#56 | 4.3%(+2.83)#3,643 |
| 57. | Pittsville | 7.0% | 3.8%(+3.18)#57 | 4.3%(+2.75)#3,696 |
| 58. | Smithsburg | 6.9% | 3.8%(+3.11)#58 | 4.3%(+2.68)#3,758 |
| 59. | North Laurel | 6.9% | 3.8%(+3.04)#59 | 4.3%(+2.61)#3,828 |
| 60. | Mays Chapel | 6.7% | 3.8%(+2.89)#60 | 4.3%(+2.46)#3,990 |
| 61. | Jarrettsville | 6.7% | 3.8%(+2.86)#61 | 4.3%(+2.43)#4,010 |
| 62. | Elkridge | 6.7% | 3.8%(+2.86)#62 | 4.3%(+2.43)#4,017 |
| 63. | Kitzmiller | 6.7% | 3.8%(+2.84)#63 | 4.3%(+2.41)#4,045 |
| 64. | La Plata | 6.6% | 3.8%(+2.73)#64 | 4.3%(+2.30)#4,149 |
| 65. | Cresaptown | 6.5% | 3.8%(+2.69)#65 | 4.3%(+2.26)#4,187 |
| 66. | Oxon Hill | 6.5% | 3.8%(+2.63)#66 | 4.3%(+2.20)#4,248 |
| 67. | Piney Point | 6.4% | 3.8%(+2.58)#67 | 4.3%(+2.15)#4,292 |
| 68. | Indian Head | 6.4% | 3.8%(+2.53)#68 | 4.3%(+2.10)#4,332 |
| 69. | North Beach | 6.3% | 3.8%(+2.52)#69 | 4.3%(+2.09)#4,344 |
| 70. | Kensington | 6.3% | 3.8%(+2.51)#70 | 4.3%(+2.08)#4,353 |
| 71. | Adelphi | 6.3% | 3.8%(+2.50)#71 | 4.3%(+2.07)#4,370 |
| 72. | Brunswick | 6.3% | 3.8%(+2.49)#72 | 4.3%(+2.06)#4,380 |
| 73. | Owings | 6.3% | 3.8%(+2.44)#73 | 4.3%(+2.01)#4,415 |
| 74. | Queenstown | 6.2% | 3.8%(+2.40)#74 | 4.3%(+1.97)#4,476 |
| 75. | Savage | 6.2% | 3.8%(+2.39)#75 | 4.3%(+1.96)#4,490 |
| 76. | Forest Glen | 6.2% | 3.8%(+2.34)#76 | 4.3%(+1.91)#4,528 |
| 77. | New Market | 6.1% | 3.8%(+2.32)#77 | 4.3%(+1.89)#4,549 |
| 78. | Hagerstown | 6.0% | 3.8%(+2.20)#78 | 4.3%(+1.77)#4,695 |
| 79. | Spencerville | 5.9% | 3.8%(+2.08)#79 | 4.3%(+1.65)#4,816 |
| 80. | Romancoke | 5.9% | 3.8%(+2.06)#80 | 4.3%(+1.63)#4,835 |
| 81. | West Laurel | 5.8% | 3.8%(+2.03)#81 | 4.3%(+1.60)#4,892 |
| 82. | Takoma Park | 5.8% | 3.8%(+1.99)#82 | 4.3%(+1.56)#4,931 |
| 83. | Edgewood | 5.8% | 3.8%(+1.98)#83 | 4.3%(+1.55)#4,944 |
| 84. | Maugansville | 5.7% | 3.8%(+1.92)#84 | 4.3%(+1.49)#5,019 |
| 85. | Joppatowne | 5.7% | 3.8%(+1.91)#85 | 4.3%(+1.48)#5,031 |
| 86. | Chevy Chase Section Three | 5.7% | 3.8%(+1.83)#86 | 4.3%(+1.41)#5,113 |
| 87. | Mayo | 5.6% | 3.8%(+1.78)#87 | 4.3%(+1.36)#5,170 |
| 88. | Cavetown | 5.6% | 3.8%(+1.77)#88 | 4.3%(+1.34)#5,190 |
| 89. | Parkville | 5.6% | 3.8%(+1.75)#89 | 4.3%(+1.32)#5,202 |
| 90. | Queen Anne | 5.6% | 3.8%(+1.73)#90 | 4.3%(+1.30)#5,253 |
| 91. | Pleasant Hills | 5.5% | 3.8%(+1.72)#91 | 4.3%(+1.29)#5,267 |
| 92. | Berwyn Heights | 5.5% | 3.8%(+1.69)#92 | 4.3%(+1.26)#5,300 |
| 93. | Abingdon | 5.5% | 3.8%(+1.66)#93 | 4.3%(+1.23)#5,328 |
| 94. | Port Deposit | 5.4% | 3.8%(+1.58)#94 | 4.3%(+1.15)#5,432 |
| 95. | Bel Air | 5.4% | 3.8%(+1.57)#95 | 4.3%(+1.14)#5,454 |
| 96. | South Kensington | 5.4% | 3.8%(+1.56)#96 | 4.3%(+1.13)#5,469 |
| 97. | Dundalk | 5.3% | 3.8%(+1.49)#97 | 4.3%(+1.06)#5,554 |
| 98. | Cedar Heights | 5.3% | 3.8%(+1.48)#98 | 4.3%(+1.05)#5,561 |
| 99. | Frederick | 5.3% | 3.8%(+1.46)#99 | 4.3%(+1.03)#5,592 |
| 100. | Towson | 5.3% | 3.8%(+1.45)#100 | 4.3%(+1.03)#5,599 |
Common Questions
What are the Top 10 Cities with the Highest Percentage of Population with a Degree in Visual and Performing Arts in Maryland?
Top 10 Cities with the Highest Percentage of Population with a Degree in Visual and Performing Arts in Maryland are:
#1
77.8%
#2
66.7%
#3
47.1%
#4
38.4%
#5
37.5%
#6
35.3%
#7
29.1%
#8
28.9%
#9
28.1%
#10
25.0%
What city has the Highest Percentage of Population with a Degree in Visual and Performing Arts in Maryland?
Fairlee has the Highest Percentage of Population with a Degree in Visual and Performing Arts in Maryland with 77.8%.
What is the Percentage of Population with a Degree in Visual and Performing Arts in the State of Maryland?
Percentage of Population with a Degree in Visual and Performing Arts in Maryland is 3.8%.
What is the Percentage of Population with a Degree in Visual and Performing Arts in the United States?
Percentage of Population with a Degree in Visual and Performing Arts in the United States is 4.3%.