Firebaugh, CA Map & Demographics
Firebaugh Map
Firebaugh Overview
$13,768
PER CAPITA INCOME
$36,413
AVG FAMILY INCOME
$36,078
AVG HOUSEHOLD INCOME
44.5%
WAGE / INCOME GAP [ % ]
55.5¢/ $1
WAGE / INCOME GAP [ $ ]
$9,550
FAMILY INCOME DEFICIT
0.41
INEQUALITY / GINI INDEX
8,139
TOTAL POPULATION
4,076
MALE POPULATION
4,063
FEMALE POPULATION
100.32
MALES / 100 FEMALES
99.68
FEMALES / 100 MALES
32.2
MEDIAN AGE
3.8
AVG FAMILY SIZE
3.5
AVG HOUSEHOLD SIZE
2,896
LABOR FORCE [ PEOPLE ]
50.9%
PERCENT IN LABOR FORCE
18.3%
UNEMPLOYMENT RATE
Firebaugh Zip Codes
Income in Firebaugh
Income Overview in Firebaugh
Per Capita Income in Firebaugh is $13,768, while median incomes of families and households are $36,413 and $36,078 respectively.
| Characteristic | Number | Measure |
| Per Capita Income | 8,139 | $13,768 |
| Median Family Income | 2,002 | $36,413 |
| Mean Family Income | 2,002 | $47,969 |
| Median Household Income | 2,297 | $36,078 |
| Mean Household Income | 2,297 | $46,883 |
| Income Deficit | 2,002 | $9,550 |
| Wage / Income Gap (%) | 8,139 | 44.48% |
| Wage / Income Gap ($) | 8,139 | 55.52¢ per $1 |
| Gini / Inequality Index | 8,139 | 0.41 |
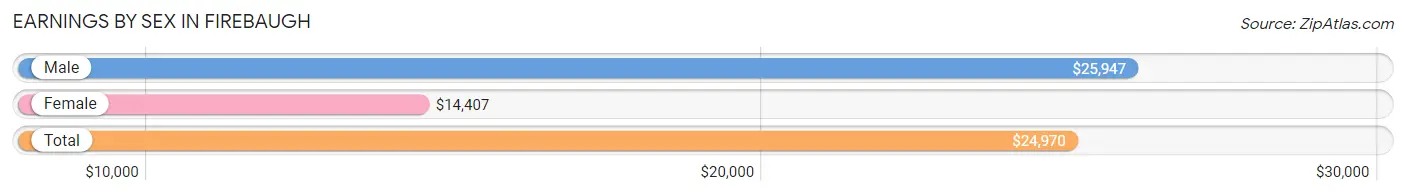
Earnings by Sex in Firebaugh
Average Earnings in Firebaugh are $24,970, $25,947 for men and $14,407 for women, a difference of 44.5%.
| Sex | Number | Average Earnings |
| Male | 1,783 (60.8%) | $25,947 |
| Female | 1,152 (39.3%) | $14,407 |
| Total | 2,935 (100.0%) | $24,970 |
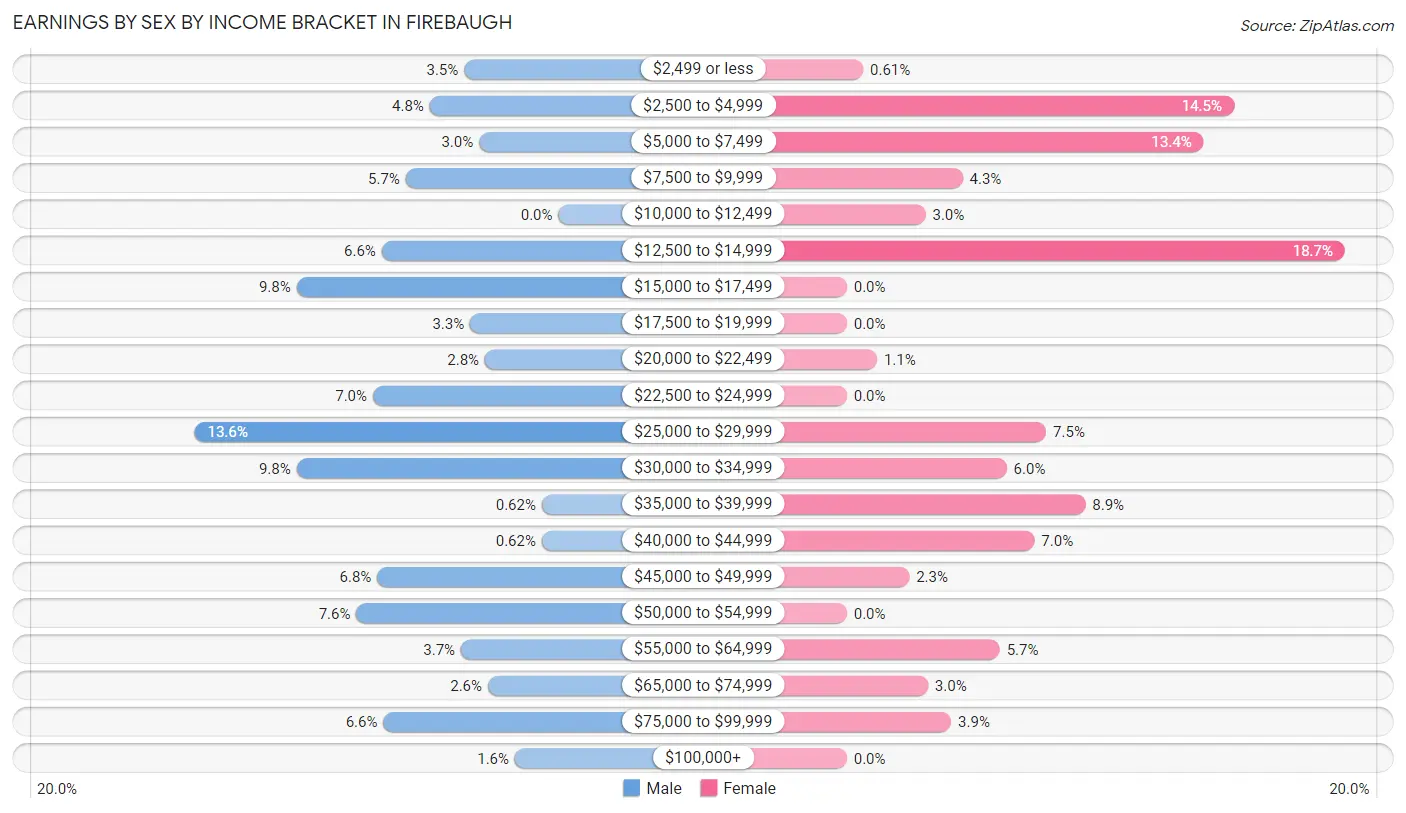
Earnings by Sex by Income Bracket in Firebaugh
The most common earnings brackets in Firebaugh are $25,000 to $29,999 for men (243 | 13.6%) and $12,500 to $14,999 for women (215 | 18.7%).
| Income | Male | Female |
| $2,499 or less | 63 (3.5%) | 7 (0.6%) |
| $2,500 to $4,999 | 86 (4.8%) | 167 (14.5%) |
| $5,000 to $7,499 | 53 (3.0%) | 154 (13.4%) |
| $7,500 to $9,999 | 102 (5.7%) | 50 (4.3%) |
| $10,000 to $12,499 | 0 (0.0%) | 34 (2.9%) |
| $12,500 to $14,999 | 118 (6.6%) | 215 (18.7%) |
| $15,000 to $17,499 | 175 (9.8%) | 0 (0.0%) |
| $17,500 to $19,999 | 59 (3.3%) | 0 (0.0%) |
| $20,000 to $22,499 | 49 (2.8%) | 13 (1.1%) |
| $22,500 to $24,999 | 124 (7.0%) | 0 (0.0%) |
| $25,000 to $29,999 | 243 (13.6%) | 86 (7.5%) |
| $30,000 to $34,999 | 175 (9.8%) | 69 (6.0%) |
| $35,000 to $39,999 | 11 (0.6%) | 103 (8.9%) |
| $40,000 to $44,999 | 11 (0.6%) | 81 (7.0%) |
| $45,000 to $49,999 | 121 (6.8%) | 27 (2.3%) |
| $50,000 to $54,999 | 135 (7.6%) | 0 (0.0%) |
| $55,000 to $64,999 | 65 (3.6%) | 66 (5.7%) |
| $65,000 to $74,999 | 47 (2.6%) | 35 (3.0%) |
| $75,000 to $99,999 | 117 (6.6%) | 45 (3.9%) |
| $100,000+ | 29 (1.6%) | 0 (0.0%) |
| Total | 1,783 (100.0%) | 1,152 (100.0%) |
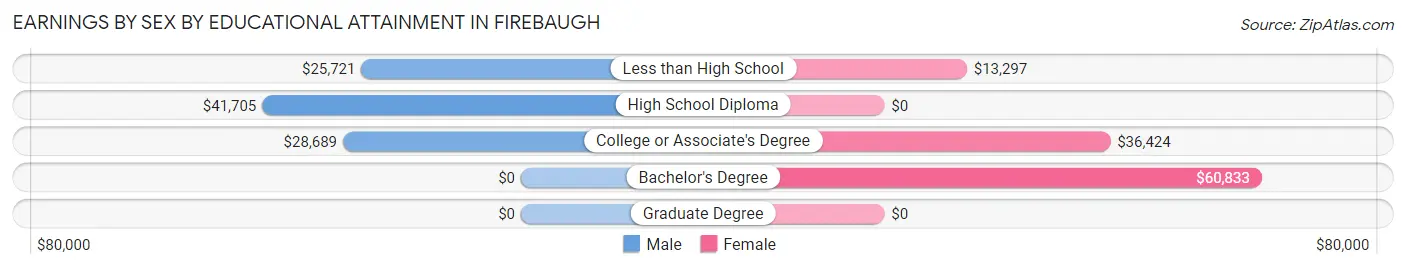
Earnings by Sex by Educational Attainment in Firebaugh
Average earnings in Firebaugh are $30,232 for men and $20,481 for women, a difference of 32.3%. Men with an educational attainment of high school diploma enjoy the highest average annual earnings of $41,705, while those with less than high school education earn the least with $25,721. Women with an educational attainment of bachelor's degree earn the most with the average annual earnings of $60,833, while those with less than high school education have the smallest earnings of $13,297.
| Educational Attainment | Male Income | Female Income |
| Less than High School | $25,721 | $13,297 |
| High School Diploma | $41,705 | $0 |
| College or Associate's Degree | $28,689 | $36,424 |
| Bachelor's Degree | - | - |
| Graduate Degree | - | - |
| Total | $30,232 | $20,481 |
Family Income in Firebaugh
Family Income Brackets in Firebaugh
According to the Firebaugh family income data, there are 418 families falling into the $35,000 to $49,999 income range, which is the most common income bracket and makes up 20.9% of all families.
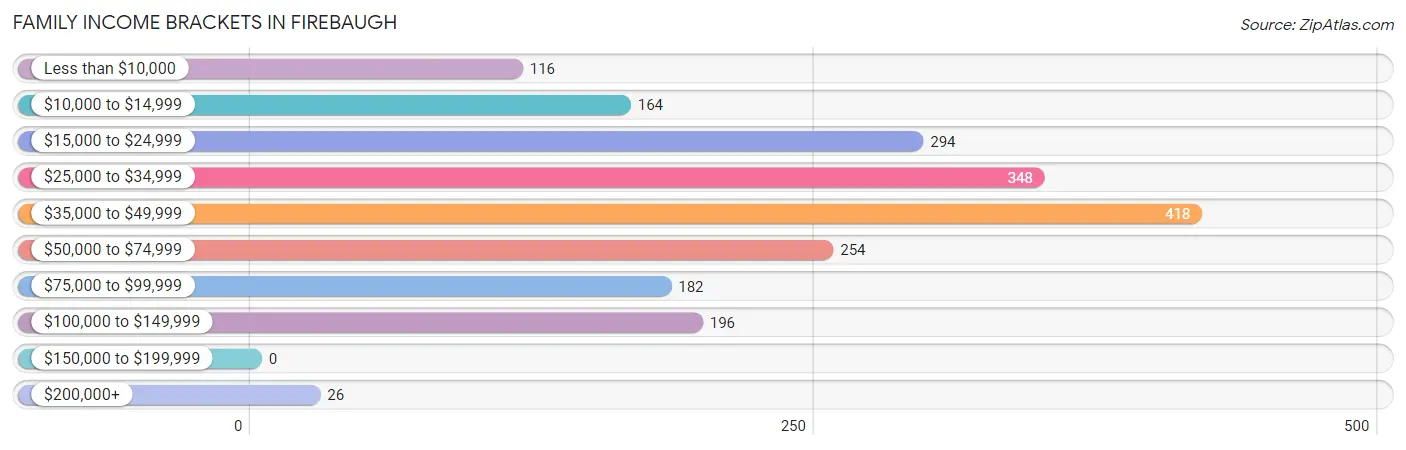
| Income Bracket | # Families | % Families |
| Less than $10,000 | 116 | 5.8% |
| $10,000 to $14,999 | 164 | 8.2% |
| $15,000 to $24,999 | 294 | 14.7% |
| $25,000 to $34,999 | 348 | 17.4% |
| $35,000 to $49,999 | 418 | 20.9% |
| $50,000 to $74,999 | 254 | 12.7% |
| $75,000 to $99,999 | 182 | 9.1% |
| $100,000 to $149,999 | 196 | 9.8% |
| $150,000 to $199,999 | 0 | 0.0% |
| $200,000+ | 26 | 1.3% |
Family Income by Famaliy Size in Firebaugh
5-person families (403 | 20.1%) account for the highest median family income in Firebaugh with $71,599 per family, while 5-person families (403 | 20.1%) have the highest median income of $14,320 per family member.
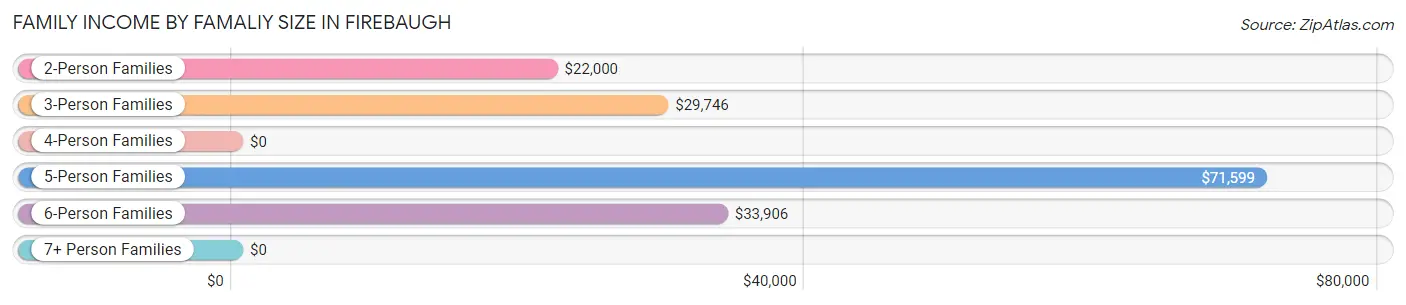
| Income Bracket | # Families | Median Income |
| 2-Person Families | 556 (27.8%) | $22,000 |
| 3-Person Families | 498 (24.9%) | $29,746 |
| 4-Person Families | 344 (17.2%) | $0 |
| 5-Person Families | 403 (20.1%) | $71,599 |
| 6-Person Families | 90 (4.5%) | $33,906 |
| 7+ Person Families | 111 (5.5%) | $0 |
| Total | 2,002 (100.0%) | $36,413 |
Family Income by Number of Earners in Firebaugh
The median family income in Firebaugh is $36,413, with families comprising 3+ earners (232) having the highest median family income of $80,000, while families with no earners (348) have the lowest median family income of $16,410, accounting for 11.6% and 17.4% of families, respectively.
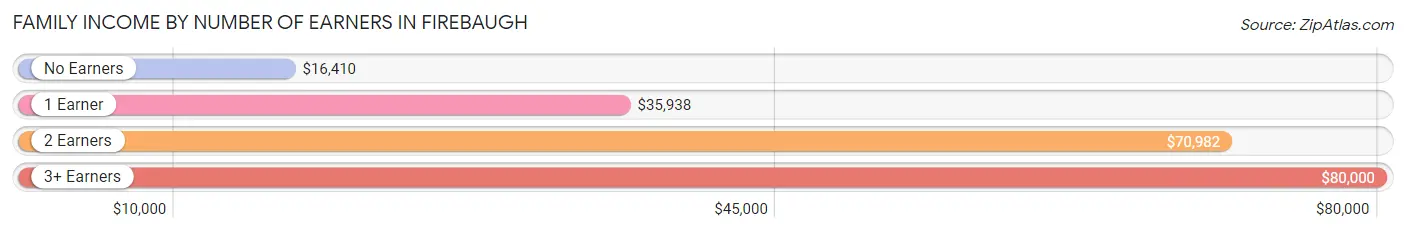
| Number of Earners | # Families | Median Income |
| No Earners | 348 (17.4%) | $16,410 |
| 1 Earner | 1,072 (53.5%) | $35,938 |
| 2 Earners | 350 (17.5%) | $70,982 |
| 3+ Earners | 232 (11.6%) | $80,000 |
| Total | 2,002 (100.0%) | $36,413 |
Household Income in Firebaugh
Household Income Brackets in Firebaugh
With 512 households falling in the category, the $35,000 to $49,999 income range is the most frequent in Firebaugh, accounting for 22.3% of all households. In contrast, only 11 households (0.5%) fall into the $150,000 to $199,999 income bracket, making it the least populous group.
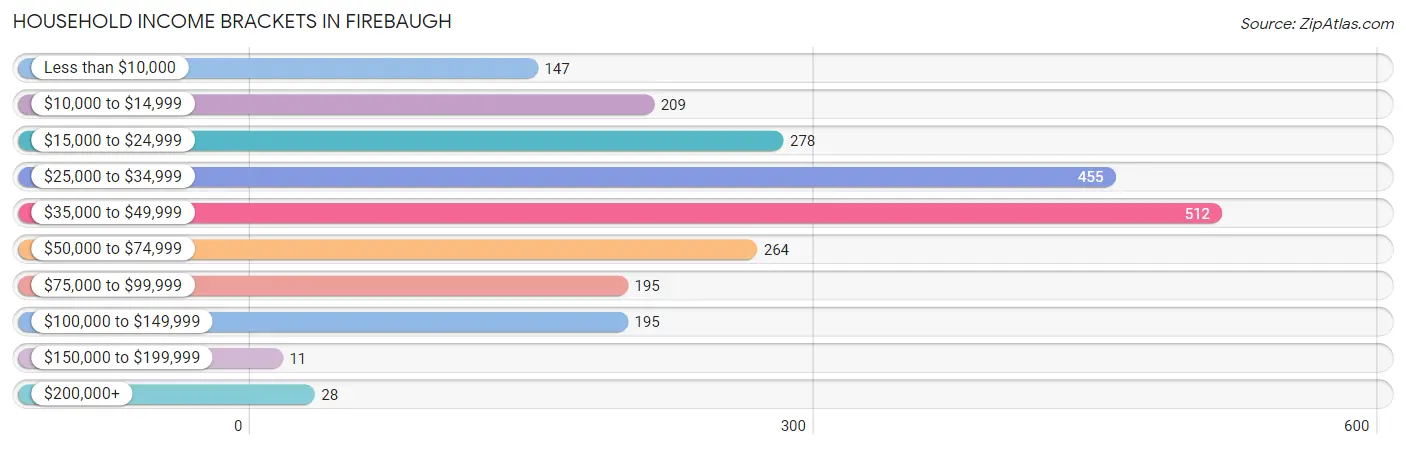
| Income Bracket | # Households | % Households |
| Less than $10,000 | 147 | 6.4% |
| $10,000 to $14,999 | 209 | 9.1% |
| $15,000 to $24,999 | 278 | 12.1% |
| $25,000 to $34,999 | 455 | 19.8% |
| $35,000 to $49,999 | 512 | 22.3% |
| $50,000 to $74,999 | 264 | 11.5% |
| $75,000 to $99,999 | 195 | 8.5% |
| $100,000 to $149,999 | 195 | 8.5% |
| $150,000 to $199,999 | 11 | 0.5% |
| $200,000+ | 28 | 1.2% |
Household Income by Householder Age in Firebaugh
The median household income in Firebaugh is $36,078, with the highest median household income of $53,594 found in the 45 to 64 years age bracket for the primary householder. A total of 969 households (42.2%) fall into this category. Meanwhile, the 15 to 24 years age bracket for the primary householder has the lowest median household income of $0, with 49 households (2.1%) in this group.
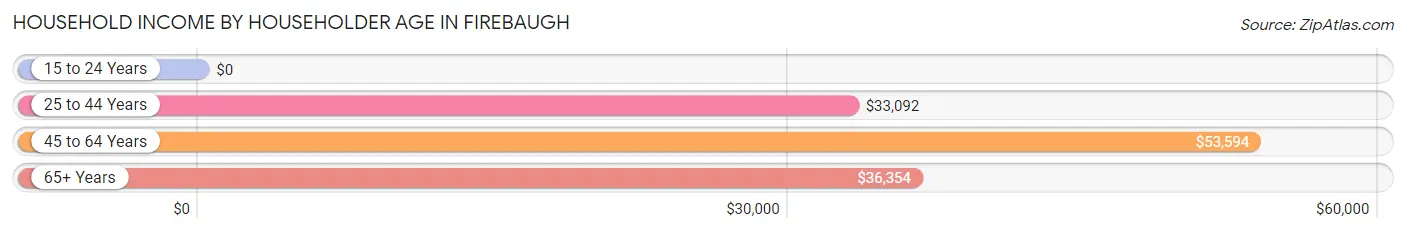
| Income Bracket | # Households | Median Income |
| 15 to 24 Years | 49 (2.1%) | $0 |
| 25 to 44 Years | 602 (26.2%) | $33,092 |
| 45 to 64 Years | 969 (42.2%) | $53,594 |
| 65+ Years | 677 (29.5%) | $36,354 |
| Total | 2,297 (100.0%) | $36,078 |
Poverty in Firebaugh
Income Below Poverty by Sex and Age in Firebaugh
With 38.2% poverty level for males and 48.3% for females among the residents of Firebaugh, 6 to 11 year old males and 5 year old females are the most vulnerable to poverty, with 261 males (78.8%) and 71 females (100.0%) in their respective age groups living below the poverty level.
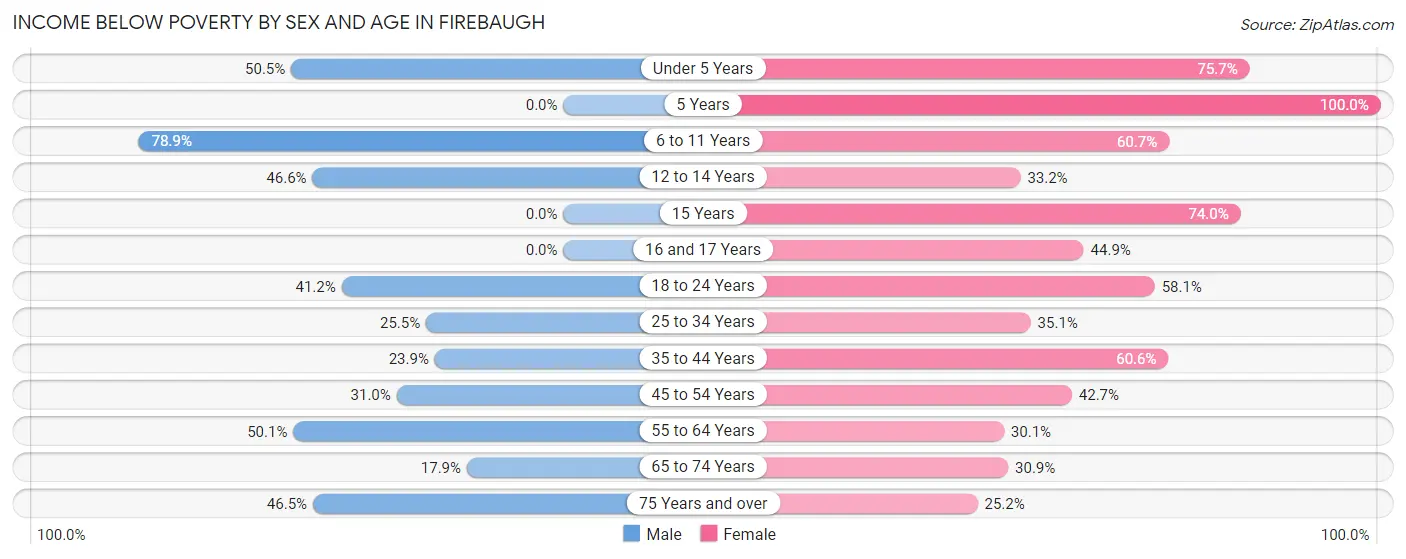
| Age Bracket | Male | Female |
| Under 5 Years | 189 (50.5%) | 196 (75.7%) |
| 5 Years | 0 (0.0%) | 71 (100.0%) |
| 6 to 11 Years | 261 (78.8%) | 396 (60.7%) |
| 12 to 14 Years | 143 (46.6%) | 63 (33.2%) |
| 15 Years | 0 (0.0%) | 111 (74.0%) |
| 16 and 17 Years | 0 (0.0%) | 145 (44.9%) |
| 18 to 24 Years | 261 (41.2%) | 97 (58.1%) |
| 25 to 34 Years | 78 (25.5%) | 135 (35.1%) |
| 35 to 44 Years | 100 (23.9%) | 266 (60.6%) |
| 45 to 54 Years | 173 (30.9%) | 196 (42.7%) |
| 55 to 64 Years | 182 (50.1%) | 161 (30.1%) |
| 65 to 74 Years | 65 (17.9%) | 92 (30.9%) |
| 75 Years and over | 106 (46.5%) | 34 (25.2%) |
| Total | 1,558 (38.2%) | 1,963 (48.3%) |
Income Above Poverty by Sex and Age in Firebaugh
According to the poverty statistics in Firebaugh, males aged 5 years and females aged 75 years and over are the age groups that are most secure financially, with 100.0% of males and 74.8% of females in these age groups living above the poverty line.
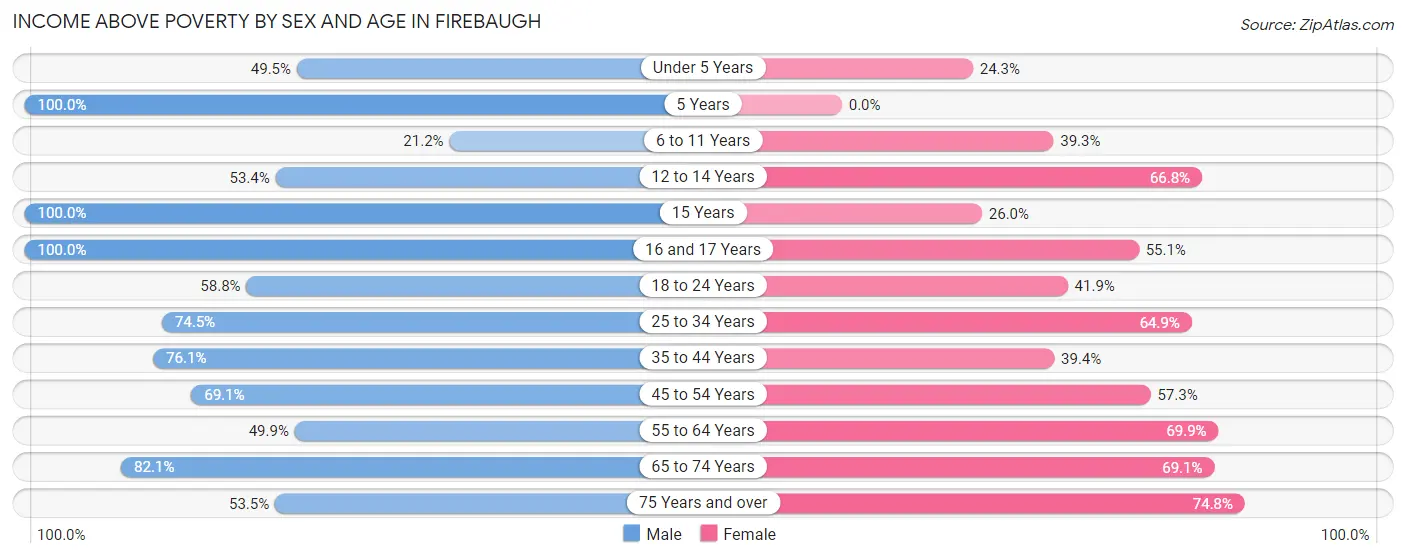
| Age Bracket | Male | Female |
| Under 5 Years | 185 (49.5%) | 63 (24.3%) |
| 5 Years | 59 (100.0%) | 0 (0.0%) |
| 6 to 11 Years | 70 (21.1%) | 256 (39.3%) |
| 12 to 14 Years | 164 (53.4%) | 127 (66.8%) |
| 15 Years | 57 (100.0%) | 39 (26.0%) |
| 16 and 17 Years | 76 (100.0%) | 178 (55.1%) |
| 18 to 24 Years | 373 (58.8%) | 70 (41.9%) |
| 25 to 34 Years | 228 (74.5%) | 250 (64.9%) |
| 35 to 44 Years | 319 (76.1%) | 173 (39.4%) |
| 45 to 54 Years | 386 (69.1%) | 263 (57.3%) |
| 55 to 64 Years | 181 (49.9%) | 374 (69.9%) |
| 65 to 74 Years | 298 (82.1%) | 206 (69.1%) |
| 75 Years and over | 122 (53.5%) | 101 (74.8%) |
| Total | 2,518 (61.8%) | 2,100 (51.7%) |
Income Below Poverty Among Married-Couple Families in Firebaugh
The poverty statistics for married-couple families in Firebaugh show that 31.9% or 410 of the total 1,285 families live below the poverty line. Families with 5 or more children have the highest poverty rate of 100.0%, comprising of 50 families. On the other hand, families with no children have the lowest poverty rate of 18.4%, which includes 99 families.
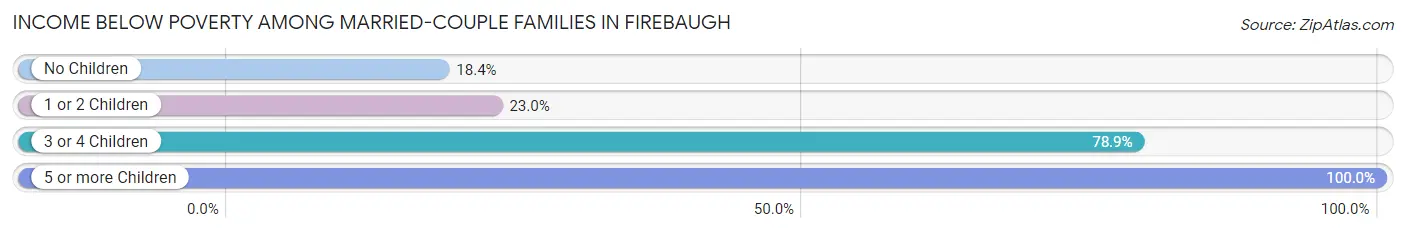
| Children | Above Poverty | Below Poverty |
| No Children | 439 (81.6%) | 99 (18.4%) |
| 1 or 2 Children | 398 (77.0%) | 119 (23.0%) |
| 3 or 4 Children | 38 (21.1%) | 142 (78.9%) |
| 5 or more Children | 0 (0.0%) | 50 (100.0%) |
| Total | 875 (68.1%) | 410 (31.9%) |
Income Below Poverty Among Single-Parent Households in Firebaugh
According to the poverty data in Firebaugh, 95.9% or 118 single-father households and 38.4% or 228 single-mother households are living below the poverty line. Among single-father households, those with no children have the highest poverty rate, with 14 households (100.0%) experiencing poverty. Likewise, among single-mother households, those with 3 or 4 children have the highest poverty rate, with 102 households (50.7%) falling below the poverty line.
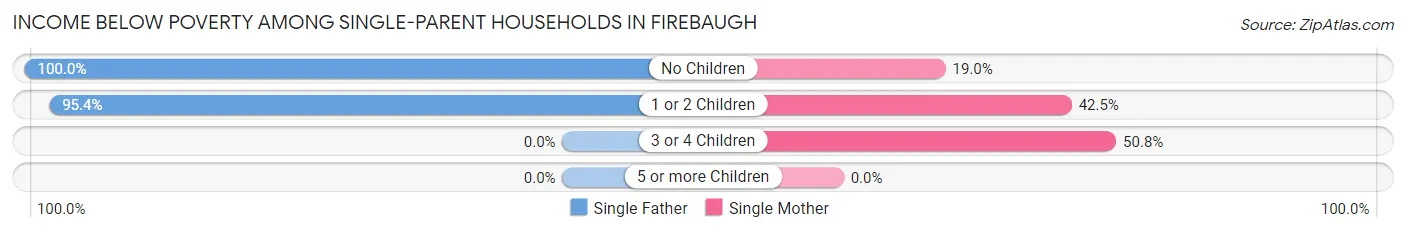
| Children | Single Father | Single Mother |
| No Children | 14 (100.0%) | 33 (19.0%) |
| 1 or 2 Children | 104 (95.4%) | 93 (42.5%) |
| 3 or 4 Children | 0 (0.0%) | 102 (50.7%) |
| 5 or more Children | 0 (0.0%) | 0 (0.0%) |
| Total | 118 (95.9%) | 228 (38.4%) |
Income Below Poverty Among Married-Couple vs Single-Parent Households in Firebaugh
The poverty data for Firebaugh shows that 410 of the married-couple family households (31.9%) and 346 of the single-parent households (48.3%) are living below the poverty level. Within the married-couple family households, those with 5 or more children have the highest poverty rate, with 50 households (100.0%) falling below the poverty line. Among the single-parent households, those with 1 or 2 children have the highest poverty rate, with 197 household (60.1%) living below poverty.
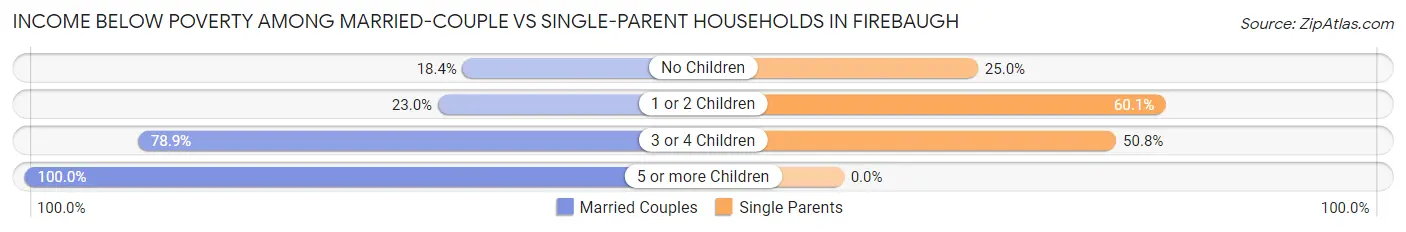
| Children | Married-Couple Families | Single-Parent Households |
| No Children | 99 (18.4%) | 47 (25.0%) |
| 1 or 2 Children | 119 (23.0%) | 197 (60.1%) |
| 3 or 4 Children | 142 (78.9%) | 102 (50.7%) |
| 5 or more Children | 50 (100.0%) | 0 (0.0%) |
| Total | 410 (31.9%) | 346 (48.3%) |
Race in Firebaugh
The most populous races in Firebaugh are Hispanic or Latino (7,914 | 97.2%), Some other Race (4,571 | 56.2%), and White / Caucasian (2,660 | 32.7%).
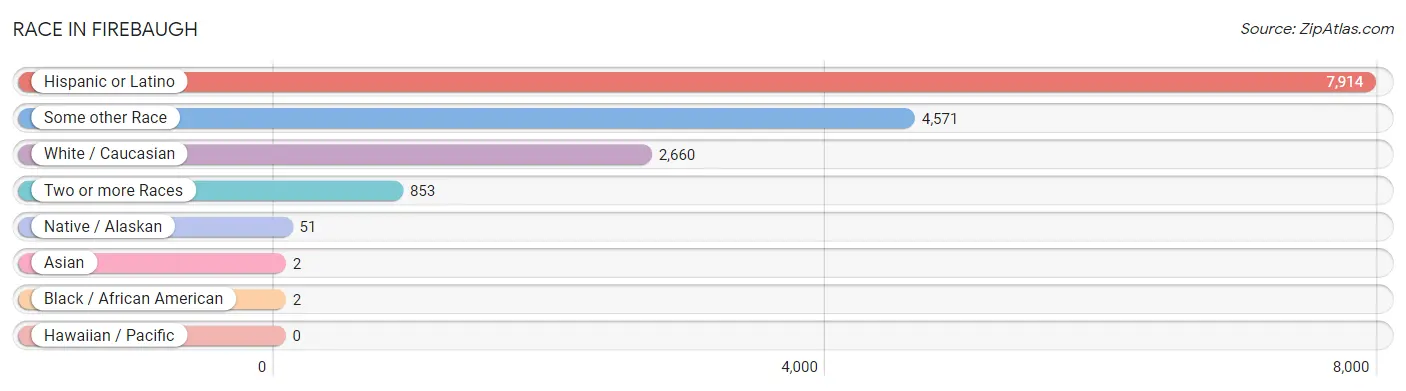
| Race | # Population | % Population |
| Asian | 2 | 0.0% |
| Black / African American | 2 | 0.0% |
| Hawaiian / Pacific | 0 | 0.0% |
| Hispanic or Latino | 7,914 | 97.2% |
| Native / Alaskan | 51 | 0.6% |
| White / Caucasian | 2,660 | 32.7% |
| Two or more Races | 853 | 10.5% |
| Some other Race | 4,571 | 56.2% |
| Total | 8,139 | 100.0% |
Ancestry in Firebaugh
The most populous ancestries reported in Firebaugh are Mexican (7,629 | 93.7%), Central American (222 | 2.7%), Salvadoran (164 | 2.0%), Guatemalan (58 | 0.7%), and Mexican American Indian (41 | 0.5%), together accounting for 99.7% of all Firebaugh residents.
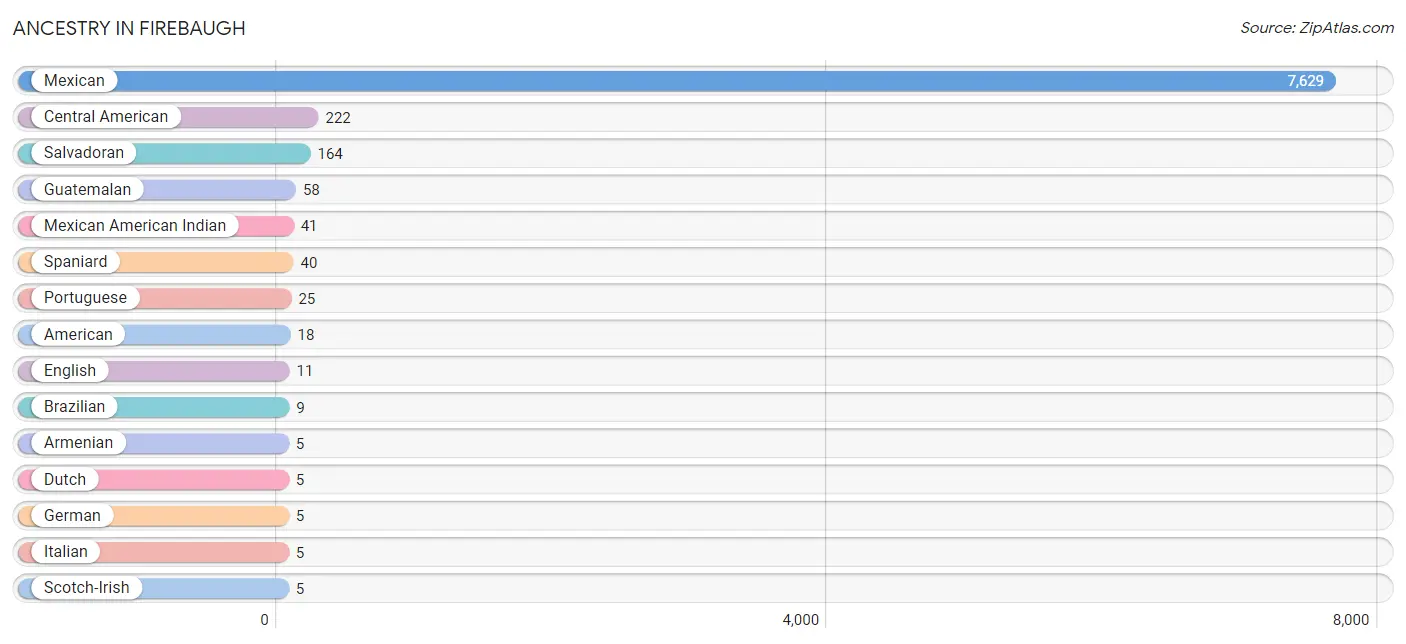
| Ancestry | # Population | % Population |
| American | 18 | 0.2% |
| Armenian | 5 | 0.1% |
| Brazilian | 9 | 0.1% |
| Central American | 222 | 2.7% |
| Dutch | 5 | 0.1% |
| English | 11 | 0.1% |
| German | 5 | 0.1% |
| Guatemalan | 58 | 0.7% |
| Indian (Asian) | 2 | 0.0% |
| Italian | 5 | 0.1% |
| Mexican | 7,629 | 93.7% |
| Mexican American Indian | 41 | 0.5% |
| Portuguese | 25 | 0.3% |
| Salvadoran | 164 | 2.0% |
| Scotch-Irish | 5 | 0.1% |
| Spaniard | 40 | 0.5% | View All 16 Rows |
Immigrants in Firebaugh
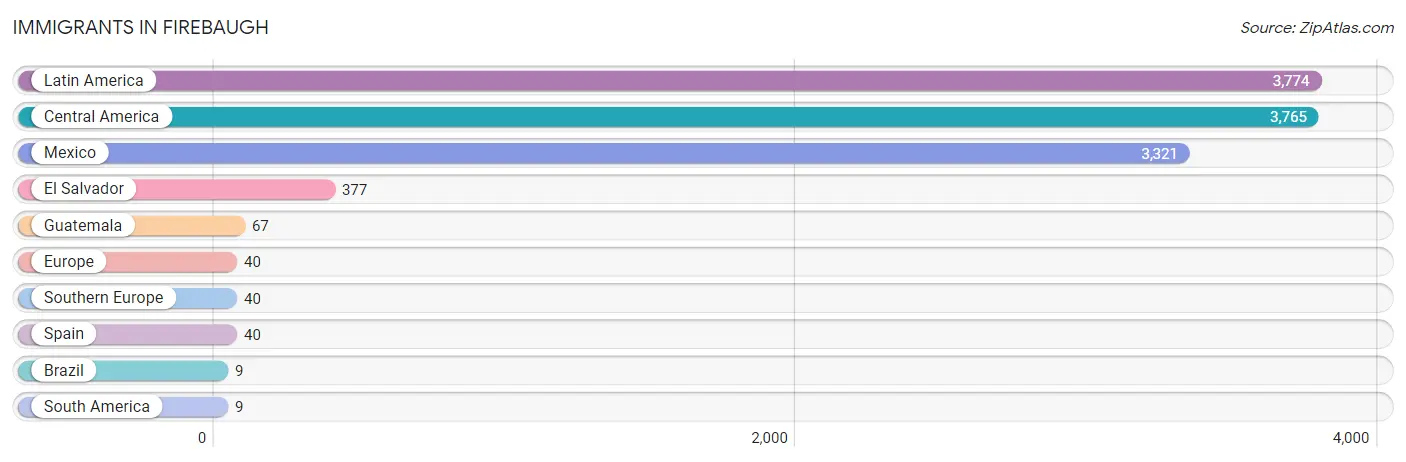
The most numerous immigrant groups reported in Firebaugh came from Latin America (3,774 | 46.4%), Central America (3,765 | 46.3%), Mexico (3,321 | 40.8%), El Salvador (377 | 4.6%), and Guatemala (67 | 0.8%), together accounting for 138.9% of all Firebaugh residents.
| Immigration Origin | # Population | % Population |
| Brazil | 9 | 0.1% |
| Central America | 3,765 | 46.3% |
| El Salvador | 377 | 4.6% |
| Europe | 40 | 0.5% |
| Guatemala | 67 | 0.8% |
| Latin America | 3,774 | 46.4% |
| Mexico | 3,321 | 40.8% |
| South America | 9 | 0.1% |
| Southern Europe | 40 | 0.5% |
| Spain | 40 | 0.5% | View All 10 Rows |
Sex and Age in Firebaugh
Sex and Age in Firebaugh
The most populous age groups in Firebaugh are 50 to 54 Years (402 | 9.9%) for men and 15 to 19 Years (550 | 13.5%) for women.
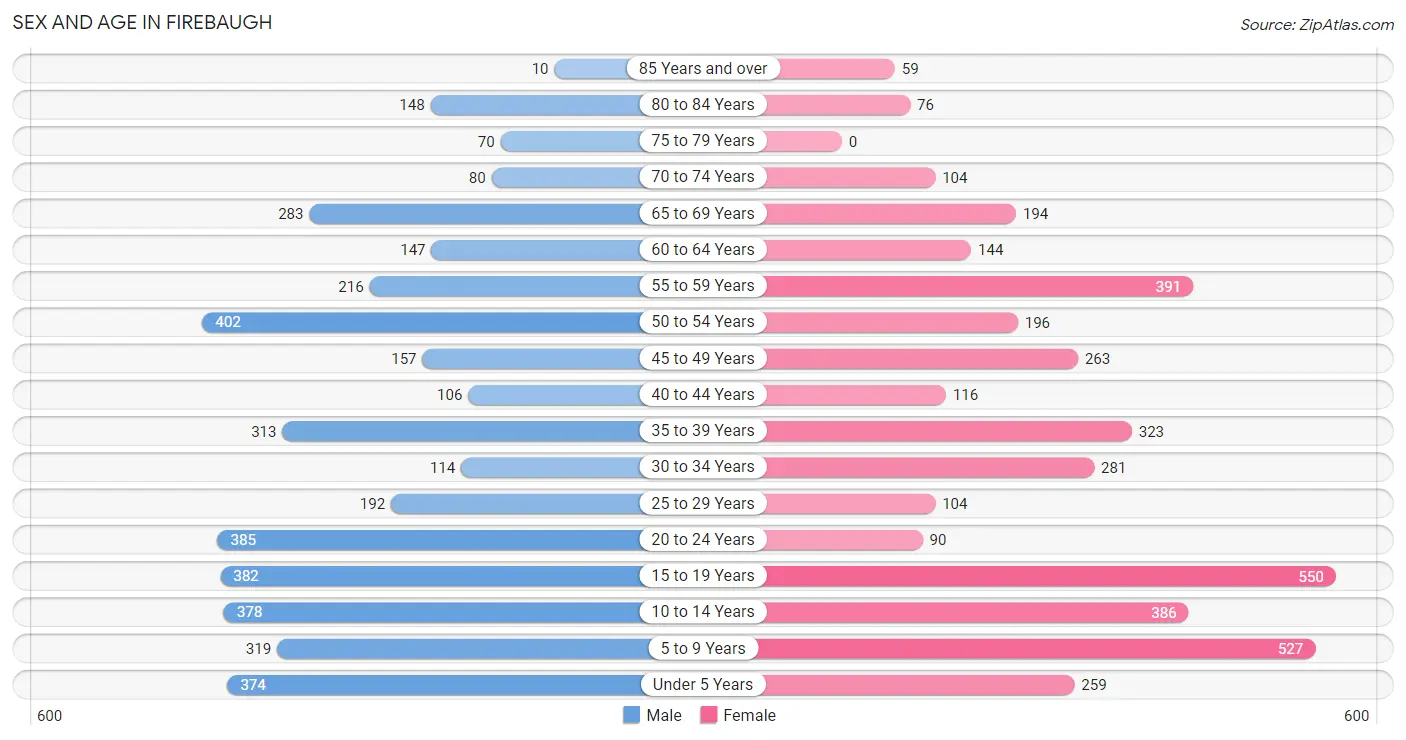
| Age Bracket | Male | Female |
| Under 5 Years | 374 (9.2%) | 259 (6.4%) |
| 5 to 9 Years | 319 (7.8%) | 527 (13.0%) |
| 10 to 14 Years | 378 (9.3%) | 386 (9.5%) |
| 15 to 19 Years | 382 (9.4%) | 550 (13.5%) |
| 20 to 24 Years | 385 (9.5%) | 90 (2.2%) |
| 25 to 29 Years | 192 (4.7%) | 104 (2.6%) |
| 30 to 34 Years | 114 (2.8%) | 281 (6.9%) |
| 35 to 39 Years | 313 (7.7%) | 323 (8.0%) |
| 40 to 44 Years | 106 (2.6%) | 116 (2.9%) |
| 45 to 49 Years | 157 (3.8%) | 263 (6.5%) |
| 50 to 54 Years | 402 (9.9%) | 196 (4.8%) |
| 55 to 59 Years | 216 (5.3%) | 391 (9.6%) |
| 60 to 64 Years | 147 (3.6%) | 144 (3.5%) |
| 65 to 69 Years | 283 (6.9%) | 194 (4.8%) |
| 70 to 74 Years | 80 (2.0%) | 104 (2.6%) |
| 75 to 79 Years | 70 (1.7%) | 0 (0.0%) |
| 80 to 84 Years | 148 (3.6%) | 76 (1.9%) |
| 85 Years and over | 10 (0.3%) | 59 (1.5%) |
| Total | 4,076 (100.0%) | 4,063 (100.0%) |
Families and Households in Firebaugh
Median Family Size in Firebaugh
The median family size in Firebaugh is 3.79 persons per family, with married-couple families (1,285 | 64.2%) accounting for the largest median family size of 4.06 persons per family. On the other hand, single male/father families (123 | 6.1%) represent the smallest median family size with 3.28 persons per family.
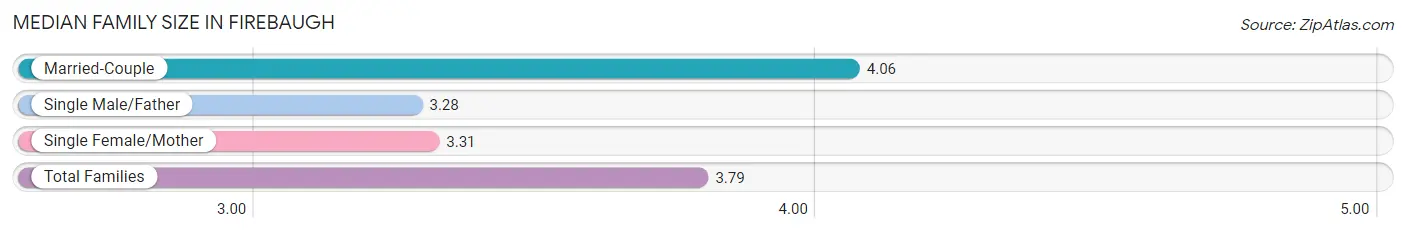
| Family Type | # Families | Family Size |
| Married-Couple | 1,285 (64.2%) | 4.06 |
| Single Male/Father | 123 (6.1%) | 3.28 |
| Single Female/Mother | 594 (29.7%) | 3.31 |
| Total Families | 2,002 (100.0%) | 3.79 |
Median Household Size in Firebaugh
The median household size in Firebaugh is 3.53 persons per household, with married-couple households (1,285 | 55.9%) accounting for the largest median household size of 4.06 persons per household. non-family households (295 | 12.8%) represent the smallest median household size with 1.07 persons per household.
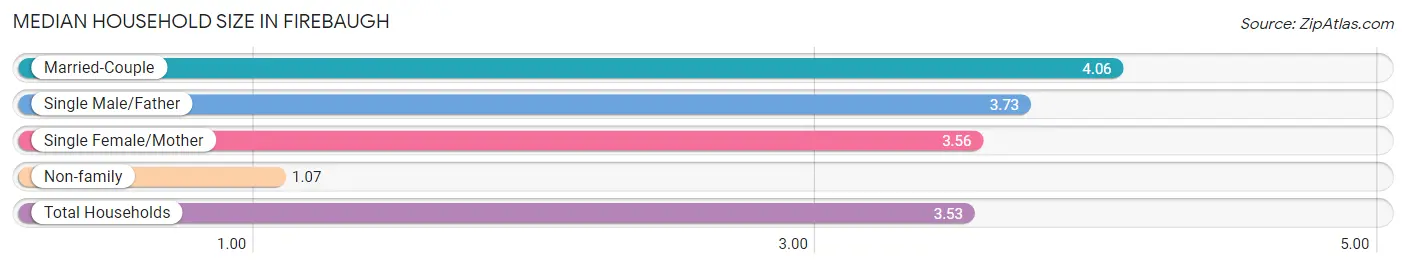
| Household Type | # Households | Household Size |
| Married-Couple | 1,285 (55.9%) | 4.06 |
| Single Male/Father | 123 (5.3%) | 3.73 |
| Single Female/Mother | 594 (25.9%) | 3.56 |
| Non-family | 295 (12.8%) | 1.07 |
| Total Households | 2,297 (100.0%) | 3.53 |
Household Size by Marriage Status in Firebaugh
Out of a total of 2,297 households in Firebaugh, 2,002 (87.2%) are family households, while 295 (12.8%) are nonfamily households. The most numerous type of family households are 3-person households, comprising 607, and the most common type of nonfamily households are 1-person households, comprising 276.
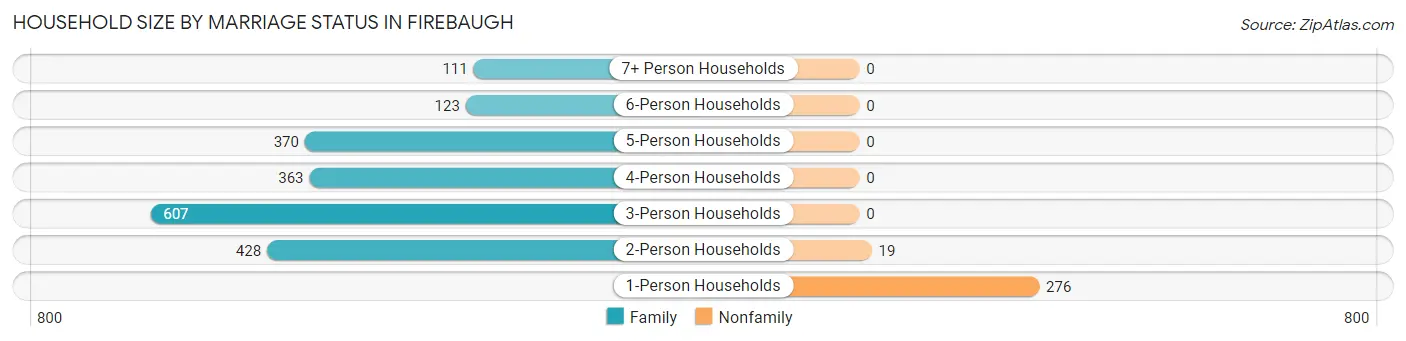
| Household Size | Family Households | Nonfamily Households |
| 1-Person Households | - | 276 (12.0%) |
| 2-Person Households | 428 (18.6%) | 19 (0.8%) |
| 3-Person Households | 607 (26.4%) | 0 (0.0%) |
| 4-Person Households | 363 (15.8%) | 0 (0.0%) |
| 5-Person Households | 370 (16.1%) | 0 (0.0%) |
| 6-Person Households | 123 (5.3%) | 0 (0.0%) |
| 7+ Person Households | 111 (4.8%) | 0 (0.0%) |
| Total | 2,002 (87.2%) | 295 (12.8%) |
Female Fertility in Firebaugh
Fertility by Age in Firebaugh
Average fertility rate in Firebaugh is 52.0 births per 1,000 women. Women in the age bracket of 20 to 34 years have the highest fertility rate with 78.0 births per 1,000 women. Women in the age bracket of 35 to 50 years acount for 60.6% of all women with births.
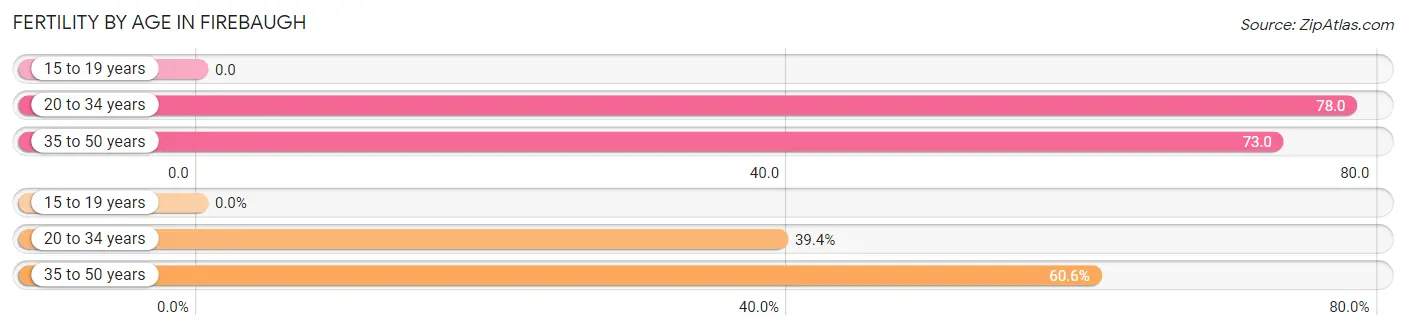
| Age Bracket | Women with Births | Births / 1,000 Women |
| 15 to 19 years | 0 (0.0%) | 0.0 |
| 20 to 34 years | 37 (39.4%) | 78.0 |
| 35 to 50 years | 57 (60.6%) | 73.0 |
| Total | 94 (100.0%) | 52.0 |
Fertility by Age by Marriage Status in Firebaugh
64.9% of women with births (94) in Firebaugh are married. The highest percentage of unmarried women with births falls into 20 to 34 years age bracket with 89.2% of them unmarried at the time of birth, while the lowest percentage of unmarried women with births belong to 35 to 50 years age bracket with 0.0% of them unmarried.
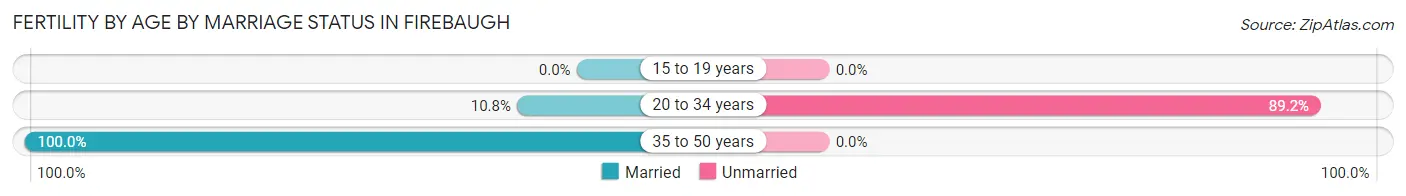
| Age Bracket | Married | Unmarried |
| 15 to 19 years | 0 (0.0%) | 0 (0.0%) |
| 20 to 34 years | 4 (10.8%) | 33 (89.2%) |
| 35 to 50 years | 57 (100.0%) | 0 (0.0%) |
| Total | 61 (64.9%) | 33 (35.1%) |
Fertility by Education in Firebaugh
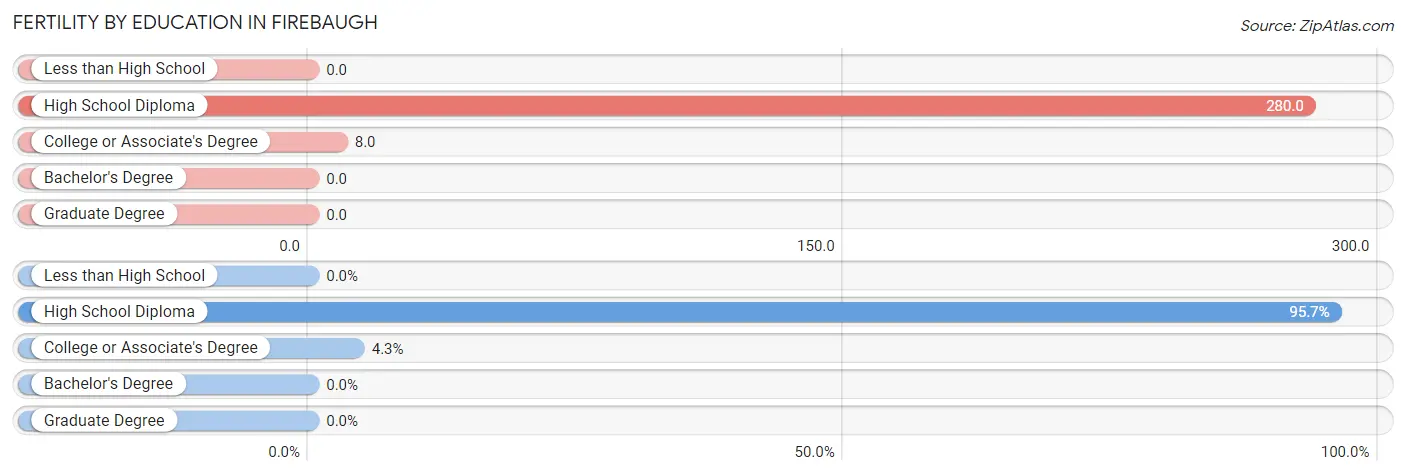
| Educational Attainment | Women with Births | Births / 1,000 Women |
| Less than High School | 0 (0.0%) | 0.0 |
| High School Diploma | 90 (95.7%) | 280.0 |
| College or Associate's Degree | 4 (4.3%) | 8.0 |
| Bachelor's Degree | 0 (0.0%) | 0.0 |
| Graduate Degree | 0 (0.0%) | 0.0 |
| Total | 94 (100.0%) | 52.0 |
Fertility by Education by Marriage Status in Firebaugh
35.1% of women with births in Firebaugh are unmarried. Women with the educational attainment of college or associate's degree are most likely to be married with 100.0% of them married at childbirth, while women with the educational attainment of high school diploma are least likely to be married with 36.7% of them unmarried at childbirth.
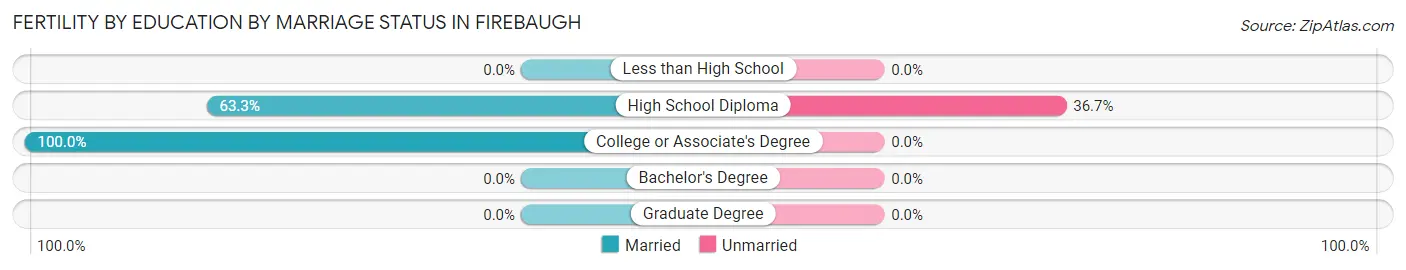
| Educational Attainment | Married | Unmarried |
| Less than High School | 0 (0.0%) | 0 (0.0%) |
| High School Diploma | 57 (63.3%) | 33 (36.7%) |
| College or Associate's Degree | 4 (100.0%) | 0 (0.0%) |
| Bachelor's Degree | 0 (0.0%) | 0 (0.0%) |
| Graduate Degree | 0 (0.0%) | 0 (0.0%) |
| Total | 61 (64.9%) | 33 (35.1%) |
Employment Characteristics in Firebaugh
Employment by Class of Employer in Firebaugh
Among the 2,054 employed individuals in Firebaugh, private company employees (1,664 | 81.0%), local government employees (239 | 11.6%), and not-for-profit organizations (111 | 5.4%) make up the most common classes of employment.
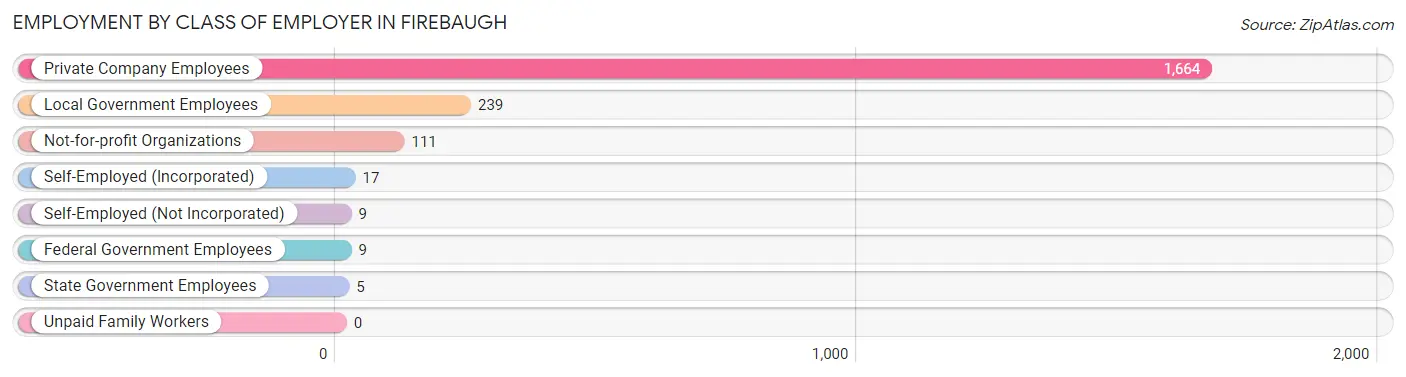
| Employer Class | # Employees | % Employees |
| Private Company Employees | 1,664 | 81.0% |
| Self-Employed (Incorporated) | 17 | 0.8% |
| Self-Employed (Not Incorporated) | 9 | 0.4% |
| Not-for-profit Organizations | 111 | 5.4% |
| Local Government Employees | 239 | 11.6% |
| State Government Employees | 5 | 0.2% |
| Federal Government Employees | 9 | 0.4% |
| Unpaid Family Workers | 0 | 0.0% |
| Total | 2,054 | 100.0% |
Employment Status by Age in Firebaugh
According to the labor force statistics for Firebaugh, out of the total population over 16 years of age (5,689), 50.9% or 2,896 individuals are in the labor force, with 18.3% or 530 of them unemployed. The age group with the highest labor force participation rate is 25 to 29 years, with 84.8% or 251 individuals in the labor force. Within the labor force, the 25 to 29 years age range has the highest percentage of unemployed individuals, with 35.1% or 88 of them being unemployed.
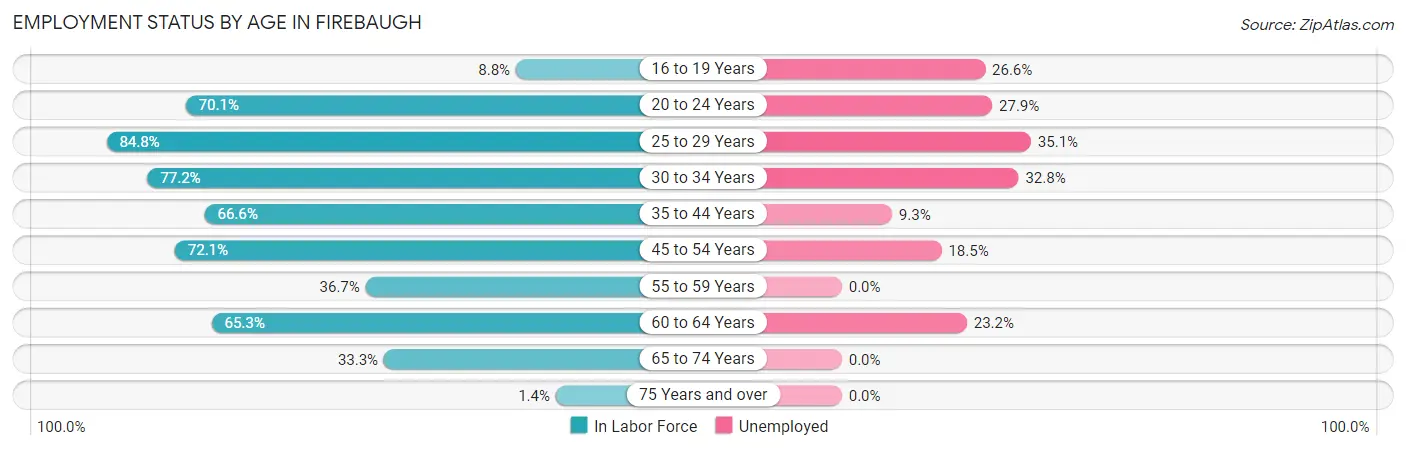
| Age Bracket | In Labor Force | Unemployed |
| 16 to 19 Years | 64 (8.8%) | 17 (26.6%) |
| 20 to 24 Years | 333 (70.1%) | 93 (27.9%) |
| 25 to 29 Years | 251 (84.8%) | 88 (35.1%) |
| 30 to 34 Years | 305 (77.2%) | 100 (32.8%) |
| 35 to 44 Years | 571 (66.6%) | 53 (9.3%) |
| 45 to 54 Years | 734 (72.1%) | 136 (18.5%) |
| 55 to 59 Years | 223 (36.7%) | 0 (0.0%) |
| 60 to 64 Years | 190 (65.3%) | 44 (23.2%) |
| 65 to 74 Years | 220 (33.3%) | 0 (0.0%) |
| 75 Years and over | 5 (1.4%) | 0 (0.0%) |
| Total | 2,896 (50.9%) | 530 (18.3%) |
Employment Status by Educational Attainment in Firebaugh
According to labor force statistics for Firebaugh, 65.6% of individuals (2,273) out of the total population between 25 and 64 years of age (3,465) are in the labor force, with 18.5% or 421 of them being unemployed. The group with the highest labor force participation rate are those with the educational attainment of bachelor's degree or higher, with 87.7% or 136 individuals in the labor force. Within the labor force, individuals with college / associate degree education have the highest percentage of unemployment, with 23.6% or 87 of them being unemployed.
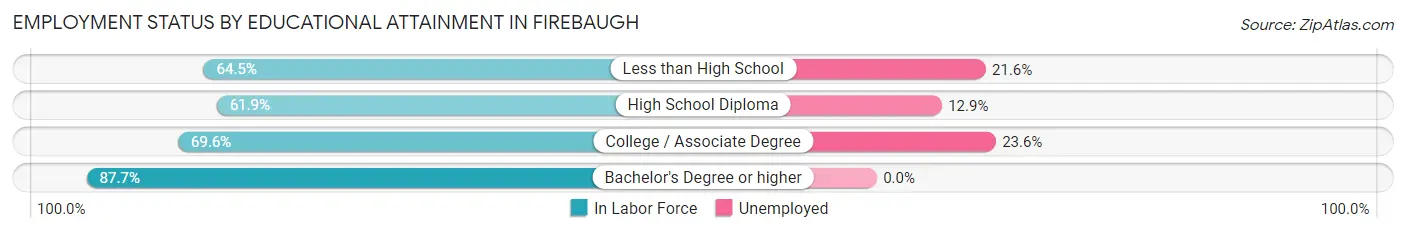
| Educational Attainment | In Labor Force | Unemployed |
| Less than High School | 1,213 (64.5%) | 406 (21.6%) |
| High School Diploma | 557 (61.9%) | 116 (12.9%) |
| College / Associate Degree | 368 (69.6%) | 125 (23.6%) |
| Bachelor's Degree or higher | 136 (87.7%) | 0 (0.0%) |
| Total | 2,273 (65.6%) | 641 (18.5%) |
Employment Occupations by Sex in Firebaugh
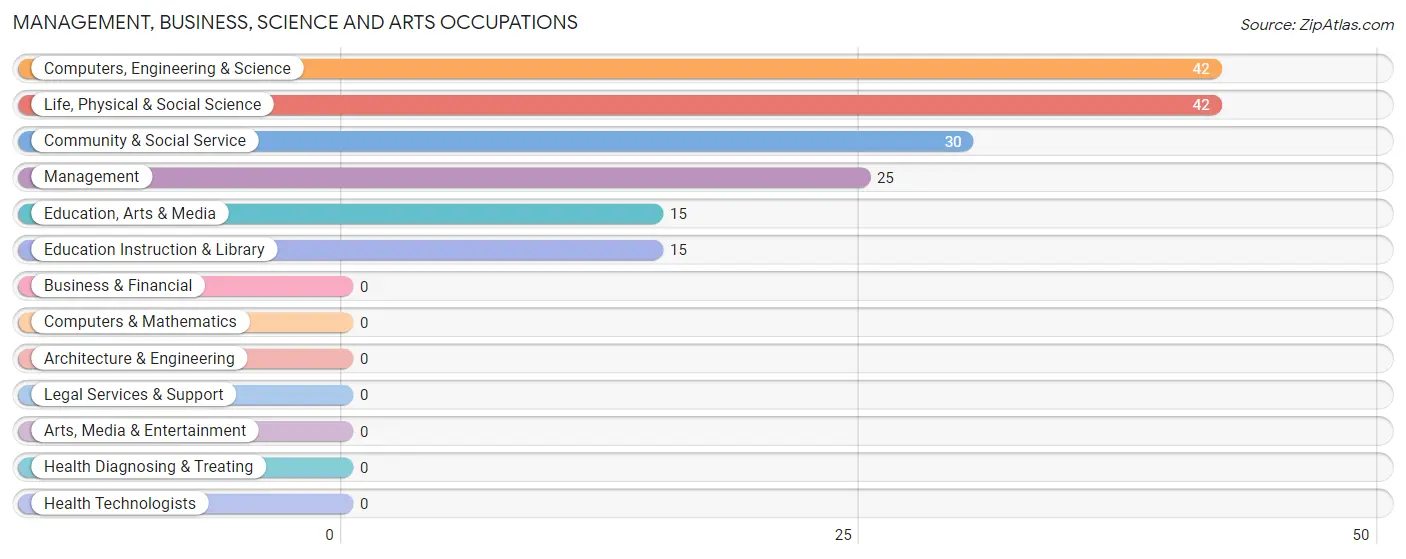
Management, Business, Science and Arts Occupations
The most common Management, Business, Science and Arts occupations in Firebaugh are Computers, Engineering & Science (42 | 1.8%), Life, Physical & Social Science (42 | 1.8%), Community & Social Service (30 | 1.3%), Management (25 | 1.1%), and Education, Arts & Media (15 | 0.6%).
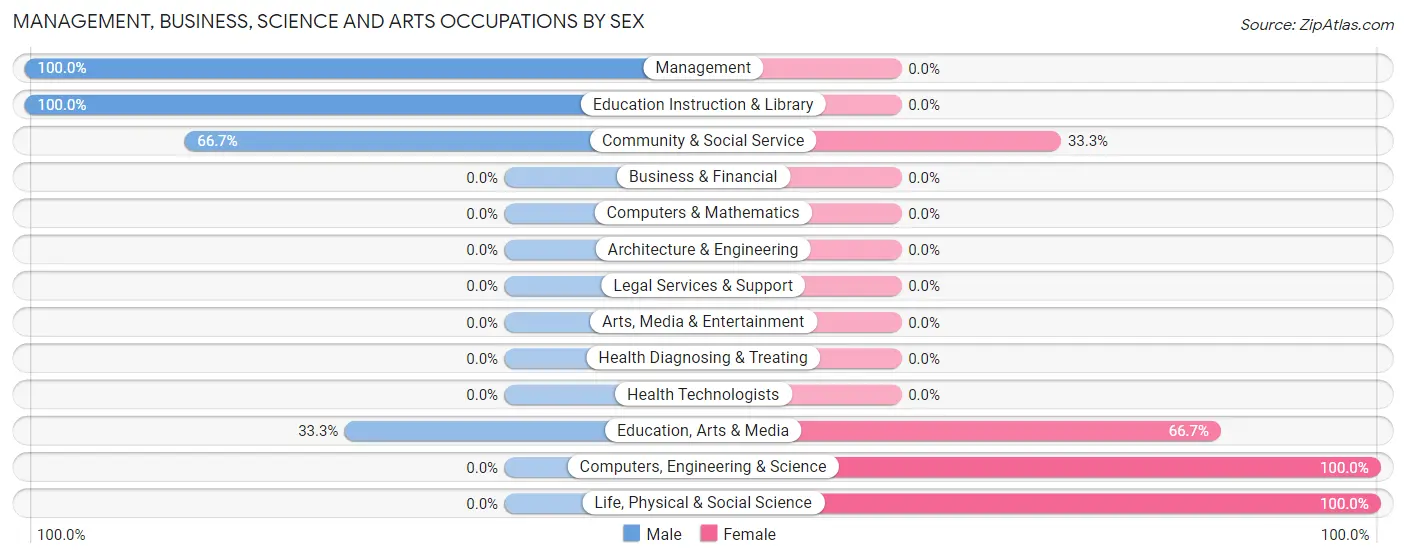
Management, Business, Science and Arts Occupations by Sex
Within the Management, Business, Science and Arts occupations in Firebaugh, the most male-oriented occupations are Management (100.0%), Education Instruction & Library (100.0%), and Community & Social Service (66.7%), while the most female-oriented occupations are Computers, Engineering & Science (100.0%), Life, Physical & Social Science (100.0%), and Education, Arts & Media (66.7%).
| Occupation | Male | Female |
| Management | 25 (100.0%) | 0 (0.0%) |
| Business & Financial | 0 (0.0%) | 0 (0.0%) |
| Computers, Engineering & Science | 0 (0.0%) | 42 (100.0%) |
| Computers & Mathematics | 0 (0.0%) | 0 (0.0%) |
| Architecture & Engineering | 0 (0.0%) | 0 (0.0%) |
| Life, Physical & Social Science | 0 (0.0%) | 42 (100.0%) |
| Community & Social Service | 20 (66.7%) | 10 (33.3%) |
| Education, Arts & Media | 5 (33.3%) | 10 (66.7%) |
| Legal Services & Support | 0 (0.0%) | 0 (0.0%) |
| Education Instruction & Library | 15 (100.0%) | 0 (0.0%) |
| Arts, Media & Entertainment | 0 (0.0%) | 0 (0.0%) |
| Health Diagnosing & Treating | 0 (0.0%) | 0 (0.0%) |
| Health Technologists | 0 (0.0%) | 0 (0.0%) |
| Total (Category) | 45 (46.4%) | 52 (53.6%) |
| Total (Overall) | 1,498 (63.3%) | 867 (36.7%) |
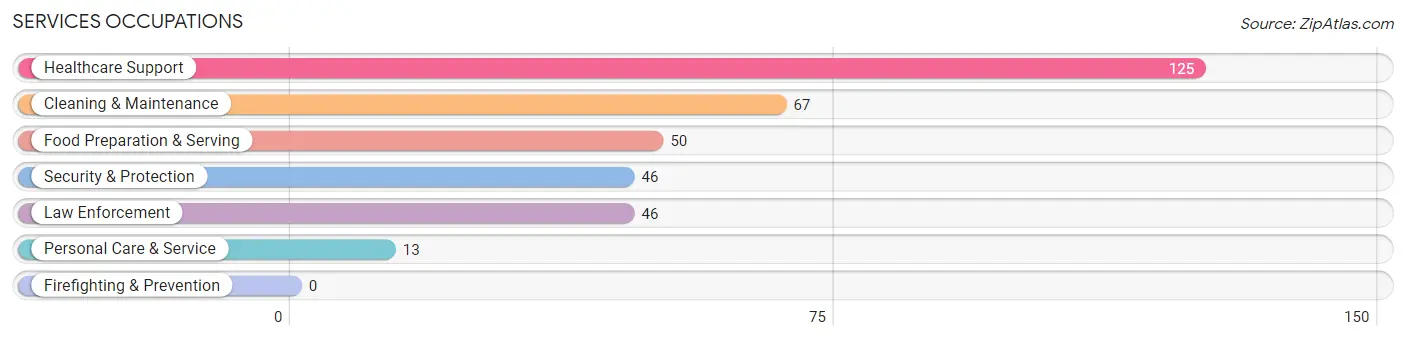
Services Occupations
The most common Services occupations in Firebaugh are Healthcare Support (125 | 5.3%), Cleaning & Maintenance (67 | 2.8%), Food Preparation & Serving (50 | 2.1%), Security & Protection (46 | 1.9%), and Law Enforcement (46 | 1.9%).
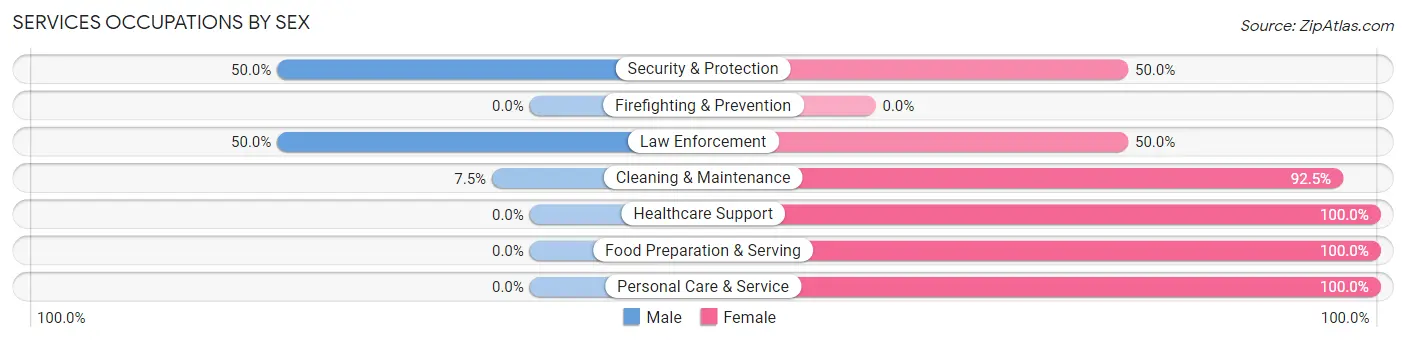
Services Occupations by Sex
Within the Services occupations in Firebaugh, the most male-oriented occupations are Security & Protection (50.0%), Law Enforcement (50.0%), and Cleaning & Maintenance (7.5%), while the most female-oriented occupations are Healthcare Support (100.0%), Food Preparation & Serving (100.0%), and Personal Care & Service (100.0%).
| Occupation | Male | Female |
| Healthcare Support | 0 (0.0%) | 125 (100.0%) |
| Security & Protection | 23 (50.0%) | 23 (50.0%) |
| Firefighting & Prevention | 0 (0.0%) | 0 (0.0%) |
| Law Enforcement | 23 (50.0%) | 23 (50.0%) |
| Food Preparation & Serving | 0 (0.0%) | 50 (100.0%) |
| Cleaning & Maintenance | 5 (7.5%) | 62 (92.5%) |
| Personal Care & Service | 0 (0.0%) | 13 (100.0%) |
| Total (Category) | 28 (9.3%) | 273 (90.7%) |
| Total (Overall) | 1,498 (63.3%) | 867 (36.7%) |
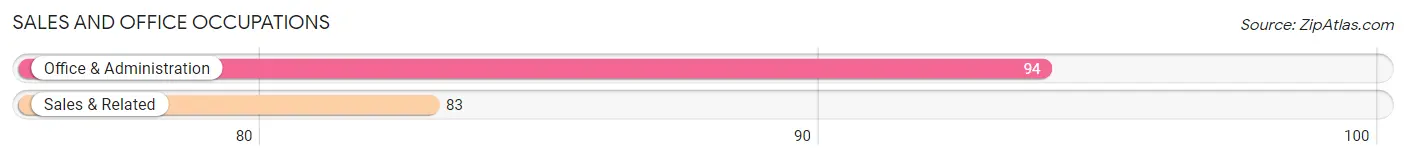
Sales and Office Occupations
The most common Sales and Office occupations in Firebaugh are Office & Administration (94 | 4.0%), and Sales & Related (83 | 3.5%).
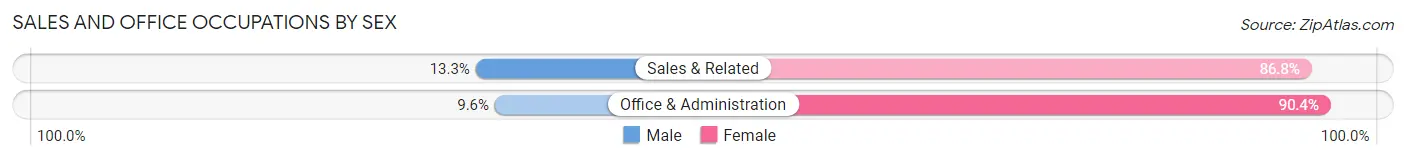
Sales and Office Occupations by Sex
| Occupation | Male | Female |
| Sales & Related | 11 (13.3%) | 72 (86.8%) |
| Office & Administration | 9 (9.6%) | 85 (90.4%) |
| Total (Category) | 20 (11.3%) | 157 (88.7%) |
| Total (Overall) | 1,498 (63.3%) | 867 (36.7%) |
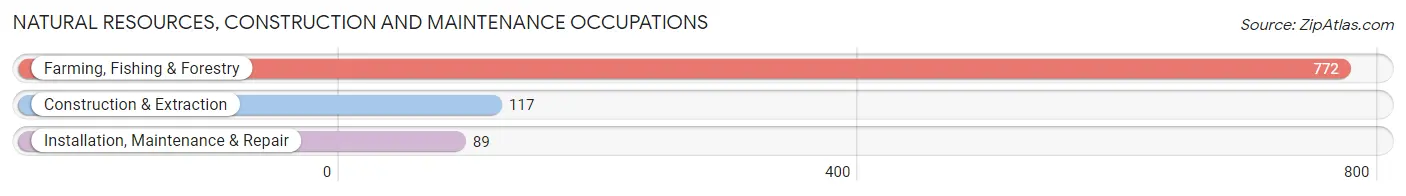
Natural Resources, Construction and Maintenance Occupations
The most common Natural Resources, Construction and Maintenance occupations in Firebaugh are Farming, Fishing & Forestry (772 | 32.6%), Construction & Extraction (117 | 5.0%), and Installation, Maintenance & Repair (89 | 3.8%).
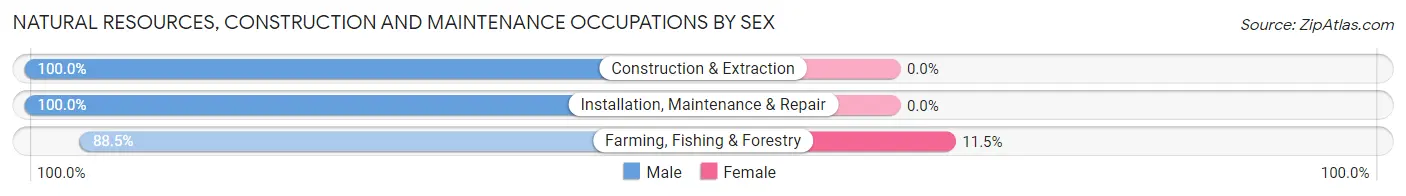
Natural Resources, Construction and Maintenance Occupations by Sex
| Occupation | Male | Female |
| Farming, Fishing & Forestry | 683 (88.5%) | 89 (11.5%) |
| Construction & Extraction | 117 (100.0%) | 0 (0.0%) |
| Installation, Maintenance & Repair | 89 (100.0%) | 0 (0.0%) |
| Total (Category) | 889 (90.9%) | 89 (9.1%) |
| Total (Overall) | 1,498 (63.3%) | 867 (36.7%) |
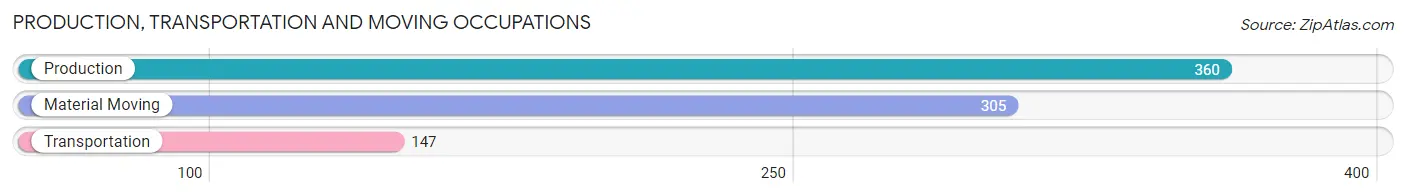
Production, Transportation and Moving Occupations
The most common Production, Transportation and Moving occupations in Firebaugh are Production (360 | 15.2%), Material Moving (305 | 12.9%), and Transportation (147 | 6.2%).
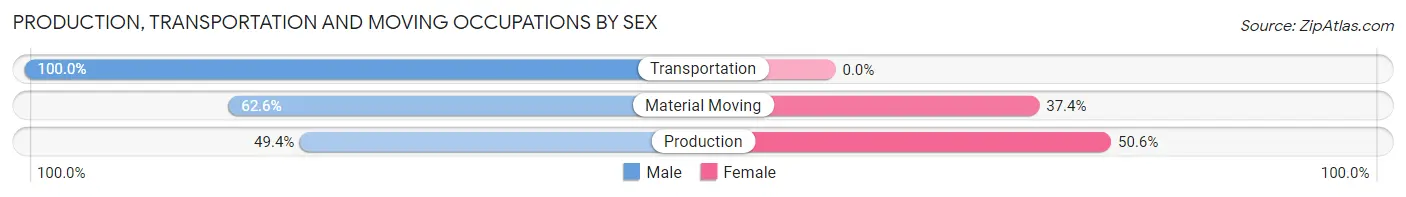
Production, Transportation and Moving Occupations by Sex
| Occupation | Male | Female |
| Production | 178 (49.4%) | 182 (50.6%) |
| Transportation | 147 (100.0%) | 0 (0.0%) |
| Material Moving | 191 (62.6%) | 114 (37.4%) |
| Total (Category) | 516 (63.5%) | 296 (36.4%) |
| Total (Overall) | 1,498 (63.3%) | 867 (36.7%) |
Employment Industries by Sex in Firebaugh
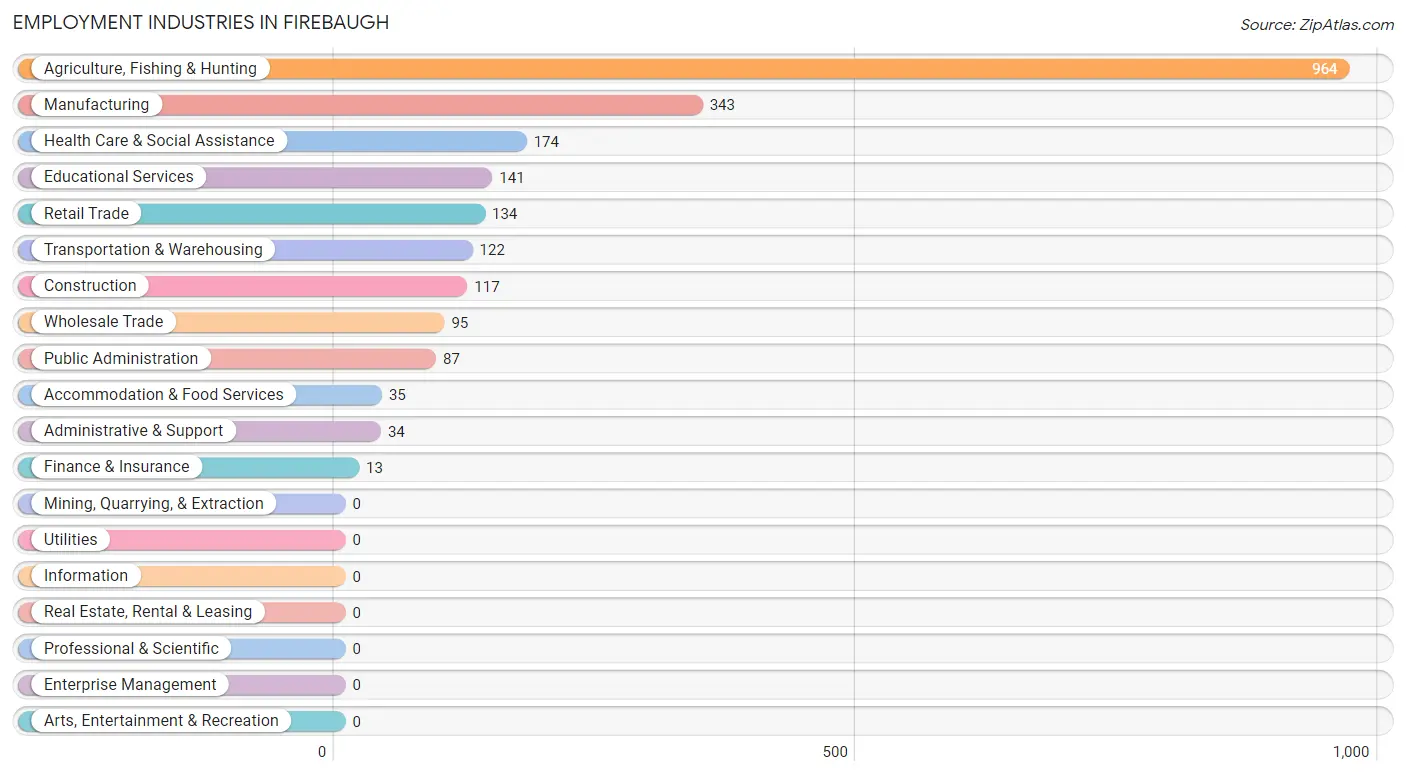
Employment Industries in Firebaugh
The major employment industries in Firebaugh include Agriculture, Fishing & Hunting (964 | 40.8%), Manufacturing (343 | 14.5%), Health Care & Social Assistance (174 | 7.4%), Educational Services (141 | 6.0%), and Retail Trade (134 | 5.7%).
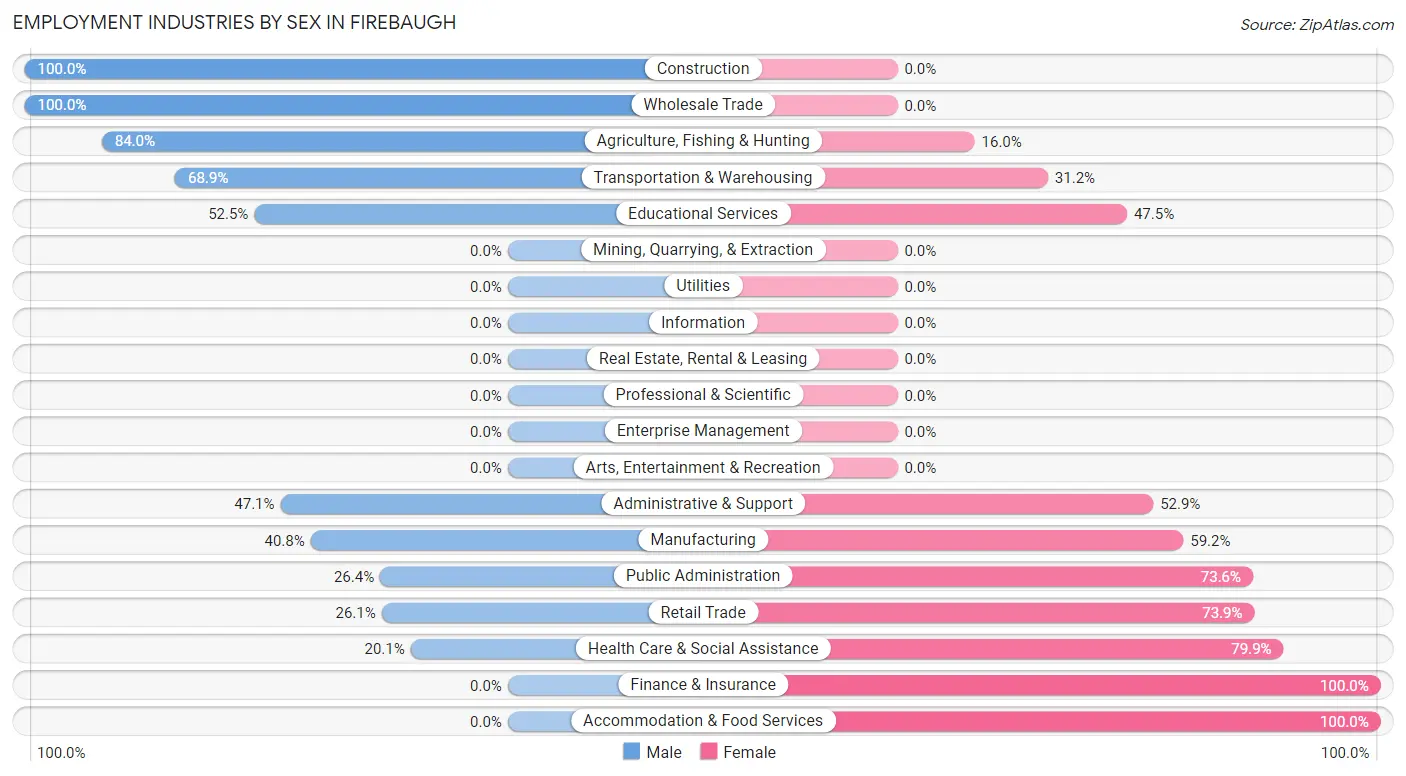
Employment Industries by Sex in Firebaugh
The Firebaugh industries that see more men than women are Construction (100.0%), Wholesale Trade (100.0%), and Agriculture, Fishing & Hunting (84.0%), whereas the industries that tend to have a higher number of women are Finance & Insurance (100.0%), Accommodation & Food Services (100.0%), and Health Care & Social Assistance (79.9%).
| Industry | Male | Female |
| Agriculture, Fishing & Hunting | 810 (84.0%) | 154 (16.0%) |
| Mining, Quarrying, & Extraction | 0 (0.0%) | 0 (0.0%) |
| Construction | 117 (100.0%) | 0 (0.0%) |
| Manufacturing | 140 (40.8%) | 203 (59.2%) |
| Wholesale Trade | 95 (100.0%) | 0 (0.0%) |
| Retail Trade | 35 (26.1%) | 99 (73.9%) |
| Transportation & Warehousing | 84 (68.9%) | 38 (31.1%) |
| Utilities | 0 (0.0%) | 0 (0.0%) |
| Information | 0 (0.0%) | 0 (0.0%) |
| Finance & Insurance | 0 (0.0%) | 13 (100.0%) |
| Real Estate, Rental & Leasing | 0 (0.0%) | 0 (0.0%) |
| Professional & Scientific | 0 (0.0%) | 0 (0.0%) |
| Enterprise Management | 0 (0.0%) | 0 (0.0%) |
| Administrative & Support | 16 (47.1%) | 18 (52.9%) |
| Educational Services | 74 (52.5%) | 67 (47.5%) |
| Health Care & Social Assistance | 35 (20.1%) | 139 (79.9%) |
| Arts, Entertainment & Recreation | 0 (0.0%) | 0 (0.0%) |
| Accommodation & Food Services | 0 (0.0%) | 35 (100.0%) |
| Public Administration | 23 (26.4%) | 64 (73.6%) |
| Total | 1,498 (63.3%) | 867 (36.7%) |
Education in Firebaugh
School Enrollment in Firebaugh
The most common levels of schooling among the 2,644 students in Firebaugh are high school (855 | 32.3%), middle school (582 | 22.0%), and elementary school (542 | 20.5%).
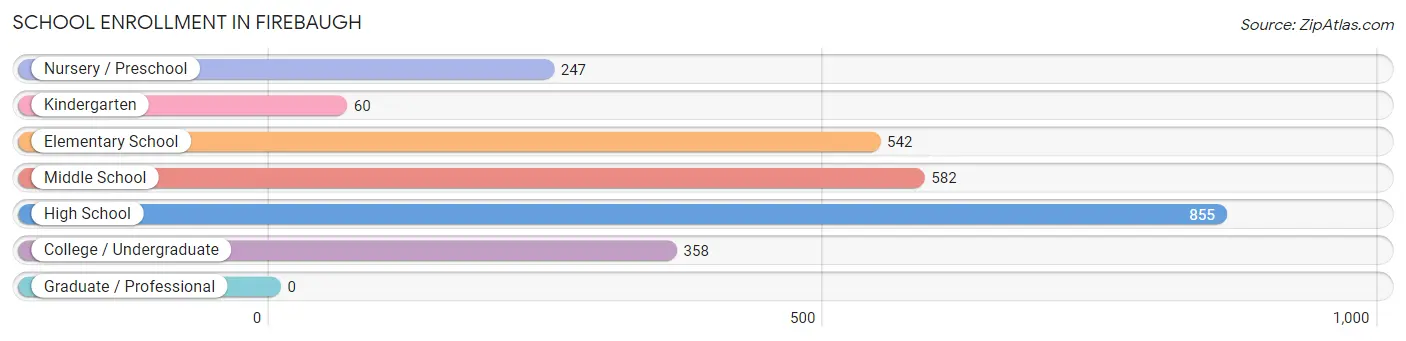
| School Level | # Students | % Students |
| Nursery / Preschool | 247 | 9.3% |
| Kindergarten | 60 | 2.3% |
| Elementary School | 542 | 20.5% |
| Middle School | 582 | 22.0% |
| High School | 855 | 32.3% |
| College / Undergraduate | 358 | 13.5% |
| Graduate / Professional | 0 | 0.0% |
| Total | 2,644 | 100.0% |
School Enrollment by Age by Funding Source in Firebaugh
Out of a total of 2,644 students who are enrolled in schools in Firebaugh, 16 (0.6%) attend a private institution, while the remaining 2,628 (99.4%) are enrolled in public schools. The age group of 18 to 19 year olds has the highest likelihood of being enrolled in private schools, with 17 (6.8% in the age bracket) enrolled. Conversely, the age group of 3 to 4 year olds has the lowest likelihood of being enrolled in a private school, with 237 (100.0% in the age bracket) attending a public institution.
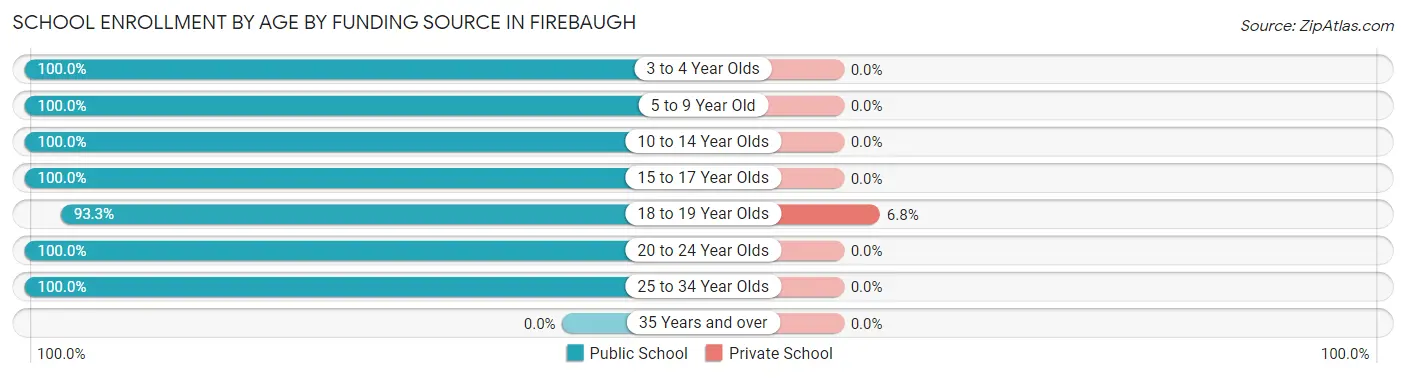
| Age Bracket | Public School | Private School |
| 3 to 4 Year Olds | 237 (100.0%) | 0 (0.0%) |
| 5 to 9 Year Old | 678 (100.0%) | 0 (0.0%) |
| 10 to 14 Year Olds | 731 (100.0%) | 0 (0.0%) |
| 15 to 17 Year Olds | 571 (100.0%) | 0 (0.0%) |
| 18 to 19 Year Olds | 235 (93.2%) | 17 (6.8%) |
| 20 to 24 Year Olds | 134 (100.0%) | 0 (0.0%) |
| 25 to 34 Year Olds | 41 (100.0%) | 0 (0.0%) |
| 35 Years and over | 0 (0.0%) | 0 (0.0%) |
| Total | 2,628 (99.4%) | 16 (0.6%) |
Educational Attainment by Field of Study in Firebaugh
Visual & performing arts (47 | 26.7%), education (33 | 18.8%), science & technology (25 | 14.2%), social sciences (18 | 10.2%), and engineering (16 | 9.1%) are the most common fields of study among 176 individuals in Firebaugh who have obtained a bachelor's degree or higher.
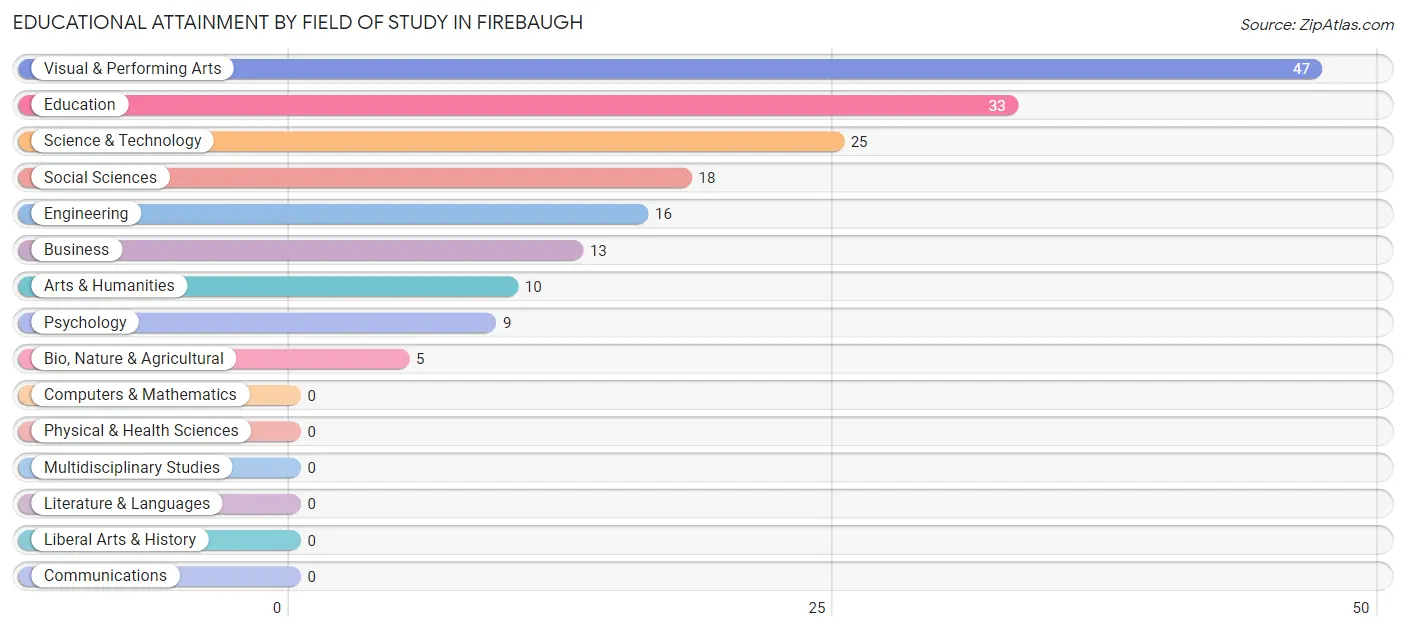
| Field of Study | # Graduates | % Graduates |
| Computers & Mathematics | 0 | 0.0% |
| Bio, Nature & Agricultural | 5 | 2.8% |
| Physical & Health Sciences | 0 | 0.0% |
| Psychology | 9 | 5.1% |
| Social Sciences | 18 | 10.2% |
| Engineering | 16 | 9.1% |
| Multidisciplinary Studies | 0 | 0.0% |
| Science & Technology | 25 | 14.2% |
| Business | 13 | 7.4% |
| Education | 33 | 18.8% |
| Literature & Languages | 0 | 0.0% |
| Liberal Arts & History | 0 | 0.0% |
| Visual & Performing Arts | 47 | 26.7% |
| Communications | 0 | 0.0% |
| Arts & Humanities | 10 | 5.7% |
| Total | 176 | 100.0% |
Transportation & Commute in Firebaugh
Vehicle Availability by Sex in Firebaugh
The most prevalent vehicle ownership categories in Firebaugh are males with 3 vehicles (291, accounting for 22.6%) and females with 3 vehicles (241, making up 38.1%).
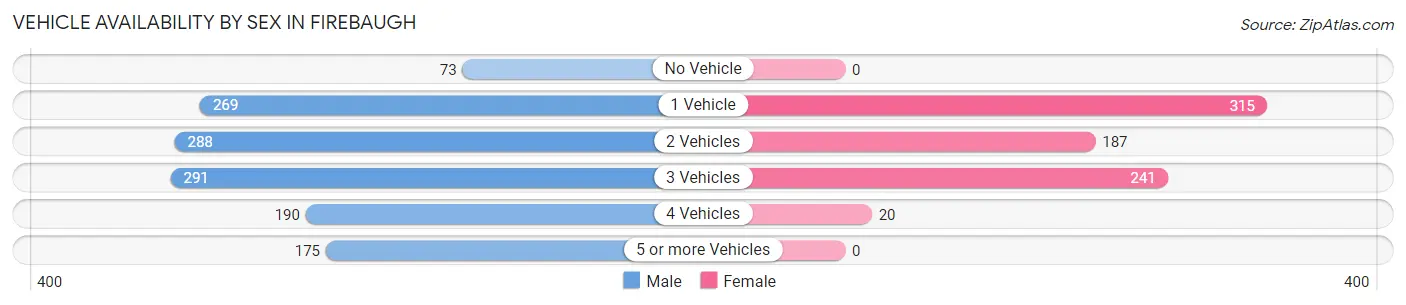
| Vehicles Available | Male | Female |
| No Vehicle | 73 (5.7%) | 0 (0.0%) |
| 1 Vehicle | 269 (20.9%) | 315 (41.3%) |
| 2 Vehicles | 288 (22.4%) | 187 (24.5%) |
| 3 Vehicles | 291 (22.6%) | 241 (31.6%) |
| 4 Vehicles | 190 (14.8%) | 20 (2.6%) |
| 5 or more Vehicles | 175 (13.6%) | 0 (0.0%) |
| Total | 1,286 (100.0%) | 763 (100.0%) |
Commute Time in Firebaugh
The most frequently occuring commute durations in Firebaugh are 10 to 14 minutes (444 commuters, 22.3%), 30 to 34 minutes (440 commuters, 22.1%), and 45 to 59 minutes (309 commuters, 15.5%).
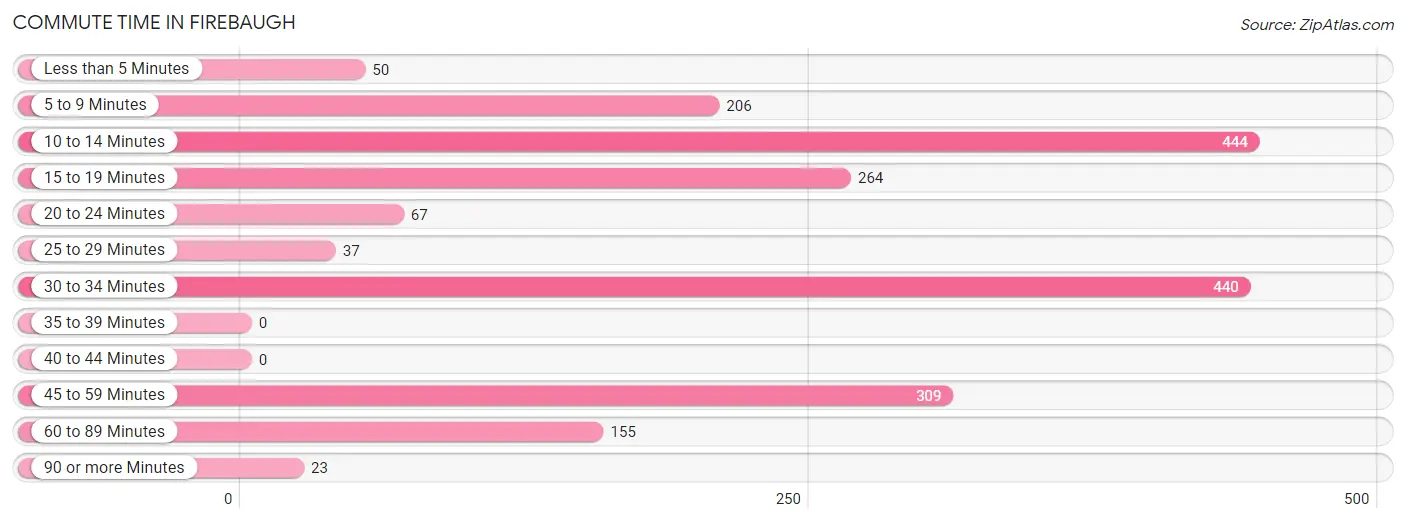
| Commute Time | # Commuters | % Commuters |
| Less than 5 Minutes | 50 | 2.5% |
| 5 to 9 Minutes | 206 | 10.3% |
| 10 to 14 Minutes | 444 | 22.3% |
| 15 to 19 Minutes | 264 | 13.2% |
| 20 to 24 Minutes | 67 | 3.4% |
| 25 to 29 Minutes | 37 | 1.8% |
| 30 to 34 Minutes | 440 | 22.1% |
| 35 to 39 Minutes | 0 | 0.0% |
| 40 to 44 Minutes | 0 | 0.0% |
| 45 to 59 Minutes | 309 | 15.5% |
| 60 to 89 Minutes | 155 | 7.8% |
| 90 or more Minutes | 23 | 1.1% |
Commute Time by Sex in Firebaugh
The most common commute times in Firebaugh are 30 to 34 minutes (370 commuters, 28.7%) for males and 10 to 14 minutes (221 commuters, 31.4%) for females.
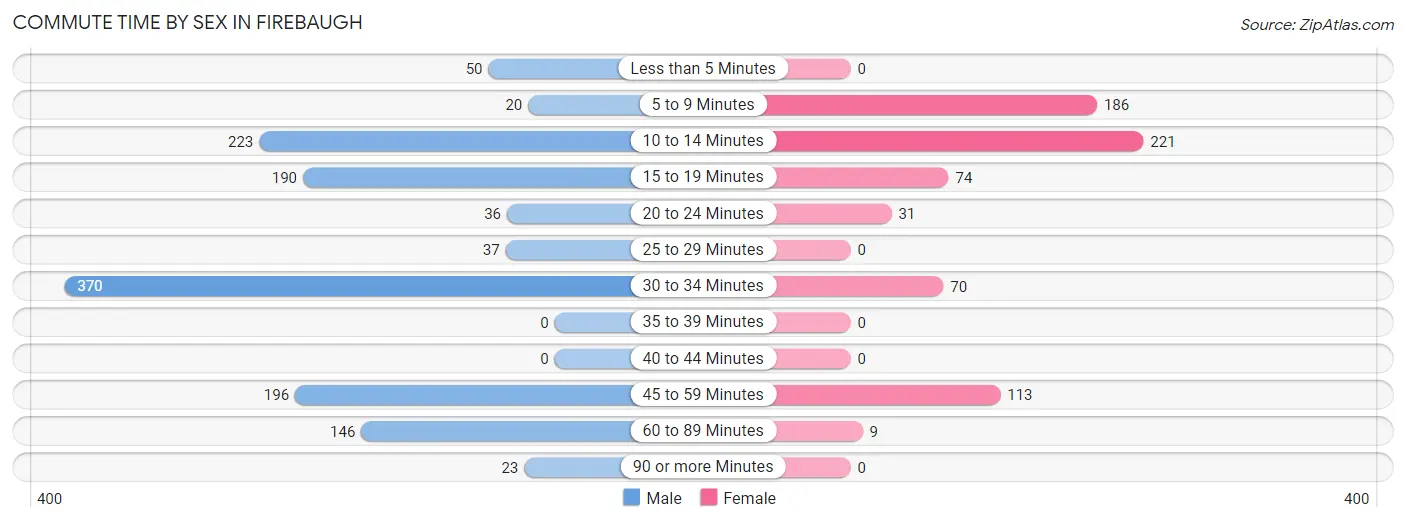
| Commute Time | Male | Female |
| Less than 5 Minutes | 50 (3.9%) | 0 (0.0%) |
| 5 to 9 Minutes | 20 (1.5%) | 186 (26.4%) |
| 10 to 14 Minutes | 223 (17.3%) | 221 (31.4%) |
| 15 to 19 Minutes | 190 (14.7%) | 74 (10.5%) |
| 20 to 24 Minutes | 36 (2.8%) | 31 (4.4%) |
| 25 to 29 Minutes | 37 (2.9%) | 0 (0.0%) |
| 30 to 34 Minutes | 370 (28.7%) | 70 (9.9%) |
| 35 to 39 Minutes | 0 (0.0%) | 0 (0.0%) |
| 40 to 44 Minutes | 0 (0.0%) | 0 (0.0%) |
| 45 to 59 Minutes | 196 (15.2%) | 113 (16.1%) |
| 60 to 89 Minutes | 146 (11.3%) | 9 (1.3%) |
| 90 or more Minutes | 23 (1.8%) | 0 (0.0%) |
Time of Departure to Work by Sex in Firebaugh
The most frequent times of departure to work in Firebaugh are 6:30 AM to 6:59 AM (403, 31.2%) for males and 6:00 AM to 6:29 AM (147, 20.9%) for females.
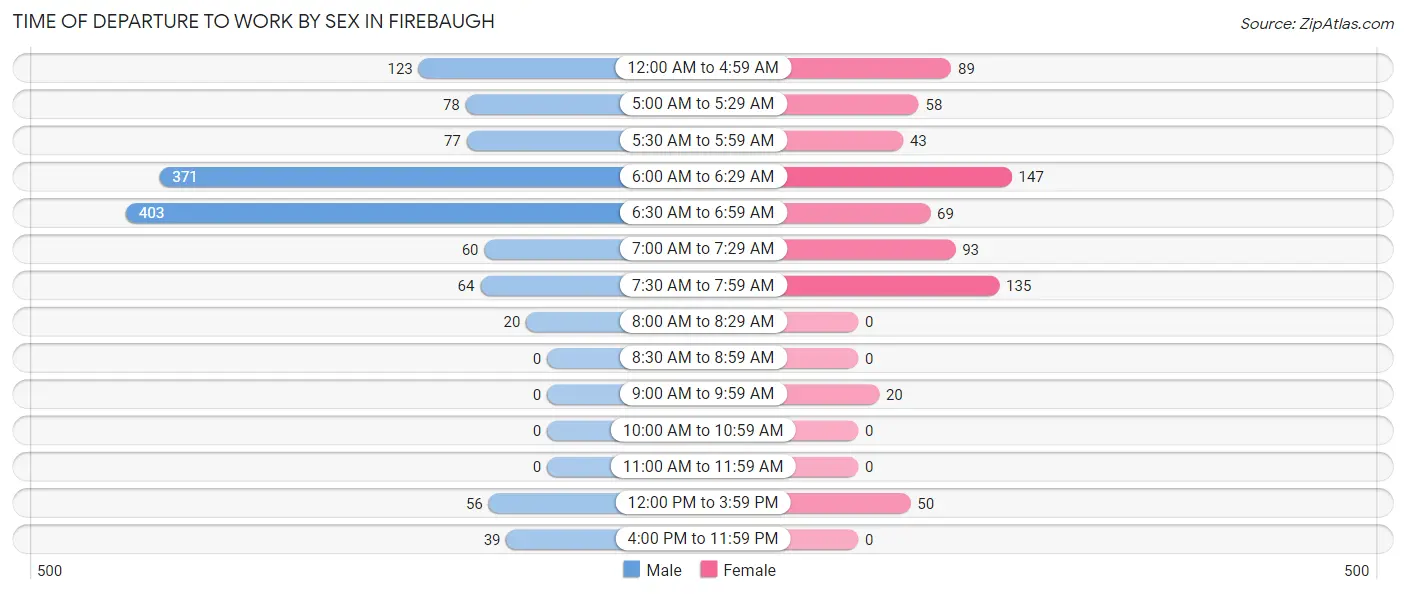
| Time of Departure | Male | Female |
| 12:00 AM to 4:59 AM | 123 (9.5%) | 89 (12.6%) |
| 5:00 AM to 5:29 AM | 78 (6.0%) | 58 (8.2%) |
| 5:30 AM to 5:59 AM | 77 (6.0%) | 43 (6.1%) |
| 6:00 AM to 6:29 AM | 371 (28.7%) | 147 (20.9%) |
| 6:30 AM to 6:59 AM | 403 (31.2%) | 69 (9.8%) |
| 7:00 AM to 7:29 AM | 60 (4.6%) | 93 (13.2%) |
| 7:30 AM to 7:59 AM | 64 (5.0%) | 135 (19.2%) |
| 8:00 AM to 8:29 AM | 20 (1.5%) | 0 (0.0%) |
| 8:30 AM to 8:59 AM | 0 (0.0%) | 0 (0.0%) |
| 9:00 AM to 9:59 AM | 0 (0.0%) | 20 (2.8%) |
| 10:00 AM to 10:59 AM | 0 (0.0%) | 0 (0.0%) |
| 11:00 AM to 11:59 AM | 0 (0.0%) | 0 (0.0%) |
| 12:00 PM to 3:59 PM | 56 (4.3%) | 50 (7.1%) |
| 4:00 PM to 11:59 PM | 39 (3.0%) | 0 (0.0%) |
| Total | 1,291 (100.0%) | 704 (100.0%) |
Housing Occupancy in Firebaugh
Occupancy by Ownership in Firebaugh
Of the total 2,297 dwellings in Firebaugh, owner-occupied units account for 1,108 (48.2%), while renter-occupied units make up 1,189 (51.8%).
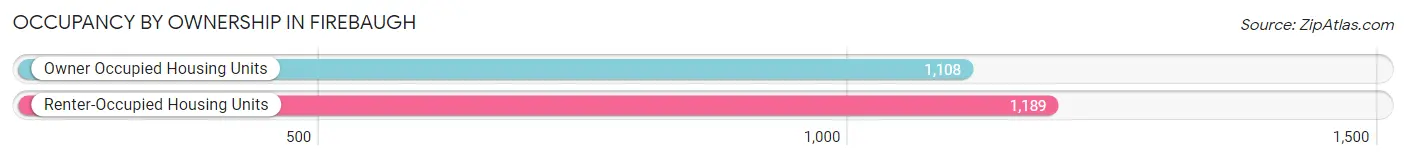
| Occupancy | # Housing Units | % Housing Units |
| Owner Occupied Housing Units | 1,108 | 48.2% |
| Renter-Occupied Housing Units | 1,189 | 51.8% |
| Total Occupied Housing Units | 2,297 | 100.0% |
Occupancy by Household Size in Firebaugh
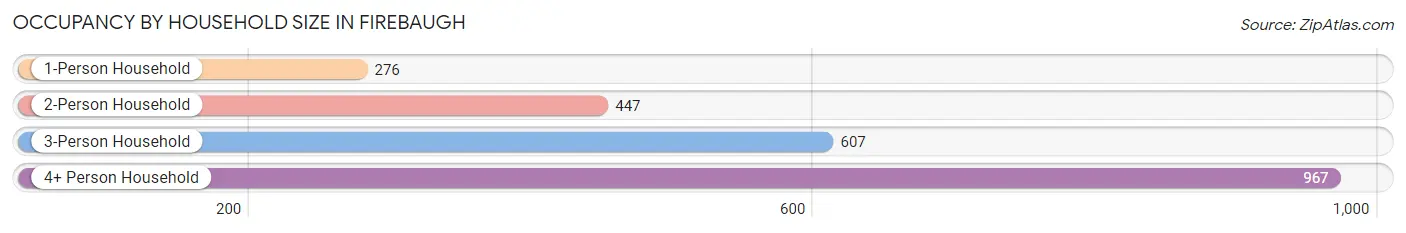
| Household Size | # Housing Units | % Housing Units |
| 1-Person Household | 276 | 12.0% |
| 2-Person Household | 447 | 19.5% |
| 3-Person Household | 607 | 26.4% |
| 4+ Person Household | 967 | 42.1% |
| Total Housing Units | 2,297 | 100.0% |
Occupancy by Ownership by Household Size in Firebaugh
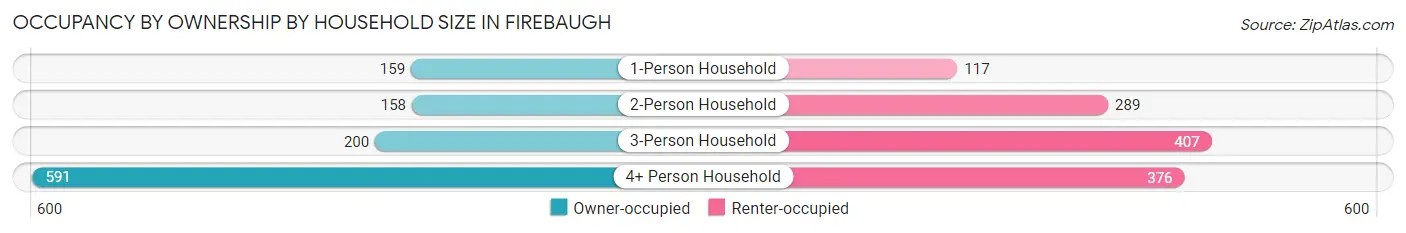
| Household Size | Owner-occupied | Renter-occupied |
| 1-Person Household | 159 (57.6%) | 117 (42.4%) |
| 2-Person Household | 158 (35.3%) | 289 (64.6%) |
| 3-Person Household | 200 (33.0%) | 407 (67.0%) |
| 4+ Person Household | 591 (61.1%) | 376 (38.9%) |
| Total Housing Units | 1,108 (48.2%) | 1,189 (51.8%) |
Occupancy by Educational Attainment in Firebaugh
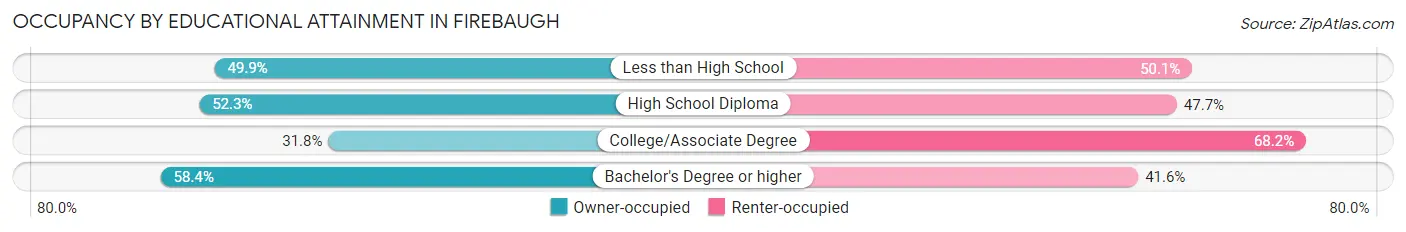
| Household Size | Owner-occupied | Renter-occupied |
| Less than High School | 616 (49.9%) | 619 (50.1%) |
| High School Diploma | 341 (52.3%) | 311 (47.7%) |
| College/Associate Degree | 106 (31.8%) | 227 (68.2%) |
| Bachelor's Degree or higher | 45 (58.4%) | 32 (41.6%) |
Occupancy by Age of Householder in Firebaugh
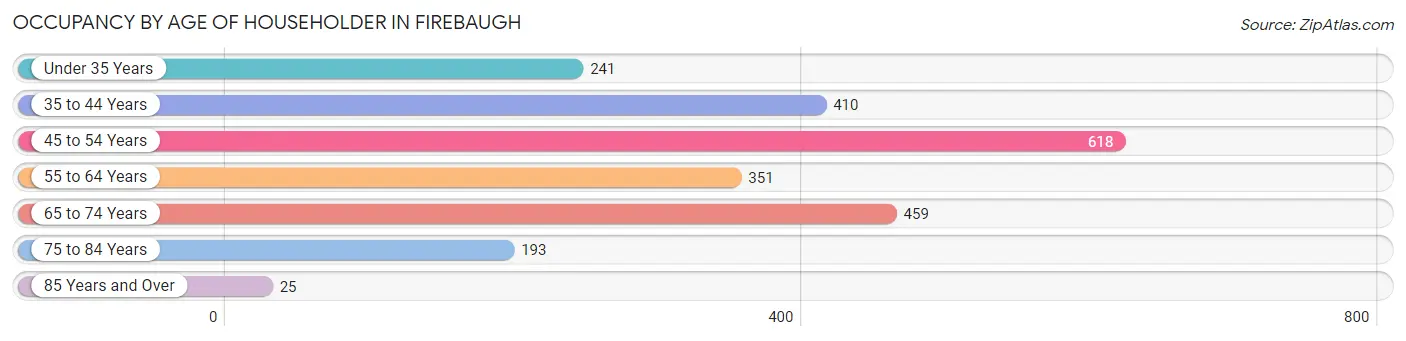
| Age Bracket | # Households | % Households |
| Under 35 Years | 241 | 10.5% |
| 35 to 44 Years | 410 | 17.8% |
| 45 to 54 Years | 618 | 26.9% |
| 55 to 64 Years | 351 | 15.3% |
| 65 to 74 Years | 459 | 20.0% |
| 75 to 84 Years | 193 | 8.4% |
| 85 Years and Over | 25 | 1.1% |
| Total | 2,297 | 100.0% |
Housing Finances in Firebaugh
Median Income by Occupancy in Firebaugh
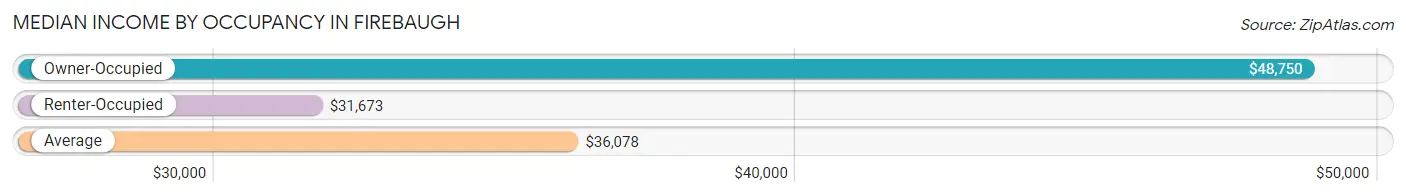
| Occupancy Type | # Households | Median Income |
| Owner-Occupied | 1,108 (48.2%) | $48,750 |
| Renter-Occupied | 1,189 (51.8%) | $31,673 |
| Average | 2,297 (100.0%) | $36,078 |
Occupancy by Householder Income Bracket in Firebaugh
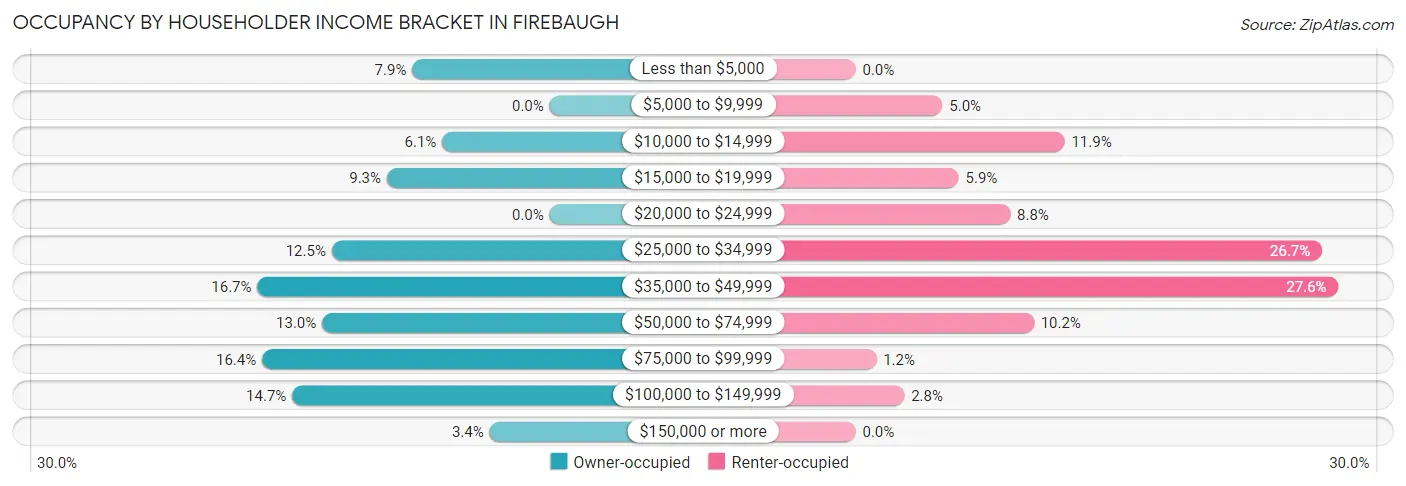
| Income Bracket | Owner-occupied | Renter-occupied |
| Less than $5,000 | 87 (7.9%) | 0 (0.0%) |
| $5,000 to $9,999 | 0 (0.0%) | 59 (5.0%) |
| $10,000 to $14,999 | 68 (6.1%) | 142 (11.9%) |
| $15,000 to $19,999 | 103 (9.3%) | 70 (5.9%) |
| $20,000 to $24,999 | 0 (0.0%) | 105 (8.8%) |
| $25,000 to $34,999 | 138 (12.4%) | 317 (26.7%) |
| $35,000 to $49,999 | 185 (16.7%) | 328 (27.6%) |
| $50,000 to $74,999 | 144 (13.0%) | 121 (10.2%) |
| $75,000 to $99,999 | 182 (16.4%) | 14 (1.2%) |
| $100,000 to $149,999 | 163 (14.7%) | 33 (2.8%) |
| $150,000 or more | 38 (3.4%) | 0 (0.0%) |
| Total | 1,108 (100.0%) | 1,189 (100.0%) |
Monthly Housing Cost Tiers in Firebaugh
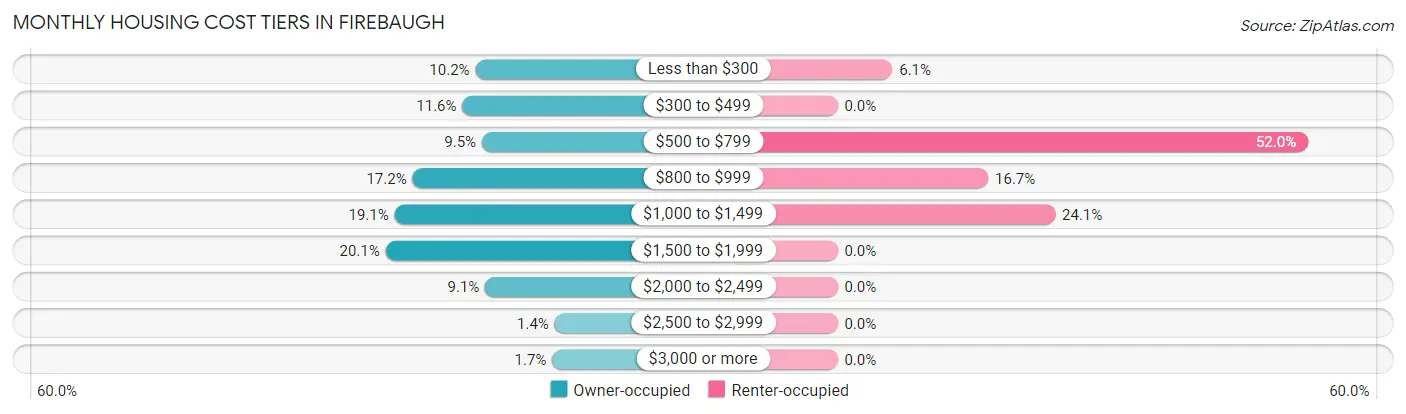
| Monthly Cost | Owner-occupied | Renter-occupied |
| Less than $300 | 113 (10.2%) | 72 (6.1%) |
| $300 to $499 | 129 (11.6%) | 0 (0.0%) |
| $500 to $799 | 105 (9.5%) | 618 (52.0%) |
| $800 to $999 | 190 (17.2%) | 198 (16.7%) |
| $1,000 to $1,499 | 212 (19.1%) | 286 (24.0%) |
| $1,500 to $1,999 | 223 (20.1%) | 0 (0.0%) |
| $2,000 to $2,499 | 101 (9.1%) | 0 (0.0%) |
| $2,500 to $2,999 | 16 (1.4%) | 0 (0.0%) |
| $3,000 or more | 19 (1.7%) | 0 (0.0%) |
| Total | 1,108 (100.0%) | 1,189 (100.0%) |
Physical Housing Characteristics in Firebaugh
Housing Structures in Firebaugh
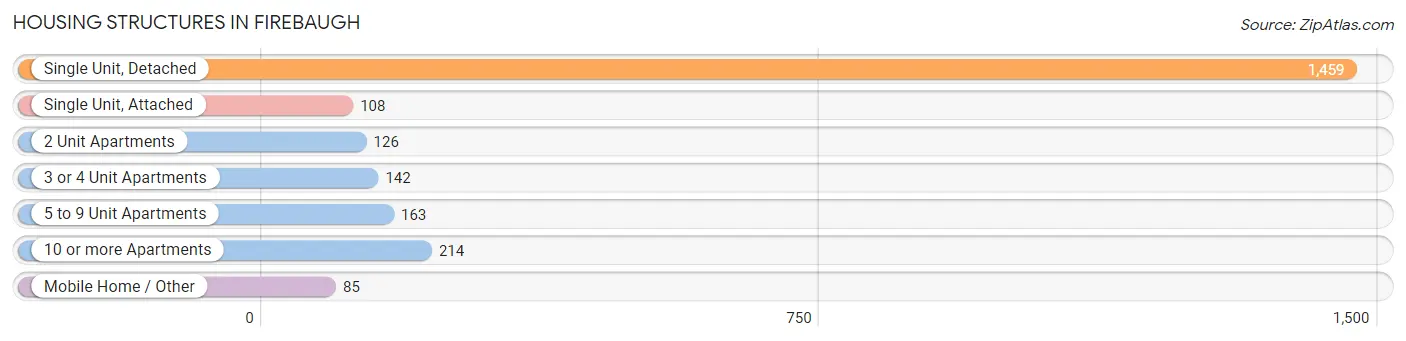
| Structure Type | # Housing Units | % Housing Units |
| Single Unit, Detached | 1,459 | 63.5% |
| Single Unit, Attached | 108 | 4.7% |
| 2 Unit Apartments | 126 | 5.5% |
| 3 or 4 Unit Apartments | 142 | 6.2% |
| 5 to 9 Unit Apartments | 163 | 7.1% |
| 10 or more Apartments | 214 | 9.3% |
| Mobile Home / Other | 85 | 3.7% |
| Total | 2,297 | 100.0% |
Housing Structures by Occupancy in Firebaugh
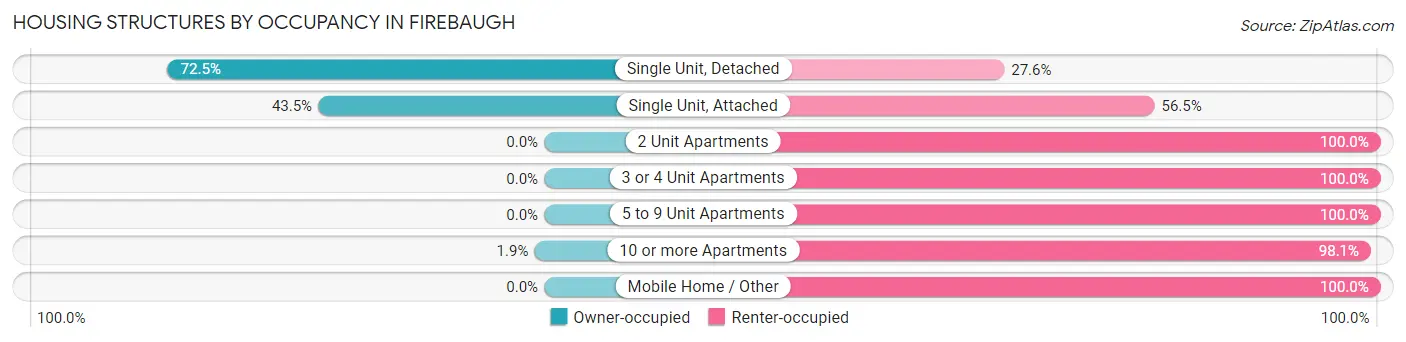
| Structure Type | Owner-occupied | Renter-occupied |
| Single Unit, Detached | 1,057 (72.5%) | 402 (27.6%) |
| Single Unit, Attached | 47 (43.5%) | 61 (56.5%) |
| 2 Unit Apartments | 0 (0.0%) | 126 (100.0%) |
| 3 or 4 Unit Apartments | 0 (0.0%) | 142 (100.0%) |
| 5 to 9 Unit Apartments | 0 (0.0%) | 163 (100.0%) |
| 10 or more Apartments | 4 (1.9%) | 210 (98.1%) |
| Mobile Home / Other | 0 (0.0%) | 85 (100.0%) |
| Total | 1,108 (48.2%) | 1,189 (51.8%) |
Housing Structures by Number of Rooms in Firebaugh
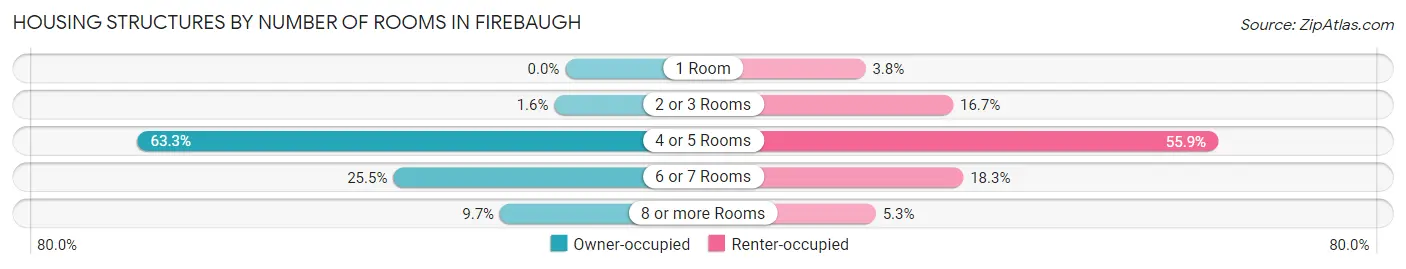
| Number of Rooms | Owner-occupied | Renter-occupied |
| 1 Room | 0 (0.0%) | 45 (3.8%) |
| 2 or 3 Rooms | 18 (1.6%) | 199 (16.7%) |
| 4 or 5 Rooms | 701 (63.3%) | 665 (55.9%) |
| 6 or 7 Rooms | 282 (25.5%) | 217 (18.2%) |
| 8 or more Rooms | 107 (9.7%) | 63 (5.3%) |
| Total | 1,108 (100.0%) | 1,189 (100.0%) |
Housing Structure by Heating Type in Firebaugh
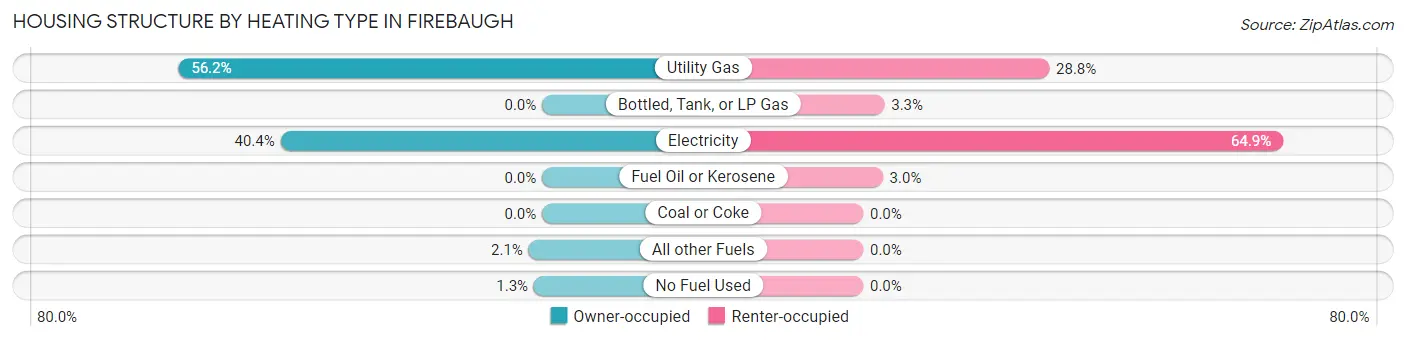
| Heating Type | Owner-occupied | Renter-occupied |
| Utility Gas | 623 (56.2%) | 342 (28.8%) |
| Bottled, Tank, or LP Gas | 0 (0.0%) | 39 (3.3%) |
| Electricity | 448 (40.4%) | 772 (64.9%) |
| Fuel Oil or Kerosene | 0 (0.0%) | 36 (3.0%) |
| Coal or Coke | 0 (0.0%) | 0 (0.0%) |
| All other Fuels | 23 (2.1%) | 0 (0.0%) |
| No Fuel Used | 14 (1.3%) | 0 (0.0%) |
| Total | 1,108 (100.0%) | 1,189 (100.0%) |
Household Vehicle Usage in Firebaugh
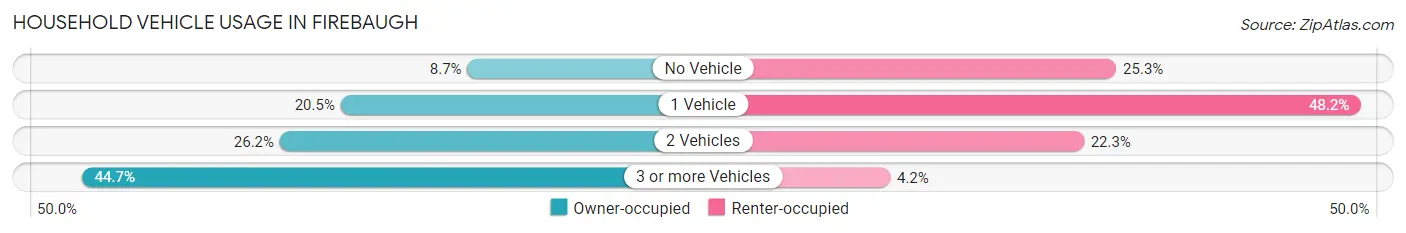
| Vehicles per Household | Owner-occupied | Renter-occupied |
| No Vehicle | 96 (8.7%) | 301 (25.3%) |
| 1 Vehicle | 227 (20.5%) | 573 (48.2%) |
| 2 Vehicles | 290 (26.2%) | 265 (22.3%) |
| 3 or more Vehicles | 495 (44.7%) | 50 (4.2%) |
| Total | 1,108 (100.0%) | 1,189 (100.0%) |
Real Estate & Mortgages in Firebaugh
Real Estate and Mortgage Overview in Firebaugh
| Characteristic | Without Mortgage | With Mortgage |
| Housing Units | 329 | 779 |
| Median Property Value | $200,300 | $226,000 |
| Median Household Income | $47,755 | $9 |
| Monthly Housing Costs | $393 | $10 |
| Real Estate Taxes | $1,470 | $21 |
Property Value by Mortgage Status in Firebaugh
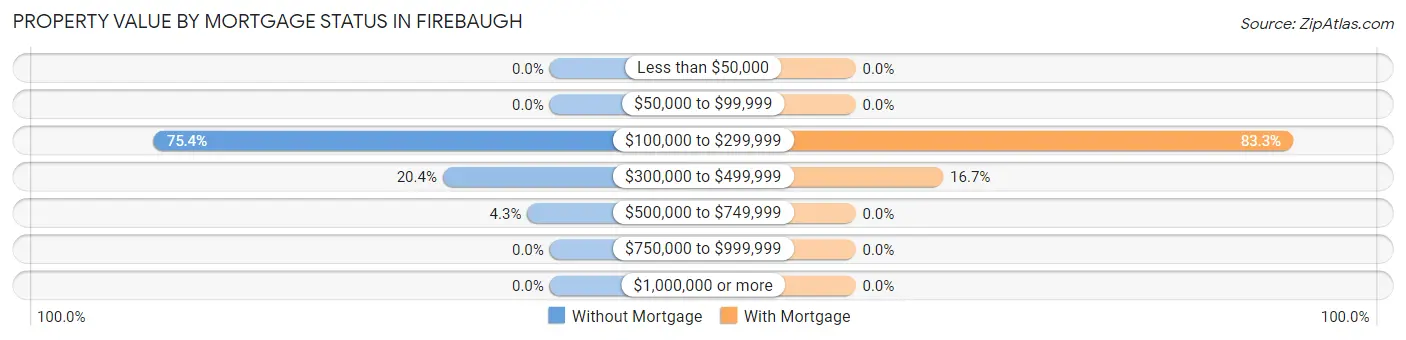
| Property Value | Without Mortgage | With Mortgage |
| Less than $50,000 | 0 (0.0%) | 0 (0.0%) |
| $50,000 to $99,999 | 0 (0.0%) | 0 (0.0%) |
| $100,000 to $299,999 | 248 (75.4%) | 649 (83.3%) |
| $300,000 to $499,999 | 67 (20.4%) | 130 (16.7%) |
| $500,000 to $749,999 | 14 (4.3%) | 0 (0.0%) |
| $750,000 to $999,999 | 0 (0.0%) | 0 (0.0%) |
| $1,000,000 or more | 0 (0.0%) | 0 (0.0%) |
| Total | 329 (100.0%) | 779 (100.0%) |
Household Income by Mortgage Status in Firebaugh
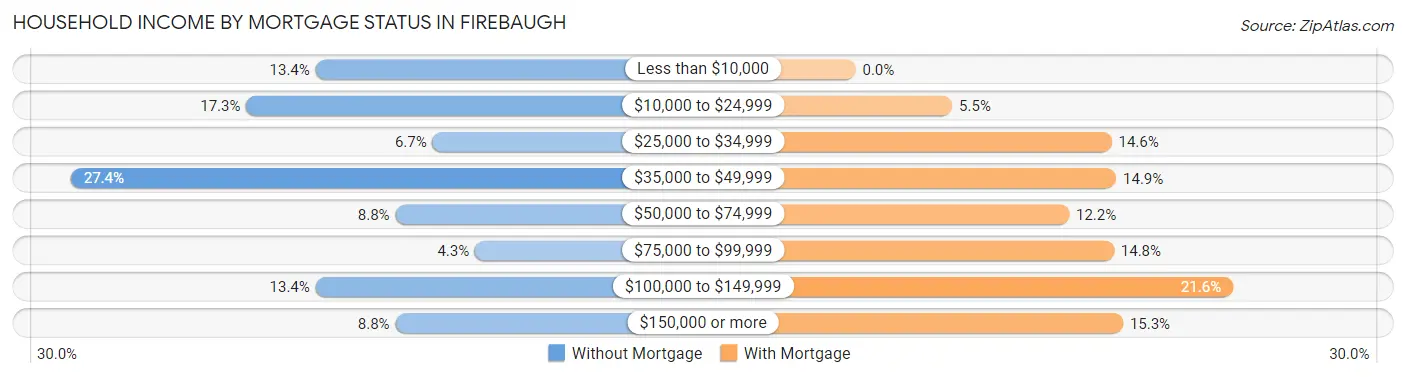
| Household Income | Without Mortgage | With Mortgage |
| Less than $10,000 | 44 (13.4%) | 0 (0.0%) |
| $10,000 to $24,999 | 57 (17.3%) | 43 (5.5%) |
| $25,000 to $34,999 | 22 (6.7%) | 114 (14.6%) |
| $35,000 to $49,999 | 90 (27.4%) | 116 (14.9%) |
| $50,000 to $74,999 | 29 (8.8%) | 95 (12.2%) |
| $75,000 to $99,999 | 14 (4.3%) | 115 (14.8%) |
| $100,000 to $149,999 | 44 (13.4%) | 168 (21.6%) |
| $150,000 or more | 29 (8.8%) | 119 (15.3%) |
| Total | 329 (100.0%) | 779 (100.0%) |
Property Value to Household Income Ratio in Firebaugh
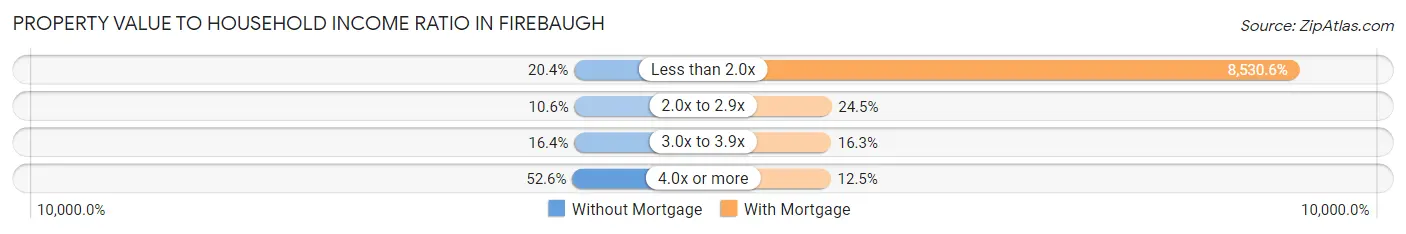
| Value-to-Income Ratio | Without Mortgage | With Mortgage |
| Less than 2.0x | 67 (20.4%) | 66,453 (8,530.5%) |
| 2.0x to 2.9x | 35 (10.6%) | 191 (24.5%) |
| 3.0x to 3.9x | 54 (16.4%) | 127 (16.3%) |
| 4.0x or more | 173 (52.6%) | 97 (12.4%) |
| Total | 329 (100.0%) | 779 (100.0%) |
Real Estate Taxes by Mortgage Status in Firebaugh
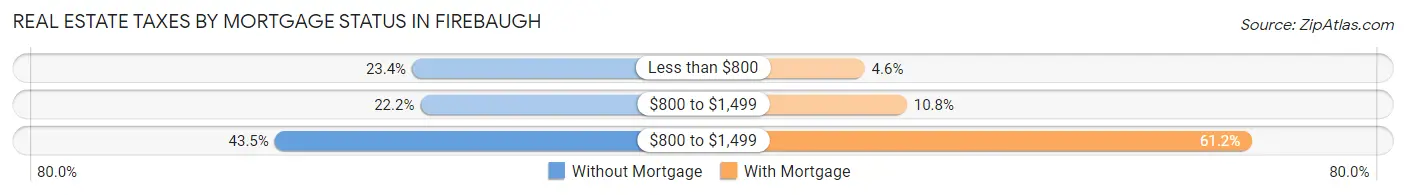
| Property Taxes | Without Mortgage | With Mortgage |
| Less than $800 | 77 (23.4%) | 36 (4.6%) |
| $800 to $1,499 | 73 (22.2%) | 84 (10.8%) |
| $800 to $1,499 | 143 (43.5%) | 477 (61.2%) |
| Total | 329 (100.0%) | 779 (100.0%) |
Health & Disability in Firebaugh
Health Insurance Coverage by Age in Firebaugh
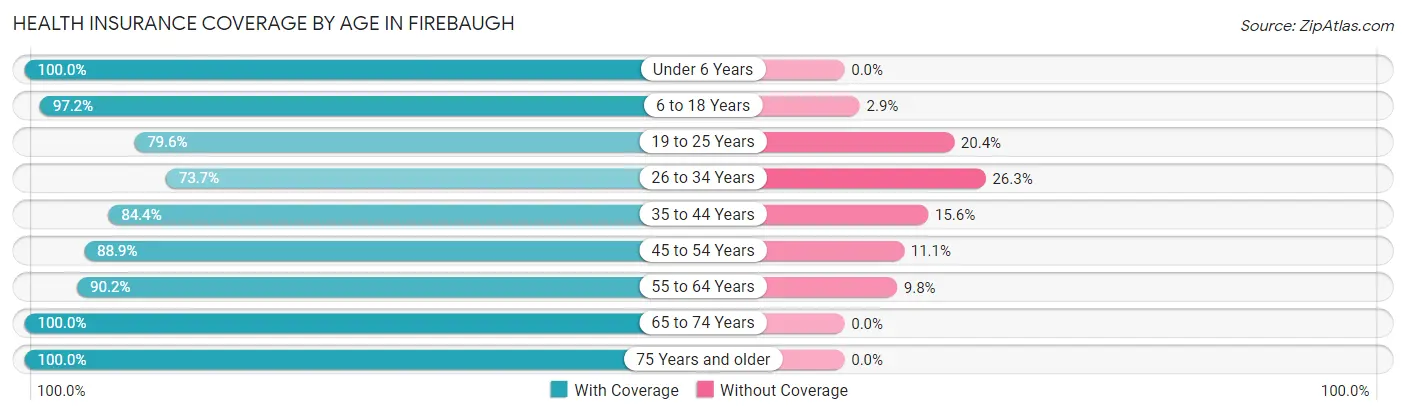
| Age Bracket | With Coverage | Without Coverage |
| Under 6 Years | 763 (100.0%) | 0 (0.0%) |
| 6 to 18 Years | 2,280 (97.2%) | 67 (2.9%) |
| 19 to 25 Years | 502 (79.6%) | 129 (20.4%) |
| 26 to 34 Years | 442 (73.7%) | 158 (26.3%) |
| 35 to 44 Years | 724 (84.4%) | 134 (15.6%) |
| 45 to 54 Years | 905 (88.9%) | 113 (11.1%) |
| 55 to 64 Years | 810 (90.2%) | 88 (9.8%) |
| 65 to 74 Years | 661 (100.0%) | 0 (0.0%) |
| 75 Years and older | 363 (100.0%) | 0 (0.0%) |
| Total | 7,450 (91.5%) | 689 (8.5%) |
Health Insurance Coverage by Citizenship Status in Firebaugh
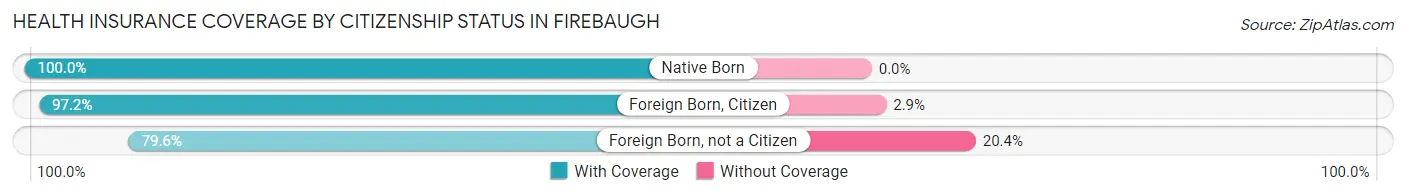
| Citizenship Status | With Coverage | Without Coverage |
| Native Born | 763 (100.0%) | 0 (0.0%) |
| Foreign Born, Citizen | 2,280 (97.2%) | 67 (2.9%) |
| Foreign Born, not a Citizen | 502 (79.6%) | 129 (20.4%) |
Health Insurance Coverage by Household Income in Firebaugh
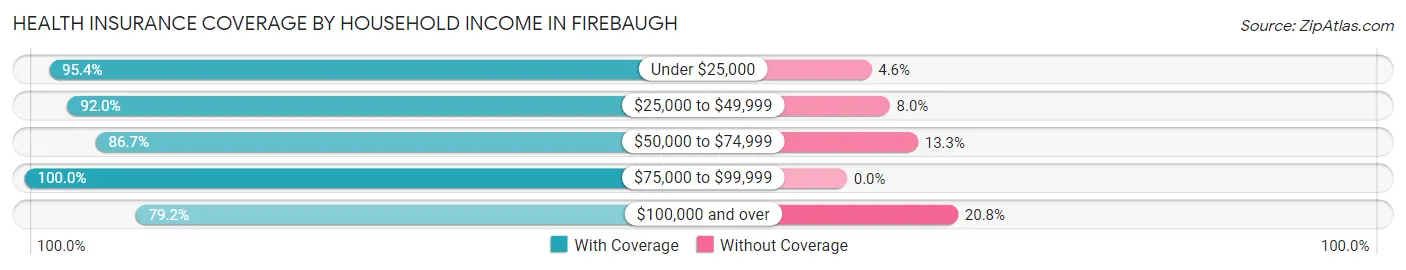
| Household Income | With Coverage | Without Coverage |
| Under $25,000 | 1,746 (95.4%) | 84 (4.6%) |
| $25,000 to $49,999 | 3,430 (92.0%) | 299 (8.0%) |
| $50,000 to $74,999 | 769 (86.7%) | 118 (13.3%) |
| $75,000 to $99,999 | 775 (100.0%) | 0 (0.0%) |
| $100,000 and over | 700 (79.2%) | 184 (20.8%) |
Public vs Private Health Insurance Coverage by Age in Firebaugh
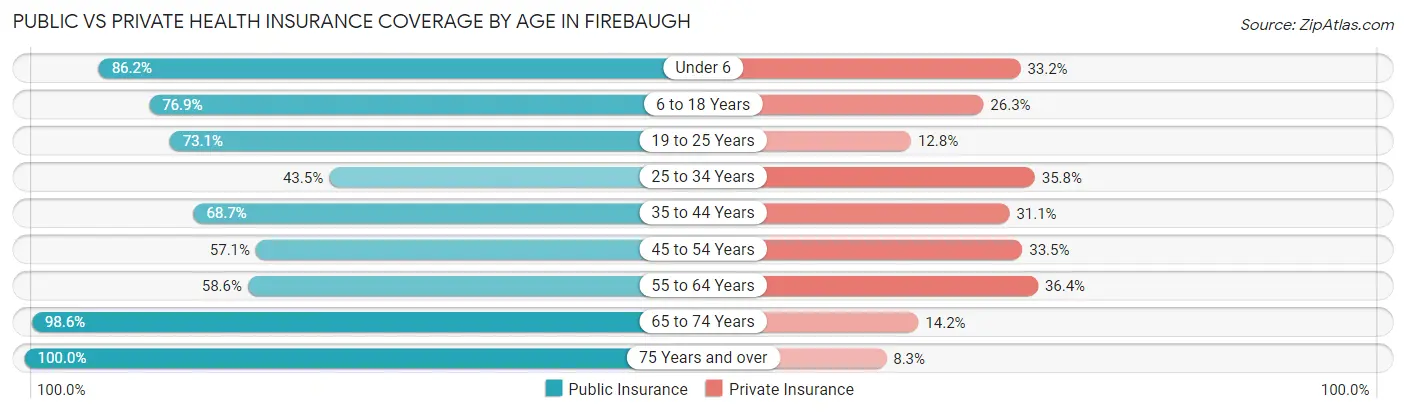
| Age Bracket | Public Insurance | Private Insurance |
| Under 6 | 658 (86.2%) | 253 (33.2%) |
| 6 to 18 Years | 1,804 (76.9%) | 617 (26.3%) |
| 19 to 25 Years | 461 (73.1%) | 81 (12.8%) |
| 25 to 34 Years | 261 (43.5%) | 215 (35.8%) |
| 35 to 44 Years | 589 (68.6%) | 267 (31.1%) |
| 45 to 54 Years | 581 (57.1%) | 341 (33.5%) |
| 55 to 64 Years | 526 (58.6%) | 327 (36.4%) |
| 65 to 74 Years | 652 (98.6%) | 94 (14.2%) |
| 75 Years and over | 363 (100.0%) | 30 (8.3%) |
| Total | 5,895 (72.4%) | 2,225 (27.3%) |
Disability Status by Sex by Age in Firebaugh
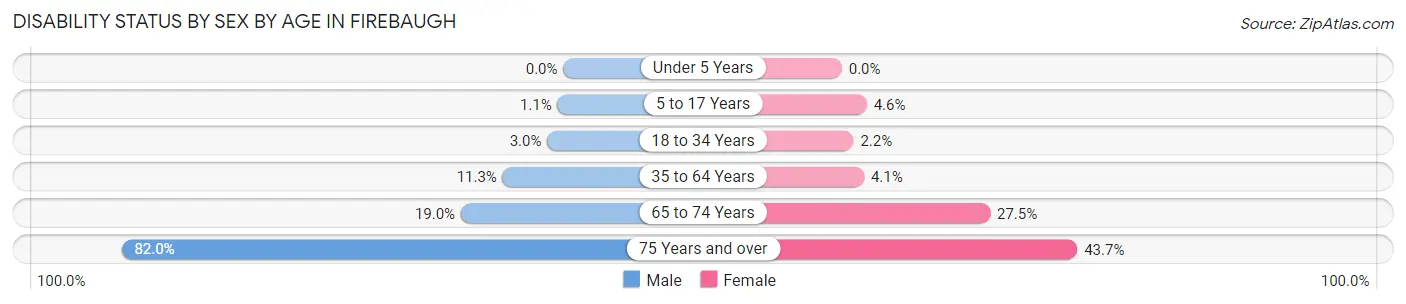
| Age Bracket | Male | Female |
| Under 5 Years | 0 (0.0%) | 0 (0.0%) |
| 5 to 17 Years | 9 (1.1%) | 64 (4.6%) |
| 18 to 34 Years | 28 (3.0%) | 12 (2.2%) |
| 35 to 64 Years | 151 (11.3%) | 59 (4.1%) |
| 65 to 74 Years | 69 (19.0%) | 82 (27.5%) |
| 75 Years and over | 187 (82.0%) | 59 (43.7%) |
Disability Class by Sex by Age in Firebaugh
Disability Class: Hearing Difficulty
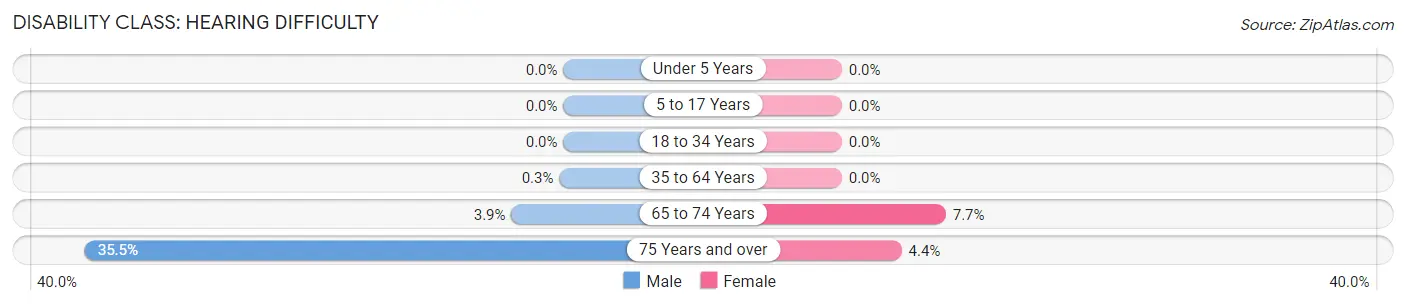
| Age Bracket | Male | Female |
| Under 5 Years | 0 (0.0%) | 0 (0.0%) |
| 5 to 17 Years | 0 (0.0%) | 0 (0.0%) |
| 18 to 34 Years | 0 (0.0%) | 0 (0.0%) |
| 35 to 64 Years | 4 (0.3%) | 0 (0.0%) |
| 65 to 74 Years | 14 (3.9%) | 23 (7.7%) |
| 75 Years and over | 81 (35.5%) | 6 (4.4%) |
Disability Class: Vision Difficulty
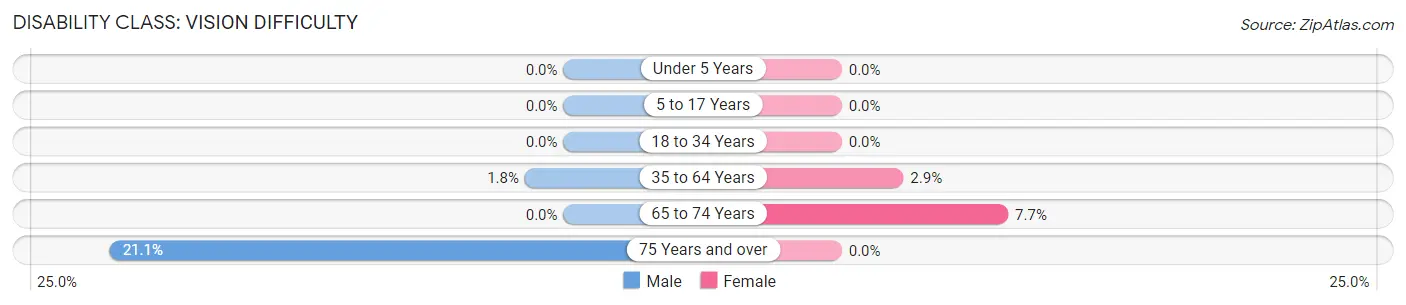
| Age Bracket | Male | Female |
| Under 5 Years | 0 (0.0%) | 0 (0.0%) |
| 5 to 17 Years | 0 (0.0%) | 0 (0.0%) |
| 18 to 34 Years | 0 (0.0%) | 0 (0.0%) |
| 35 to 64 Years | 24 (1.8%) | 41 (2.9%) |
| 65 to 74 Years | 0 (0.0%) | 23 (7.7%) |
| 75 Years and over | 48 (21.0%) | 0 (0.0%) |
Disability Class: Cognitive Difficulty
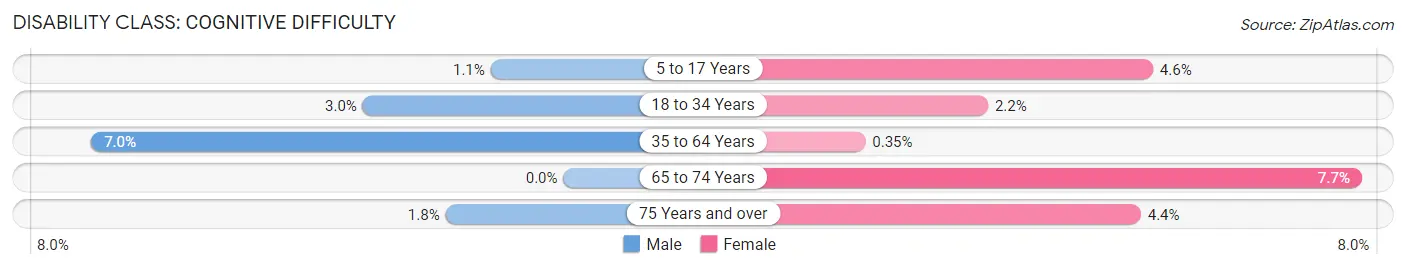
| Age Bracket | Male | Female |
| 5 to 17 Years | 9 (1.1%) | 64 (4.6%) |
| 18 to 34 Years | 28 (3.0%) | 12 (2.2%) |
| 35 to 64 Years | 94 (7.0%) | 5 (0.4%) |
| 65 to 74 Years | 0 (0.0%) | 23 (7.7%) |
| 75 Years and over | 4 (1.8%) | 6 (4.4%) |
Disability Class: Ambulatory Difficulty
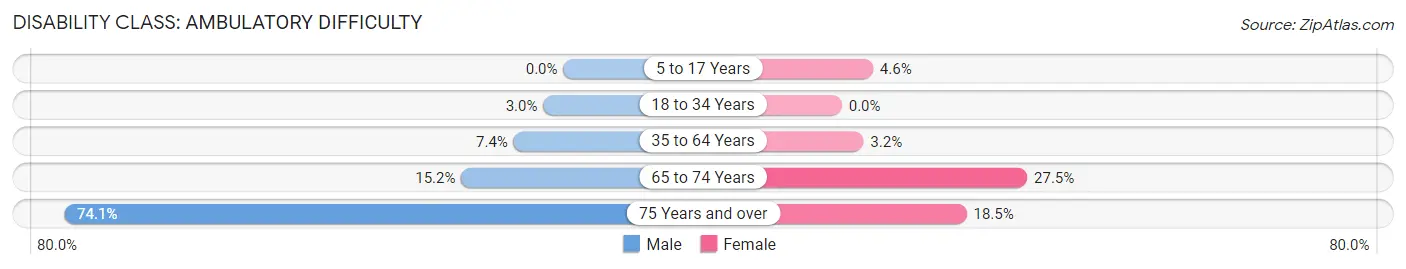
| Age Bracket | Male | Female |
| 5 to 17 Years | 0 (0.0%) | 64 (4.6%) |
| 18 to 34 Years | 28 (3.0%) | 0 (0.0%) |
| 35 to 64 Years | 99 (7.4%) | 46 (3.2%) |
| 65 to 74 Years | 55 (15.1%) | 82 (27.5%) |
| 75 Years and over | 169 (74.1%) | 25 (18.5%) |
Disability Class: Self-Care Difficulty
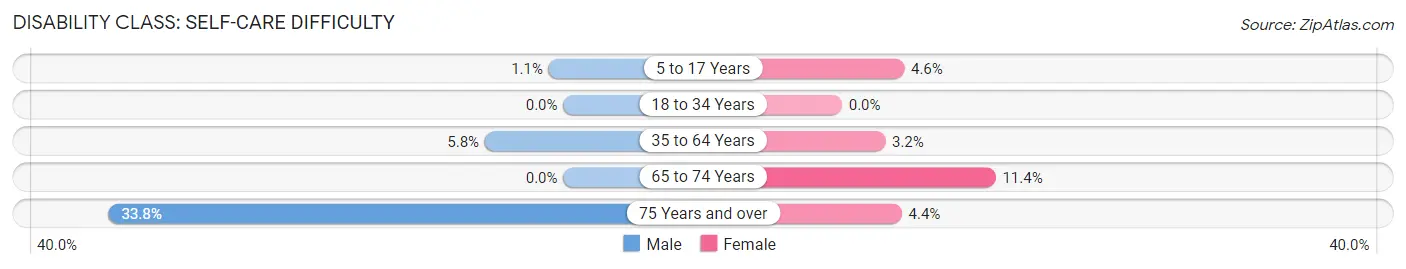
| Age Bracket | Male | Female |
| 5 to 17 Years | 9 (1.1%) | 64 (4.6%) |
| 18 to 34 Years | 0 (0.0%) | 0 (0.0%) |
| 35 to 64 Years | 78 (5.8%) | 46 (3.2%) |
| 65 to 74 Years | 0 (0.0%) | 34 (11.4%) |
| 75 Years and over | 77 (33.8%) | 6 (4.4%) |
Technology Access in Firebaugh
Computing Device Access in Firebaugh
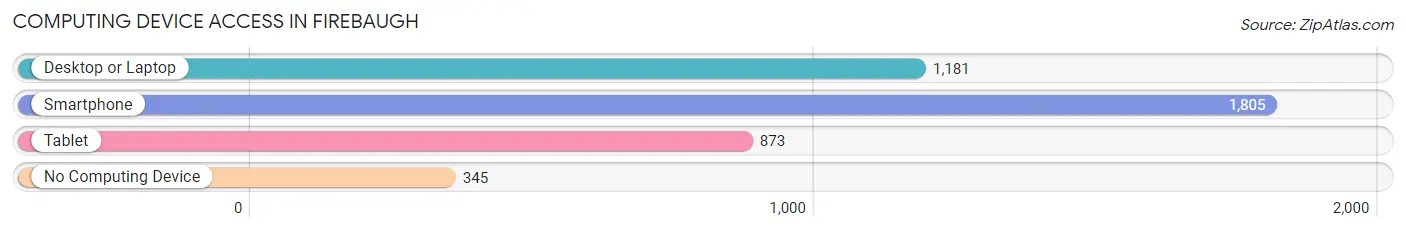
| Device Type | # Households | % Households |
| Desktop or Laptop | 1,181 | 51.4% |
| Smartphone | 1,805 | 78.6% |
| Tablet | 873 | 38.0% |
| No Computing Device | 345 | 15.0% |
| Total | 2,297 | 100.0% |
Internet Access in Firebaugh
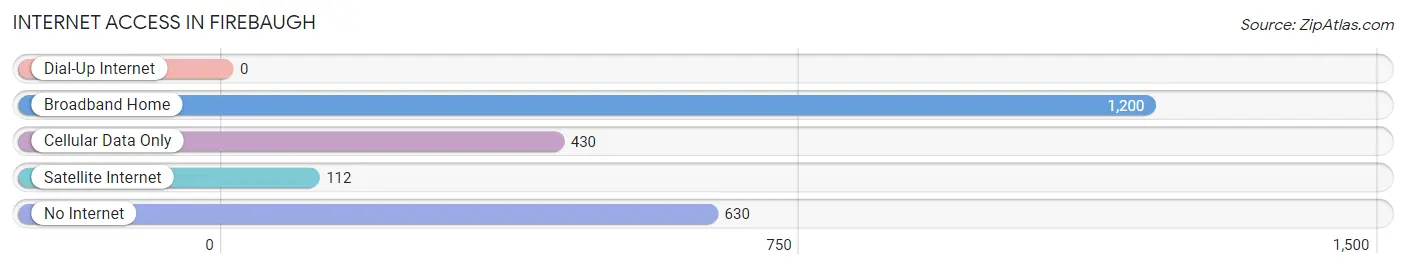
| Internet Type | # Households | % Households |
| Dial-Up Internet | 0 | 0.0% |
| Broadband Home | 1,200 | 52.2% |
| Cellular Data Only | 430 | 18.7% |
| Satellite Internet | 112 | 4.9% |
| No Internet | 630 | 27.4% |
| Total | 2,297 | 100.0% |
Firebaugh Summary
History
Firebaugh is a small city located in Fresno County, California. It is situated on the west side of the San Joaquin Valley, about 25 miles west of Fresno. The city was founded in 1891 by William Firebaugh, a rancher and farmer who had moved to the area from Missouri. Firebaugh was incorporated in 1948 and has since grown to a population of over 7,000 people.
The city of Firebaugh has a rich history that dates back to the early days of the California Gold Rush. In 1848, the first gold discovery was made in the area, and soon after, miners and prospectors began to flock to the area in search of their fortunes. The town of Firebaugh was established in 1891, and the first post office was established in 1892.
The city of Firebaugh has been an important agricultural center for the San Joaquin Valley since its founding. The area is known for its production of cotton, tomatoes, and other crops. In the early 1900s, the city was also home to a thriving dairy industry.
Geography
Firebaugh is located in the San Joaquin Valley of California, about 25 miles west of Fresno. The city is situated on the west side of the valley, near the San Joaquin River. The city is surrounded by agricultural land, and the nearby hills provide a scenic backdrop.
The climate in Firebaugh is typical of the San Joaquin Valley, with hot summers and mild winters. The average high temperature in the summer is around 95 degrees Fahrenheit, and the average low temperature in the winter is around 40 degrees Fahrenheit.
Economy
The economy of Firebaugh is largely based on agriculture. The city is home to a number of large farms and ranches, and the surrounding area is known for its production of cotton, tomatoes, and other crops. The city is also home to a number of food processing plants, which process the crops grown in the area.
In addition to agriculture, Firebaugh is home to a number of small businesses, including restaurants, retail stores, and service providers. The city is also home to a number of manufacturing companies, which produce a variety of products, including furniture, clothing, and electronics.
Demographics
As of the 2010 census, the population of Firebaugh was 7,549. The racial makeup of the city was 63.3% White, 0.7% African American, 0.7% Native American, 0.7% Asian, 0.1% Pacific Islander, 32.2% from other races, and 2.3% from two or more races. Hispanic or Latino of any race were 57.2% of the population.
The median household income in Firebaugh was $37,917, and the median family income was $41,917. The per capita income for the city was $14,917. About 20.3% of families and 24.2% of the population were below the poverty line, including 33.3% of those under age 18 and 11.2% of those age 65 or over.
Common Questions
What is Per Capita Income in Firebaugh?
Per Capita income in Firebaugh is $13,768.
What is the Median Family Income in Firebaugh?
Median Family Income in Firebaugh is $36,413.
What is the Median Household income in Firebaugh?
Median Household Income in Firebaugh is $36,078.
What is Income or Wage Gap in Firebaugh?
Income or Wage Gap in Firebaugh is 44.5%.
Women in Firebaugh earn 55.5 cents for every dollar earned by a man.
What is Family Income Deficit in Firebaugh?
Family Income Deficit in Firebaugh is $9,550.
Families that are below poverty line in Firebaugh earn $9,550 less on average than the poverty threshold level.
What is Inequality or Gini Index in Firebaugh?
Inequality or Gini Index in Firebaugh is 0.41.
What is the Total Population of Firebaugh?
Total Population of Firebaugh is 8,139.
What is the Total Male Population of Firebaugh?
Total Male Population of Firebaugh is 4,076.
What is the Total Female Population of Firebaugh?
Total Female Population of Firebaugh is 4,063.
What is the Ratio of Males per 100 Females in Firebaugh?
There are 100.32 Males per 100 Females in Firebaugh.
What is the Ratio of Females per 100 Males in Firebaugh?
There are 99.68 Females per 100 Males in Firebaugh.
What is the Median Population Age in Firebaugh?
Median Population Age in Firebaugh is 32.2 Years.
What is the Average Family Size in Firebaugh
Average Family Size in Firebaugh is 3.8 People.
What is the Average Household Size in Firebaugh
Average Household Size in Firebaugh is 3.5 People.
How Large is the Labor Force in Firebaugh?
There are 2,896 People in the Labor Forcein in Firebaugh.
What is the Percentage of People in the Labor Force in Firebaugh?
50.9% of People are in the Labor Force in Firebaugh.
What is the Unemployment Rate in Firebaugh?
Unemployment Rate in Firebaugh is 18.3%.