Zip Codes with the Highest Percentage of Population with a Degree in Visual and Performing Arts in Sacramento, CA
RELATED REPORTS & OPTIONS
Visual and Performing Arts
Sacramento
Compare Zip Codes
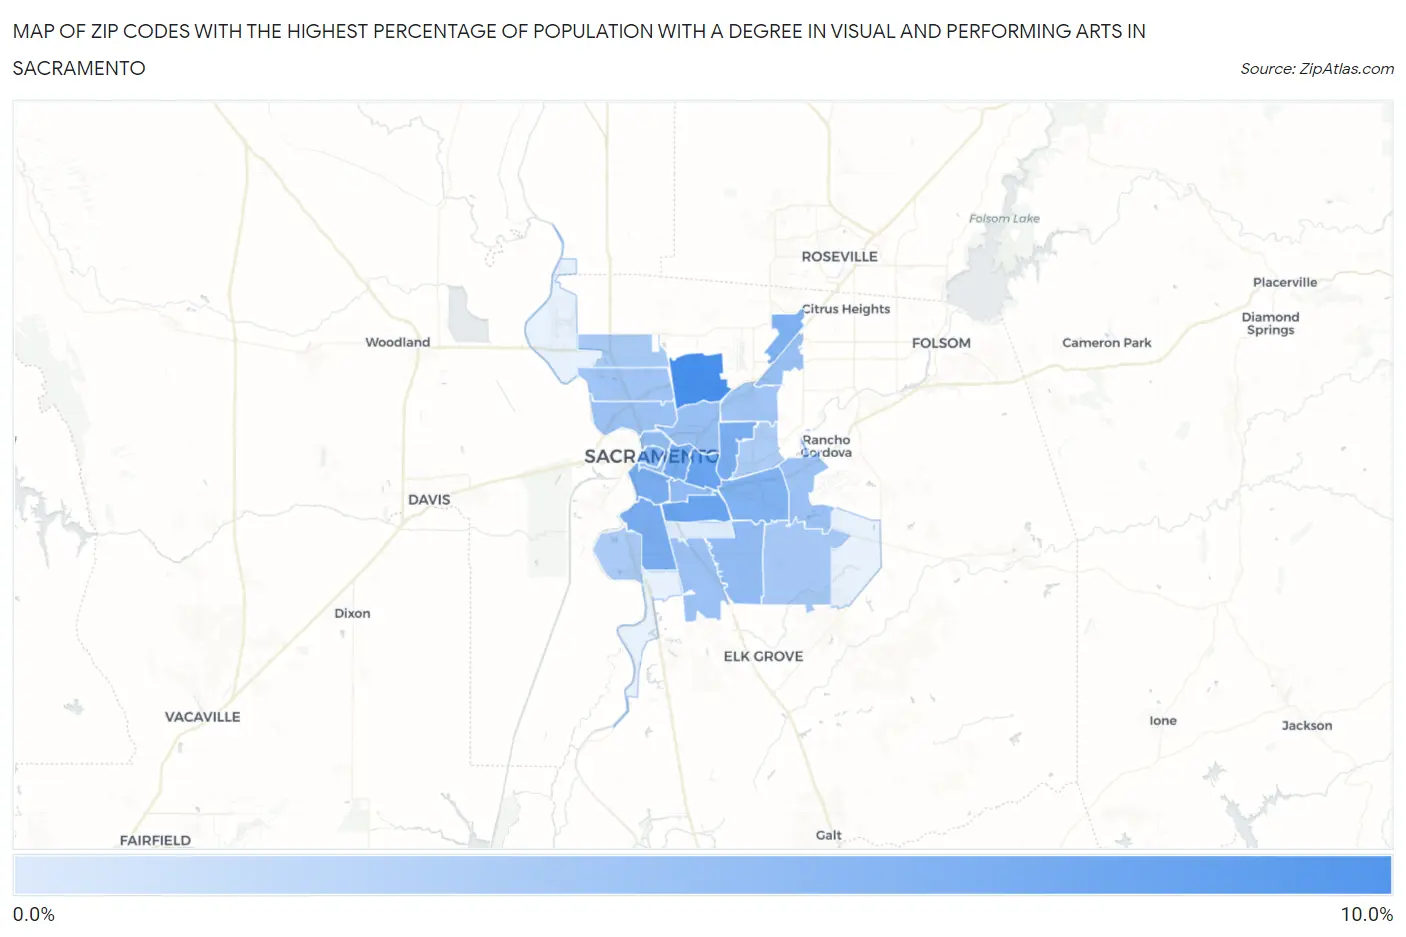
Map of Zip Codes with the Highest Percentage of Population with a Degree in Visual and Performing Arts in Sacramento
0.42%
8.8%
Zip Codes with the Highest Percentage of Population with a Degree in Visual and Performing Arts in Sacramento, CA
| Zip Code | % Graduates | vs State | vs National | |
| 1. | 95838 | 8.8% | 5.7%(+3.06)#260 | 4.3%(+4.54)#2,359 |
| 2. | 95819 | 6.8% | 5.7%(+1.05)#423 | 4.3%(+2.54)#3,882 |
| 3. | 95820 | 6.8% | 5.7%(+1.02)#428 | 4.3%(+2.51)#3,925 |
| 4. | 95816 | 6.2% | 5.7%(+0.463)#490 | 4.3%(+1.95)#4,588 |
| 5. | 95825 | 5.9% | 5.7%(+0.135)#525 | 4.3%(+1.62)#5,054 |
| 6. | 95818 | 5.8% | 5.7%(+0.096)#529 | 4.3%(+1.58)#5,116 |
| 7. | 95822 | 5.8% | 5.7%(+0.086)#532 | 4.3%(+1.57)#5,138 |
| 8. | 95842 | 5.7% | 5.7%(-0.088)#556 | 4.3%(+1.40)#5,410 |
| 9. | 95814 | 5.4% | 5.7%(-0.303)#590 | 4.3%(+1.18)#5,785 |
| 10. | 95826 | 5.4% | 5.7%(-0.307)#592 | 4.3%(+1.18)#5,791 |
| 11. | 95828 | 4.6% | 5.7%(-1.14)#733 | 4.3%(+0.351)#7,550 |
| 12. | 95817 | 4.6% | 5.7%(-1.17)#744 | 4.3%(+0.312)#7,637 |
| 13. | 95811 | 4.4% | 5.7%(-1.34)#781 | 4.3%(+0.145)#8,100 |
| 14. | 95815 | 4.2% | 5.7%(-1.56)#828 | 4.3%(-0.073)#8,689 |
| 15. | 95841 | 4.2% | 5.7%(-1.57)#832 | 4.3%(-0.086)#8,744 |
| 16. | 95833 | 4.0% | 5.7%(-1.75)#882 | 4.3%(-0.258)#9,286 |
| 17. | 95827 | 3.9% | 5.7%(-1.83)#905 | 4.3%(-0.343)#9,548 |
| 18. | 95823 | 3.9% | 5.7%(-1.83)#906 | 4.3%(-0.345)#9,555 |
| 19. | 95834 | 3.7% | 5.7%(-2.04)#946 | 4.3%(-0.548)#10,143 |
| 20. | 95821 | 3.7% | 5.7%(-2.07)#954 | 4.3%(-0.578)#10,253 |
| 21. | 95829 | 3.4% | 5.7%(-2.34)#1,021 | 4.3%(-0.855)#11,268 |
| 22. | 95835 | 3.3% | 5.7%(-2.48)#1,044 | 4.3%(-0.997)#11,789 |
| 23. | 95831 | 3.2% | 5.7%(-2.57)#1,058 | 4.3%(-1.08)#12,085 |
| 24. | 95864 | 3.1% | 5.7%(-2.63)#1,070 | 4.3%(-1.14)#12,304 |
| 25. | 95824 | 0.42% | 5.7%(-5.32)#1,398 | 4.3%(-3.83)#20,920 |
1
Common Questions
What are the Top 10 Zip Codes with the Highest Percentage of Population with a Degree in Visual and Performing Arts in Sacramento, CA?
Top 10 Zip Codes with the Highest Percentage of Population with a Degree in Visual and Performing Arts in Sacramento, CA are:
What zip code has the Highest Percentage of Population with a Degree in Visual and Performing Arts in Sacramento, CA?
95838 has the Highest Percentage of Population with a Degree in Visual and Performing Arts in Sacramento, CA with 8.8%.
What is the Percentage of Population with a Degree in Visual and Performing Arts in Sacramento, CA?
Percentage of Population with a Degree in Visual and Performing Arts in Sacramento is 4.9%.
What is the Percentage of Population with a Degree in Visual and Performing Arts in California?
Percentage of Population with a Degree in Visual and Performing Arts in California is 5.7%.
What is the Percentage of Population with a Degree in Visual and Performing Arts in the United States?
Percentage of Population with a Degree in Visual and Performing Arts in the United States is 4.3%.