Zip Codes with the Highest Percentage of Population with a Degree in Visual and Performing Arts in Los Gatos, CA
RELATED REPORTS & OPTIONS
Visual and Performing Arts
Los Gatos
Compare Zip Codes
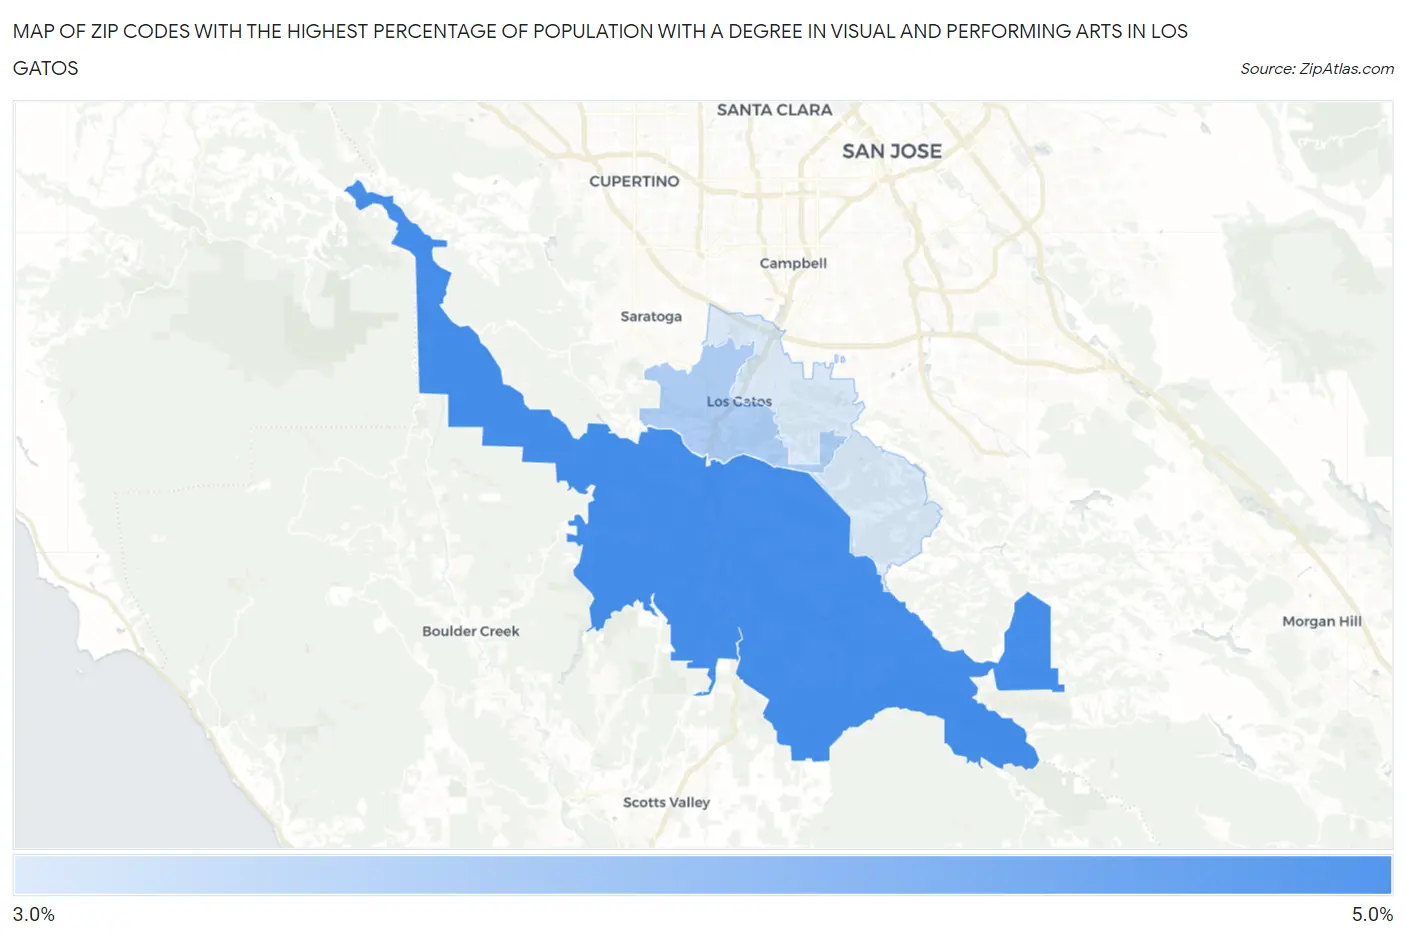
Map of Zip Codes with the Highest Percentage of Population with a Degree in Visual and Performing Arts in Los Gatos
3.3%
4.5%
Zip Codes with the Highest Percentage of Population with a Degree in Visual and Performing Arts in Los Gatos, CA
| Zip Code | % Graduates | vs State | vs National | |
| 1. | 95033 | 4.5% | 5.7%(-1.20)#748 | 4.3%(+0.292)#7,702 |
| 2. | 95030 | 3.6% | 5.7%(-2.09)#961 | 4.3%(-0.603)#10,335 |
| 3. | 95032 | 3.3% | 5.7%(-2.48)#1,043 | 4.3%(-0.990)#11,755 |
1
Common Questions
What are the Top Zip Codes with the Highest Percentage of Population with a Degree in Visual and Performing Arts in Los Gatos, CA?
Top Zip Codes with the Highest Percentage of Population with a Degree in Visual and Performing Arts in Los Gatos, CA are:
What zip code has the Highest Percentage of Population with a Degree in Visual and Performing Arts in Los Gatos, CA?
95033 has the Highest Percentage of Population with a Degree in Visual and Performing Arts in Los Gatos, CA with 4.5%.
What is the Percentage of Population with a Degree in Visual and Performing Arts in Los Gatos, CA?
Percentage of Population with a Degree in Visual and Performing Arts in Los Gatos is 3.3%.
What is the Percentage of Population with a Degree in Visual and Performing Arts in California?
Percentage of Population with a Degree in Visual and Performing Arts in California is 5.7%.
What is the Percentage of Population with a Degree in Visual and Performing Arts in the United States?
Percentage of Population with a Degree in Visual and Performing Arts in the United States is 4.3%.