Industry, CA Map & Demographics
Industry Map
Industry Overview
$20,103
PER CAPITA INCOME
$75,750
AVG FAMILY INCOME
$77,000
AVG HOUSEHOLD INCOME
30.0%
WAGE / INCOME GAP [ % ]
70.0¢/ $1
WAGE / INCOME GAP [ $ ]
0.26
INEQUALITY / GINI INDEX
234
TOTAL POPULATION
132
MALE POPULATION
102
FEMALE POPULATION
129.41
MALES / 100 FEMALES
77.27
FEMALES / 100 MALES
29.3
MEDIAN AGE
4.3
AVG FAMILY SIZE
3.6
AVG HOUSEHOLD SIZE
92
LABOR FORCE [ PEOPLE ]
57.5%
PERCENT IN LABOR FORCE
7.6%
UNEMPLOYMENT RATE
Income in Industry
Income Overview in Industry
Per Capita Income in Industry is $20,103, while median incomes of families and households are $75,750 and $77,000 respectively.
| Characteristic | Number | Measure |
| Per Capita Income | 234 | $20,103 |
| Median Family Income | 29 | $75,750 |
| Mean Family Income | 29 | $92,728 |
| Median Household Income | 50 | $77,000 |
| Mean Household Income | 50 | $89,406 |
| Income Deficit | 29 | $0 |
| Wage / Income Gap (%) | 234 | 29.97% |
| Wage / Income Gap ($) | 234 | 70.03¢ per $1 |
| Gini / Inequality Index | 234 | 0.26 |
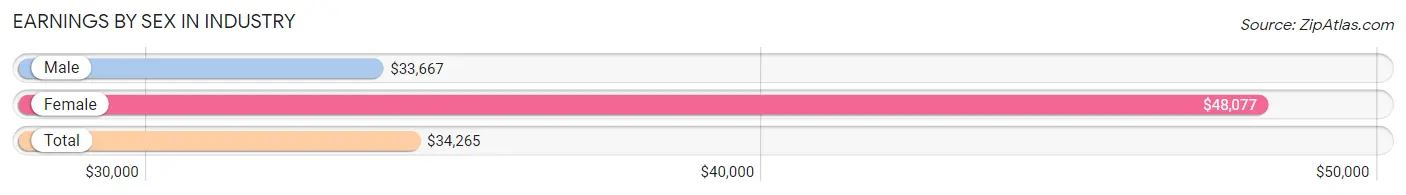
Earnings by Sex in Industry
Average Earnings in Industry are $34,265, $33,667 for men and $48,077 for women, a difference of 30.0%.
| Sex | Number | Average Earnings |
| Male | 68 (64.1%) | $33,667 |
| Female | 38 (35.8%) | $48,077 |
| Total | 106 (100.0%) | $34,265 |
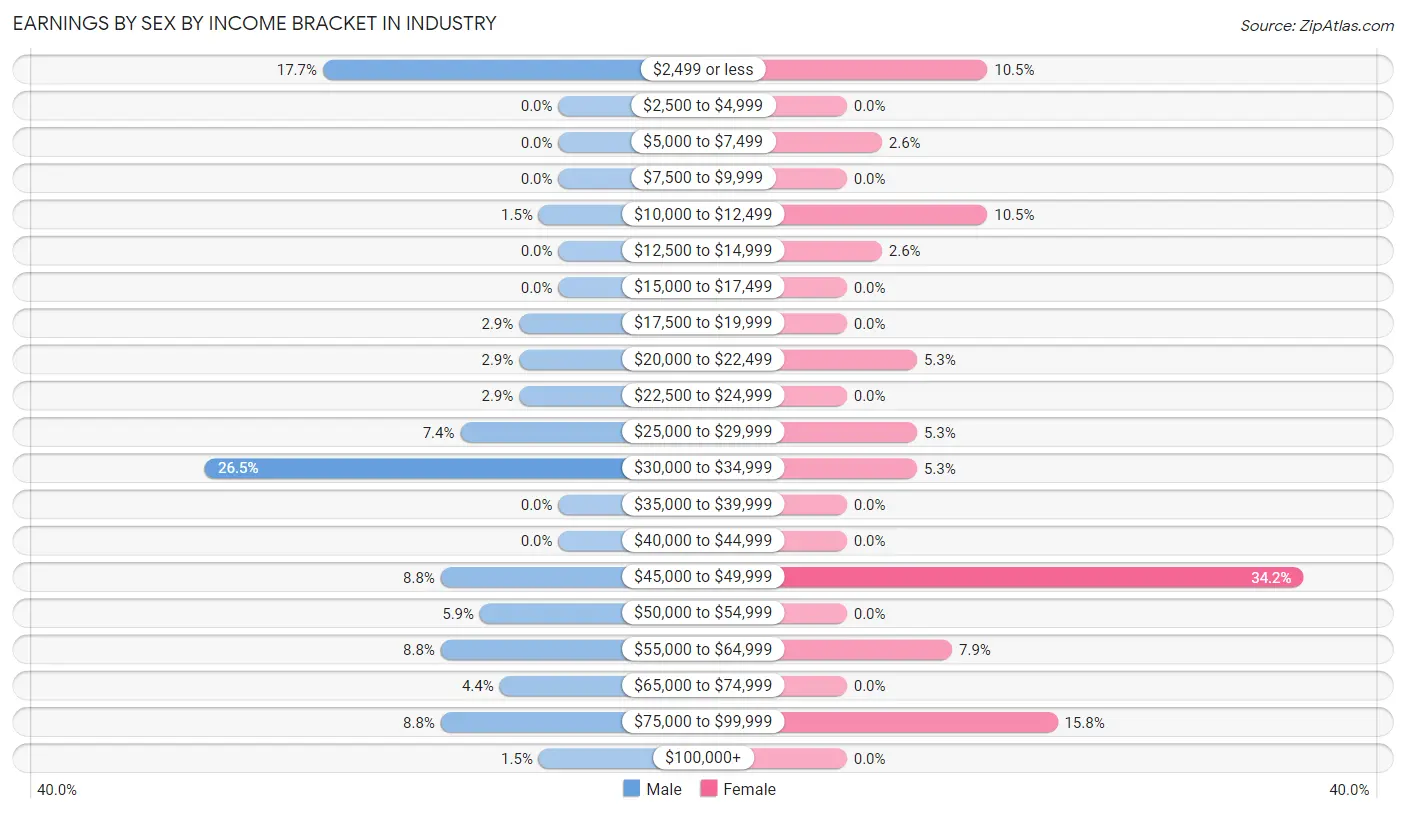
Earnings by Sex by Income Bracket in Industry
The most common earnings brackets in Industry are $30,000 to $34,999 for men (18 | 26.5%) and $45,000 to $49,999 for women (13 | 34.2%).
| Income | Male | Female |
| $2,499 or less | 12 (17.6%) | 4 (10.5%) |
| $2,500 to $4,999 | 0 (0.0%) | 0 (0.0%) |
| $5,000 to $7,499 | 0 (0.0%) | 1 (2.6%) |
| $7,500 to $9,999 | 0 (0.0%) | 0 (0.0%) |
| $10,000 to $12,499 | 1 (1.5%) | 4 (10.5%) |
| $12,500 to $14,999 | 0 (0.0%) | 1 (2.6%) |
| $15,000 to $17,499 | 0 (0.0%) | 0 (0.0%) |
| $17,500 to $19,999 | 2 (2.9%) | 0 (0.0%) |
| $20,000 to $22,499 | 2 (2.9%) | 2 (5.3%) |
| $22,500 to $24,999 | 2 (2.9%) | 0 (0.0%) |
| $25,000 to $29,999 | 5 (7.3%) | 2 (5.3%) |
| $30,000 to $34,999 | 18 (26.5%) | 2 (5.3%) |
| $35,000 to $39,999 | 0 (0.0%) | 0 (0.0%) |
| $40,000 to $44,999 | 0 (0.0%) | 0 (0.0%) |
| $45,000 to $49,999 | 6 (8.8%) | 13 (34.2%) |
| $50,000 to $54,999 | 4 (5.9%) | 0 (0.0%) |
| $55,000 to $64,999 | 6 (8.8%) | 3 (7.9%) |
| $65,000 to $74,999 | 3 (4.4%) | 0 (0.0%) |
| $75,000 to $99,999 | 6 (8.8%) | 6 (15.8%) |
| $100,000+ | 1 (1.5%) | 0 (0.0%) |
| Total | 68 (100.0%) | 38 (100.0%) |
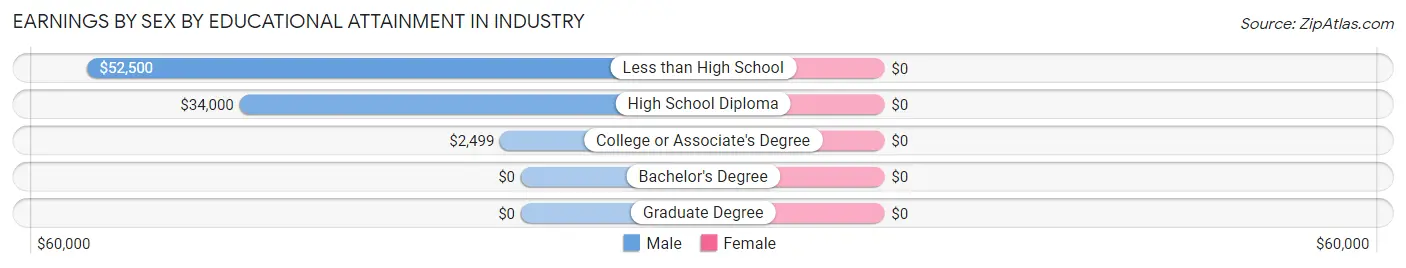
Earnings by Sex by Educational Attainment in Industry
| Educational Attainment | Male Income | Female Income |
| Less than High School | $52,500 | $0 |
| High School Diploma | $34,000 | $0 |
| College or Associate's Degree | $2,499 | $0 |
| Bachelor's Degree | - | - |
| Graduate Degree | - | - |
| Total | $34,000 | $48,269 |
Family Income in Industry
Family Income Brackets in Industry
According to the Industry family income data, there are 7 families falling into the $35,000 to $49,999 income range, which is the most common income bracket and makes up 24.1% of all families.
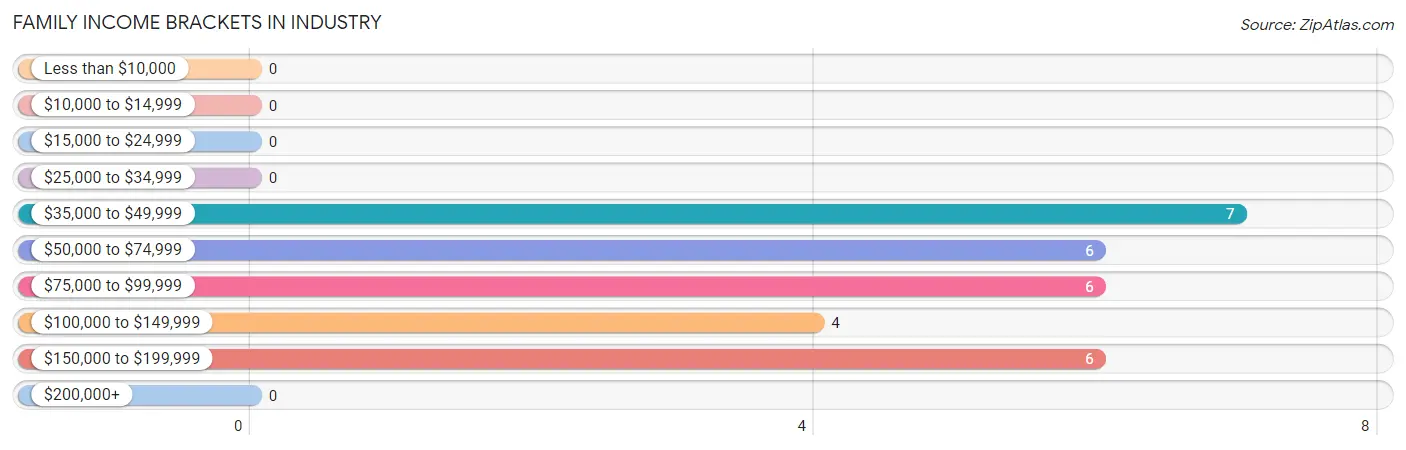
| Income Bracket | # Families | % Families |
| Less than $10,000 | 0 | 0.0% |
| $10,000 to $14,999 | 0 | 0.0% |
| $15,000 to $24,999 | 0 | 0.0% |
| $25,000 to $34,999 | 0 | 0.0% |
| $35,000 to $49,999 | 7 | 24.1% |
| $50,000 to $74,999 | 6 | 20.7% |
| $75,000 to $99,999 | 6 | 20.7% |
| $100,000 to $149,999 | 4 | 13.8% |
| $150,000 to $199,999 | 6 | 20.7% |
| $200,000+ | 0 | 0.0% |
Family Income by Famaliy Size in Industry
4-person families (14 | 48.3%) account for the highest median family income in Industry with $131,250 per family, while 4-person families (14 | 48.3%) have the highest median income of $32,812 per family member.
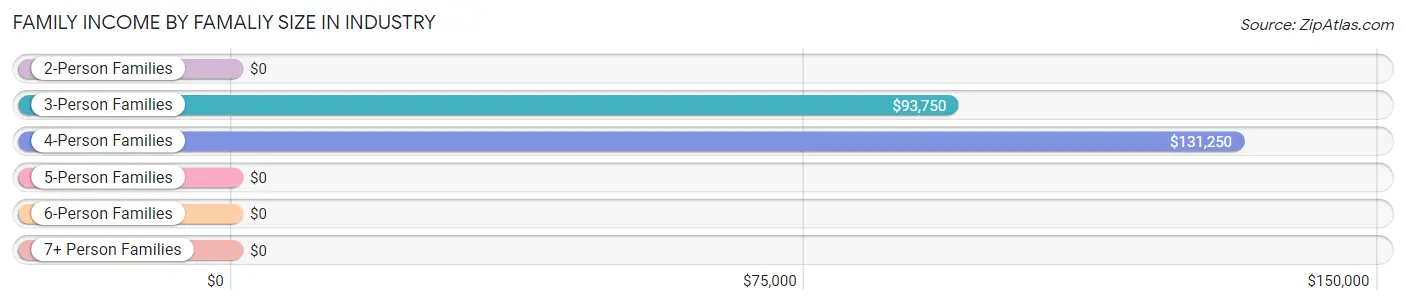
| Income Bracket | # Families | Median Income |
| 2-Person Families | 3 (10.3%) | $0 |
| 3-Person Families | 4 (13.8%) | $93,750 |
| 4-Person Families | 14 (48.3%) | $131,250 |
| 5-Person Families | 7 (24.1%) | $0 |
| 6-Person Families | 0 (0.0%) | $0 |
| 7+ Person Families | 1 (3.5%) | $0 |
| Total | 29 (100.0%) | $75,750 |
Family Income by Number of Earners in Industry
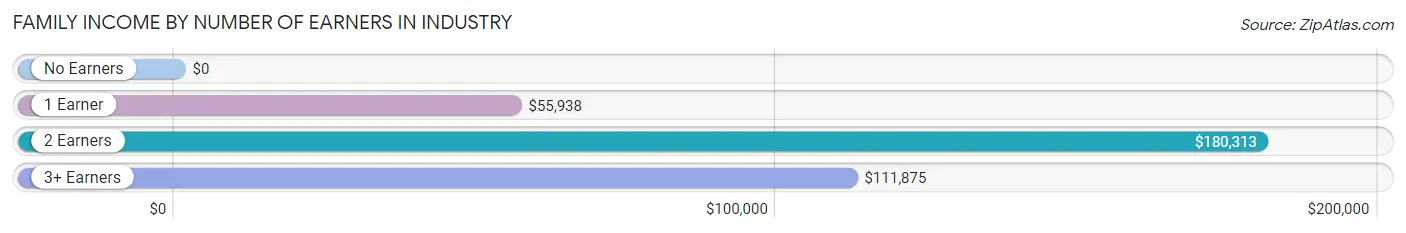
| Number of Earners | # Families | Median Income |
| No Earners | 0 (0.0%) | $0 |
| 1 Earner | 17 (58.6%) | $55,938 |
| 2 Earners | 7 (24.1%) | $180,313 |
| 3+ Earners | 5 (17.2%) | $111,875 |
| Total | 29 (100.0%) | $75,750 |
Household Income in Industry
Household Income Brackets in Industry
With 17 households falling in the category, the $100,000 to $149,999 income range is the most frequent in Industry, accounting for 34.0% of all households.
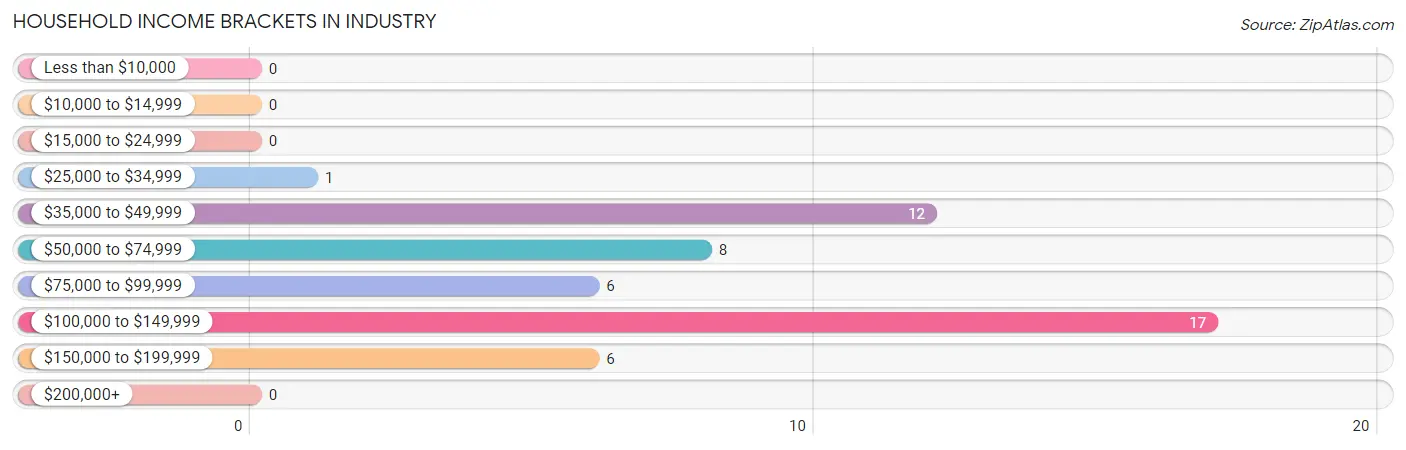
| Income Bracket | # Households | % Households |
| Less than $10,000 | 0 | 0.0% |
| $10,000 to $14,999 | 0 | 0.0% |
| $15,000 to $24,999 | 0 | 0.0% |
| $25,000 to $34,999 | 1 | 2.0% |
| $35,000 to $49,999 | 12 | 24.0% |
| $50,000 to $74,999 | 8 | 16.0% |
| $75,000 to $99,999 | 6 | 12.0% |
| $100,000 to $149,999 | 17 | 34.0% |
| $150,000 to $199,999 | 6 | 12.0% |
| $200,000+ | 0 | 0.0% |
Household Income by Householder Age in Industry
The median household income in Industry is $77,000, with the highest median household income of $105,893 found in the 65+ years age bracket for the primary householder. A total of 11 households (22.0%) fall into this category.
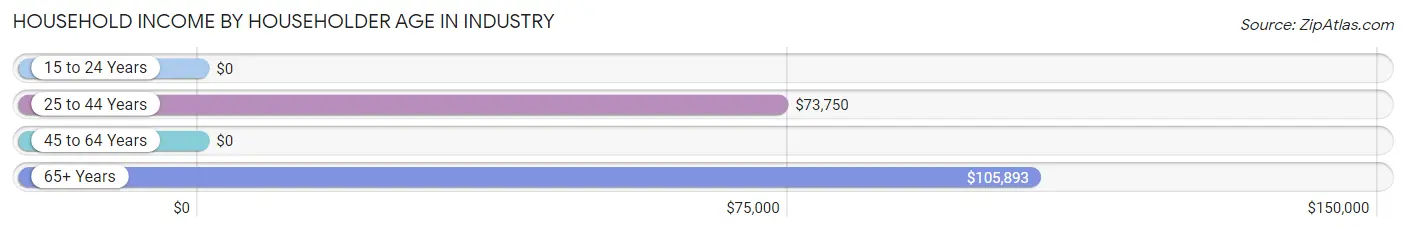
| Income Bracket | # Households | Median Income |
| 15 to 24 Years | 0 (0.0%) | $0 |
| 25 to 44 Years | 26 (52.0%) | $73,750 |
| 45 to 64 Years | 13 (26.0%) | $0 |
| 65+ Years | 11 (22.0%) | $105,893 |
| Total | 50 (100.0%) | $77,000 |
Poverty in Industry
Income Below Poverty by Sex and Age in Industry
With 8.9% poverty level for males and 16.2% for females among the residents of Industry, 25 to 34 year old males and 18 to 24 year old females are the most vulnerable to poverty, with 5 males (29.4%) and 6 females (75.0%) in their respective age groups living below the poverty level.
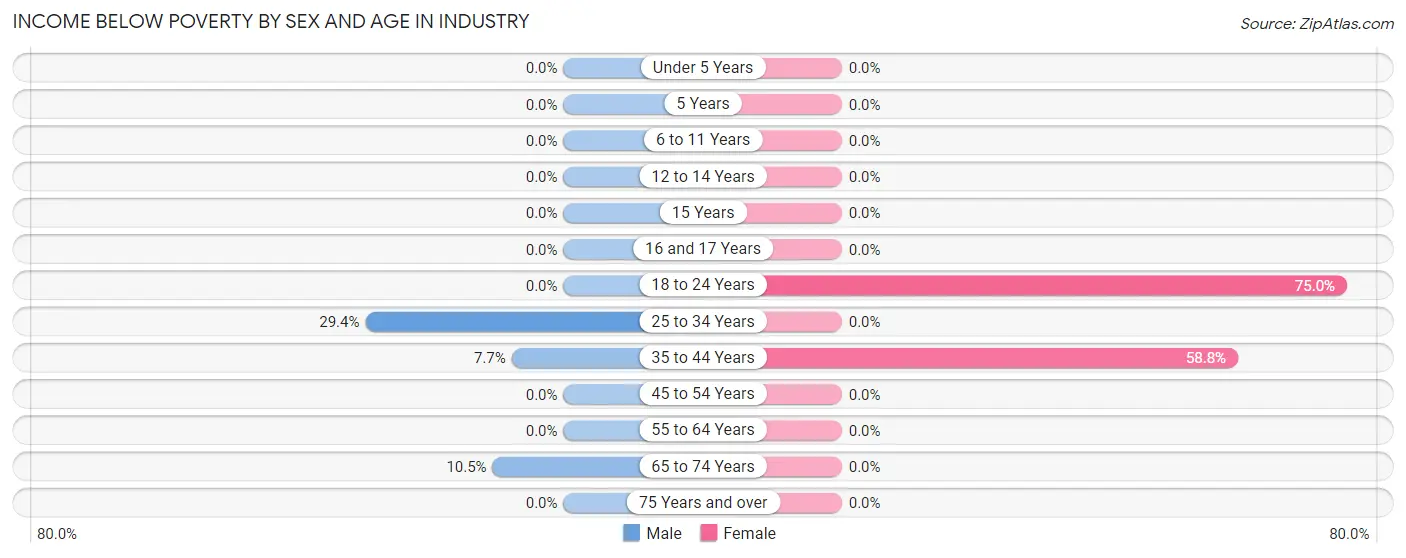
| Age Bracket | Male | Female |
| Under 5 Years | 0 (0.0%) | 0 (0.0%) |
| 5 Years | 0 (0.0%) | 0 (0.0%) |
| 6 to 11 Years | 0 (0.0%) | 0 (0.0%) |
| 12 to 14 Years | 0 (0.0%) | 0 (0.0%) |
| 15 Years | 0 (0.0%) | 0 (0.0%) |
| 16 and 17 Years | 0 (0.0%) | 0 (0.0%) |
| 18 to 24 Years | 0 (0.0%) | 6 (75.0%) |
| 25 to 34 Years | 5 (29.4%) | 0 (0.0%) |
| 35 to 44 Years | 1 (7.7%) | 10 (58.8%) |
| 45 to 54 Years | 0 (0.0%) | 0 (0.0%) |
| 55 to 64 Years | 0 (0.0%) | 0 (0.0%) |
| 65 to 74 Years | 2 (10.5%) | 0 (0.0%) |
| 75 Years and over | 0 (0.0%) | 0 (0.0%) |
| Total | 8 (8.9%) | 16 (16.2%) |
Income Above Poverty by Sex and Age in Industry
According to the poverty statistics in Industry, males aged under 5 years and females aged under 5 years are the age groups that are most secure financially, with 100.0% of males and 100.0% of females in these age groups living above the poverty line.
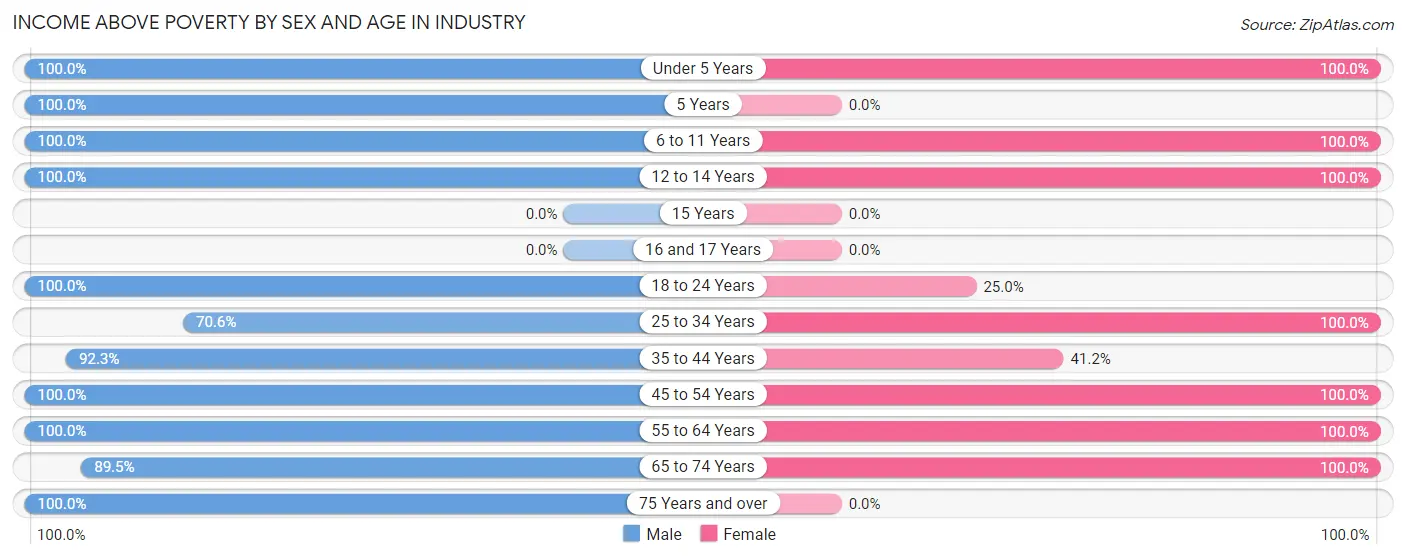
| Age Bracket | Male | Female |
| Under 5 Years | 10 (100.0%) | 23 (100.0%) |
| 5 Years | 5 (100.0%) | 0 (0.0%) |
| 6 to 11 Years | 8 (100.0%) | 16 (100.0%) |
| 12 to 14 Years | 1 (100.0%) | 3 (100.0%) |
| 15 Years | 0 (0.0%) | 0 (0.0%) |
| 16 and 17 Years | 0 (0.0%) | 0 (0.0%) |
| 18 to 24 Years | 4 (100.0%) | 2 (25.0%) |
| 25 to 34 Years | 12 (70.6%) | 17 (100.0%) |
| 35 to 44 Years | 12 (92.3%) | 7 (41.2%) |
| 45 to 54 Years | 11 (100.0%) | 3 (100.0%) |
| 55 to 64 Years | 1 (100.0%) | 8 (100.0%) |
| 65 to 74 Years | 17 (89.5%) | 4 (100.0%) |
| 75 Years and over | 1 (100.0%) | 0 (0.0%) |
| Total | 82 (91.1%) | 83 (83.8%) |
Income Below Poverty Among Married-Couple Families in Industry
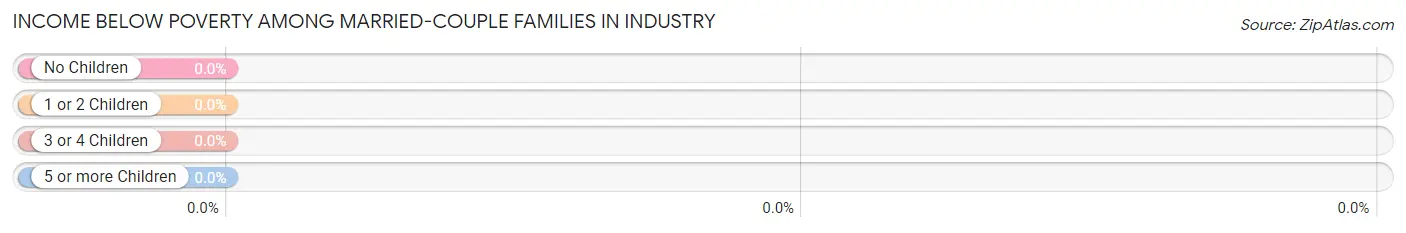
| Children | Above Poverty | Below Poverty |
| No Children | 3 (100.0%) | 0 (0.0%) |
| 1 or 2 Children | 12 (100.0%) | 0 (0.0%) |
| 3 or 4 Children | 2 (100.0%) | 0 (0.0%) |
| 5 or more Children | 1 (100.0%) | 0 (0.0%) |
| Total | 18 (100.0%) | 0 (0.0%) |
Income Below Poverty Among Single-Parent Households in Industry
| Children | Single Father | Single Mother |
| No Children | 0 (0.0%) | 0 (0.0%) |
| 1 or 2 Children | 0 (0.0%) | 0 (0.0%) |
| 3 or 4 Children | 0 (0.0%) | 0 (0.0%) |
| 5 or more Children | 0 (0.0%) | 0 (0.0%) |
| Total | 0 (0.0%) | 0 (0.0%) |
Income Below Poverty Among Married-Couple vs Single-Parent Households in Industry
| Children | Married-Couple Families | Single-Parent Households |
| No Children | 0 (0.0%) | 0 (0.0%) |
| 1 or 2 Children | 0 (0.0%) | 0 (0.0%) |
| 3 or 4 Children | 0 (0.0%) | 0 (0.0%) |
| 5 or more Children | 0 (0.0%) | 0 (0.0%) |
| Total | 0 (0.0%) | 0 (0.0%) |
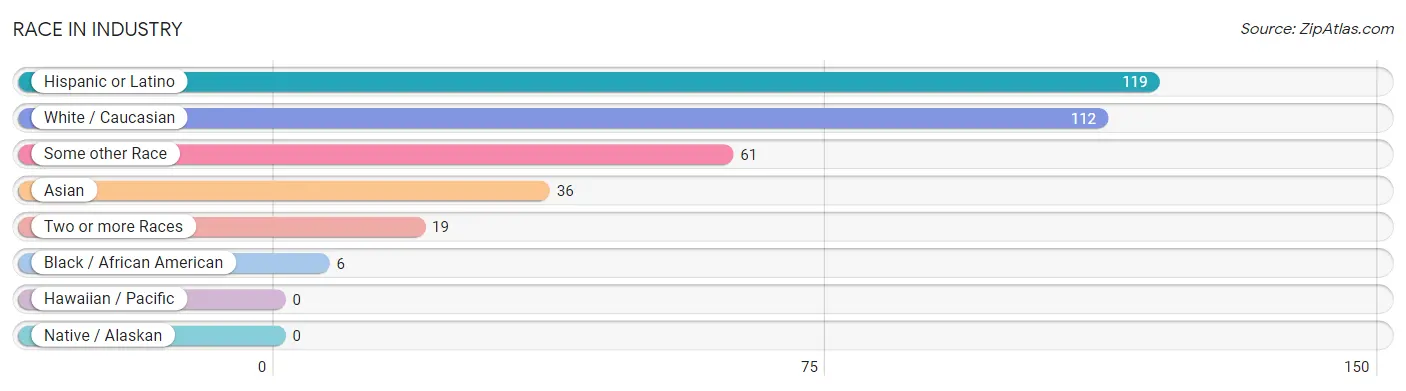
Race in Industry
The most populous races in Industry are Hispanic or Latino (119 | 50.8%), White / Caucasian (112 | 47.9%), and Some other Race (61 | 26.1%).
| Race | # Population | % Population |
| Asian | 36 | 15.4% |
| Black / African American | 6 | 2.6% |
| Hawaiian / Pacific | 0 | 0.0% |
| Hispanic or Latino | 119 | 50.8% |
| Native / Alaskan | 0 | 0.0% |
| White / Caucasian | 112 | 47.9% |
| Two or more Races | 19 | 8.1% |
| Some other Race | 61 | 26.1% |
| Total | 234 | 100.0% |
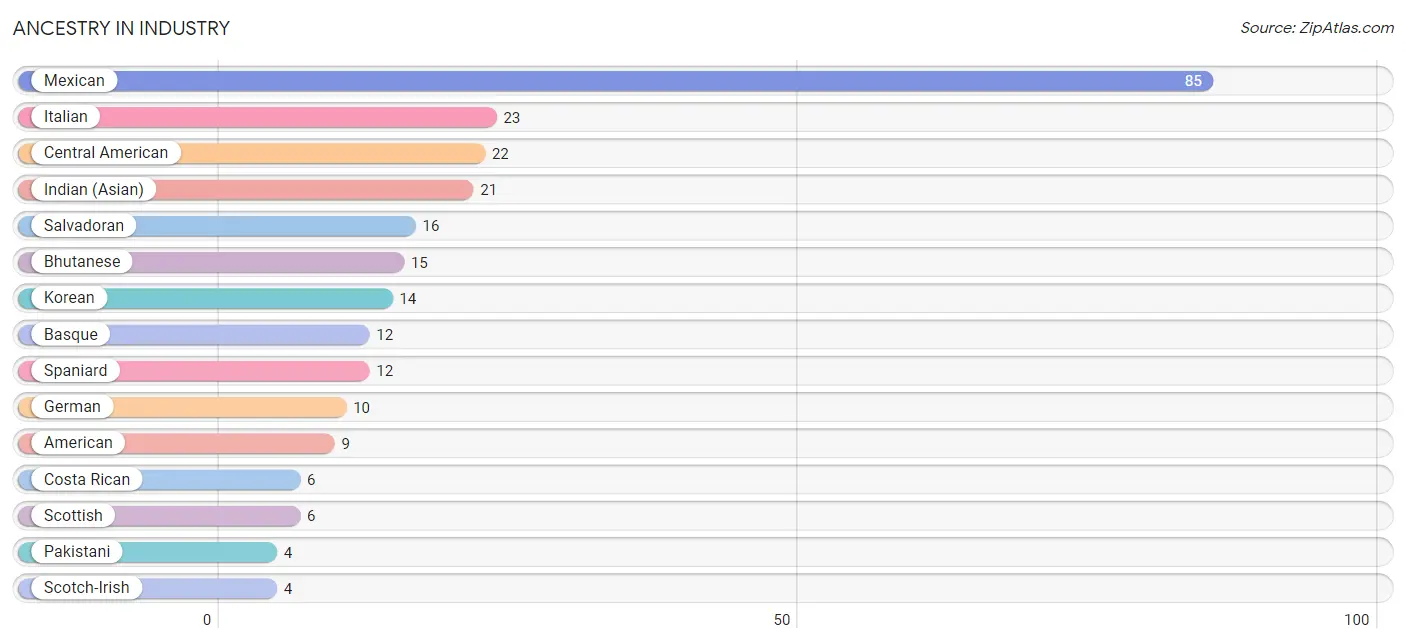
Ancestry in Industry
The most populous ancestries reported in Industry are Mexican (85 | 36.3%), Italian (23 | 9.8%), Central American (22 | 9.4%), Indian (Asian) (21 | 9.0%), and Salvadoran (16 | 6.8%), together accounting for 71.4% of all Industry residents.
| Ancestry | # Population | % Population |
| American | 9 | 3.8% |
| Australian | 1 | 0.4% |
| Basque | 12 | 5.1% |
| Bhutanese | 15 | 6.4% |
| Central American | 22 | 9.4% |
| Costa Rican | 6 | 2.6% |
| English | 3 | 1.3% |
| German | 10 | 4.3% |
| Indian (Asian) | 21 | 9.0% |
| Irish | 3 | 1.3% |
| Italian | 23 | 9.8% |
| Korean | 14 | 6.0% |
| Mexican | 85 | 36.3% |
| Pakistani | 4 | 1.7% |
| Salvadoran | 16 | 6.8% |
| Scandinavian | 1 | 0.4% |
| Scotch-Irish | 4 | 1.7% |
| Scottish | 6 | 2.6% |
| Spaniard | 12 | 5.1% |
| Welsh | 4 | 1.7% | View All 20 Rows |
Immigrants in Industry
The most numerous immigrant groups reported in Industry came from Central America (31 | 13.3%), Latin America (31 | 13.3%), Mexico (21 | 9.0%), El Salvador (8 | 3.4%), and Asia (6 | 2.6%), together accounting for 41.5% of all Industry residents.
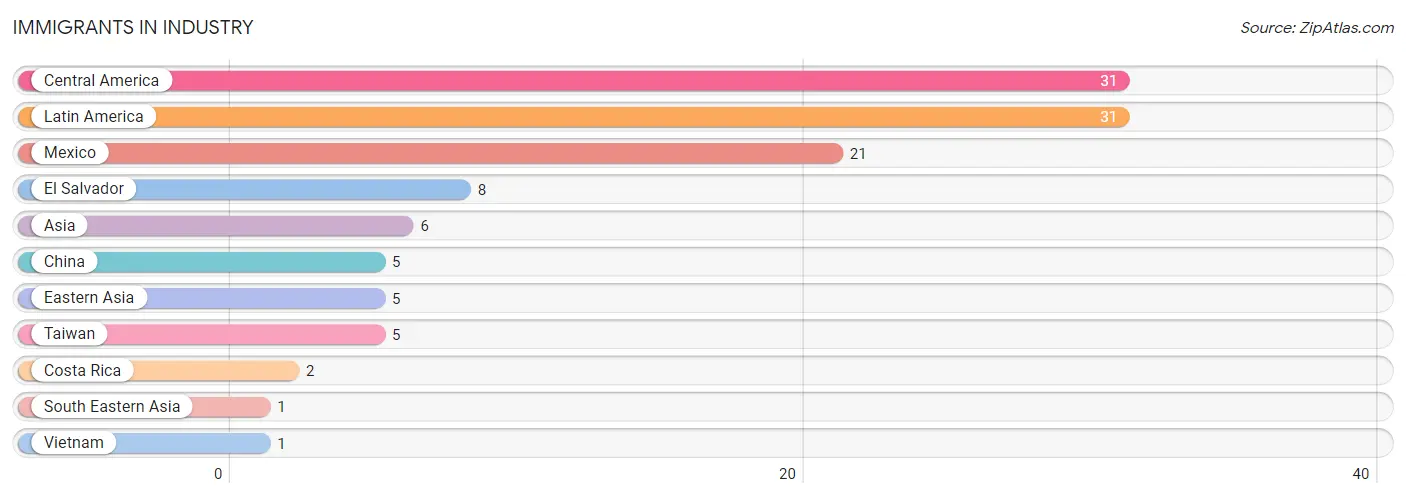
| Immigration Origin | # Population | % Population |
| Asia | 6 | 2.6% |
| Central America | 31 | 13.3% |
| China | 5 | 2.1% |
| Costa Rica | 2 | 0.9% |
| Eastern Asia | 5 | 2.1% |
| El Salvador | 8 | 3.4% |
| Latin America | 31 | 13.3% |
| Mexico | 21 | 9.0% |
| South Eastern Asia | 1 | 0.4% |
| Taiwan | 5 | 2.1% |
| Vietnam | 1 | 0.4% | View All 11 Rows |
Sex and Age in Industry
Sex and Age in Industry
The most populous age groups in Industry are 25 to 29 Years (31 | 23.5%) for men and Under 5 Years (23 | 22.6%) for women.
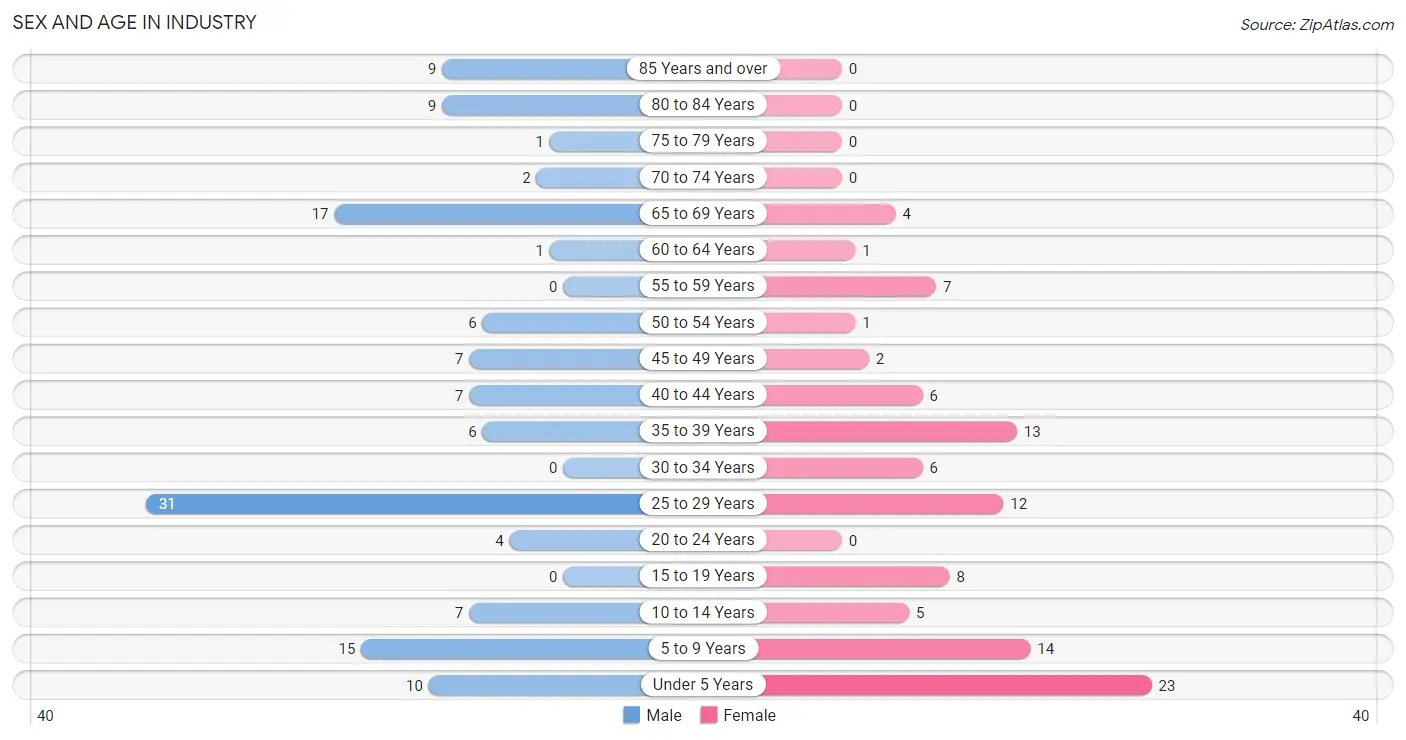
| Age Bracket | Male | Female |
| Under 5 Years | 10 (7.6%) | 23 (22.6%) |
| 5 to 9 Years | 15 (11.4%) | 14 (13.7%) |
| 10 to 14 Years | 7 (5.3%) | 5 (4.9%) |
| 15 to 19 Years | 0 (0.0%) | 8 (7.8%) |
| 20 to 24 Years | 4 (3.0%) | 0 (0.0%) |
| 25 to 29 Years | 31 (23.5%) | 12 (11.8%) |
| 30 to 34 Years | 0 (0.0%) | 6 (5.9%) |
| 35 to 39 Years | 6 (4.5%) | 13 (12.8%) |
| 40 to 44 Years | 7 (5.3%) | 6 (5.9%) |
| 45 to 49 Years | 7 (5.3%) | 2 (2.0%) |
| 50 to 54 Years | 6 (4.5%) | 1 (1.0%) |
| 55 to 59 Years | 0 (0.0%) | 7 (6.9%) |
| 60 to 64 Years | 1 (0.8%) | 1 (1.0%) |
| 65 to 69 Years | 17 (12.9%) | 4 (3.9%) |
| 70 to 74 Years | 2 (1.5%) | 0 (0.0%) |
| 75 to 79 Years | 1 (0.8%) | 0 (0.0%) |
| 80 to 84 Years | 9 (6.8%) | 0 (0.0%) |
| 85 Years and over | 9 (6.8%) | 0 (0.0%) |
| Total | 132 (100.0%) | 102 (100.0%) |
Families and Households in Industry
Median Family Size in Industry
The median family size in Industry is 4.31 persons per family, with married-couple families (18 | 62.1%) accounting for the largest median family size of 4.72 persons per family. On the other hand, single male/father families (2 | 6.9%) represent the smallest median family size with 3.00 persons per family.
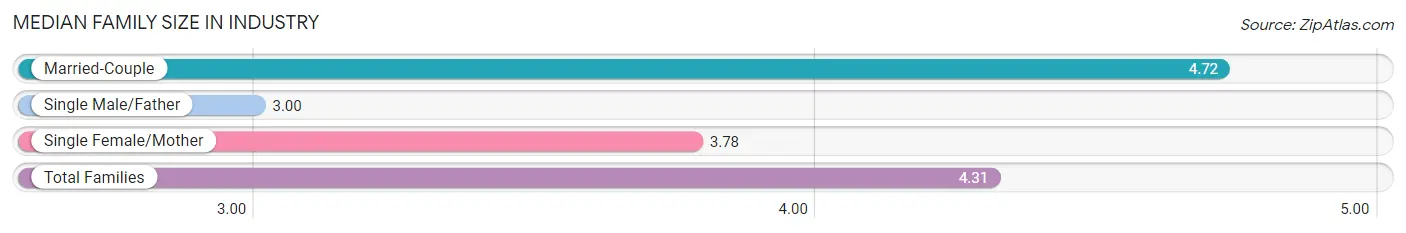
| Family Type | # Families | Family Size |
| Married-Couple | 18 (62.1%) | 4.72 |
| Single Male/Father | 2 (6.9%) | 3.00 |
| Single Female/Mother | 9 (31.0%) | 3.78 |
| Total Families | 29 (100.0%) | 4.31 |
Median Household Size in Industry
The median household size in Industry is 3.60 persons per household, with married-couple households (18 | 36.0%) accounting for the largest median household size of 4.72 persons per household. non-family households (21 | 42.0%) represent the smallest median household size with 2.43 persons per household.
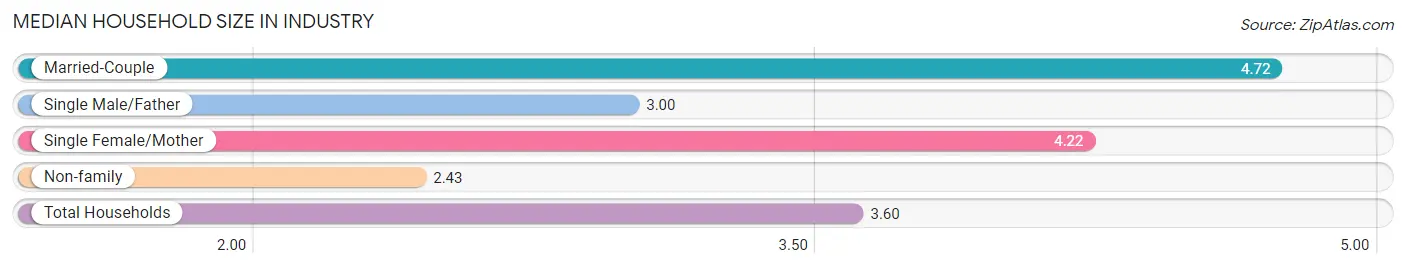
| Household Type | # Households | Household Size |
| Married-Couple | 18 (36.0%) | 4.72 |
| Single Male/Father | 2 (4.0%) | 3.00 |
| Single Female/Mother | 9 (18.0%) | 4.22 |
| Non-family | 21 (42.0%) | 2.43 |
| Total Households | 50 (100.0%) | 3.60 |
Household Size by Marriage Status in Industry
Out of a total of 50 households in Industry, 29 (58.0%) are family households, while 21 (42.0%) are nonfamily households. The most numerous type of family households are 4-person households, comprising 14, and the most common type of nonfamily households are 1-person households, comprising 12.
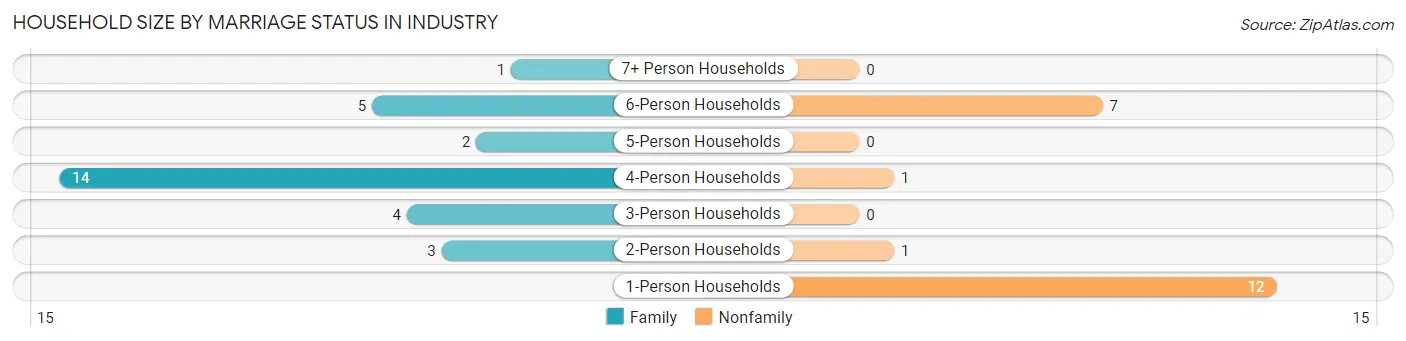
| Household Size | Family Households | Nonfamily Households |
| 1-Person Households | - | 12 (24.0%) |
| 2-Person Households | 3 (6.0%) | 1 (2.0%) |
| 3-Person Households | 4 (8.0%) | 0 (0.0%) |
| 4-Person Households | 14 (28.0%) | 1 (2.0%) |
| 5-Person Households | 2 (4.0%) | 0 (0.0%) |
| 6-Person Households | 5 (10.0%) | 7 (14.0%) |
| 7+ Person Households | 1 (2.0%) | 0 (0.0%) |
| Total | 29 (58.0%) | 21 (42.0%) |
Female Fertility in Industry
Fertility by Age in Industry
Average fertility rate in Industry is 277.0 births per 1,000 women. Women in the age bracket of 20 to 34 years have the highest fertility rate with 389.0 births per 1,000 women. Women in the age bracket of 20 to 34 years acount for 53.8% of all women with births.
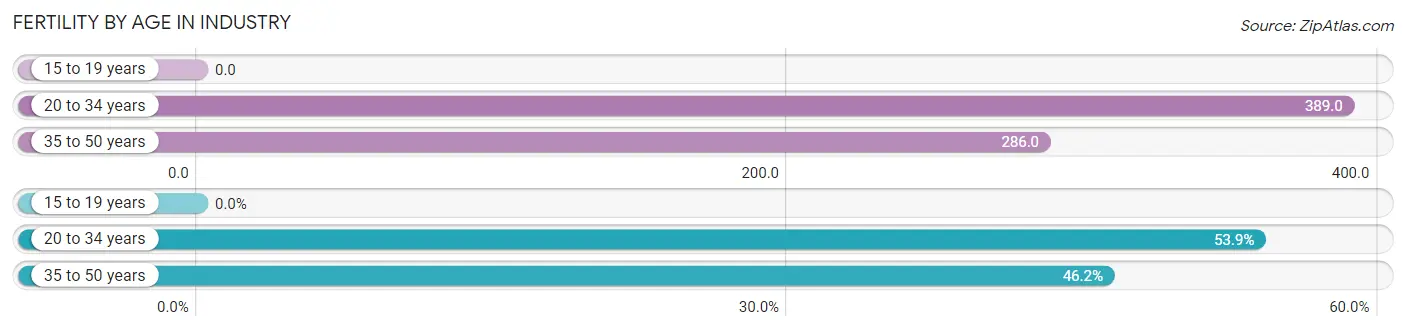
| Age Bracket | Women with Births | Births / 1,000 Women |
| 15 to 19 years | 0 (0.0%) | 0.0 |
| 20 to 34 years | 7 (53.8%) | 389.0 |
| 35 to 50 years | 6 (46.2%) | 286.0 |
| Total | 13 (100.0%) | 277.0 |
Fertility by Age by Marriage Status in Industry
15.4% of women with births (13) in Industry are married. The highest percentage of unmarried women with births falls into 35 to 50 years age bracket with 100.0% of them unmarried at the time of birth, while the lowest percentage of unmarried women with births belong to 20 to 34 years age bracket with 71.4% of them unmarried.
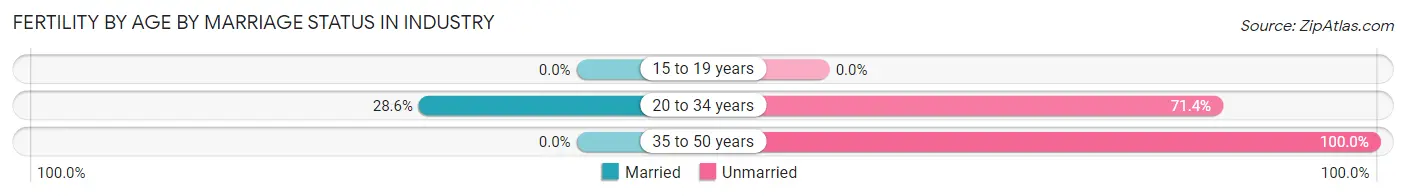
| Age Bracket | Married | Unmarried |
| 15 to 19 years | 0 (0.0%) | 0 (0.0%) |
| 20 to 34 years | 2 (28.6%) | 5 (71.4%) |
| 35 to 50 years | 0 (0.0%) | 6 (100.0%) |
| Total | 2 (15.4%) | 11 (84.6%) |
Fertility by Education in Industry
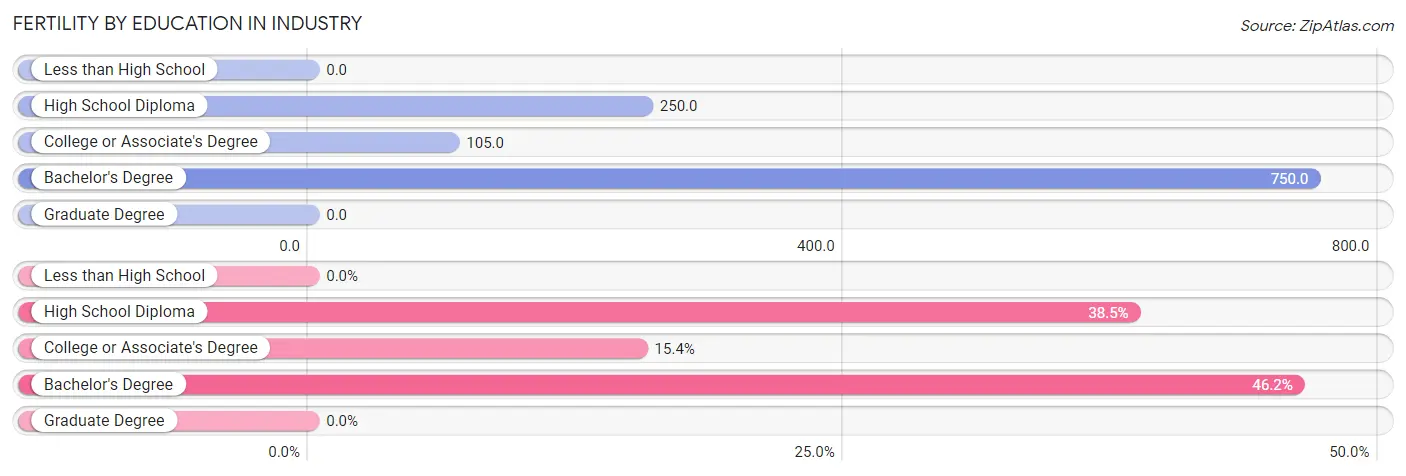
| Educational Attainment | Women with Births | Births / 1,000 Women |
| Less than High School | 0 (0.0%) | 0.0 |
| High School Diploma | 5 (38.5%) | 250.0 |
| College or Associate's Degree | 2 (15.4%) | 105.0 |
| Bachelor's Degree | 6 (46.2%) | 750.0 |
| Graduate Degree | 0 (0.0%) | 0.0 |
| Total | 13 (100.0%) | 277.0 |
Fertility by Education by Marriage Status in Industry
84.6% of women with births in Industry are unmarried. Women with the educational attainment of college or associate's degree are most likely to be married with 100.0% of them married at childbirth, while women with the educational attainment of high school diploma are least likely to be married with 100.0% of them unmarried at childbirth.
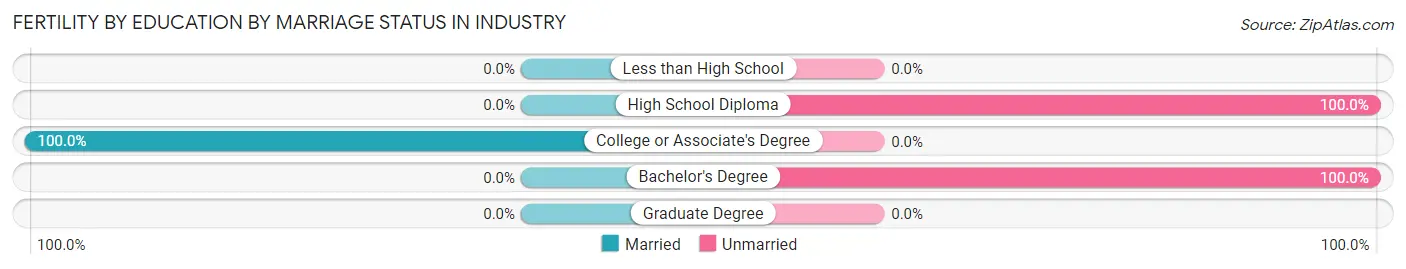
| Educational Attainment | Married | Unmarried |
| Less than High School | 0 (0.0%) | 0 (0.0%) |
| High School Diploma | 0 (0.0%) | 5 (100.0%) |
| College or Associate's Degree | 2 (100.0%) | 0 (0.0%) |
| Bachelor's Degree | 0 (0.0%) | 6 (100.0%) |
| Graduate Degree | 0 (0.0%) | 0 (0.0%) |
| Total | 2 (15.4%) | 11 (84.6%) |
Employment Characteristics in Industry
Employment by Class of Employer in Industry
Among the 85 employed individuals in Industry, private company employees (73 | 85.9%), local government employees (6 | 7.1%), and not-for-profit organizations (4 | 4.7%) make up the most common classes of employment.
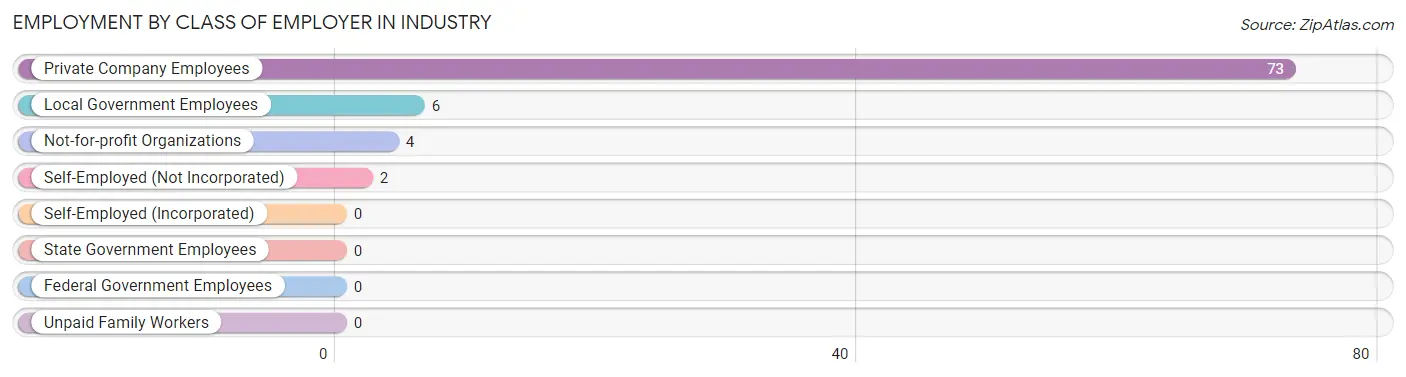
| Employer Class | # Employees | % Employees |
| Private Company Employees | 73 | 85.9% |
| Self-Employed (Incorporated) | 0 | 0.0% |
| Self-Employed (Not Incorporated) | 2 | 2.4% |
| Not-for-profit Organizations | 4 | 4.7% |
| Local Government Employees | 6 | 7.1% |
| State Government Employees | 0 | 0.0% |
| Federal Government Employees | 0 | 0.0% |
| Unpaid Family Workers | 0 | 0.0% |
| Total | 85 | 100.0% |
Employment Status by Age in Industry
According to the labor force statistics for Industry, out of the total population over 16 years of age (160), 57.5% or 92 individuals are in the labor force, with 7.6% or 7 of them unemployed. The age group with the highest labor force participation rate is 20 to 24 years, with 100.0% or 4 individuals in the labor force. Within the labor force, the 55 to 59 years age range has the highest percentage of unemployed individuals, with 100.0% or 7 of them being unemployed.
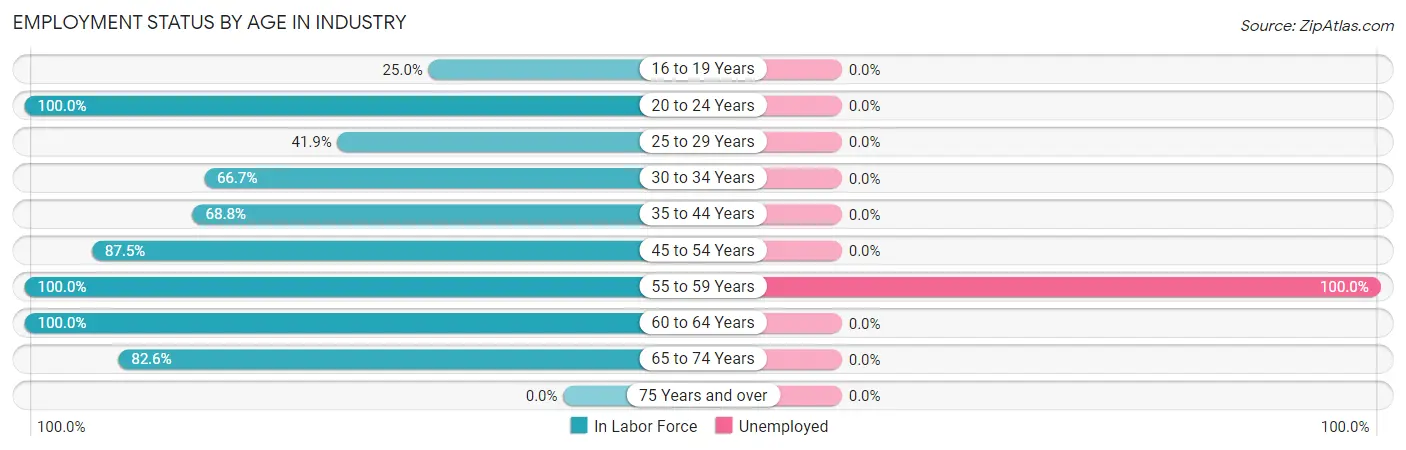
| Age Bracket | In Labor Force | Unemployed |
| 16 to 19 Years | 2 (25.0%) | 0 (0.0%) |
| 20 to 24 Years | 4 (100.0%) | 0 (0.0%) |
| 25 to 29 Years | 18 (41.9%) | 0 (0.0%) |
| 30 to 34 Years | 4 (66.7%) | 0 (0.0%) |
| 35 to 44 Years | 22 (68.8%) | 0 (0.0%) |
| 45 to 54 Years | 14 (87.5%) | 0 (0.0%) |
| 55 to 59 Years | 7 (100.0%) | 7 (100.0%) |
| 60 to 64 Years | 2 (100.0%) | 0 (0.0%) |
| 65 to 74 Years | 19 (82.6%) | 0 (0.0%) |
| 75 Years and over | 0 (0.0%) | 0 (0.0%) |
| Total | 92 (57.5%) | 7 (7.6%) |
Employment Status by Educational Attainment in Industry
According to labor force statistics for Industry, 63.2% of individuals (67) out of the total population between 25 and 64 years of age (106) are in the labor force, with 10.4% or 7 of them being unemployed. The group with the highest labor force participation rate are those with the educational attainment of less than high school, with 75.0% or 12 individuals in the labor force. Within the labor force, individuals with bachelor's degree or higher education have the highest percentage of unemployment, with 38.9% or 7 of them being unemployed.
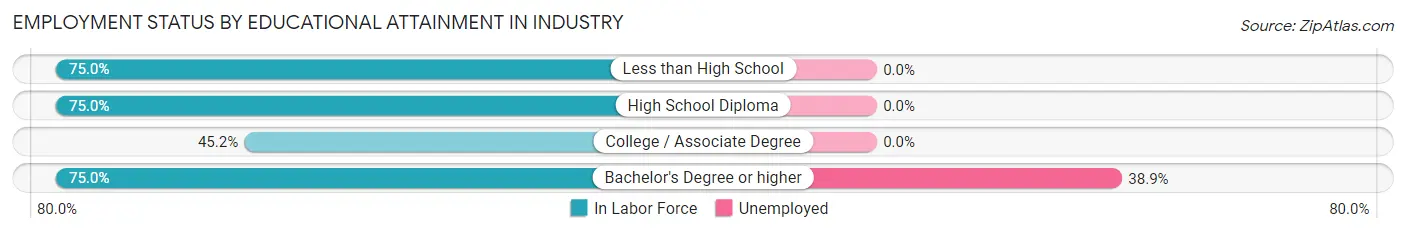
| Educational Attainment | In Labor Force | Unemployed |
| Less than High School | 12 (75.0%) | 0 (0.0%) |
| High School Diploma | 18 (75.0%) | 0 (0.0%) |
| College / Associate Degree | 19 (45.2%) | 0 (0.0%) |
| Bachelor's Degree or higher | 18 (75.0%) | 9 (38.9%) |
| Total | 67 (63.2%) | 11 (10.4%) |
Employment Occupations by Sex in Industry
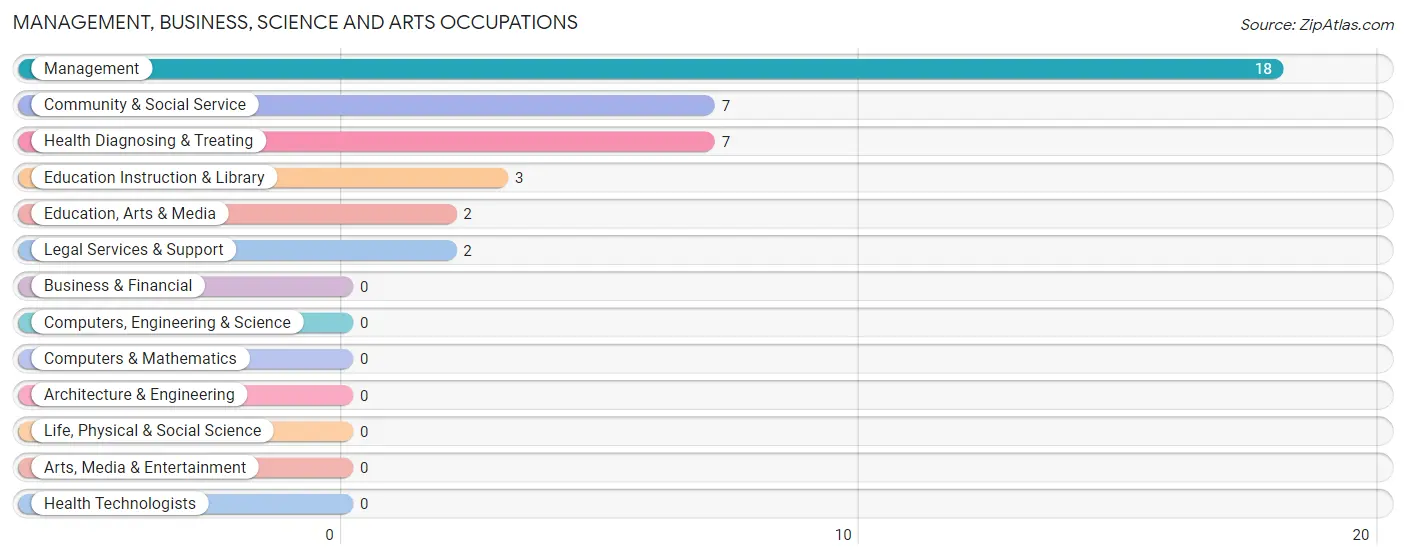
Management, Business, Science and Arts Occupations
The most common Management, Business, Science and Arts occupations in Industry are Management (18 | 21.2%), Community & Social Service (7 | 8.2%), Health Diagnosing & Treating (7 | 8.2%), Education Instruction & Library (3 | 3.5%), and Education, Arts & Media (2 | 2.4%).
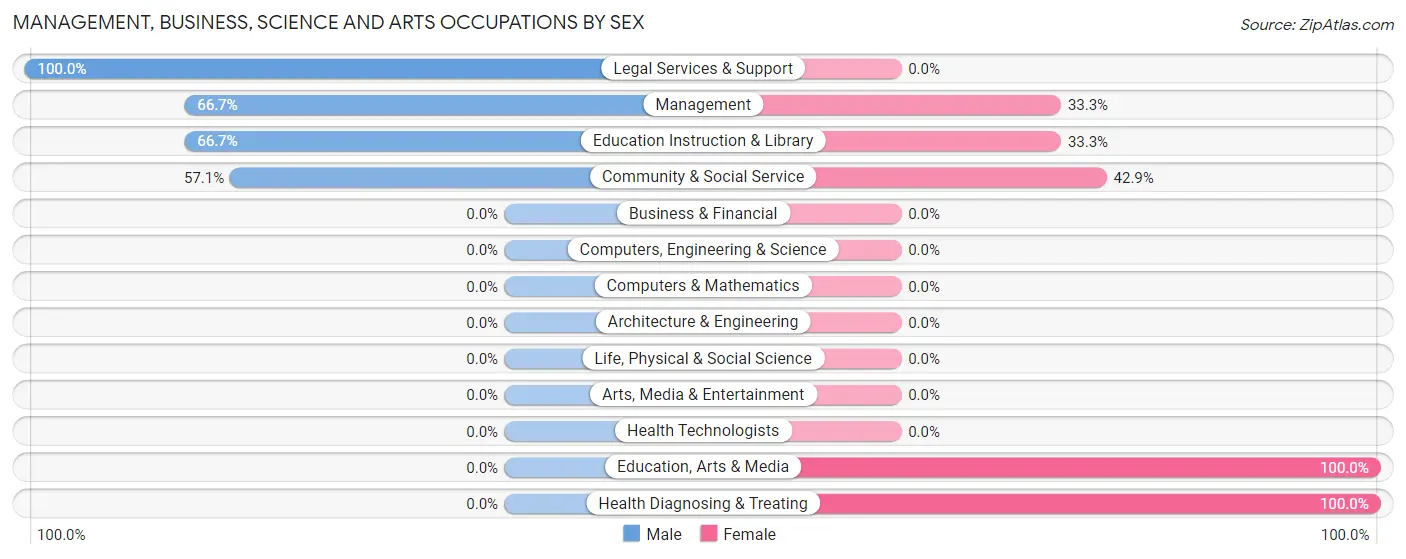
Management, Business, Science and Arts Occupations by Sex
Within the Management, Business, Science and Arts occupations in Industry, the most male-oriented occupations are Legal Services & Support (100.0%), Management (66.7%), and Education Instruction & Library (66.7%), while the most female-oriented occupations are Education, Arts & Media (100.0%), Health Diagnosing & Treating (100.0%), and Community & Social Service (42.9%).
| Occupation | Male | Female |
| Management | 12 (66.7%) | 6 (33.3%) |
| Business & Financial | 0 (0.0%) | 0 (0.0%) |
| Computers, Engineering & Science | 0 (0.0%) | 0 (0.0%) |
| Computers & Mathematics | 0 (0.0%) | 0 (0.0%) |
| Architecture & Engineering | 0 (0.0%) | 0 (0.0%) |
| Life, Physical & Social Science | 0 (0.0%) | 0 (0.0%) |
| Community & Social Service | 4 (57.1%) | 3 (42.9%) |
| Education, Arts & Media | 0 (0.0%) | 2 (100.0%) |
| Legal Services & Support | 2 (100.0%) | 0 (0.0%) |
| Education Instruction & Library | 2 (66.7%) | 1 (33.3%) |
| Arts, Media & Entertainment | 0 (0.0%) | 0 (0.0%) |
| Health Diagnosing & Treating | 0 (0.0%) | 7 (100.0%) |
| Health Technologists | 0 (0.0%) | 0 (0.0%) |
| Total (Category) | 16 (50.0%) | 16 (50.0%) |
| Total (Overall) | 56 (65.9%) | 29 (34.1%) |
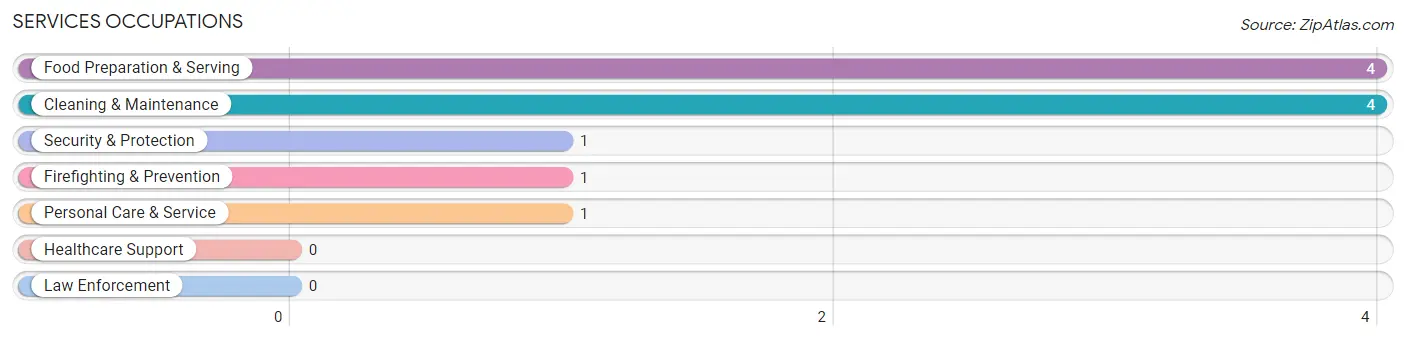
Services Occupations
The most common Services occupations in Industry are Food Preparation & Serving (4 | 4.7%), Cleaning & Maintenance (4 | 4.7%), Security & Protection (1 | 1.2%), Firefighting & Prevention (1 | 1.2%), and Personal Care & Service (1 | 1.2%).
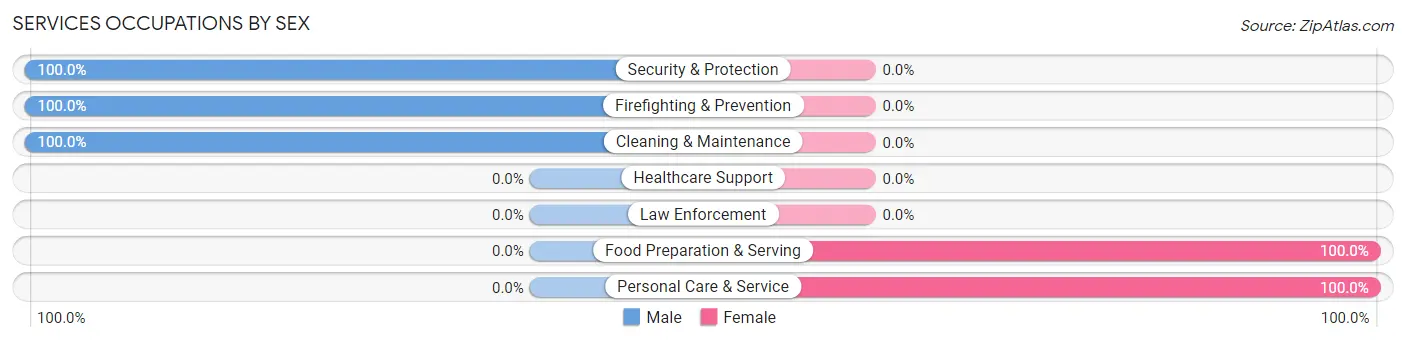
Services Occupations by Sex
Within the Services occupations in Industry, the most male-oriented occupations are Security & Protection (100.0%), Firefighting & Prevention (100.0%), and Cleaning & Maintenance (100.0%), while the most female-oriented occupations are Food Preparation & Serving (100.0%), and Personal Care & Service (100.0%).
| Occupation | Male | Female |
| Healthcare Support | 0 (0.0%) | 0 (0.0%) |
| Security & Protection | 1 (100.0%) | 0 (0.0%) |
| Firefighting & Prevention | 1 (100.0%) | 0 (0.0%) |
| Law Enforcement | 0 (0.0%) | 0 (0.0%) |
| Food Preparation & Serving | 0 (0.0%) | 4 (100.0%) |
| Cleaning & Maintenance | 4 (100.0%) | 0 (0.0%) |
| Personal Care & Service | 0 (0.0%) | 1 (100.0%) |
| Total (Category) | 5 (50.0%) | 5 (50.0%) |
| Total (Overall) | 56 (65.9%) | 29 (34.1%) |
Sales and Office Occupations
The most common Sales and Office occupations in Industry are Sales & Related (7 | 8.2%), and Office & Administration (5 | 5.9%).
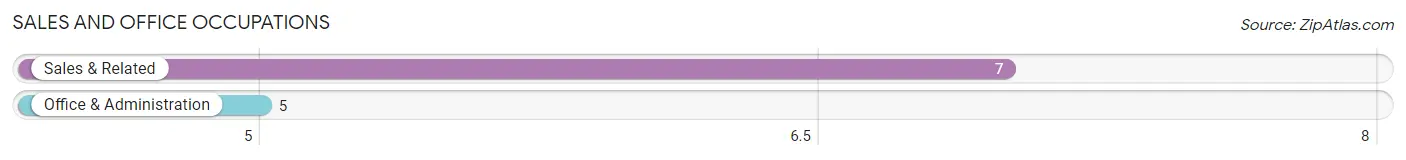
Sales and Office Occupations by Sex
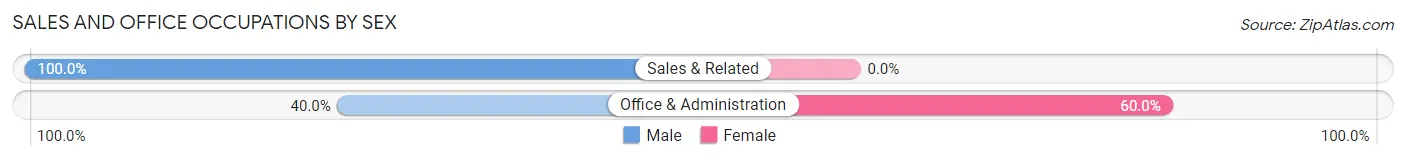
| Occupation | Male | Female |
| Sales & Related | 7 (100.0%) | 0 (0.0%) |
| Office & Administration | 2 (40.0%) | 3 (60.0%) |
| Total (Category) | 9 (75.0%) | 3 (25.0%) |
| Total (Overall) | 56 (65.9%) | 29 (34.1%) |
Natural Resources, Construction and Maintenance Occupations
The most common Natural Resources, Construction and Maintenance occupations in Industry are Construction & Extraction (5 | 5.9%), and Farming, Fishing & Forestry (1 | 1.2%).
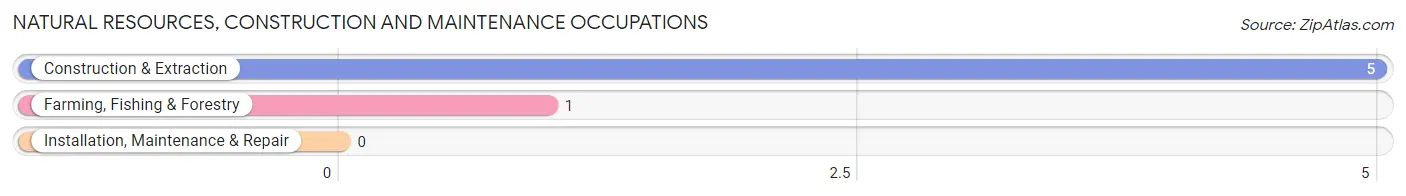
Natural Resources, Construction and Maintenance Occupations by Sex
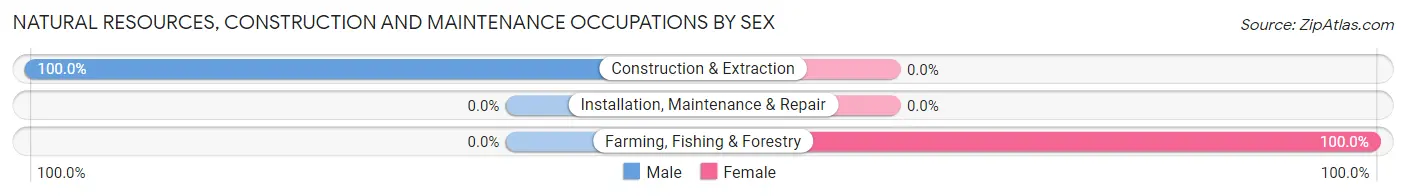
| Occupation | Male | Female |
| Farming, Fishing & Forestry | 0 (0.0%) | 1 (100.0%) |
| Construction & Extraction | 5 (100.0%) | 0 (0.0%) |
| Installation, Maintenance & Repair | 0 (0.0%) | 0 (0.0%) |
| Total (Category) | 5 (83.3%) | 1 (16.7%) |
| Total (Overall) | 56 (65.9%) | 29 (34.1%) |
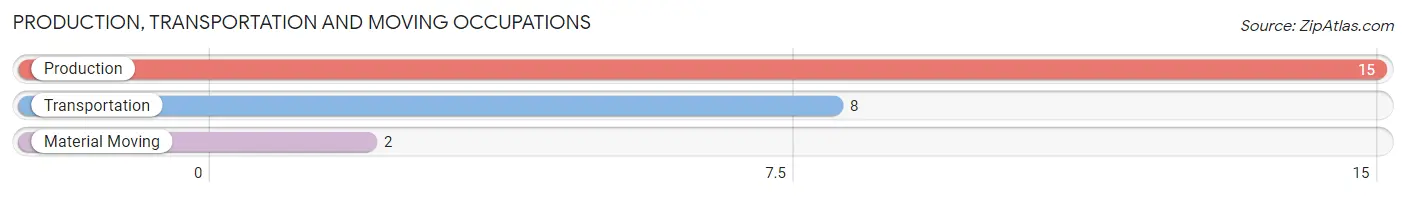
Production, Transportation and Moving Occupations
The most common Production, Transportation and Moving occupations in Industry are Production (15 | 17.6%), Transportation (8 | 9.4%), and Material Moving (2 | 2.4%).
Production, Transportation and Moving Occupations by Sex
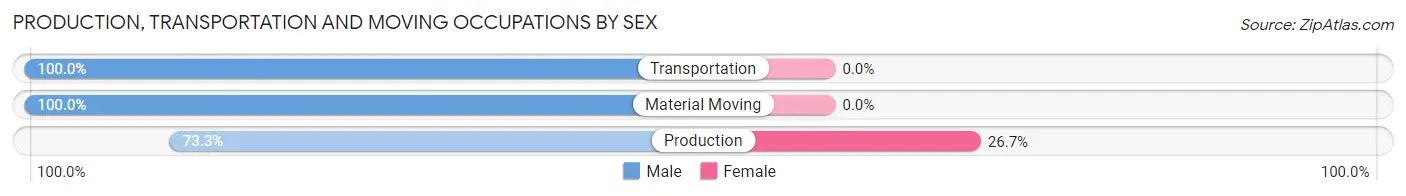
| Occupation | Male | Female |
| Production | 11 (73.3%) | 4 (26.7%) |
| Transportation | 8 (100.0%) | 0 (0.0%) |
| Material Moving | 2 (100.0%) | 0 (0.0%) |
| Total (Category) | 21 (84.0%) | 4 (16.0%) |
| Total (Overall) | 56 (65.9%) | 29 (34.1%) |
Employment Industries by Sex in Industry
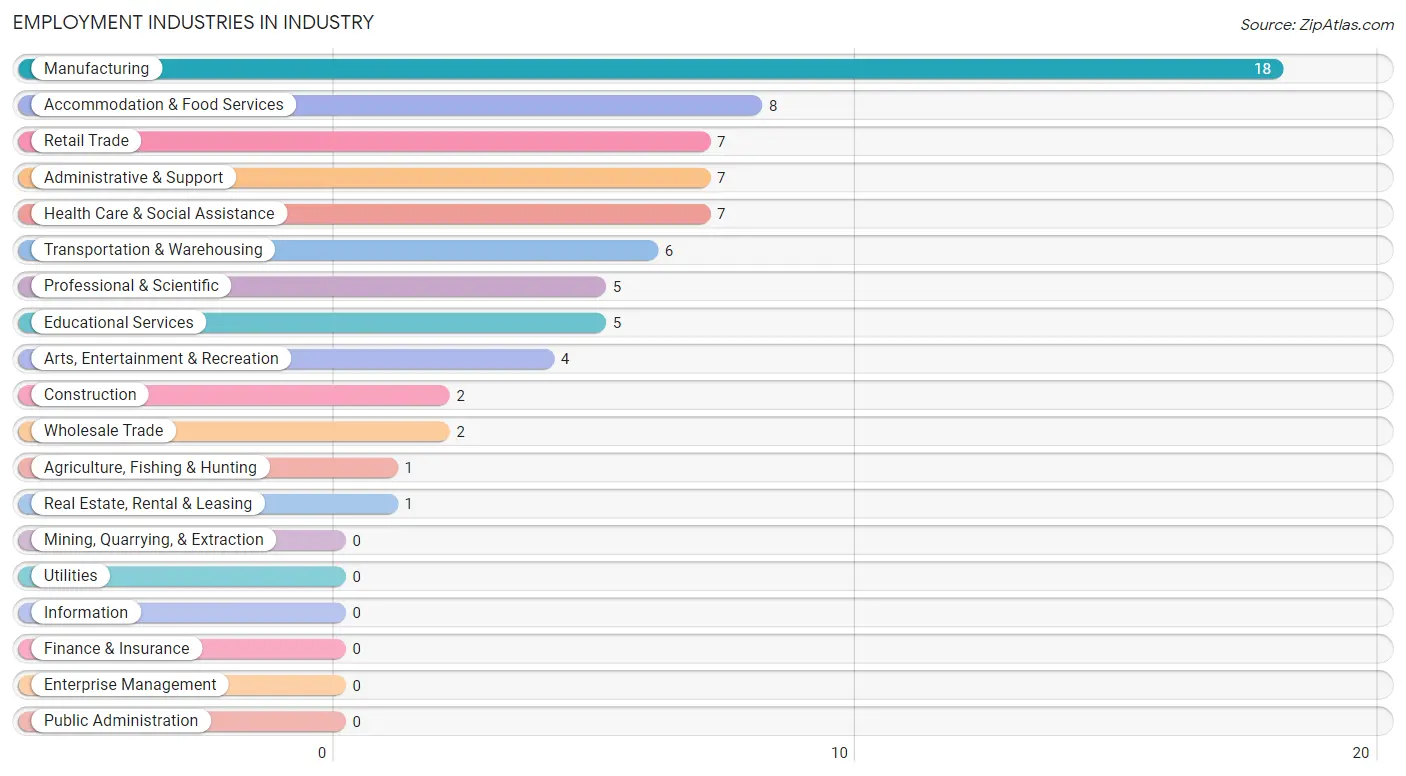
Employment Industries in Industry
The major employment industries in Industry include Manufacturing (18 | 21.2%), Accommodation & Food Services (8 | 9.4%), Retail Trade (7 | 8.2%), Administrative & Support (7 | 8.2%), and Health Care & Social Assistance (7 | 8.2%).
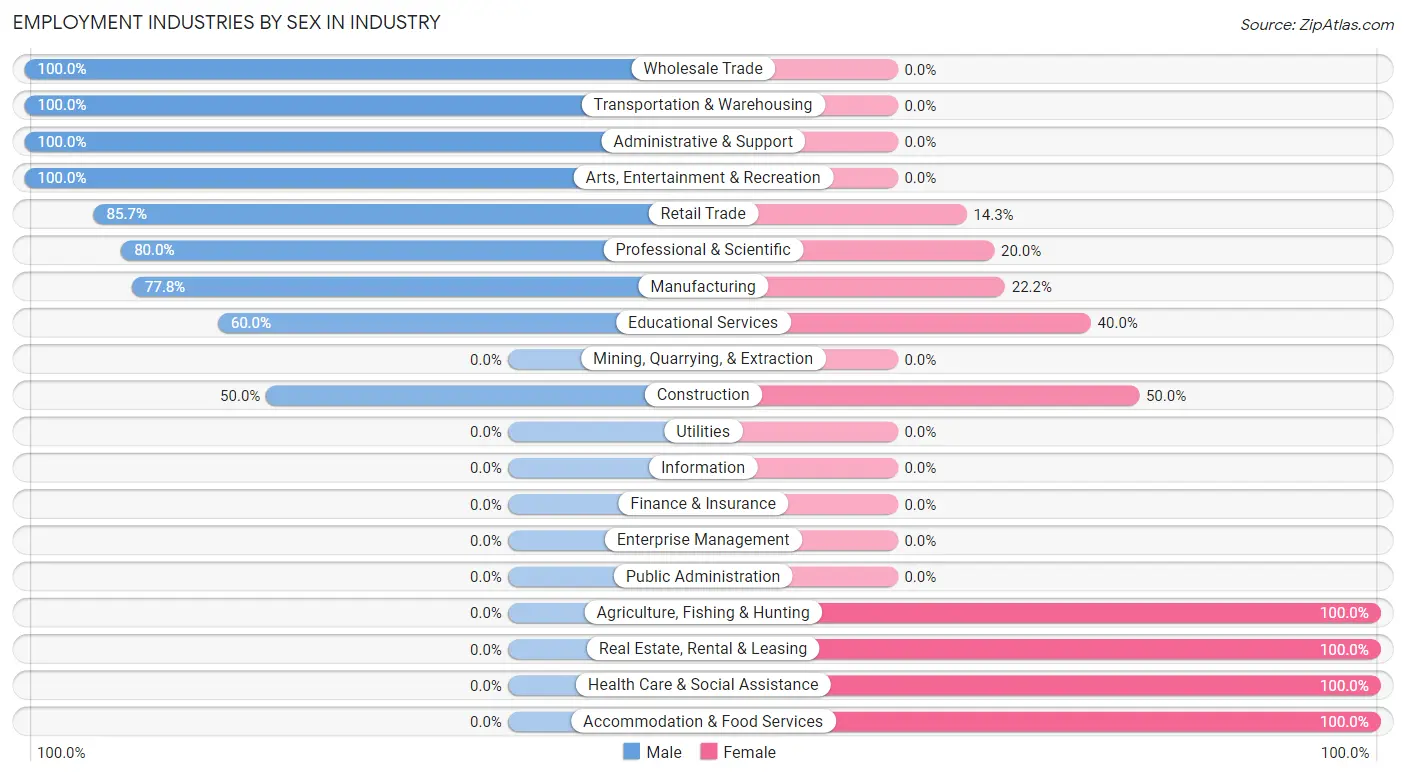
Employment Industries by Sex in Industry
The Industry industries that see more men than women are Wholesale Trade (100.0%), Transportation & Warehousing (100.0%), and Administrative & Support (100.0%), whereas the industries that tend to have a higher number of women are Agriculture, Fishing & Hunting (100.0%), Real Estate, Rental & Leasing (100.0%), and Health Care & Social Assistance (100.0%).
| Industry | Male | Female |
| Agriculture, Fishing & Hunting | 0 (0.0%) | 1 (100.0%) |
| Mining, Quarrying, & Extraction | 0 (0.0%) | 0 (0.0%) |
| Construction | 1 (50.0%) | 1 (50.0%) |
| Manufacturing | 14 (77.8%) | 4 (22.2%) |
| Wholesale Trade | 2 (100.0%) | 0 (0.0%) |
| Retail Trade | 6 (85.7%) | 1 (14.3%) |
| Transportation & Warehousing | 6 (100.0%) | 0 (0.0%) |
| Utilities | 0 (0.0%) | 0 (0.0%) |
| Information | 0 (0.0%) | 0 (0.0%) |
| Finance & Insurance | 0 (0.0%) | 0 (0.0%) |
| Real Estate, Rental & Leasing | 0 (0.0%) | 1 (100.0%) |
| Professional & Scientific | 4 (80.0%) | 1 (20.0%) |
| Enterprise Management | 0 (0.0%) | 0 (0.0%) |
| Administrative & Support | 7 (100.0%) | 0 (0.0%) |
| Educational Services | 3 (60.0%) | 2 (40.0%) |
| Health Care & Social Assistance | 0 (0.0%) | 7 (100.0%) |
| Arts, Entertainment & Recreation | 4 (100.0%) | 0 (0.0%) |
| Accommodation & Food Services | 0 (0.0%) | 8 (100.0%) |
| Public Administration | 0 (0.0%) | 0 (0.0%) |
| Total | 56 (65.9%) | 29 (34.1%) |
Education in Industry
School Enrollment in Industry
The most common levels of schooling among the 58 students in Industry are elementary school (21 | 36.2%), middle school (13 | 22.4%), and nursery / preschool (11 | 19.0%).
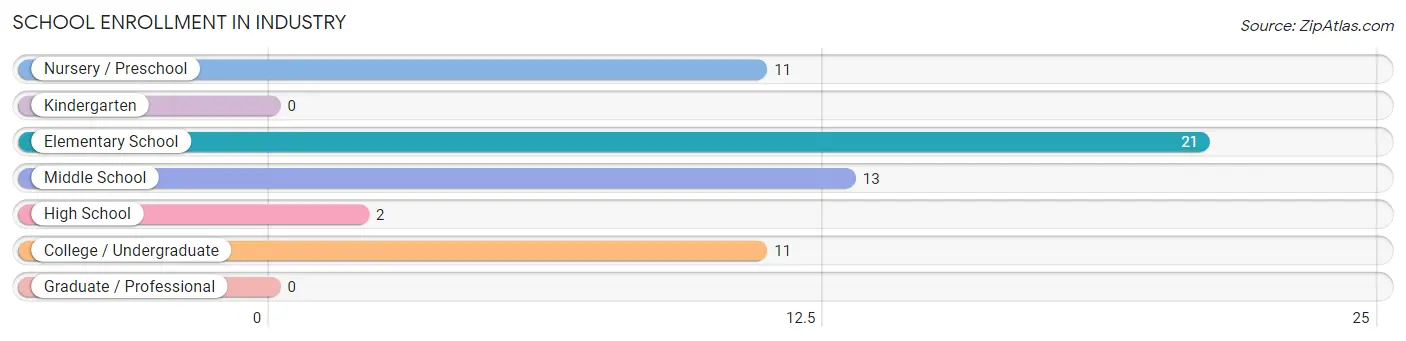
| School Level | # Students | % Students |
| Nursery / Preschool | 11 | 19.0% |
| Kindergarten | 0 | 0.0% |
| Elementary School | 21 | 36.2% |
| Middle School | 13 | 22.4% |
| High School | 2 | 3.5% |
| College / Undergraduate | 11 | 19.0% |
| Graduate / Professional | 0 | 0.0% |
| Total | 58 | 100.0% |
School Enrollment by Age by Funding Source in Industry
Out of a total of 58 students who are enrolled in schools in Industry, 12 (20.7%) attend a private institution, while the remaining 46 (79.3%) are enrolled in public schools. The age group of 20 to 24 year olds has the highest likelihood of being enrolled in private schools, with 2 (100.0% in the age bracket) enrolled. Conversely, the age group of 18 to 19 year olds has the lowest likelihood of being enrolled in a private school, with 2 (100.0% in the age bracket) attending a public institution.
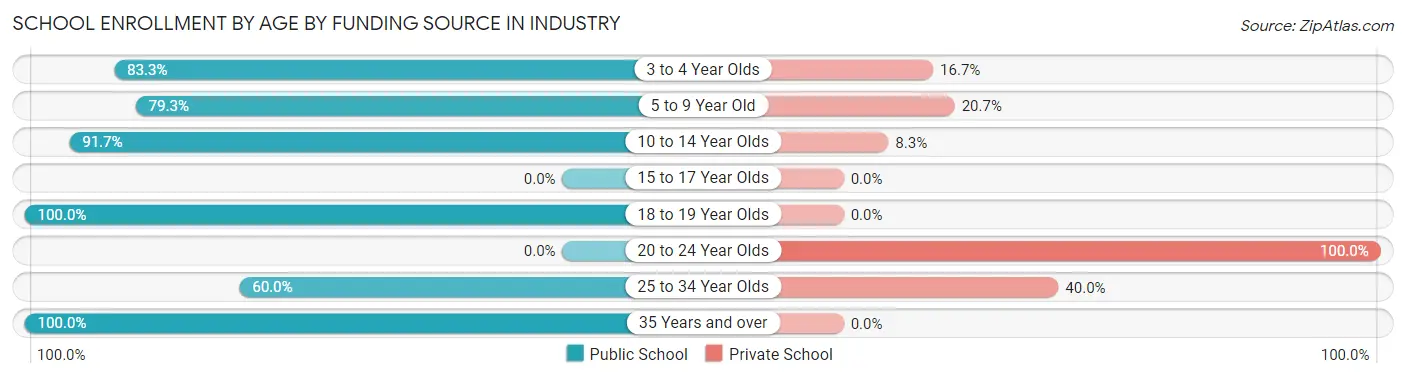
| Age Bracket | Public School | Private School |
| 3 to 4 Year Olds | 5 (83.3%) | 1 (16.7%) |
| 5 to 9 Year Old | 23 (79.3%) | 6 (20.7%) |
| 10 to 14 Year Olds | 11 (91.7%) | 1 (8.3%) |
| 15 to 17 Year Olds | 0 (0.0%) | 0 (0.0%) |
| 18 to 19 Year Olds | 2 (100.0%) | 0 (0.0%) |
| 20 to 24 Year Olds | 0 (0.0%) | 2 (100.0%) |
| 25 to 34 Year Olds | 3 (60.0%) | 2 (40.0%) |
| 35 Years and over | 2 (100.0%) | 0 (0.0%) |
| Total | 46 (79.3%) | 12 (20.7%) |
Educational Attainment by Field of Study in Industry
Visual & performing arts (10 | 37.0%), liberal arts & history (8 | 29.6%), business (7 | 25.9%), and bio, nature & agricultural (2 | 7.4%) are the most common fields of study among 27 individuals in Industry who have obtained a bachelor's degree or higher.
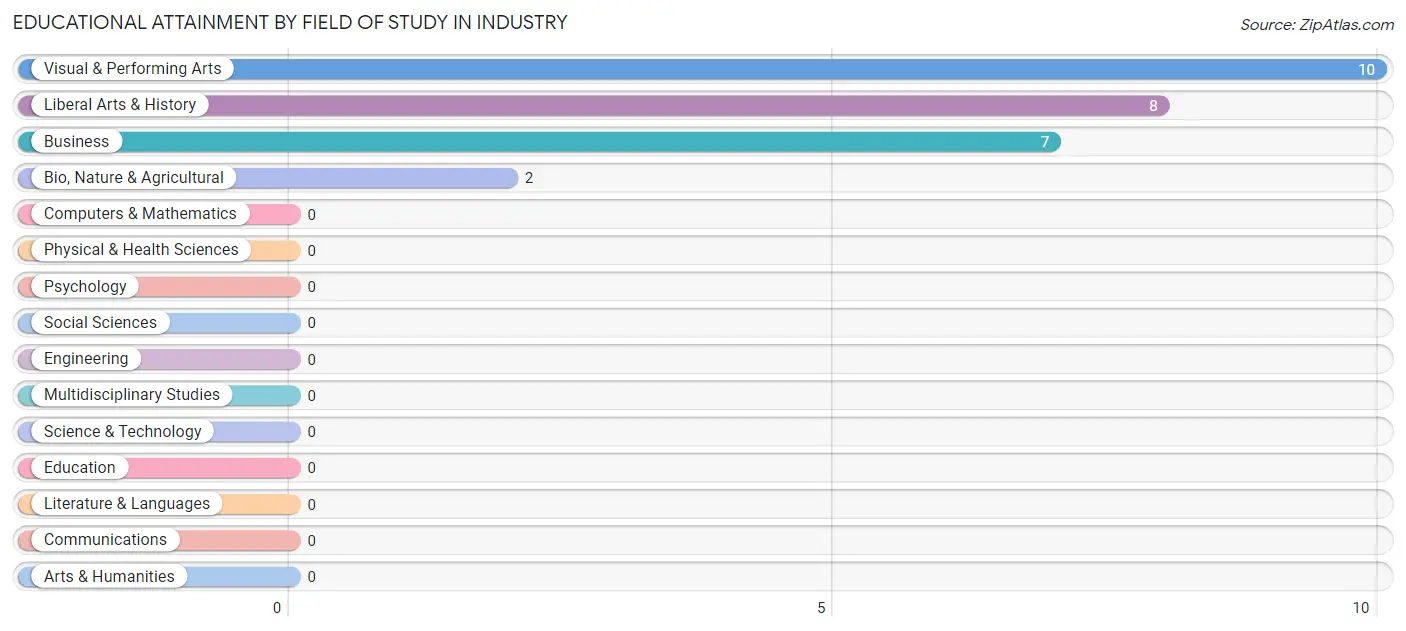
| Field of Study | # Graduates | % Graduates |
| Computers & Mathematics | 0 | 0.0% |
| Bio, Nature & Agricultural | 2 | 7.4% |
| Physical & Health Sciences | 0 | 0.0% |
| Psychology | 0 | 0.0% |
| Social Sciences | 0 | 0.0% |
| Engineering | 0 | 0.0% |
| Multidisciplinary Studies | 0 | 0.0% |
| Science & Technology | 0 | 0.0% |
| Business | 7 | 25.9% |
| Education | 0 | 0.0% |
| Literature & Languages | 0 | 0.0% |
| Liberal Arts & History | 8 | 29.6% |
| Visual & Performing Arts | 10 | 37.0% |
| Communications | 0 | 0.0% |
| Arts & Humanities | 0 | 0.0% |
| Total | 27 | 100.0% |
Transportation & Commute in Industry
Vehicle Availability by Sex in Industry
The most prevalent vehicle ownership categories in Industry are males with 2 vehicles (36, accounting for 64.3%) and females with 2 vehicles (17, making up 124.1%).
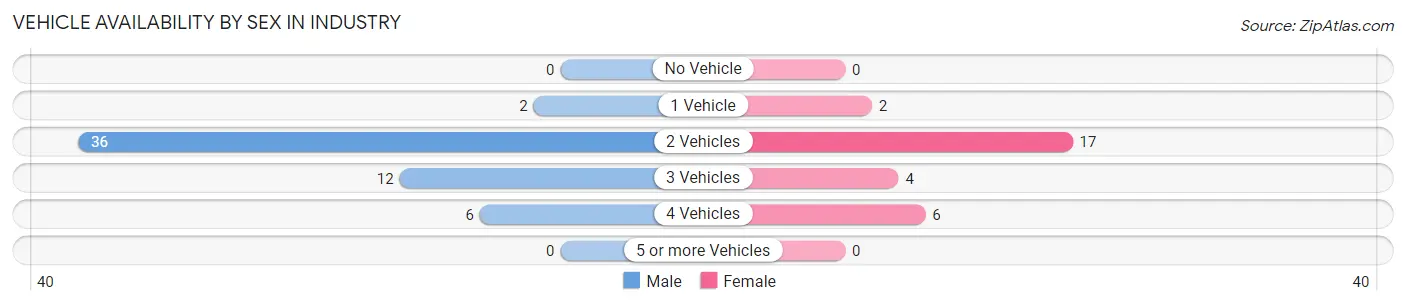
| Vehicles Available | Male | Female |
| No Vehicle | 0 (0.0%) | 0 (0.0%) |
| 1 Vehicle | 2 (3.6%) | 2 (6.9%) |
| 2 Vehicles | 36 (64.3%) | 17 (58.6%) |
| 3 Vehicles | 12 (21.4%) | 4 (13.8%) |
| 4 Vehicles | 6 (10.7%) | 6 (20.7%) |
| 5 or more Vehicles | 0 (0.0%) | 0 (0.0%) |
| Total | 56 (100.0%) | 29 (100.0%) |
Commute Time in Industry
The most frequently occuring commute durations in Industry are 20 to 24 minutes (19 commuters, 27.1%), 15 to 19 minutes (10 commuters, 14.3%), and 10 to 14 minutes (8 commuters, 11.4%).
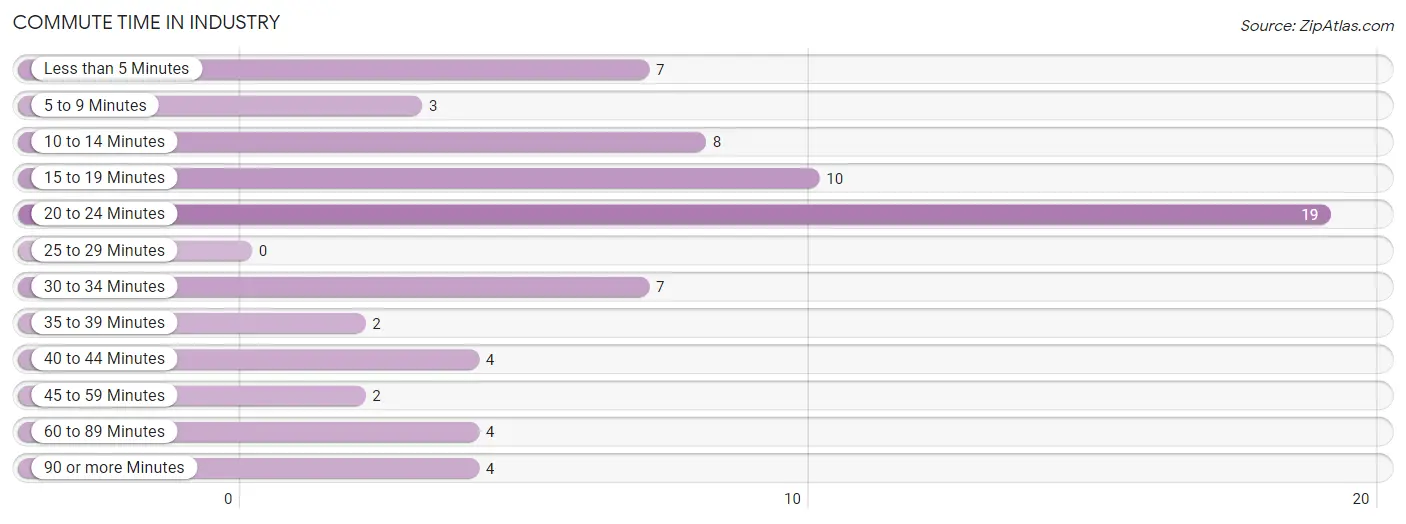
| Commute Time | # Commuters | % Commuters |
| Less than 5 Minutes | 7 | 10.0% |
| 5 to 9 Minutes | 3 | 4.3% |
| 10 to 14 Minutes | 8 | 11.4% |
| 15 to 19 Minutes | 10 | 14.3% |
| 20 to 24 Minutes | 19 | 27.1% |
| 25 to 29 Minutes | 0 | 0.0% |
| 30 to 34 Minutes | 7 | 10.0% |
| 35 to 39 Minutes | 2 | 2.9% |
| 40 to 44 Minutes | 4 | 5.7% |
| 45 to 59 Minutes | 2 | 2.9% |
| 60 to 89 Minutes | 4 | 5.7% |
| 90 or more Minutes | 4 | 5.7% |
Commute Time by Sex in Industry
The most common commute times in Industry are 20 to 24 minutes (19 commuters, 38.8%) for males and 10 to 14 minutes (4 commuters, 19.1%) for females.
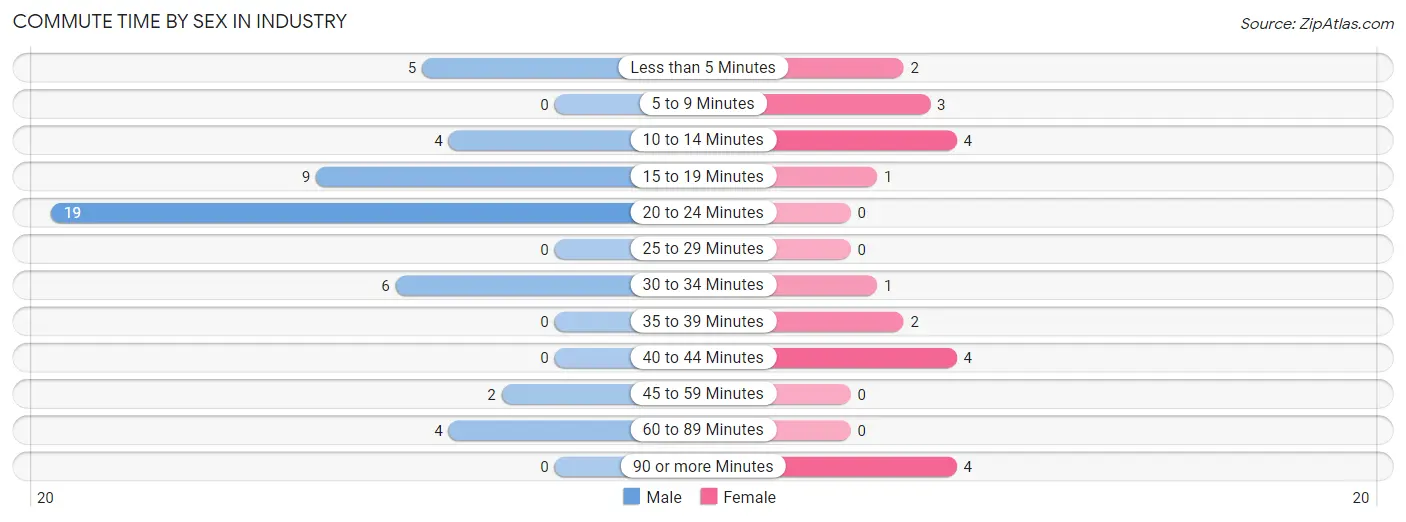
| Commute Time | Male | Female |
| Less than 5 Minutes | 5 (10.2%) | 2 (9.5%) |
| 5 to 9 Minutes | 0 (0.0%) | 3 (14.3%) |
| 10 to 14 Minutes | 4 (8.2%) | 4 (19.1%) |
| 15 to 19 Minutes | 9 (18.4%) | 1 (4.8%) |
| 20 to 24 Minutes | 19 (38.8%) | 0 (0.0%) |
| 25 to 29 Minutes | 0 (0.0%) | 0 (0.0%) |
| 30 to 34 Minutes | 6 (12.2%) | 1 (4.8%) |
| 35 to 39 Minutes | 0 (0.0%) | 2 (9.5%) |
| 40 to 44 Minutes | 0 (0.0%) | 4 (19.1%) |
| 45 to 59 Minutes | 2 (4.1%) | 0 (0.0%) |
| 60 to 89 Minutes | 4 (8.2%) | 0 (0.0%) |
| 90 or more Minutes | 0 (0.0%) | 4 (19.1%) |
Time of Departure to Work by Sex in Industry
The most frequent times of departure to work in Industry are 8:00 AM to 8:29 AM (18, 36.7%) for males and 8:00 AM to 8:29 AM (7, 33.3%) for females.
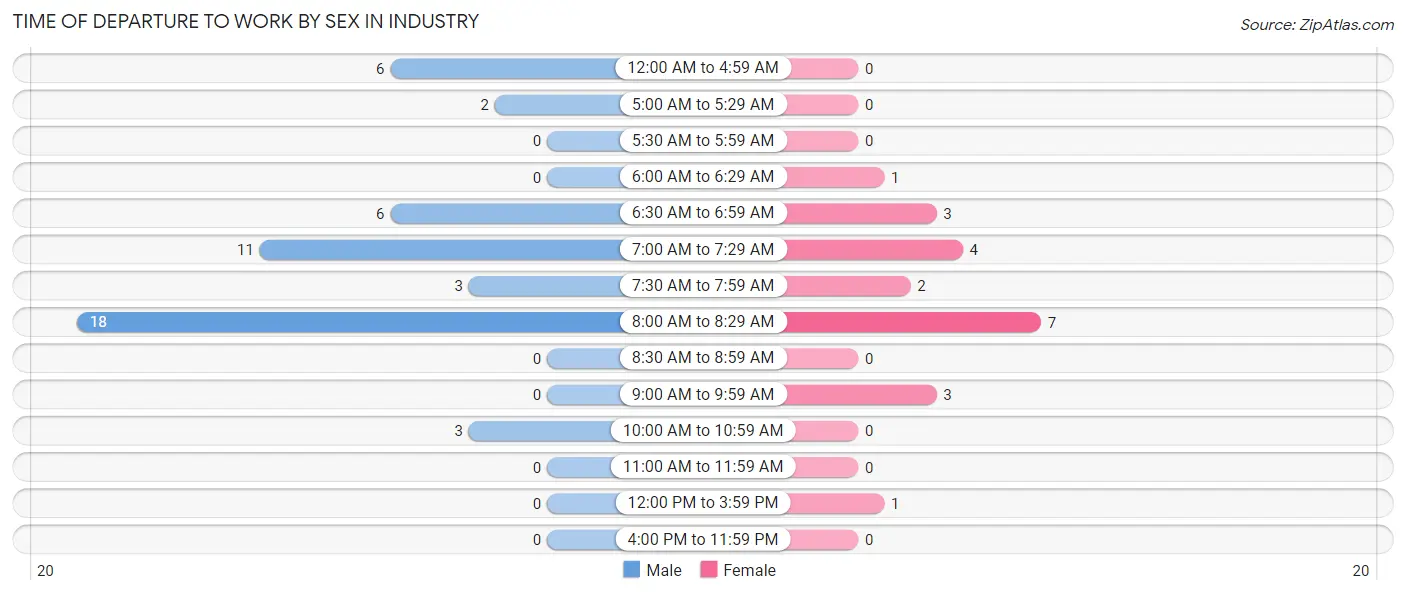
| Time of Departure | Male | Female |
| 12:00 AM to 4:59 AM | 6 (12.2%) | 0 (0.0%) |
| 5:00 AM to 5:29 AM | 2 (4.1%) | 0 (0.0%) |
| 5:30 AM to 5:59 AM | 0 (0.0%) | 0 (0.0%) |
| 6:00 AM to 6:29 AM | 0 (0.0%) | 1 (4.8%) |
| 6:30 AM to 6:59 AM | 6 (12.2%) | 3 (14.3%) |
| 7:00 AM to 7:29 AM | 11 (22.5%) | 4 (19.1%) |
| 7:30 AM to 7:59 AM | 3 (6.1%) | 2 (9.5%) |
| 8:00 AM to 8:29 AM | 18 (36.7%) | 7 (33.3%) |
| 8:30 AM to 8:59 AM | 0 (0.0%) | 0 (0.0%) |
| 9:00 AM to 9:59 AM | 0 (0.0%) | 3 (14.3%) |
| 10:00 AM to 10:59 AM | 3 (6.1%) | 0 (0.0%) |
| 11:00 AM to 11:59 AM | 0 (0.0%) | 0 (0.0%) |
| 12:00 PM to 3:59 PM | 0 (0.0%) | 1 (4.8%) |
| 4:00 PM to 11:59 PM | 0 (0.0%) | 0 (0.0%) |
| Total | 49 (100.0%) | 21 (100.0%) |
Housing Occupancy in Industry
Occupancy by Ownership in Industry
Of the total 50 dwellings in Industry, owner-occupied units account for 5 (10.0%), while renter-occupied units make up 45 (90.0%).
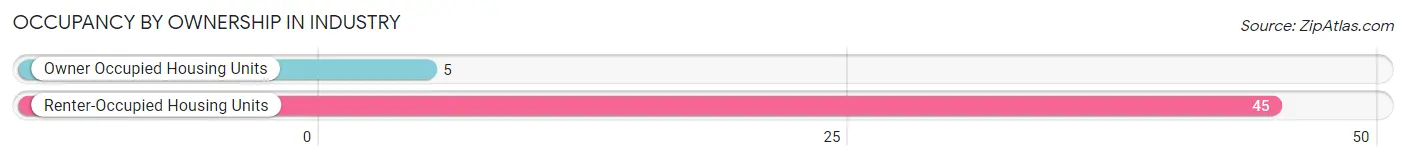
| Occupancy | # Housing Units | % Housing Units |
| Owner Occupied Housing Units | 5 | 10.0% |
| Renter-Occupied Housing Units | 45 | 90.0% |
| Total Occupied Housing Units | 50 | 100.0% |
Occupancy by Household Size in Industry
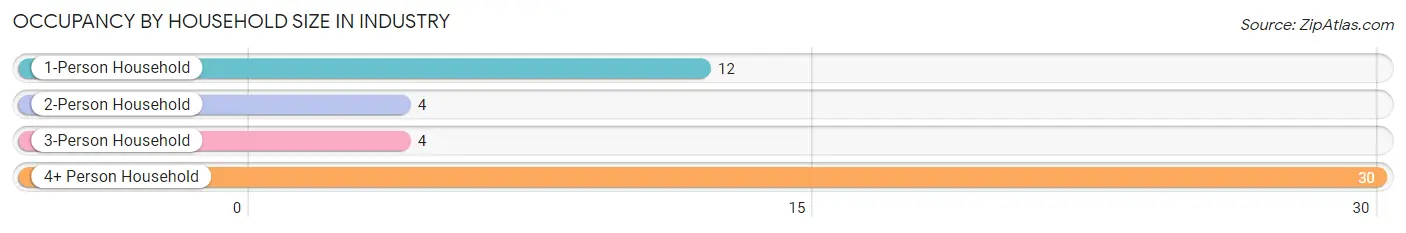
| Household Size | # Housing Units | % Housing Units |
| 1-Person Household | 12 | 24.0% |
| 2-Person Household | 4 | 8.0% |
| 3-Person Household | 4 | 8.0% |
| 4+ Person Household | 30 | 60.0% |
| Total Housing Units | 50 | 100.0% |
Occupancy by Ownership by Household Size in Industry
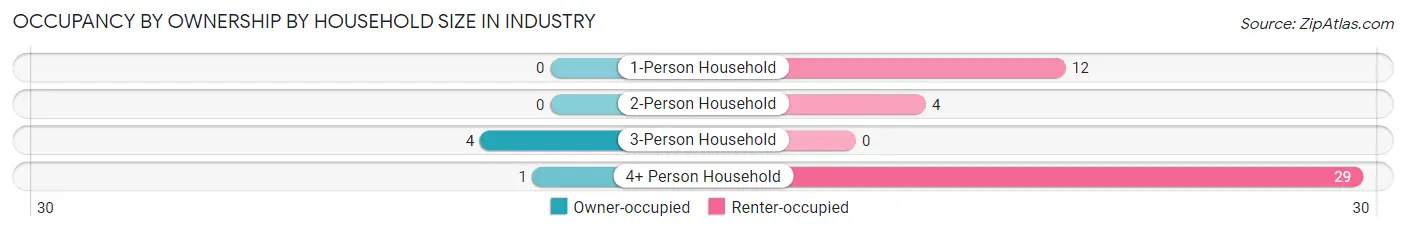
| Household Size | Owner-occupied | Renter-occupied |
| 1-Person Household | 0 (0.0%) | 12 (100.0%) |
| 2-Person Household | 0 (0.0%) | 4 (100.0%) |
| 3-Person Household | 4 (100.0%) | 0 (0.0%) |
| 4+ Person Household | 1 (3.3%) | 29 (96.7%) |
| Total Housing Units | 5 (10.0%) | 45 (90.0%) |
Occupancy by Educational Attainment in Industry
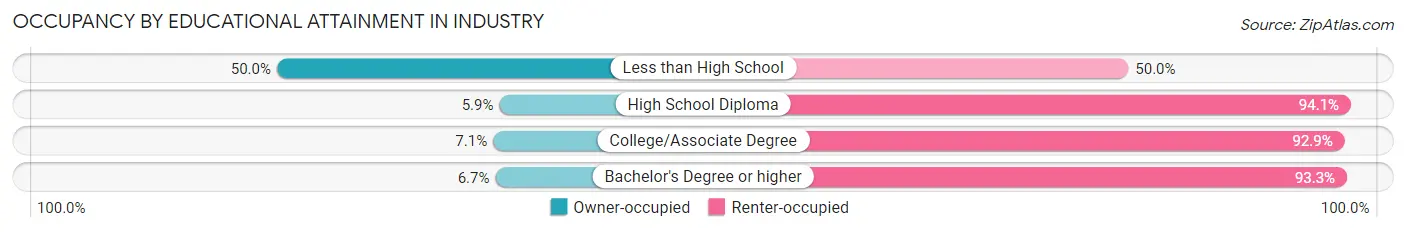
| Household Size | Owner-occupied | Renter-occupied |
| Less than High School | 2 (50.0%) | 2 (50.0%) |
| High School Diploma | 1 (5.9%) | 16 (94.1%) |
| College/Associate Degree | 1 (7.1%) | 13 (92.9%) |
| Bachelor's Degree or higher | 1 (6.7%) | 14 (93.3%) |
Occupancy by Age of Householder in Industry
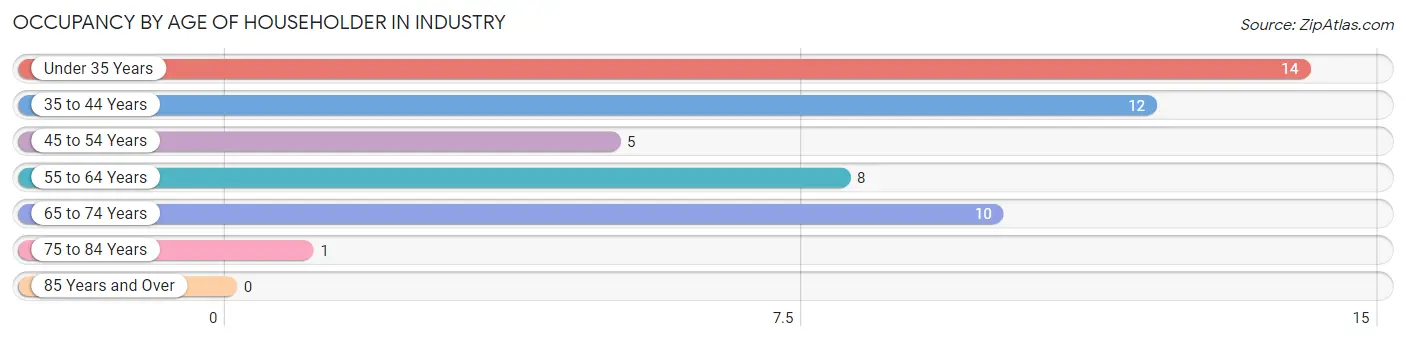
| Age Bracket | # Households | % Households |
| Under 35 Years | 14 | 28.0% |
| 35 to 44 Years | 12 | 24.0% |
| 45 to 54 Years | 5 | 10.0% |
| 55 to 64 Years | 8 | 16.0% |
| 65 to 74 Years | 10 | 20.0% |
| 75 to 84 Years | 1 | 2.0% |
| 85 Years and Over | 0 | 0.0% |
| Total | 50 | 100.0% |
Housing Finances in Industry
Median Income by Occupancy in Industry
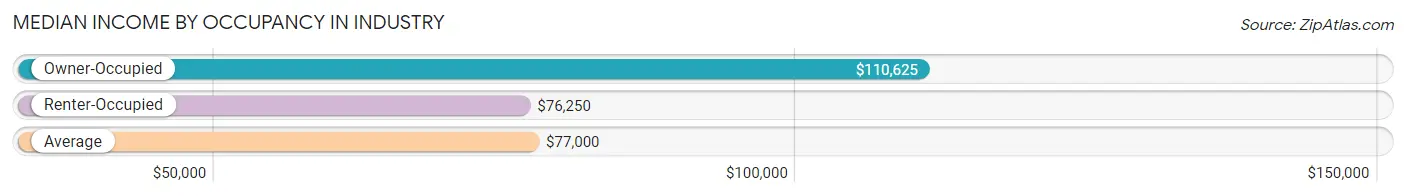
| Occupancy Type | # Households | Median Income |
| Owner-Occupied | 5 (10.0%) | $110,625 |
| Renter-Occupied | 45 (90.0%) | $76,250 |
| Average | 50 (100.0%) | $77,000 |
Occupancy by Householder Income Bracket in Industry
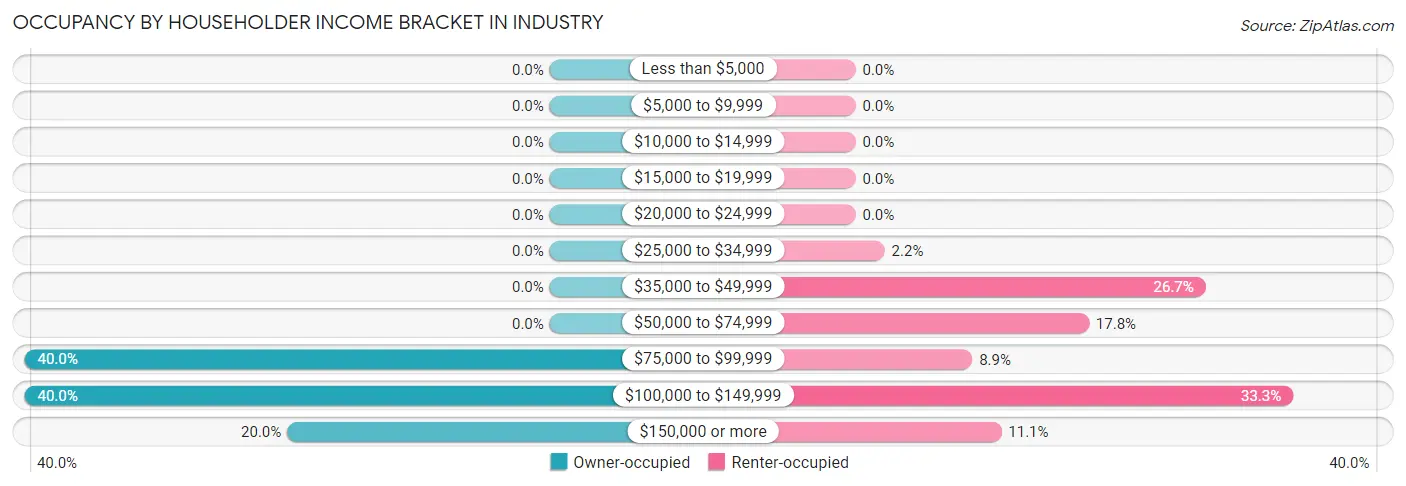
| Income Bracket | Owner-occupied | Renter-occupied |
| Less than $5,000 | 0 (0.0%) | 0 (0.0%) |
| $5,000 to $9,999 | 0 (0.0%) | 0 (0.0%) |
| $10,000 to $14,999 | 0 (0.0%) | 0 (0.0%) |
| $15,000 to $19,999 | 0 (0.0%) | 0 (0.0%) |
| $20,000 to $24,999 | 0 (0.0%) | 0 (0.0%) |
| $25,000 to $34,999 | 0 (0.0%) | 1 (2.2%) |
| $35,000 to $49,999 | 0 (0.0%) | 12 (26.7%) |
| $50,000 to $74,999 | 0 (0.0%) | 8 (17.8%) |
| $75,000 to $99,999 | 2 (40.0%) | 4 (8.9%) |
| $100,000 to $149,999 | 2 (40.0%) | 15 (33.3%) |
| $150,000 or more | 1 (20.0%) | 5 (11.1%) |
| Total | 5 (100.0%) | 45 (100.0%) |
Monthly Housing Cost Tiers in Industry
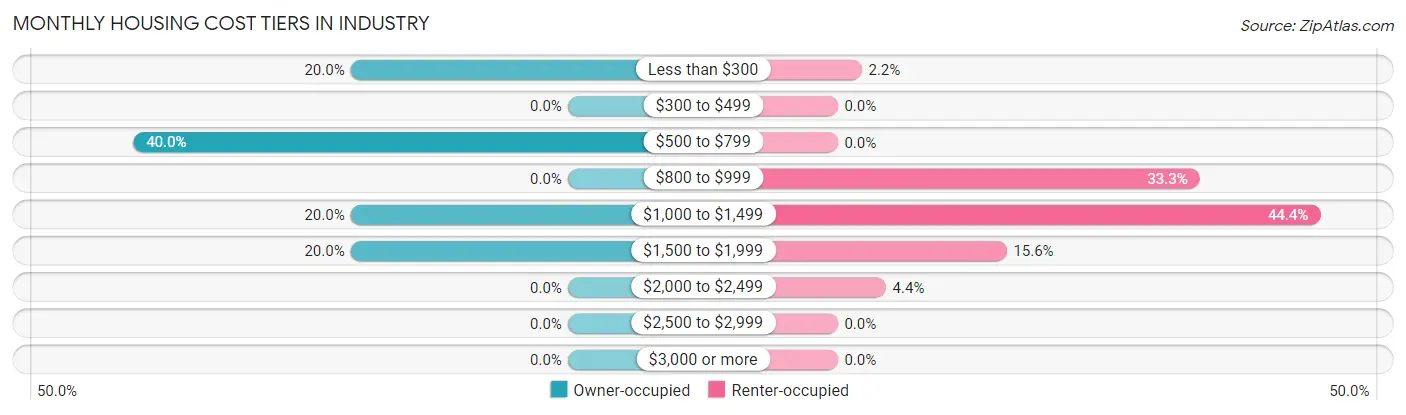
| Monthly Cost | Owner-occupied | Renter-occupied |
| Less than $300 | 1 (20.0%) | 1 (2.2%) |
| $300 to $499 | 0 (0.0%) | 0 (0.0%) |
| $500 to $799 | 2 (40.0%) | 0 (0.0%) |
| $800 to $999 | 0 (0.0%) | 15 (33.3%) |
| $1,000 to $1,499 | 1 (20.0%) | 20 (44.4%) |
| $1,500 to $1,999 | 1 (20.0%) | 7 (15.6%) |
| $2,000 to $2,499 | 0 (0.0%) | 2 (4.4%) |
| $2,500 to $2,999 | 0 (0.0%) | 0 (0.0%) |
| $3,000 or more | 0 (0.0%) | 0 (0.0%) |
| Total | 5 (100.0%) | 45 (100.0%) |
Physical Housing Characteristics in Industry
Housing Structures in Industry
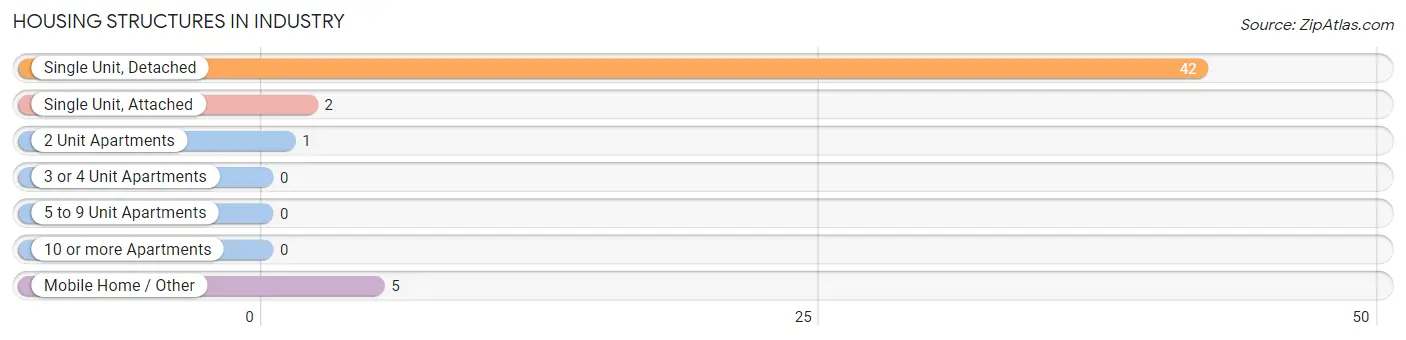
| Structure Type | # Housing Units | % Housing Units |
| Single Unit, Detached | 42 | 84.0% |
| Single Unit, Attached | 2 | 4.0% |
| 2 Unit Apartments | 1 | 2.0% |
| 3 or 4 Unit Apartments | 0 | 0.0% |
| 5 to 9 Unit Apartments | 0 | 0.0% |
| 10 or more Apartments | 0 | 0.0% |
| Mobile Home / Other | 5 | 10.0% |
| Total | 50 | 100.0% |
Housing Structures by Occupancy in Industry
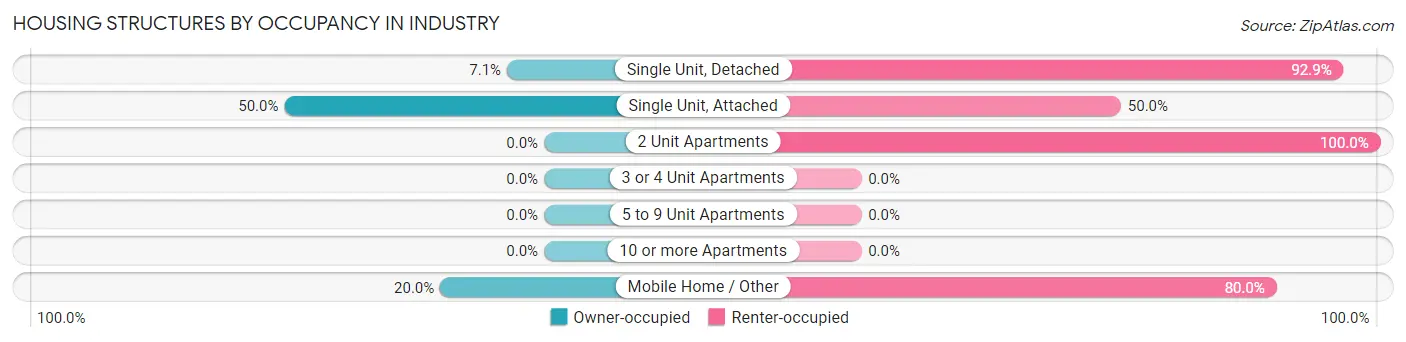
| Structure Type | Owner-occupied | Renter-occupied |
| Single Unit, Detached | 3 (7.1%) | 39 (92.9%) |
| Single Unit, Attached | 1 (50.0%) | 1 (50.0%) |
| 2 Unit Apartments | 0 (0.0%) | 1 (100.0%) |
| 3 or 4 Unit Apartments | 0 (0.0%) | 0 (0.0%) |
| 5 to 9 Unit Apartments | 0 (0.0%) | 0 (0.0%) |
| 10 or more Apartments | 0 (0.0%) | 0 (0.0%) |
| Mobile Home / Other | 1 (20.0%) | 4 (80.0%) |
| Total | 5 (10.0%) | 45 (90.0%) |
Housing Structures by Number of Rooms in Industry
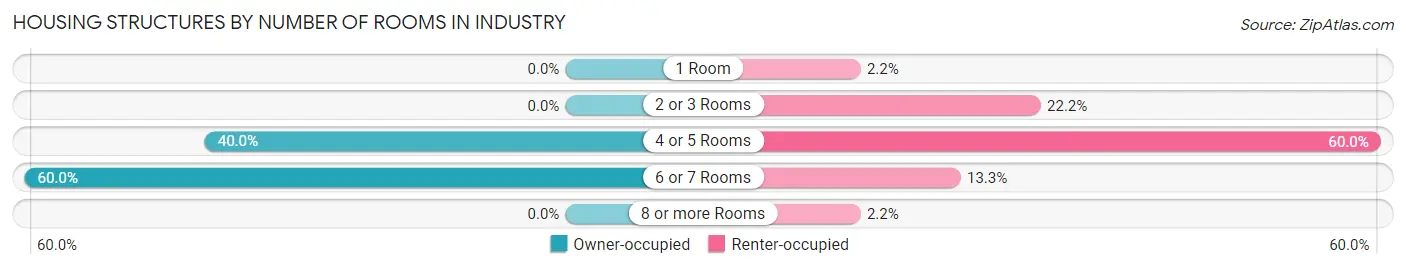
| Number of Rooms | Owner-occupied | Renter-occupied |
| 1 Room | 0 (0.0%) | 1 (2.2%) |
| 2 or 3 Rooms | 0 (0.0%) | 10 (22.2%) |
| 4 or 5 Rooms | 2 (40.0%) | 27 (60.0%) |
| 6 or 7 Rooms | 3 (60.0%) | 6 (13.3%) |
| 8 or more Rooms | 0 (0.0%) | 1 (2.2%) |
| Total | 5 (100.0%) | 45 (100.0%) |
Housing Structure by Heating Type in Industry
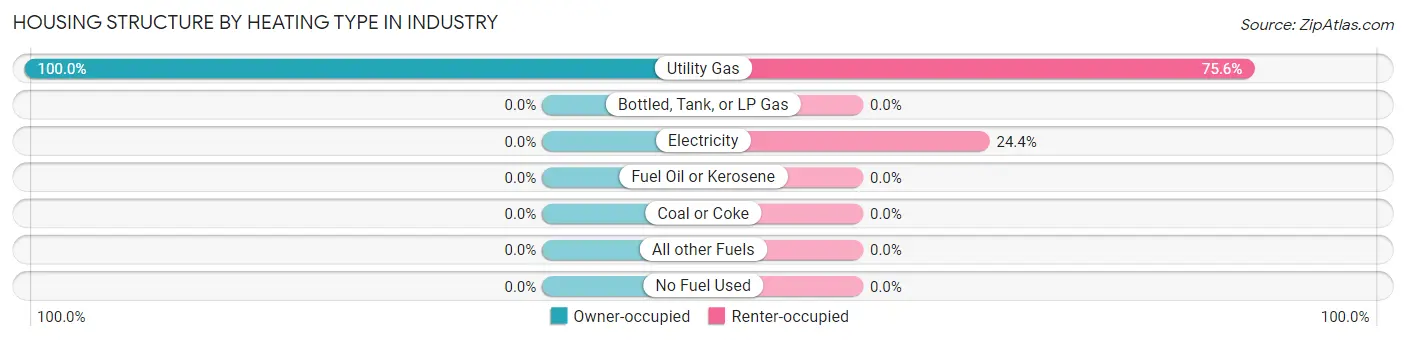
| Heating Type | Owner-occupied | Renter-occupied |
| Utility Gas | 5 (100.0%) | 34 (75.6%) |
| Bottled, Tank, or LP Gas | 0 (0.0%) | 0 (0.0%) |
| Electricity | 0 (0.0%) | 11 (24.4%) |
| Fuel Oil or Kerosene | 0 (0.0%) | 0 (0.0%) |
| Coal or Coke | 0 (0.0%) | 0 (0.0%) |
| All other Fuels | 0 (0.0%) | 0 (0.0%) |
| No Fuel Used | 0 (0.0%) | 0 (0.0%) |
| Total | 5 (100.0%) | 45 (100.0%) |
Household Vehicle Usage in Industry
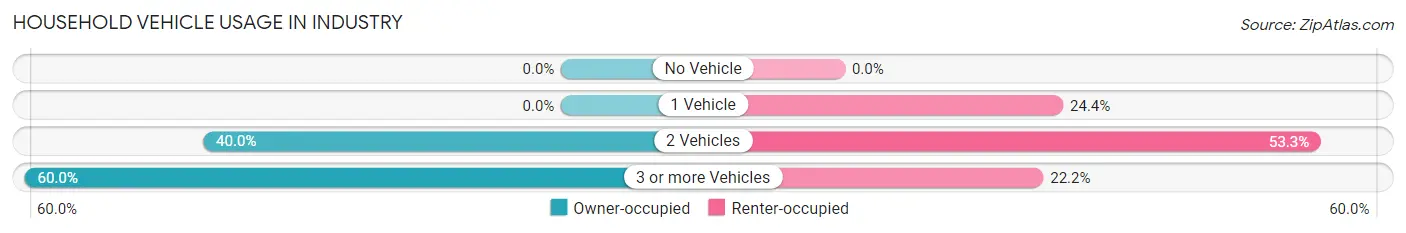
| Vehicles per Household | Owner-occupied | Renter-occupied |
| No Vehicle | 0 (0.0%) | 0 (0.0%) |
| 1 Vehicle | 0 (0.0%) | 11 (24.4%) |
| 2 Vehicles | 2 (40.0%) | 24 (53.3%) |
| 3 or more Vehicles | 3 (60.0%) | 10 (22.2%) |
| Total | 5 (100.0%) | 45 (100.0%) |
Real Estate & Mortgages in Industry
Real Estate and Mortgage Overview in Industry
| Characteristic | Without Mortgage | With Mortgage |
| Housing Units | 5 | 0 |
| Median Property Value | $687,500 | $0 |
| Median Household Income | $110,625 | $0 |
| Monthly Housing Costs | - | - |
| Real Estate Taxes | - | - |
Property Value by Mortgage Status in Industry
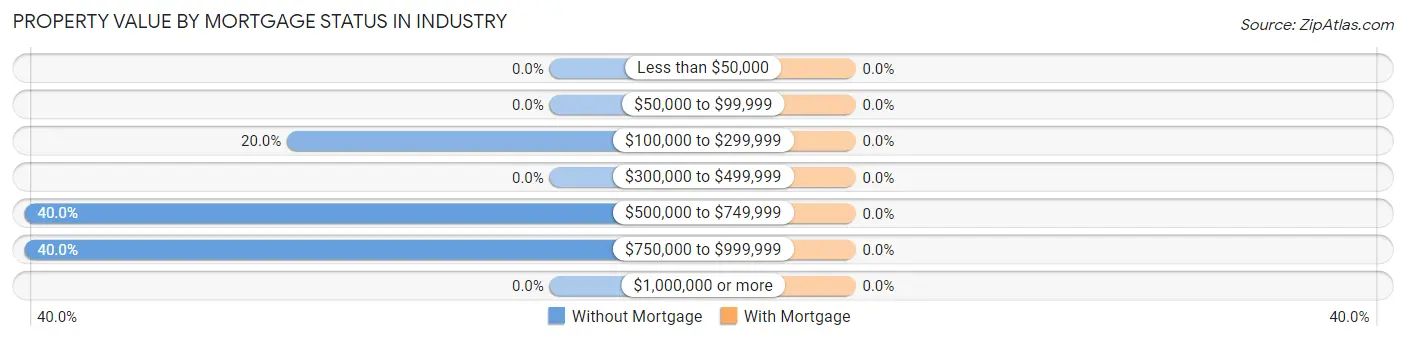
| Property Value | Without Mortgage | With Mortgage |
| Less than $50,000 | 0 (0.0%) | 0 (0.0%) |
| $50,000 to $99,999 | 0 (0.0%) | 0 (0.0%) |
| $100,000 to $299,999 | 1 (20.0%) | 0 (0.0%) |
| $300,000 to $499,999 | 0 (0.0%) | 0 (0.0%) |
| $500,000 to $749,999 | 2 (40.0%) | 0 (0.0%) |
| $750,000 to $999,999 | 2 (40.0%) | 0 (0.0%) |
| $1,000,000 or more | 0 (0.0%) | 0 (0.0%) |
| Total | 5 (100.0%) | 0 (0.0%) |
Household Income by Mortgage Status in Industry
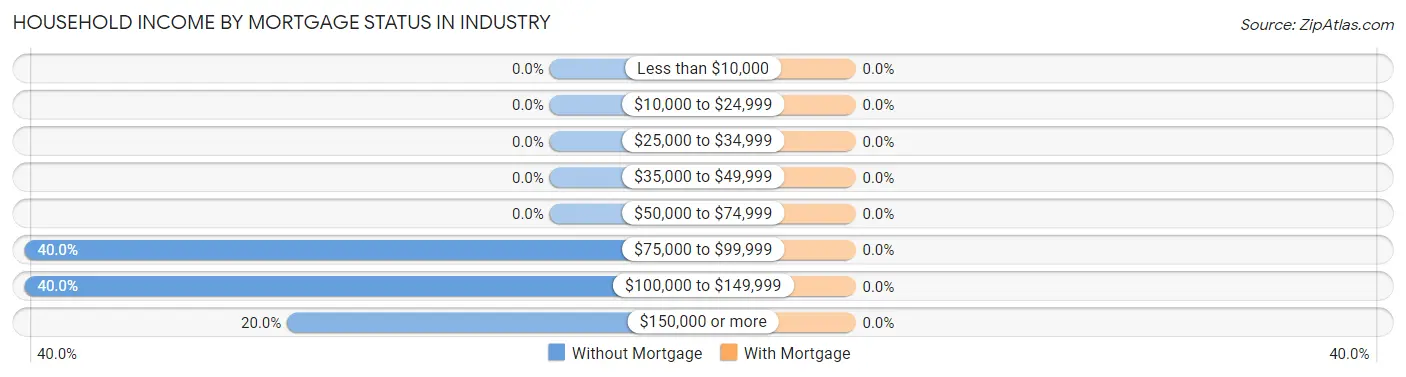
| Household Income | Without Mortgage | With Mortgage |
| Less than $10,000 | 0 (0.0%) | 0 (0.0%) |
| $10,000 to $24,999 | 0 (0.0%) | 0 (0.0%) |
| $25,000 to $34,999 | 0 (0.0%) | 0 (0.0%) |
| $35,000 to $49,999 | 0 (0.0%) | 0 (0.0%) |
| $50,000 to $74,999 | 0 (0.0%) | 0 (0.0%) |
| $75,000 to $99,999 | 2 (40.0%) | 0 (0.0%) |
| $100,000 to $149,999 | 2 (40.0%) | 0 (0.0%) |
| $150,000 or more | 1 (20.0%) | 0 (0.0%) |
| Total | 5 (100.0%) | 0 (0.0%) |
Property Value to Household Income Ratio in Industry
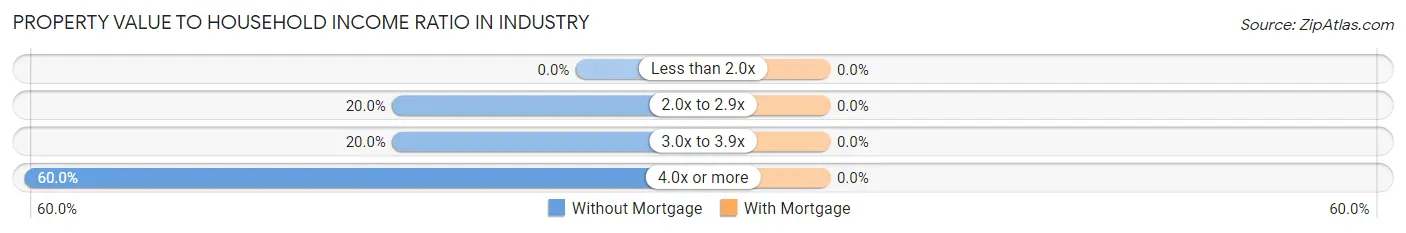
| Value-to-Income Ratio | Without Mortgage | With Mortgage |
| Less than 2.0x | 0 (0.0%) | 0 (0.0%) |
| 2.0x to 2.9x | 1 (20.0%) | 0 (0.0%) |
| 3.0x to 3.9x | 1 (20.0%) | 0 (0.0%) |
| 4.0x or more | 3 (60.0%) | 0 (0.0%) |
| Total | 5 (100.0%) | 0 (0.0%) |
Real Estate Taxes by Mortgage Status in Industry
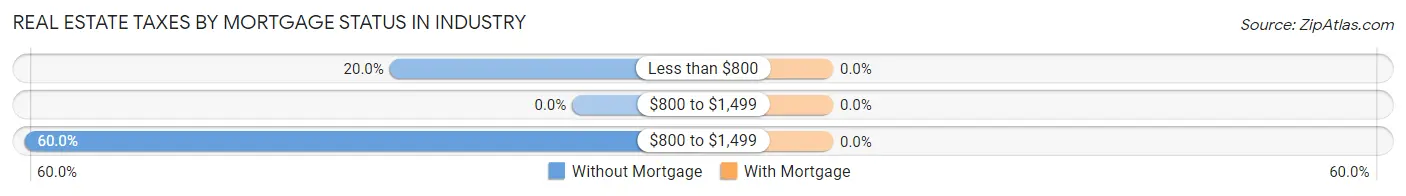
| Property Taxes | Without Mortgage | With Mortgage |
| Less than $800 | 1 (20.0%) | 0 (0.0%) |
| $800 to $1,499 | 0 (0.0%) | 0 (0.0%) |
| $800 to $1,499 | 3 (60.0%) | 0 (0.0%) |
| Total | 5 (100.0%) | 0 (0.0%) |
Health & Disability in Industry
Health Insurance Coverage by Age in Industry
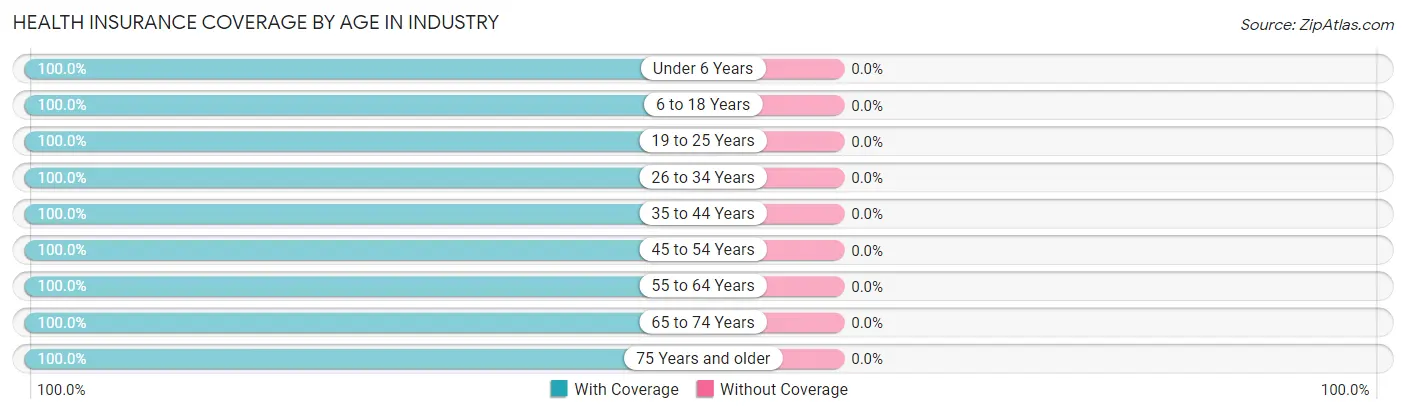
| Age Bracket | With Coverage | Without Coverage |
| Under 6 Years | 38 (100.0%) | 0 (0.0%) |
| 6 to 18 Years | 38 (100.0%) | 0 (0.0%) |
| 19 to 25 Years | 18 (100.0%) | 0 (0.0%) |
| 26 to 34 Years | 26 (100.0%) | 0 (0.0%) |
| 35 to 44 Years | 30 (100.0%) | 0 (0.0%) |
| 45 to 54 Years | 14 (100.0%) | 0 (0.0%) |
| 55 to 64 Years | 9 (100.0%) | 0 (0.0%) |
| 65 to 74 Years | 23 (100.0%) | 0 (0.0%) |
| 75 Years and older | 1 (100.0%) | 0 (0.0%) |
| Total | 197 (100.0%) | 0 (0.0%) |
Health Insurance Coverage by Citizenship Status in Industry
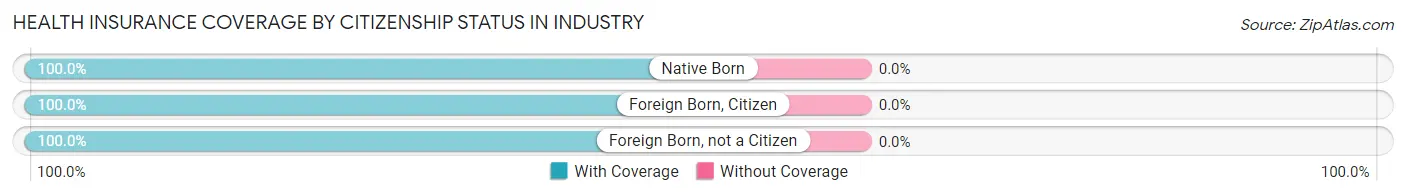
| Citizenship Status | With Coverage | Without Coverage |
| Native Born | 38 (100.0%) | 0 (0.0%) |
| Foreign Born, Citizen | 38 (100.0%) | 0 (0.0%) |
| Foreign Born, not a Citizen | 18 (100.0%) | 0 (0.0%) |
Health Insurance Coverage by Household Income in Industry
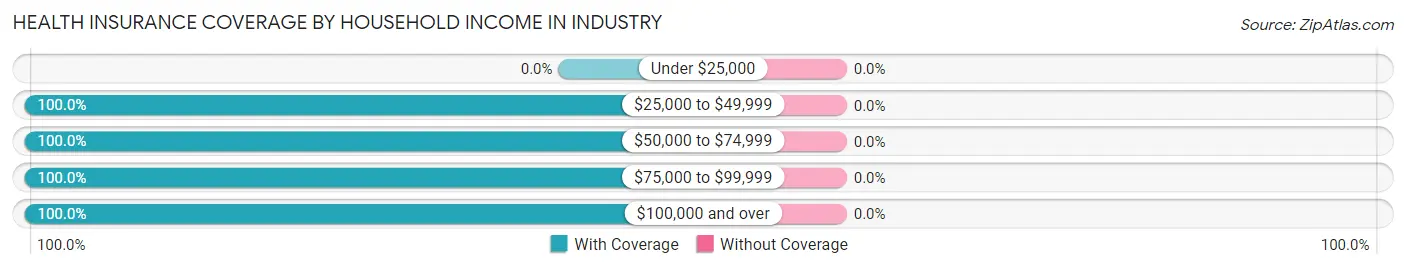
| Household Income | With Coverage | Without Coverage |
| Under $25,000 | 0 (0.0%) | 0 (0.0%) |
| $25,000 to $49,999 | 21 (100.0%) | 0 (0.0%) |
| $50,000 to $74,999 | 26 (100.0%) | 0 (0.0%) |
| $75,000 to $99,999 | 24 (100.0%) | 0 (0.0%) |
| $100,000 and over | 109 (100.0%) | 0 (0.0%) |
Public vs Private Health Insurance Coverage by Age in Industry
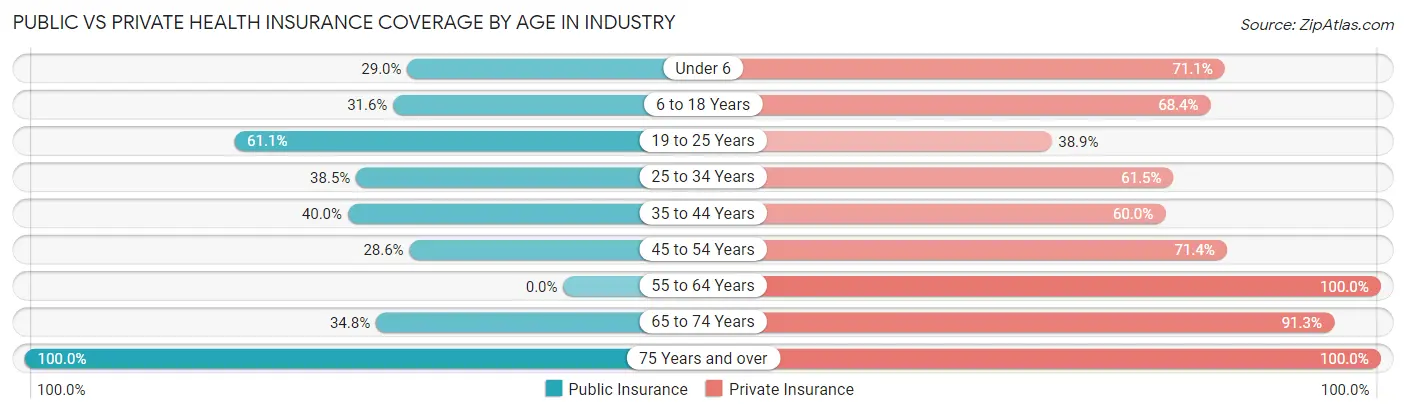
| Age Bracket | Public Insurance | Private Insurance |
| Under 6 | 11 (28.9%) | 27 (71.1%) |
| 6 to 18 Years | 12 (31.6%) | 26 (68.4%) |
| 19 to 25 Years | 11 (61.1%) | 7 (38.9%) |
| 25 to 34 Years | 10 (38.5%) | 16 (61.5%) |
| 35 to 44 Years | 12 (40.0%) | 18 (60.0%) |
| 45 to 54 Years | 4 (28.6%) | 10 (71.4%) |
| 55 to 64 Years | 0 (0.0%) | 9 (100.0%) |
| 65 to 74 Years | 8 (34.8%) | 21 (91.3%) |
| 75 Years and over | 1 (100.0%) | 1 (100.0%) |
| Total | 69 (35.0%) | 135 (68.5%) |
Disability Status by Sex by Age in Industry
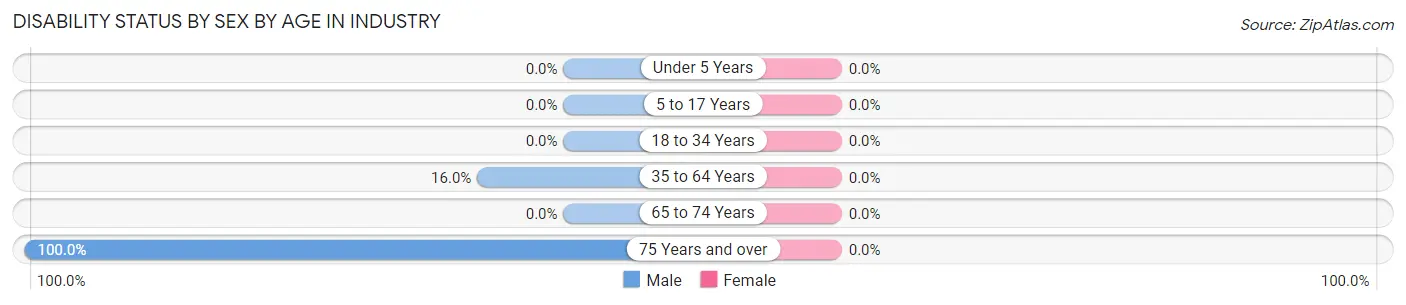
| Age Bracket | Male | Female |
| Under 5 Years | 0 (0.0%) | 0 (0.0%) |
| 5 to 17 Years | 0 (0.0%) | 0 (0.0%) |
| 18 to 34 Years | 0 (0.0%) | 0 (0.0%) |
| 35 to 64 Years | 4 (16.0%) | 0 (0.0%) |
| 65 to 74 Years | 0 (0.0%) | 0 (0.0%) |
| 75 Years and over | 1 (100.0%) | 0 (0.0%) |
Disability Class by Sex by Age in Industry
Disability Class: Hearing Difficulty
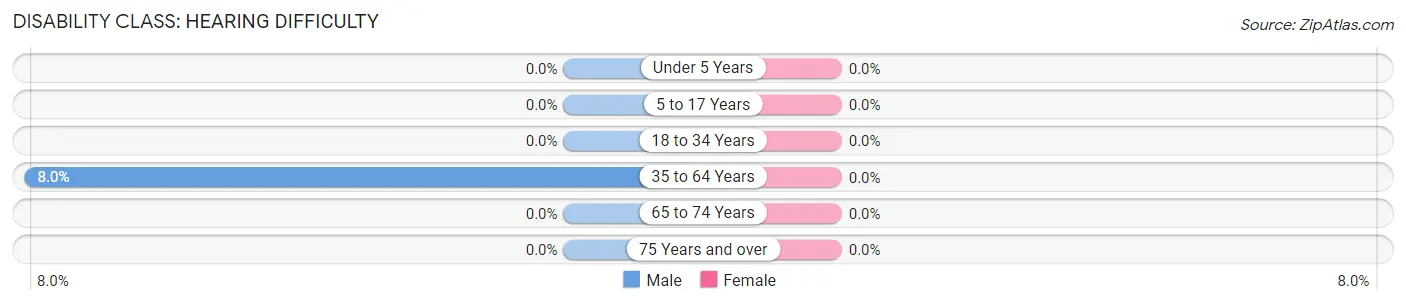
| Age Bracket | Male | Female |
| Under 5 Years | 0 (0.0%) | 0 (0.0%) |
| 5 to 17 Years | 0 (0.0%) | 0 (0.0%) |
| 18 to 34 Years | 0 (0.0%) | 0 (0.0%) |
| 35 to 64 Years | 2 (8.0%) | 0 (0.0%) |
| 65 to 74 Years | 0 (0.0%) | 0 (0.0%) |
| 75 Years and over | 0 (0.0%) | 0 (0.0%) |
Disability Class: Vision Difficulty

| Age Bracket | Male | Female |
| Under 5 Years | 0 (0.0%) | 0 (0.0%) |
| 5 to 17 Years | 0 (0.0%) | 0 (0.0%) |
| 18 to 34 Years | 0 (0.0%) | 0 (0.0%) |
| 35 to 64 Years | 0 (0.0%) | 0 (0.0%) |
| 65 to 74 Years | 0 (0.0%) | 0 (0.0%) |
| 75 Years and over | 1 (100.0%) | 0 (0.0%) |
Disability Class: Cognitive Difficulty
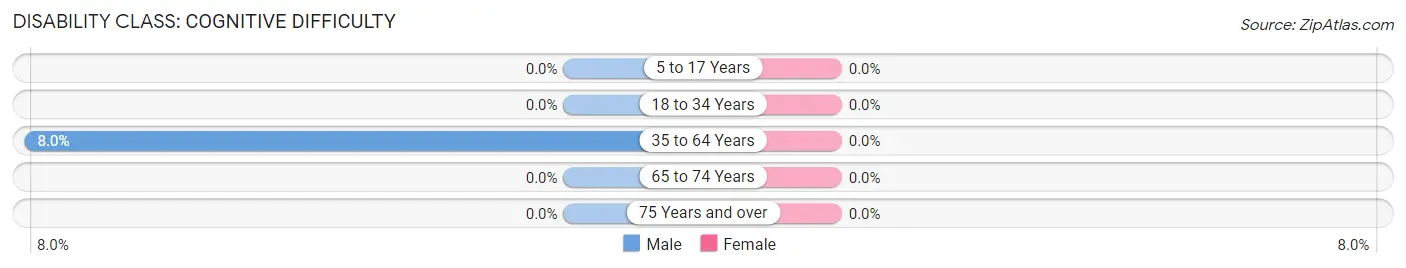
| Age Bracket | Male | Female |
| 5 to 17 Years | 0 (0.0%) | 0 (0.0%) |
| 18 to 34 Years | 0 (0.0%) | 0 (0.0%) |
| 35 to 64 Years | 2 (8.0%) | 0 (0.0%) |
| 65 to 74 Years | 0 (0.0%) | 0 (0.0%) |
| 75 Years and over | 0 (0.0%) | 0 (0.0%) |
Disability Class: Ambulatory Difficulty
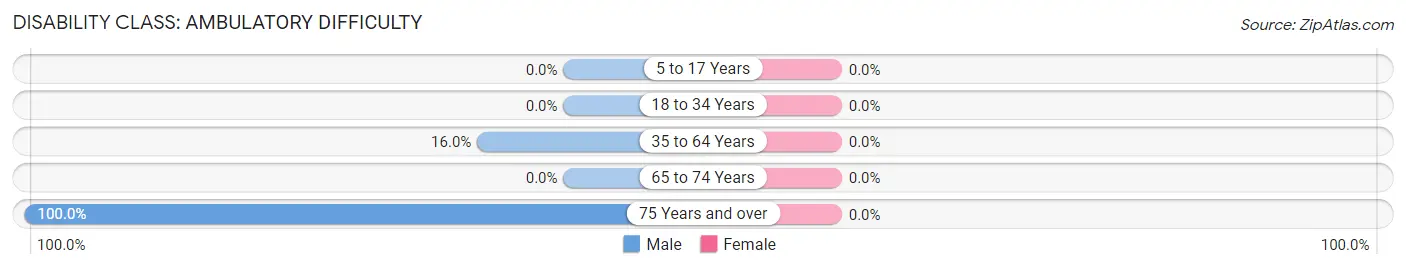
| Age Bracket | Male | Female |
| 5 to 17 Years | 0 (0.0%) | 0 (0.0%) |
| 18 to 34 Years | 0 (0.0%) | 0 (0.0%) |
| 35 to 64 Years | 4 (16.0%) | 0 (0.0%) |
| 65 to 74 Years | 0 (0.0%) | 0 (0.0%) |
| 75 Years and over | 1 (100.0%) | 0 (0.0%) |
Disability Class: Self-Care Difficulty

| Age Bracket | Male | Female |
| 5 to 17 Years | 0 (0.0%) | 0 (0.0%) |
| 18 to 34 Years | 0 (0.0%) | 0 (0.0%) |
| 35 to 64 Years | 2 (8.0%) | 0 (0.0%) |
| 65 to 74 Years | 0 (0.0%) | 0 (0.0%) |
| 75 Years and over | 0 (0.0%) | 0 (0.0%) |
Technology Access in Industry
Computing Device Access in Industry
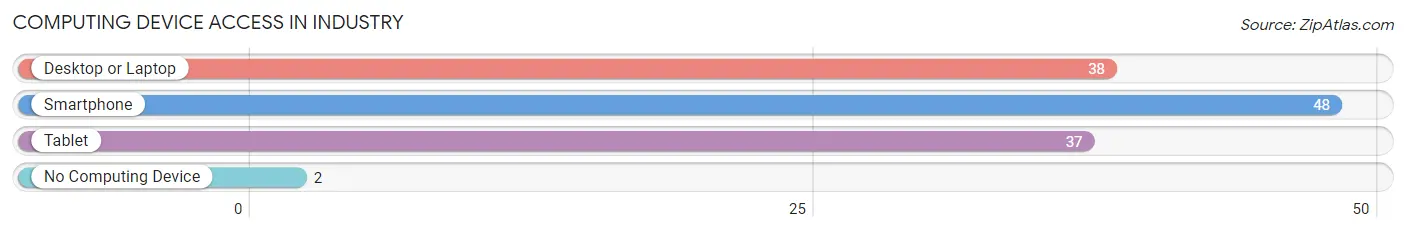
| Device Type | # Households | % Households |
| Desktop or Laptop | 38 | 76.0% |
| Smartphone | 48 | 96.0% |
| Tablet | 37 | 74.0% |
| No Computing Device | 2 | 4.0% |
| Total | 50 | 100.0% |
Internet Access in Industry
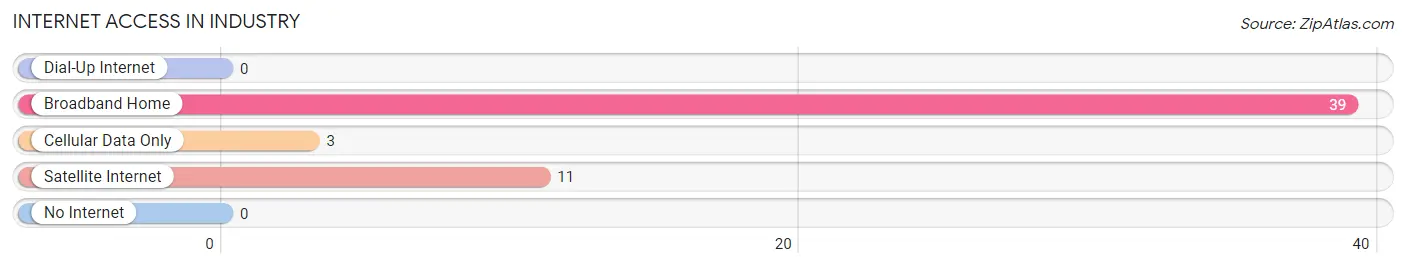
| Internet Type | # Households | % Households |
| Dial-Up Internet | 0 | 0.0% |
| Broadband Home | 39 | 78.0% |
| Cellular Data Only | 3 | 6.0% |
| Satellite Internet | 11 | 22.0% |
| No Internet | 0 | 0.0% |
| Total | 50 | 100.0% |
Industry Summary
Industry is a city located in the San Gabriel Valley of Los Angeles County, California. It is located in the eastern part of the county, about 22 miles east of downtown Los Angeles. The city is home to a population of over 800 people and is known for its industrial and commercial businesses.
History
Industry was founded in 1957 by a group of businessmen who wanted to create a city that would be a center for industrial and commercial businesses. The city was incorporated in 1957 and was named after the industrial businesses that were located in the area. The city was originally planned to be a planned community, but the plans were never fully realized.
Geography
Industry is located in the San Gabriel Valley of Los Angeles County. It is located in the eastern part of the county, about 22 miles east of downtown Los Angeles. The city is bordered by the cities of La Puente, Hacienda Heights, and West Covina. The city is located at an elevation of about 500 feet above sea level.
Economy
Industry is known for its industrial and commercial businesses. The city is home to a variety of businesses, including manufacturing, warehousing, and distribution. The city is also home to a number of retail stores, restaurants, and other businesses. The city is also home to a number of corporate headquarters, including those of the California State Automobile Association and the California State Teachers Retirement System.
Demographics
As of the 2010 census, the population of Industry was 803. The racial makeup of the city was 57.2% White, 0.9% African American, 0.4% Native American, 2.2% Asian, 0.1% Pacific Islander, 36.2% from other races, and 3.0% from two or more races. Hispanic or Latino of any race were 64.2% of the population.
The median income for a household in the city was $50,977, and the median income for a family was $54,977. The per capita income for the city was $20,977. About 11.2% of families and 13.3% of the population were below the poverty line, including 17.2% of those under age 18 and 8.2% of those age 65 or over.
Conclusion
Industry is a city located in the San Gabriel Valley of Los Angeles County, California. It is known for its industrial and commercial businesses and is home to a population of over 800 people. The city has a diverse population and economy, with a variety of businesses, retail stores, restaurants, and corporate headquarters. The median income for a household in the city is $50,977, and the per capita income is $20,977.
Common Questions
What is Per Capita Income in Industry?
Per Capita income in Industry is $20,103.
What is the Median Family Income in Industry?
Median Family Income in Industry is $75,750.
What is the Median Household income in Industry?
Median Household Income in Industry is $77,000.
What is Income or Wage Gap in Industry?
Income or Wage Gap in Industry is 30.0%.
Women in Industry earn 70.0 cents for every dollar earned by a man.
What is Inequality or Gini Index in Industry?
Inequality or Gini Index in Industry is 0.26.
What is the Total Population of Industry?
Total Population of Industry is 234.
What is the Total Male Population of Industry?
Total Male Population of Industry is 132.
What is the Total Female Population of Industry?
Total Female Population of Industry is 102.
What is the Ratio of Males per 100 Females in Industry?
There are 129.41 Males per 100 Females in Industry.
What is the Ratio of Females per 100 Males in Industry?
There are 77.27 Females per 100 Males in Industry.
What is the Median Population Age in Industry?
Median Population Age in Industry is 29.3 Years.
What is the Average Family Size in Industry
Average Family Size in Industry is 4.3 People.
What is the Average Household Size in Industry
Average Household Size in Industry is 3.6 People.
How Large is the Labor Force in Industry?
There are 92 People in the Labor Forcein in Industry.
What is the Percentage of People in the Labor Force in Industry?
57.5% of People are in the Labor Force in Industry.
What is the Unemployment Rate in Industry?
Unemployment Rate in Industry is 7.6%.