Lucerne Valley, CA Map & Demographics
Lucerne Valley Map
Lucerne Valley Overview
$22,835
PER CAPITA INCOME
$54,596
AVG FAMILY INCOME
$45,444
AVG HOUSEHOLD INCOME
30.9%
WAGE / INCOME GAP [ % ]
69.1¢/ $1
WAGE / INCOME GAP [ $ ]
$13,537
FAMILY INCOME DEFICIT
0.50
INEQUALITY / GINI INDEX
6,212
TOTAL POPULATION
3,480
MALE POPULATION
2,732
FEMALE POPULATION
127.38
MALES / 100 FEMALES
78.51
FEMALES / 100 MALES
38.3
MEDIAN AGE
3.6
AVG FAMILY SIZE
2.8
AVG HOUSEHOLD SIZE
2,154
LABOR FORCE [ PEOPLE ]
44.8%
PERCENT IN LABOR FORCE
21.7%
UNEMPLOYMENT RATE
Lucerne Valley Zip Codes
Lucerne Valley Area Codes
Income in Lucerne Valley
Income Overview in Lucerne Valley
Per Capita Income in Lucerne Valley is $22,835, while median incomes of families and households are $54,596 and $45,444 respectively.
| Characteristic | Number | Measure |
| Per Capita Income | 6,212 | $22,835 |
| Median Family Income | 1,383 | $54,596 |
| Mean Family Income | 1,383 | $69,010 |
| Median Household Income | 2,163 | $45,444 |
| Mean Household Income | 2,163 | $63,791 |
| Income Deficit | 1,383 | $13,537 |
| Wage / Income Gap (%) | 6,212 | 30.94% |
| Wage / Income Gap ($) | 6,212 | 69.06¢ per $1 |
| Gini / Inequality Index | 6,212 | 0.50 |
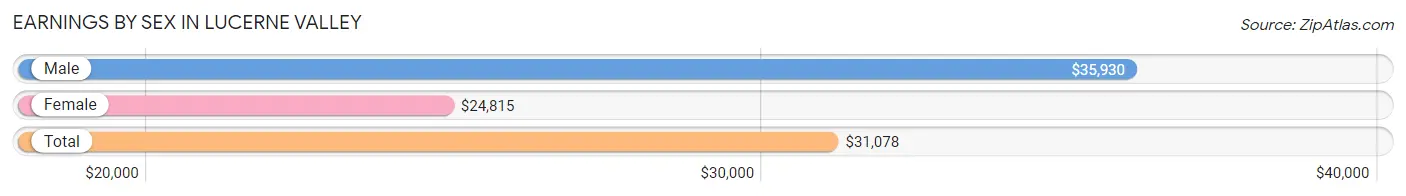
Earnings by Sex in Lucerne Valley
Average Earnings in Lucerne Valley are $31,078, $35,930 for men and $24,815 for women, a difference of 30.9%.
| Sex | Number | Average Earnings |
| Male | 1,298 (62.2%) | $35,930 |
| Female | 790 (37.8%) | $24,815 |
| Total | 2,088 (100.0%) | $31,078 |
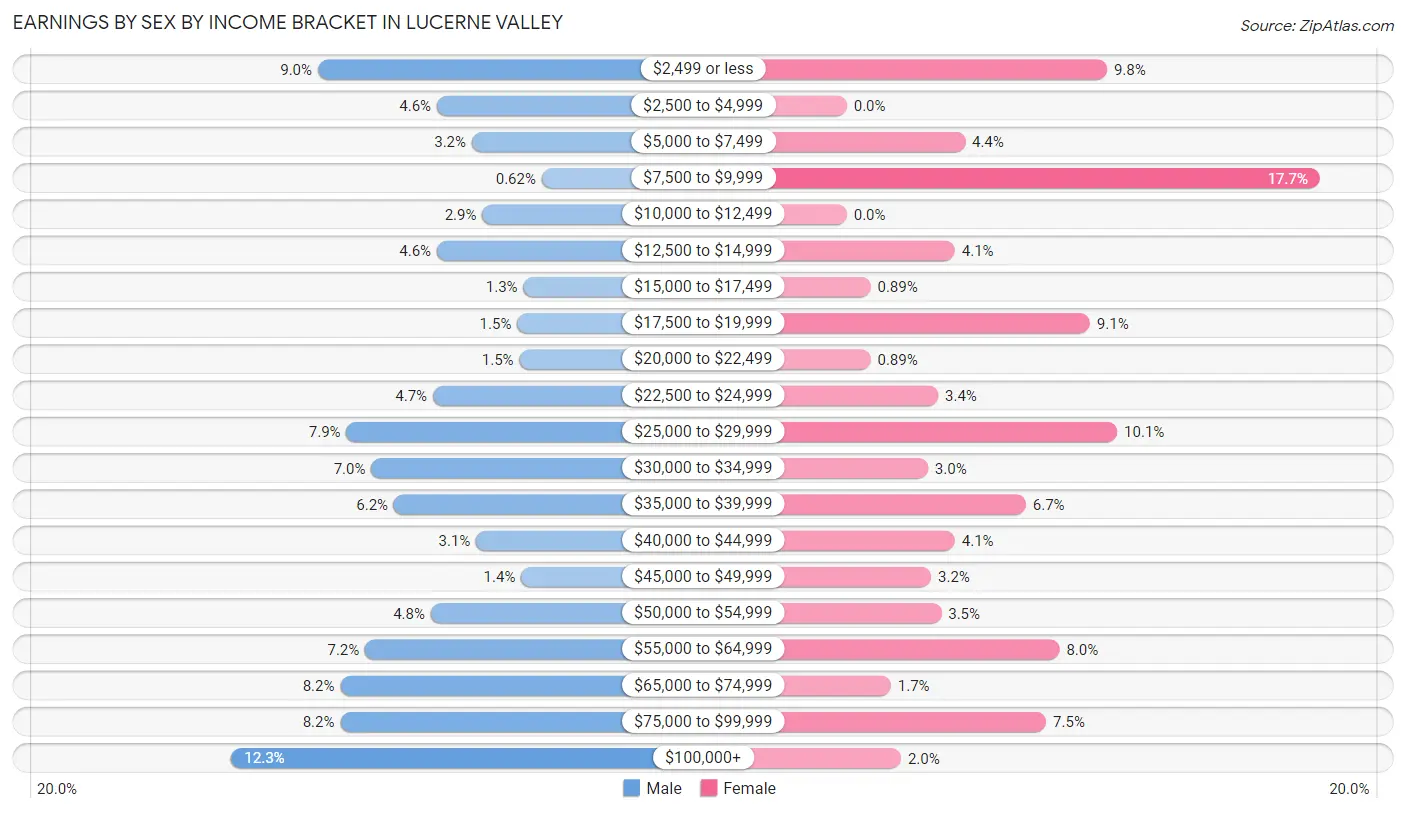
Earnings by Sex by Income Bracket in Lucerne Valley
The most common earnings brackets in Lucerne Valley are $100,000+ for men (159 | 12.2%) and $7,500 to $9,999 for women (140 | 17.7%).
| Income | Male | Female |
| $2,499 or less | 117 (9.0%) | 77 (9.8%) |
| $2,500 to $4,999 | 59 (4.5%) | 0 (0.0%) |
| $5,000 to $7,499 | 42 (3.2%) | 35 (4.4%) |
| $7,500 to $9,999 | 8 (0.6%) | 140 (17.7%) |
| $10,000 to $12,499 | 37 (2.9%) | 0 (0.0%) |
| $12,500 to $14,999 | 59 (4.5%) | 32 (4.1%) |
| $15,000 to $17,499 | 17 (1.3%) | 7 (0.9%) |
| $17,500 to $19,999 | 20 (1.5%) | 72 (9.1%) |
| $20,000 to $22,499 | 19 (1.5%) | 7 (0.9%) |
| $22,500 to $24,999 | 61 (4.7%) | 27 (3.4%) |
| $25,000 to $29,999 | 103 (7.9%) | 80 (10.1%) |
| $30,000 to $34,999 | 91 (7.0%) | 24 (3.0%) |
| $35,000 to $39,999 | 80 (6.2%) | 53 (6.7%) |
| $40,000 to $44,999 | 40 (3.1%) | 32 (4.1%) |
| $45,000 to $49,999 | 18 (1.4%) | 25 (3.2%) |
| $50,000 to $54,999 | 62 (4.8%) | 28 (3.5%) |
| $55,000 to $64,999 | 94 (7.2%) | 63 (8.0%) |
| $65,000 to $74,999 | 106 (8.2%) | 13 (1.7%) |
| $75,000 to $99,999 | 106 (8.2%) | 59 (7.5%) |
| $100,000+ | 159 (12.2%) | 16 (2.0%) |
| Total | 1,298 (100.0%) | 790 (100.0%) |
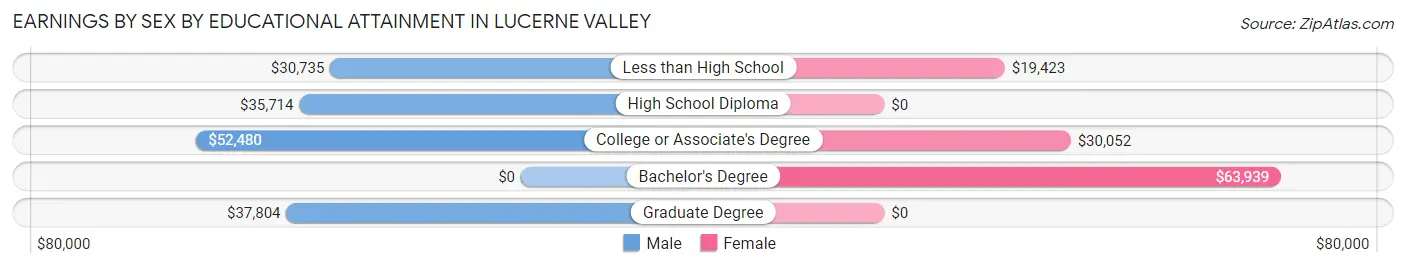
Earnings by Sex by Educational Attainment in Lucerne Valley
Average earnings in Lucerne Valley are $39,426 for men and $28,750 for women, a difference of 27.1%. Men with an educational attainment of college or associate's degree enjoy the highest average annual earnings of $52,480, while those with less than high school education earn the least with $30,735. Women with an educational attainment of bachelor's degree earn the most with the average annual earnings of $63,939, while those with less than high school education have the smallest earnings of $19,423.
| Educational Attainment | Male Income | Female Income |
| Less than High School | $30,735 | $19,423 |
| High School Diploma | $35,714 | $0 |
| College or Associate's Degree | $52,480 | $30,052 |
| Bachelor's Degree | - | - |
| Graduate Degree | $37,804 | $0 |
| Total | $39,426 | $28,750 |
Family Income in Lucerne Valley
Family Income Brackets in Lucerne Valley
According to the Lucerne Valley family income data, there are 232 families falling into the $75,000 to $99,999 income range, which is the most common income bracket and makes up 16.8% of all families. Conversely, the $150,000 to $199,999 income bracket is the least frequent group with only 53 families (3.8%) belonging to this category.
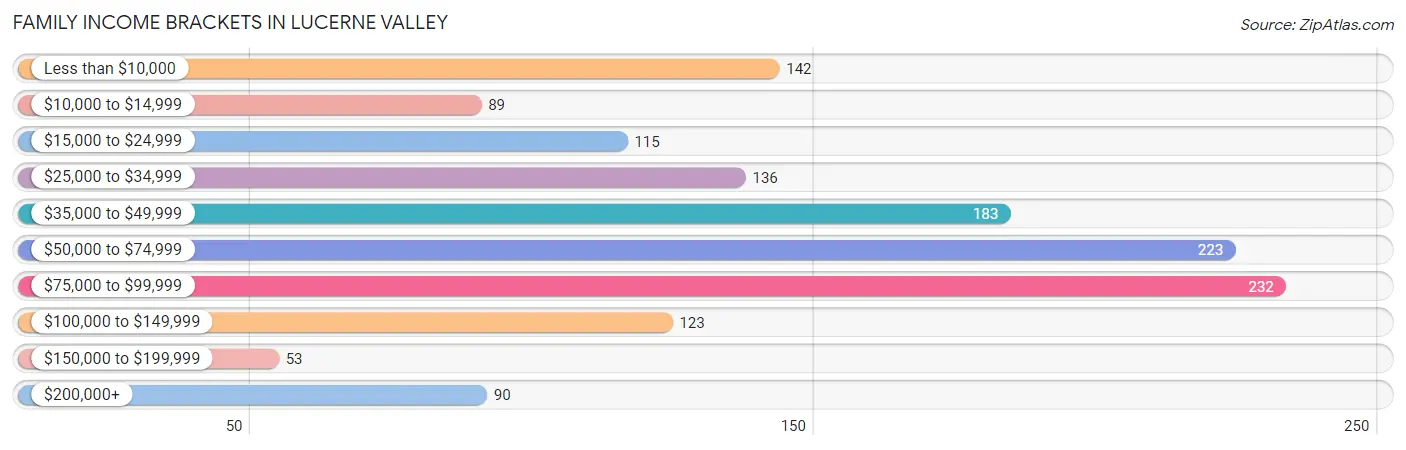
| Income Bracket | # Families | % Families |
| Less than $10,000 | 142 | 10.3% |
| $10,000 to $14,999 | 89 | 6.4% |
| $15,000 to $24,999 | 115 | 8.3% |
| $25,000 to $34,999 | 136 | 9.8% |
| $35,000 to $49,999 | 183 | 13.2% |
| $50,000 to $74,999 | 223 | 16.1% |
| $75,000 to $99,999 | 232 | 16.8% |
| $100,000 to $149,999 | 123 | 8.9% |
| $150,000 to $199,999 | 53 | 3.8% |
| $200,000+ | 90 | 6.5% |
Family Income by Famaliy Size in Lucerne Valley
7+ person families (66 | 4.8%) account for the highest median family income in Lucerne Valley with $132,500 per family, while 2-person families (609 | 44.0%) have the highest median income of $28,672 per family member.
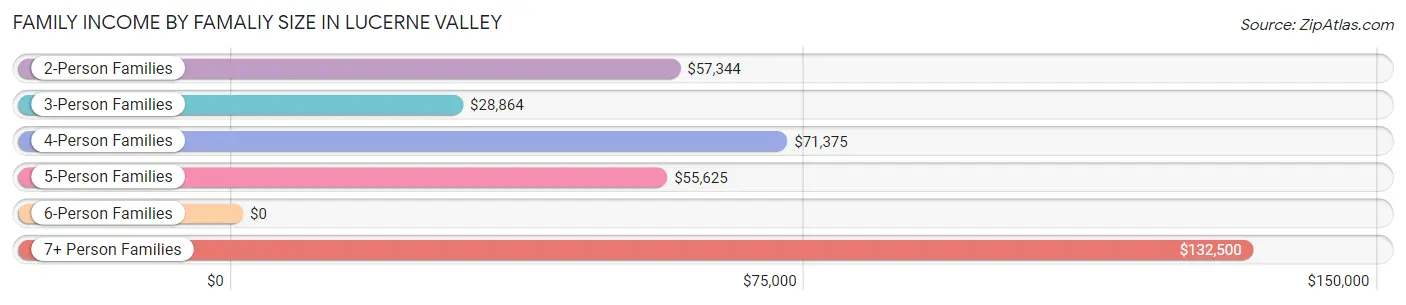
| Income Bracket | # Families | Median Income |
| 2-Person Families | 609 (44.0%) | $57,344 |
| 3-Person Families | 274 (19.8%) | $28,864 |
| 4-Person Families | 269 (19.5%) | $71,375 |
| 5-Person Families | 92 (6.7%) | $55,625 |
| 6-Person Families | 73 (5.3%) | $0 |
| 7+ Person Families | 66 (4.8%) | $132,500 |
| Total | 1,383 (100.0%) | $54,596 |
Family Income by Number of Earners in Lucerne Valley
The median family income in Lucerne Valley is $54,596, with families comprising 3+ earners (79) having the highest median family income of $136,023, while families with no earners (589) have the lowest median family income of $26,754, accounting for 5.7% and 42.6% of families, respectively.
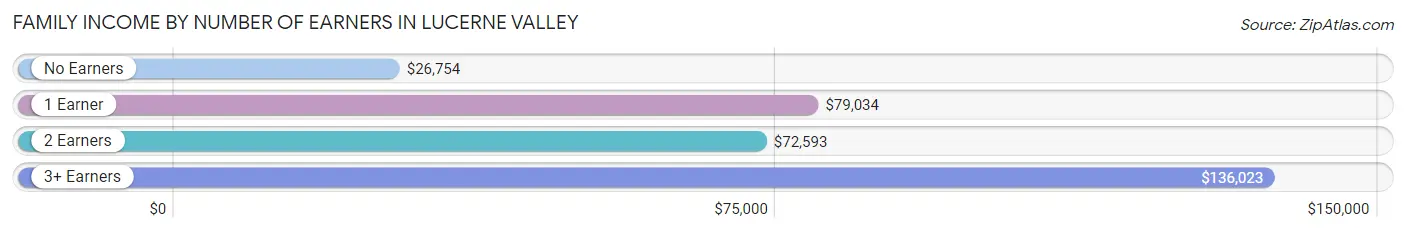
| Number of Earners | # Families | Median Income |
| No Earners | 589 (42.6%) | $26,754 |
| 1 Earner | 401 (29.0%) | $79,034 |
| 2 Earners | 314 (22.7%) | $72,593 |
| 3+ Earners | 79 (5.7%) | $136,023 |
| Total | 1,383 (100.0%) | $54,596 |
Household Income in Lucerne Valley
Household Income Brackets in Lucerne Valley
With 385 households falling in the category, the $50,000 to $74,999 income range is the most frequent in Lucerne Valley, accounting for 17.8% of all households. In contrast, only 97 households (4.5%) fall into the $150,000 to $199,999 income bracket, making it the least populous group.
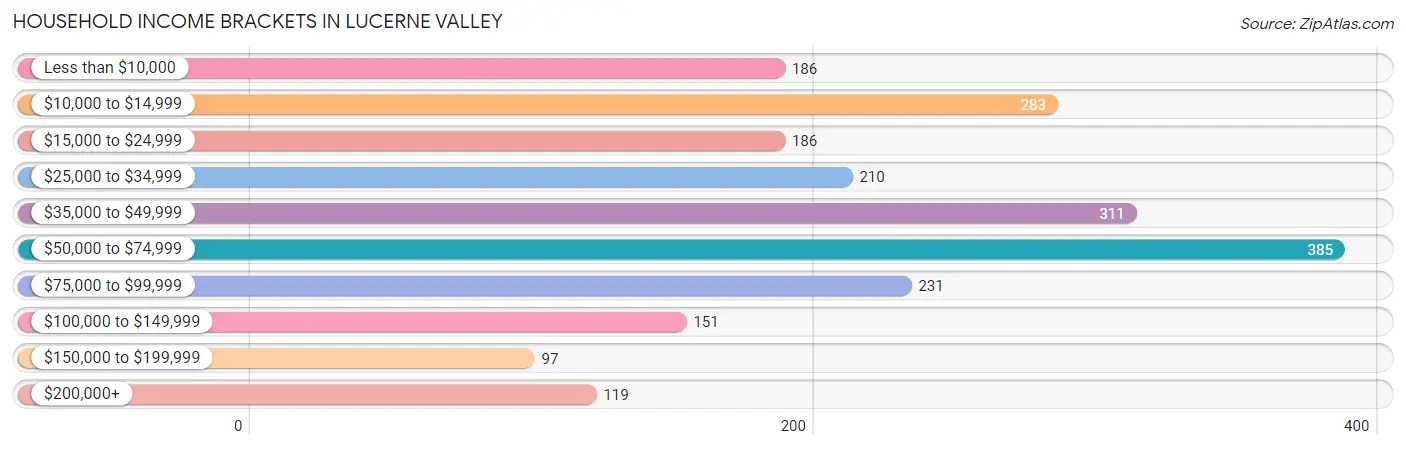
| Income Bracket | # Households | % Households |
| Less than $10,000 | 186 | 8.6% |
| $10,000 to $14,999 | 283 | 13.1% |
| $15,000 to $24,999 | 186 | 8.6% |
| $25,000 to $34,999 | 210 | 9.7% |
| $35,000 to $49,999 | 311 | 14.4% |
| $50,000 to $74,999 | 385 | 17.8% |
| $75,000 to $99,999 | 231 | 10.7% |
| $100,000 to $149,999 | 151 | 7.0% |
| $150,000 to $199,999 | 97 | 4.5% |
| $200,000+ | 119 | 5.5% |
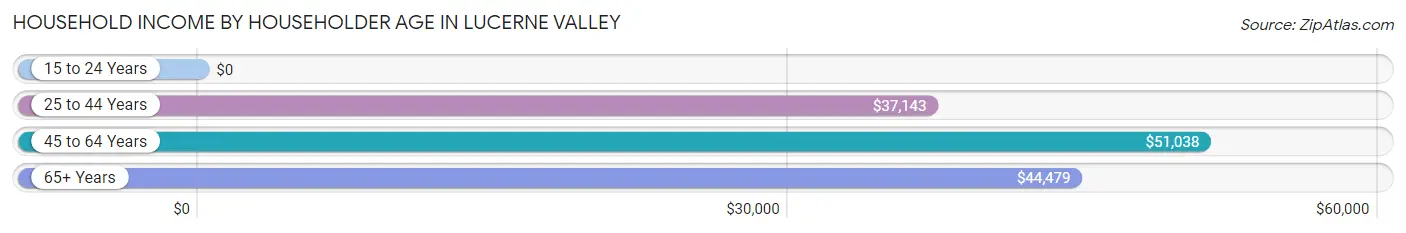
Household Income by Householder Age in Lucerne Valley
The median household income in Lucerne Valley is $45,444, with the highest median household income of $51,038 found in the 45 to 64 years age bracket for the primary householder. A total of 830 households (38.4%) fall into this category.
| Income Bracket | # Households | Median Income |
| 15 to 24 Years | 0 (0.0%) | $0 |
| 25 to 44 Years | 694 (32.1%) | $37,143 |
| 45 to 64 Years | 830 (38.4%) | $51,038 |
| 65+ Years | 639 (29.5%) | $44,479 |
| Total | 2,163 (100.0%) | $45,444 |
Poverty in Lucerne Valley
Income Below Poverty by Sex and Age in Lucerne Valley
With 30.0% poverty level for males and 35.5% for females among the residents of Lucerne Valley, 5 year old males and 16 and 17 year old females are the most vulnerable to poverty, with 56 males (53.3%) and 16 females (100.0%) in their respective age groups living below the poverty level.
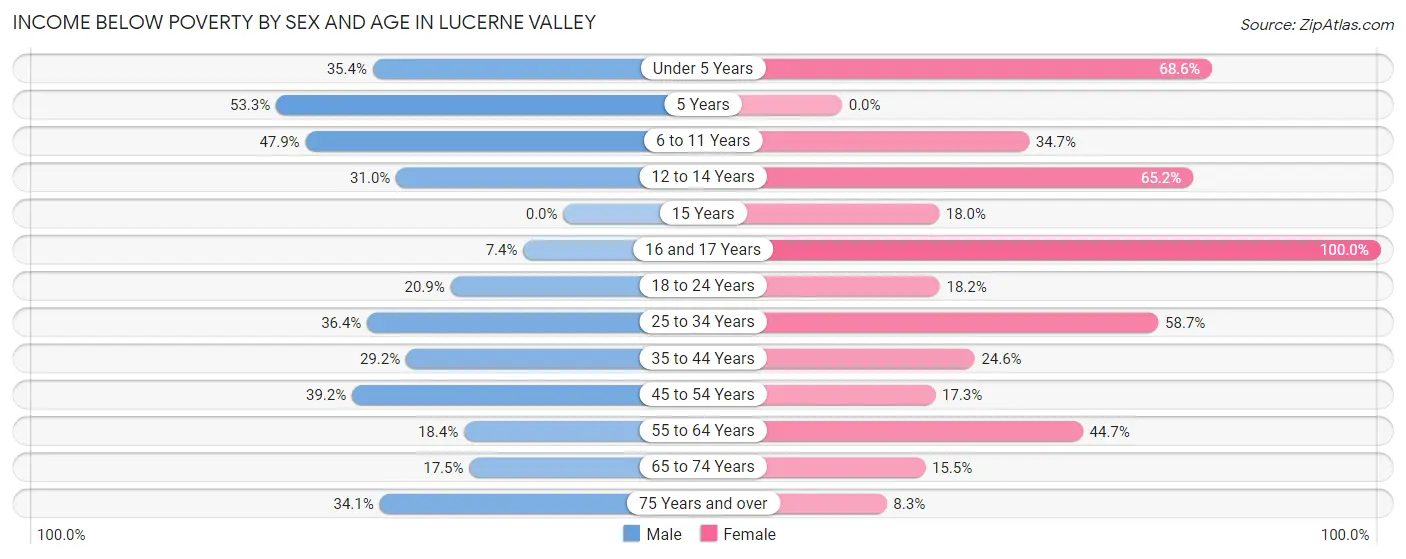
| Age Bracket | Male | Female |
| Under 5 Years | 69 (35.4%) | 199 (68.6%) |
| 5 Years | 56 (53.3%) | 0 (0.0%) |
| 6 to 11 Years | 191 (47.9%) | 50 (34.7%) |
| 12 to 14 Years | 9 (31.0%) | 88 (65.2%) |
| 15 Years | 0 (0.0%) | 9 (18.0%) |
| 16 and 17 Years | 9 (7.4%) | 16 (100.0%) |
| 18 to 24 Years | 49 (20.9%) | 55 (18.1%) |
| 25 to 34 Years | 130 (36.4%) | 175 (58.7%) |
| 35 to 44 Years | 125 (29.2%) | 98 (24.6%) |
| 45 to 54 Years | 140 (39.2%) | 55 (17.3%) |
| 55 to 64 Years | 102 (18.4%) | 177 (44.7%) |
| 65 to 74 Years | 62 (17.5%) | 34 (15.4%) |
| 75 Years and over | 101 (34.1%) | 13 (8.3%) |
| Total | 1,043 (30.0%) | 969 (35.5%) |
Income Above Poverty by Sex and Age in Lucerne Valley
According to the poverty statistics in Lucerne Valley, males aged 15 years and females aged 5 years are the age groups that are most secure financially, with 100.0% of males and 100.0% of females in these age groups living above the poverty line.
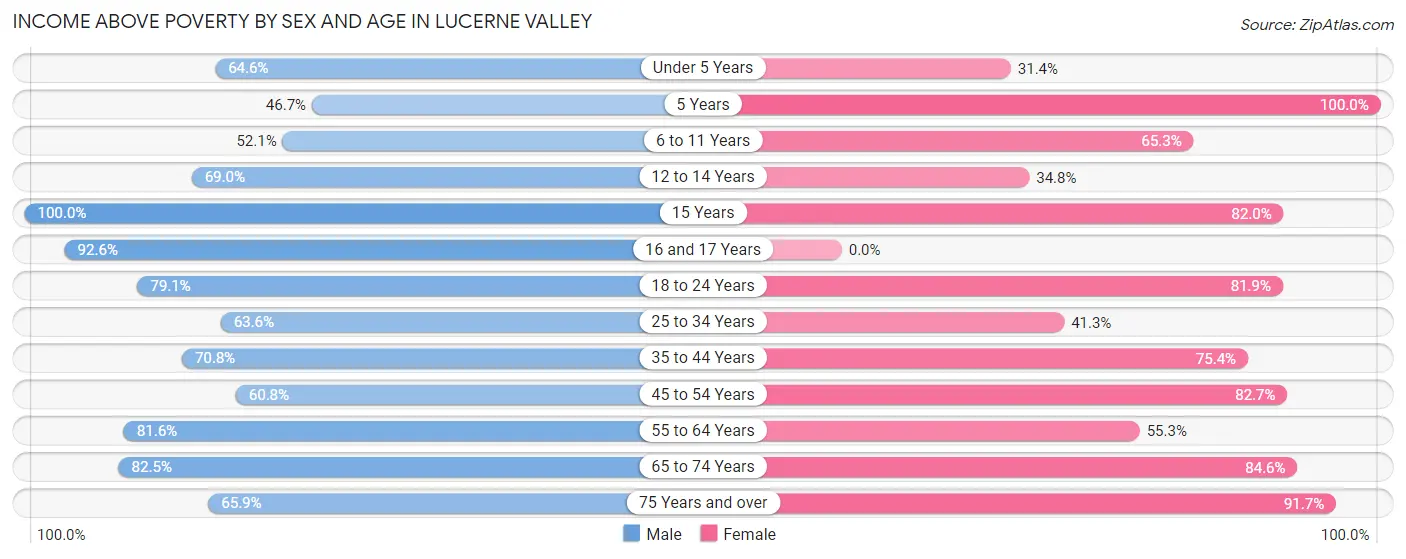
| Age Bracket | Male | Female |
| Under 5 Years | 126 (64.6%) | 91 (31.4%) |
| 5 Years | 49 (46.7%) | 7 (100.0%) |
| 6 to 11 Years | 208 (52.1%) | 94 (65.3%) |
| 12 to 14 Years | 20 (69.0%) | 47 (34.8%) |
| 15 Years | 47 (100.0%) | 41 (82.0%) |
| 16 and 17 Years | 112 (92.6%) | 0 (0.0%) |
| 18 to 24 Years | 185 (79.1%) | 248 (81.9%) |
| 25 to 34 Years | 227 (63.6%) | 123 (41.3%) |
| 35 to 44 Years | 303 (70.8%) | 300 (75.4%) |
| 45 to 54 Years | 217 (60.8%) | 263 (82.7%) |
| 55 to 64 Years | 451 (81.6%) | 219 (55.3%) |
| 65 to 74 Years | 293 (82.5%) | 186 (84.6%) |
| 75 Years and over | 195 (65.9%) | 144 (91.7%) |
| Total | 2,433 (70.0%) | 1,763 (64.5%) |
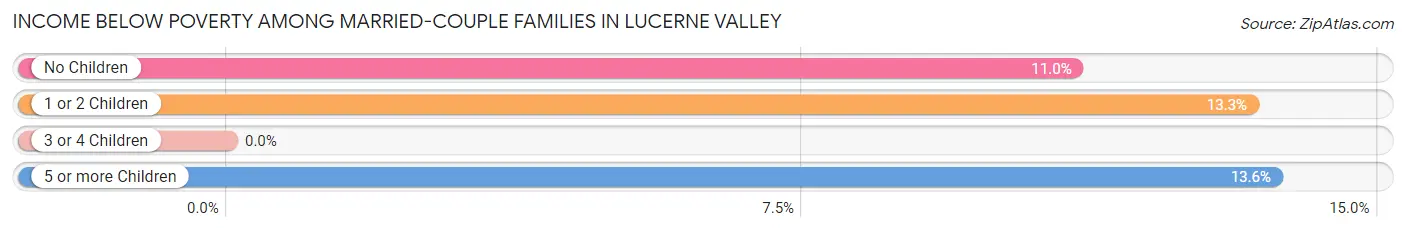
Income Below Poverty Among Married-Couple Families in Lucerne Valley
The poverty statistics for married-couple families in Lucerne Valley show that 10.8% or 96 of the total 888 families live below the poverty line. Families with 5 or more children have the highest poverty rate of 13.6%, comprising of 9 families. On the other hand, families with 3 or 4 children have the lowest poverty rate of 0.0%, which includes 0 families.
| Children | Above Poverty | Below Poverty |
| No Children | 556 (89.0%) | 69 (11.0%) |
| 1 or 2 Children | 117 (86.7%) | 18 (13.3%) |
| 3 or 4 Children | 62 (100.0%) | 0 (0.0%) |
| 5 or more Children | 57 (86.4%) | 9 (13.6%) |
| Total | 792 (89.2%) | 96 (10.8%) |
Income Below Poverty Among Single-Parent Households in Lucerne Valley
According to the poverty data in Lucerne Valley, 29.3% or 60 single-father households and 71.7% or 208 single-mother households are living below the poverty line. Among single-father households, those with 1 or 2 children have the highest poverty rate, with 54 households (34.8%) experiencing poverty. Likewise, among single-mother households, those with 3 or 4 children have the highest poverty rate, with 86 households (100.0%) falling below the poverty line.
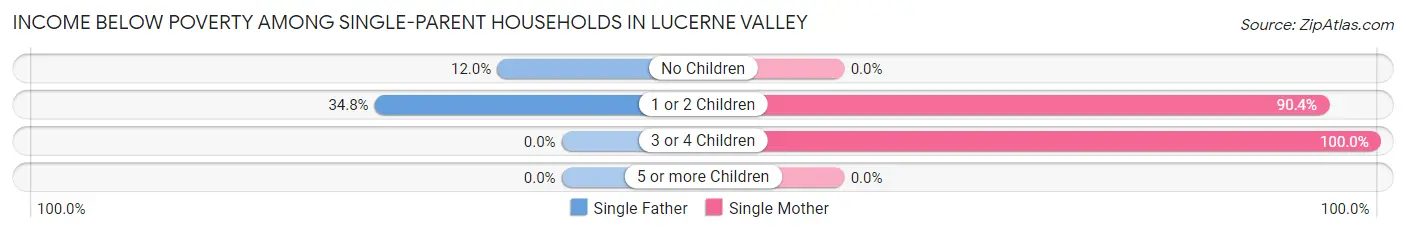
| Children | Single Father | Single Mother |
| No Children | 6 (12.0%) | 0 (0.0%) |
| 1 or 2 Children | 54 (34.8%) | 122 (90.4%) |
| 3 or 4 Children | 0 (0.0%) | 86 (100.0%) |
| 5 or more Children | 0 (0.0%) | 0 (0.0%) |
| Total | 60 (29.3%) | 208 (71.7%) |
Income Below Poverty Among Married-Couple vs Single-Parent Households in Lucerne Valley
The poverty data for Lucerne Valley shows that 96 of the married-couple family households (10.8%) and 268 of the single-parent households (54.1%) are living below the poverty level. Within the married-couple family households, those with 5 or more children have the highest poverty rate, with 9 households (13.6%) falling below the poverty line. Among the single-parent households, those with 3 or 4 children have the highest poverty rate, with 86 household (100.0%) living below poverty.
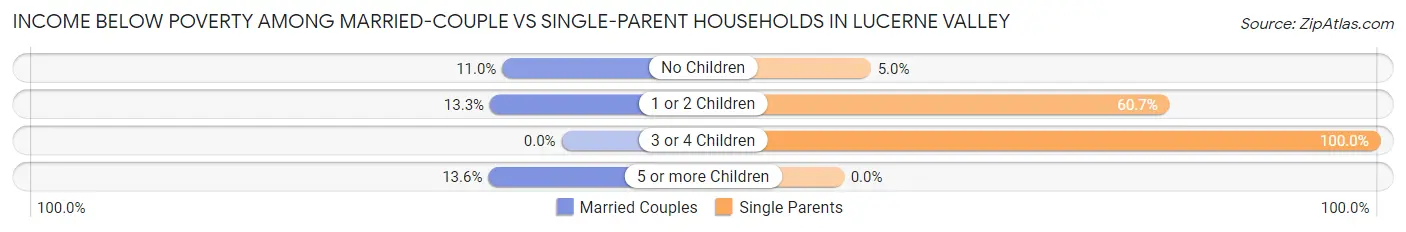
| Children | Married-Couple Families | Single-Parent Households |
| No Children | 69 (11.0%) | 6 (5.0%) |
| 1 or 2 Children | 18 (13.3%) | 176 (60.7%) |
| 3 or 4 Children | 0 (0.0%) | 86 (100.0%) |
| 5 or more Children | 9 (13.6%) | 0 (0.0%) |
| Total | 96 (10.8%) | 268 (54.1%) |
Race in Lucerne Valley
The most populous races in Lucerne Valley are White / Caucasian (4,128 | 66.4%), Hispanic or Latino (2,196 | 35.3%), and Two or more Races (1,176 | 18.9%).
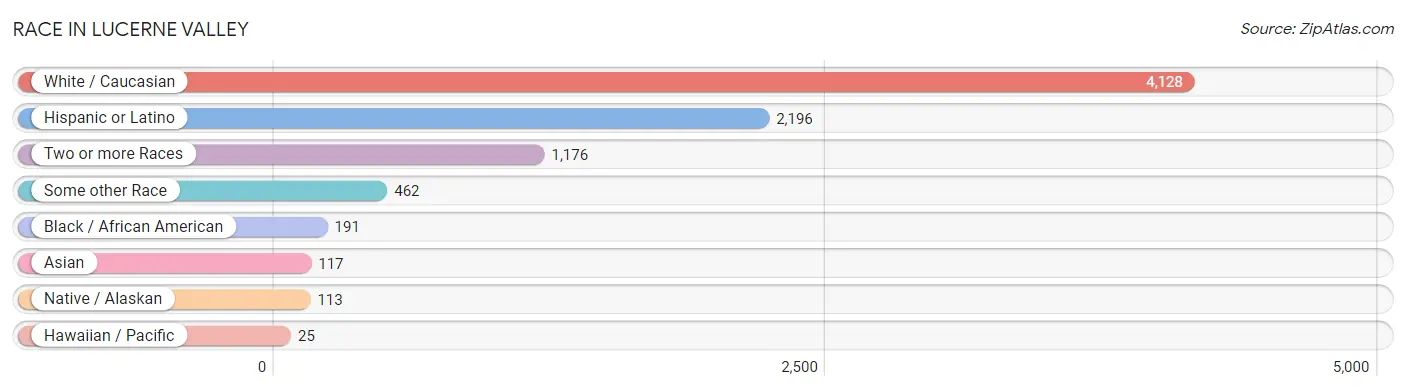
| Race | # Population | % Population |
| Asian | 117 | 1.9% |
| Black / African American | 191 | 3.1% |
| Hawaiian / Pacific | 25 | 0.4% |
| Hispanic or Latino | 2,196 | 35.3% |
| Native / Alaskan | 113 | 1.8% |
| White / Caucasian | 4,128 | 66.4% |
| Two or more Races | 1,176 | 18.9% |
| Some other Race | 462 | 7.4% |
| Total | 6,212 | 100.0% |
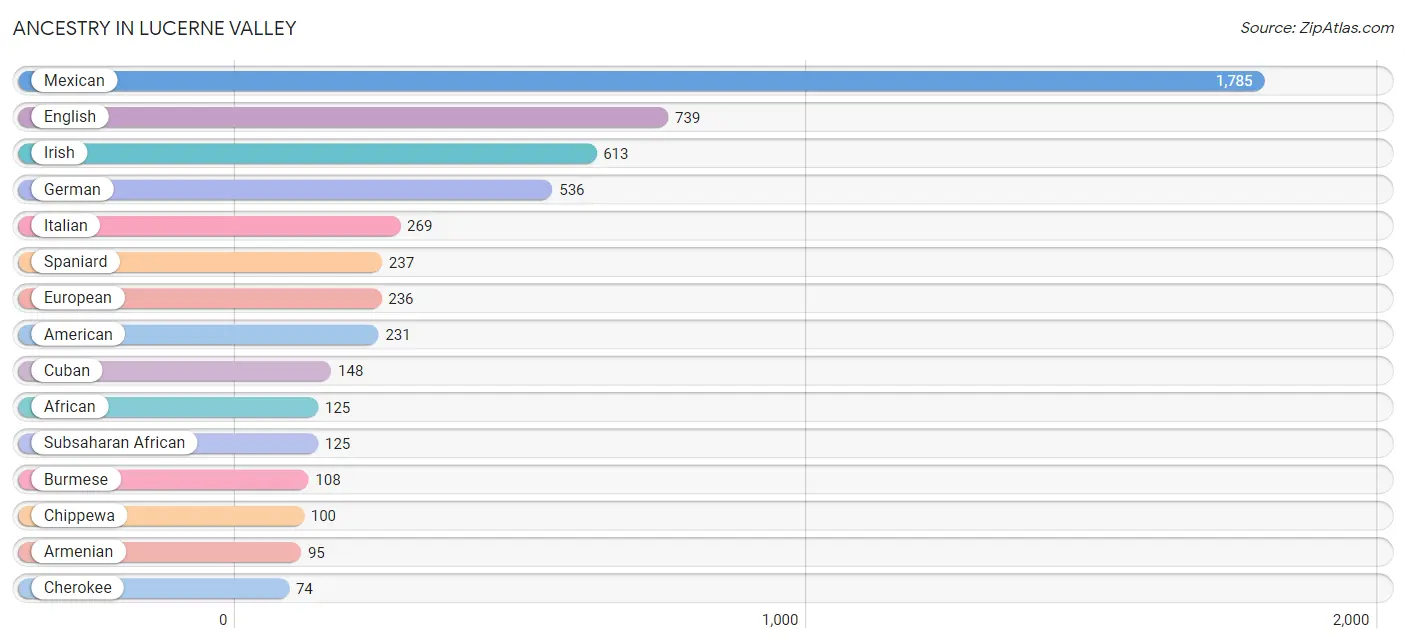
Ancestry in Lucerne Valley
The most populous ancestries reported in Lucerne Valley are Mexican (1,785 | 28.7%), English (739 | 11.9%), Irish (613 | 9.9%), German (536 | 8.6%), and Italian (269 | 4.3%), together accounting for 63.5% of all Lucerne Valley residents.
| Ancestry | # Population | % Population |
| African | 125 | 2.0% |
| American | 231 | 3.7% |
| Armenian | 95 | 1.5% |
| Austrian | 65 | 1.1% |
| Bhutanese | 12 | 0.2% |
| Blackfeet | 24 | 0.4% |
| British | 22 | 0.4% |
| Burmese | 108 | 1.7% |
| Canadian | 22 | 0.4% |
| Central American Indian | 10 | 0.2% |
| Cherokee | 74 | 1.2% |
| Chippewa | 100 | 1.6% |
| Choctaw | 42 | 0.7% |
| Comanche | 8 | 0.1% |
| Cuban | 148 | 2.4% |
| Czechoslovakian | 18 | 0.3% |
| Danish | 11 | 0.2% |
| Dutch | 31 | 0.5% |
| Eastern European | 34 | 0.5% |
| English | 739 | 11.9% |
| European | 236 | 3.8% |
| French | 62 | 1.0% |
| German | 536 | 8.6% |
| Hungarian | 18 | 0.3% |
| Indian (Asian) | 30 | 0.5% |
| Irish | 613 | 9.9% |
| Italian | 269 | 4.3% |
| Mexican | 1,785 | 28.7% |
| Native Hawaiian | 25 | 0.4% |
| Norwegian | 49 | 0.8% |
| Polish | 37 | 0.6% |
| Portuguese | 17 | 0.3% |
| Puerto Rican | 17 | 0.3% |
| Scotch-Irish | 61 | 1.0% |
| Scottish | 63 | 1.0% |
| Spaniard | 237 | 3.8% |
| Spanish American Indian | 13 | 0.2% |
| Subsaharan African | 125 | 2.0% |
| Swedish | 60 | 1.0% |
| Swiss | 11 | 0.2% |
| Welsh | 31 | 0.5% |
| West Indian | 10 | 0.2% |
| Yugoslavian | 48 | 0.8% | View All 43 Rows |
Immigrants in Lucerne Valley
The most numerous immigrant groups reported in Lucerne Valley came from Latin America (592 | 9.5%), Central America (546 | 8.8%), Mexico (542 | 8.7%), Asia (110 | 1.8%), and Eastern Asia (110 | 1.8%), together accounting for 30.6% of all Lucerne Valley residents.
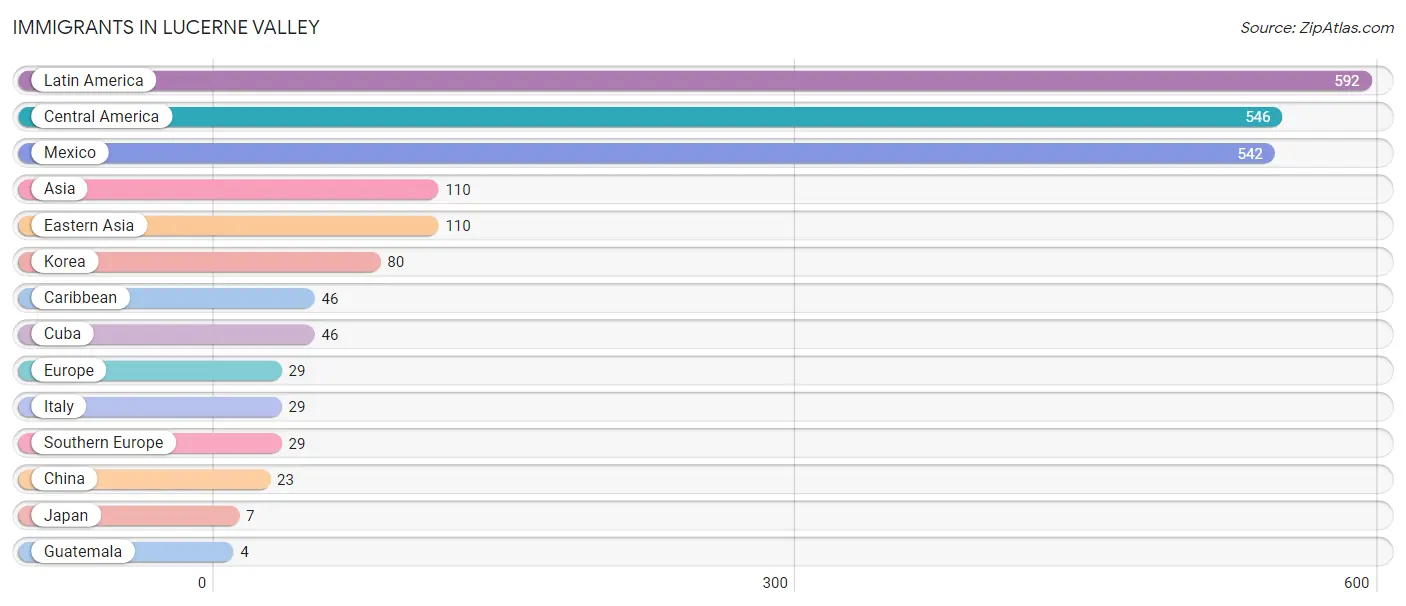
| Immigration Origin | # Population | % Population |
| Asia | 110 | 1.8% |
| Caribbean | 46 | 0.7% |
| Central America | 546 | 8.8% |
| China | 23 | 0.4% |
| Cuba | 46 | 0.7% |
| Eastern Asia | 110 | 1.8% |
| Europe | 29 | 0.5% |
| Guatemala | 4 | 0.1% |
| Italy | 29 | 0.5% |
| Japan | 7 | 0.1% |
| Korea | 80 | 1.3% |
| Latin America | 592 | 9.5% |
| Mexico | 542 | 8.7% |
| Southern Europe | 29 | 0.5% | View All 14 Rows |
Sex and Age in Lucerne Valley
Sex and Age in Lucerne Valley
The most populous age groups in Lucerne Valley are 55 to 59 Years (361 | 10.4%) for men and 60 to 64 Years (293 | 10.7%) for women.
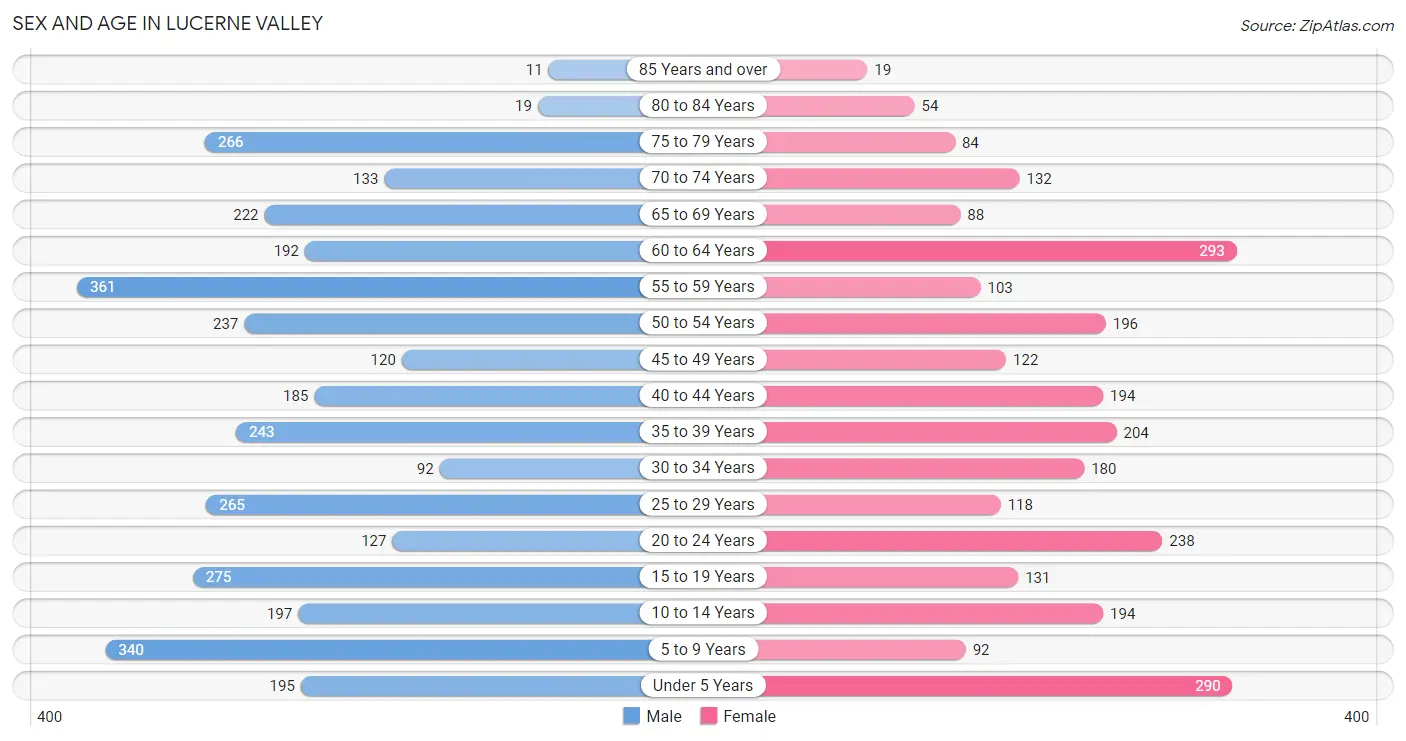
| Age Bracket | Male | Female |
| Under 5 Years | 195 (5.6%) | 290 (10.6%) |
| 5 to 9 Years | 340 (9.8%) | 92 (3.4%) |
| 10 to 14 Years | 197 (5.7%) | 194 (7.1%) |
| 15 to 19 Years | 275 (7.9%) | 131 (4.8%) |
| 20 to 24 Years | 127 (3.6%) | 238 (8.7%) |
| 25 to 29 Years | 265 (7.6%) | 118 (4.3%) |
| 30 to 34 Years | 92 (2.6%) | 180 (6.6%) |
| 35 to 39 Years | 243 (7.0%) | 204 (7.5%) |
| 40 to 44 Years | 185 (5.3%) | 194 (7.1%) |
| 45 to 49 Years | 120 (3.5%) | 122 (4.5%) |
| 50 to 54 Years | 237 (6.8%) | 196 (7.2%) |
| 55 to 59 Years | 361 (10.4%) | 103 (3.8%) |
| 60 to 64 Years | 192 (5.5%) | 293 (10.7%) |
| 65 to 69 Years | 222 (6.4%) | 88 (3.2%) |
| 70 to 74 Years | 133 (3.8%) | 132 (4.8%) |
| 75 to 79 Years | 266 (7.6%) | 84 (3.1%) |
| 80 to 84 Years | 19 (0.5%) | 54 (2.0%) |
| 85 Years and over | 11 (0.3%) | 19 (0.7%) |
| Total | 3,480 (100.0%) | 2,732 (100.0%) |
Families and Households in Lucerne Valley
Median Family Size in Lucerne Valley
The median family size in Lucerne Valley is 3.58 persons per family, with single female/mother families (290 | 21.0%) accounting for the largest median family size of 3.61 persons per family. On the other hand, married-couple families (888 | 64.2%) represent the smallest median family size with 3.56 persons per family.
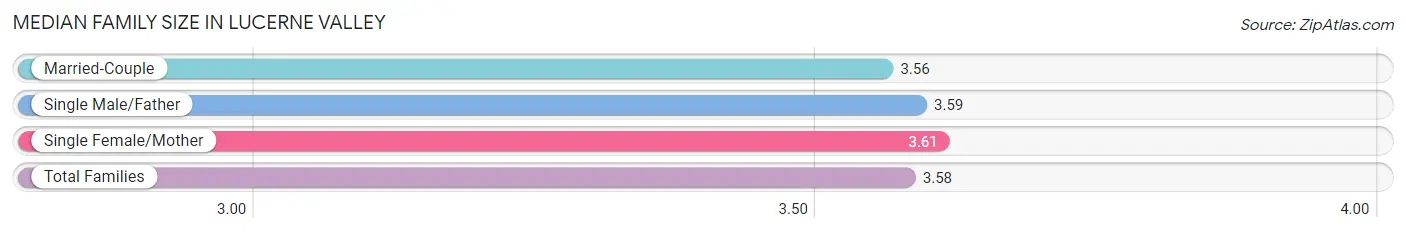
| Family Type | # Families | Family Size |
| Married-Couple | 888 (64.2%) | 3.56 |
| Single Male/Father | 205 (14.8%) | 3.59 |
| Single Female/Mother | 290 (21.0%) | 3.61 |
| Total Families | 1,383 (100.0%) | 3.58 |
Median Household Size in Lucerne Valley
The median household size in Lucerne Valley is 2.82 persons per household, with single female/mother households (290 | 13.4%) accounting for the largest median household size of 4 persons per household. non-family households (780 | 36.1%) represent the smallest median household size with 1.24 persons per household.
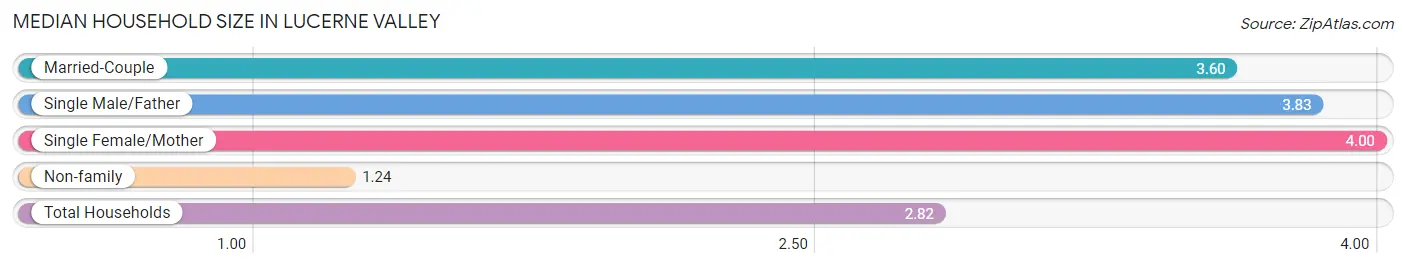
| Household Type | # Households | Household Size |
| Married-Couple | 888 (41.0%) | 3.60 |
| Single Male/Father | 205 (9.5%) | 3.83 |
| Single Female/Mother | 290 (13.4%) | 4.00 |
| Non-family | 780 (36.1%) | 1.24 |
| Total Households | 2,163 (100.0%) | 2.82 |
Household Size by Marriage Status in Lucerne Valley
Out of a total of 2,163 households in Lucerne Valley, 1,383 (63.9%) are family households, while 780 (36.1%) are nonfamily households. The most numerous type of family households are 2-person households, comprising 523, and the most common type of nonfamily households are 1-person households, comprising 666.
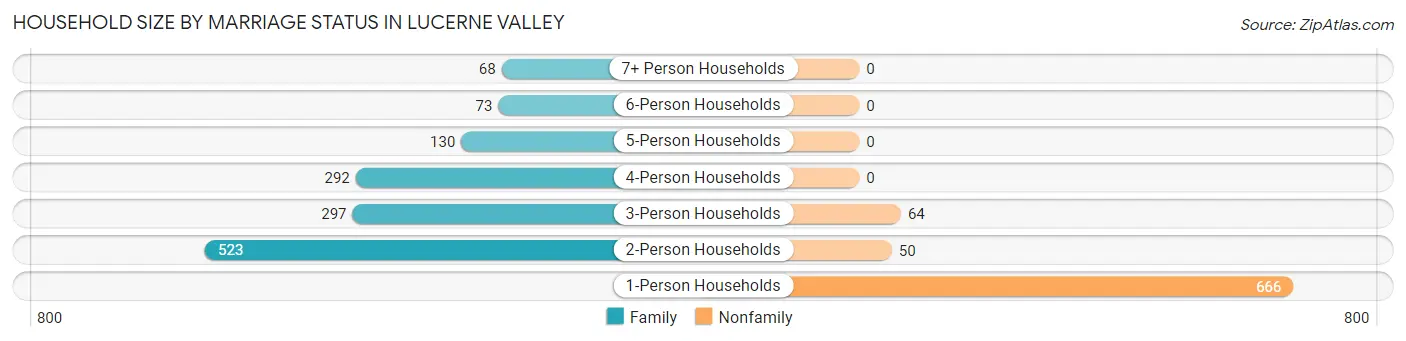
| Household Size | Family Households | Nonfamily Households |
| 1-Person Households | - | 666 (30.8%) |
| 2-Person Households | 523 (24.2%) | 50 (2.3%) |
| 3-Person Households | 297 (13.7%) | 64 (3.0%) |
| 4-Person Households | 292 (13.5%) | 0 (0.0%) |
| 5-Person Households | 130 (6.0%) | 0 (0.0%) |
| 6-Person Households | 73 (3.4%) | 0 (0.0%) |
| 7+ Person Households | 68 (3.1%) | 0 (0.0%) |
| Total | 1,383 (63.9%) | 780 (36.1%) |
Female Fertility in Lucerne Valley
Fertility by Age in Lucerne Valley
Average fertility rate in Lucerne Valley is 37.0 births per 1,000 women. Women in the age bracket of 20 to 34 years have the highest fertility rate with 90.0 births per 1,000 women. Women in the age bracket of 20 to 34 years acount for 100.0% of all women with births.
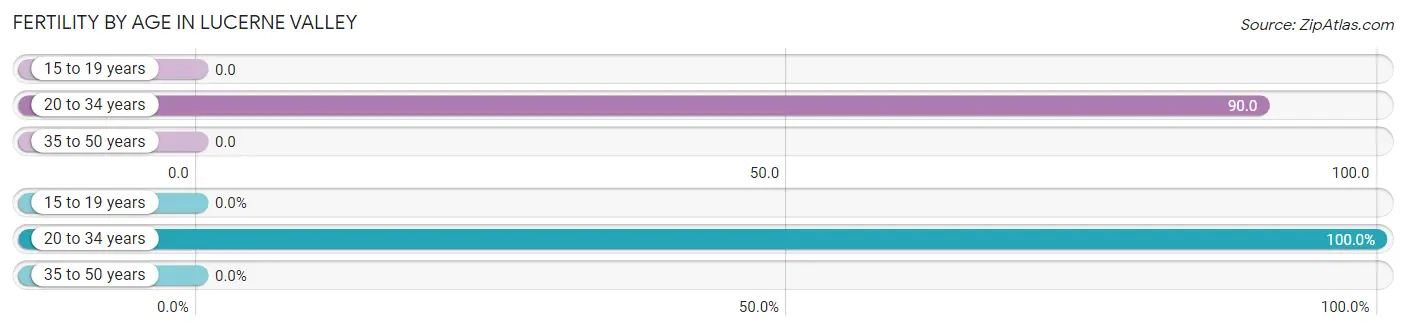
| Age Bracket | Women with Births | Births / 1,000 Women |
| 15 to 19 years | 0 (0.0%) | 0.0 |
| 20 to 34 years | 48 (100.0%) | 90.0 |
| 35 to 50 years | 0 (0.0%) | 0.0 |
| Total | 48 (100.0%) | 37.0 |
Fertility by Age by Marriage Status in Lucerne Valley
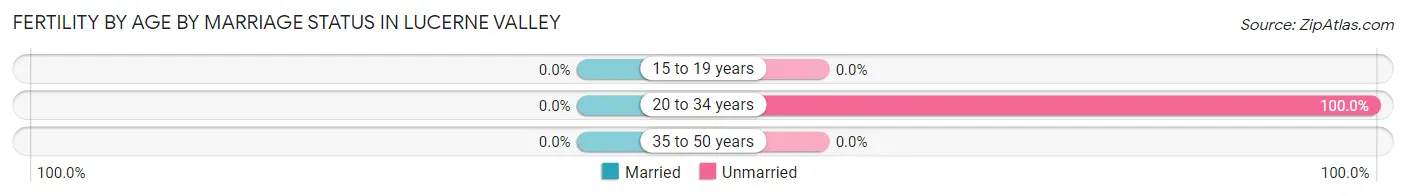
| Age Bracket | Married | Unmarried |
| 15 to 19 years | 0 (0.0%) | 0 (0.0%) |
| 20 to 34 years | 0 (0.0%) | 48 (100.0%) |
| 35 to 50 years | 0 (0.0%) | 0 (0.0%) |
| Total | 0 (0.0%) | 48 (100.0%) |
Fertility by Education in Lucerne Valley
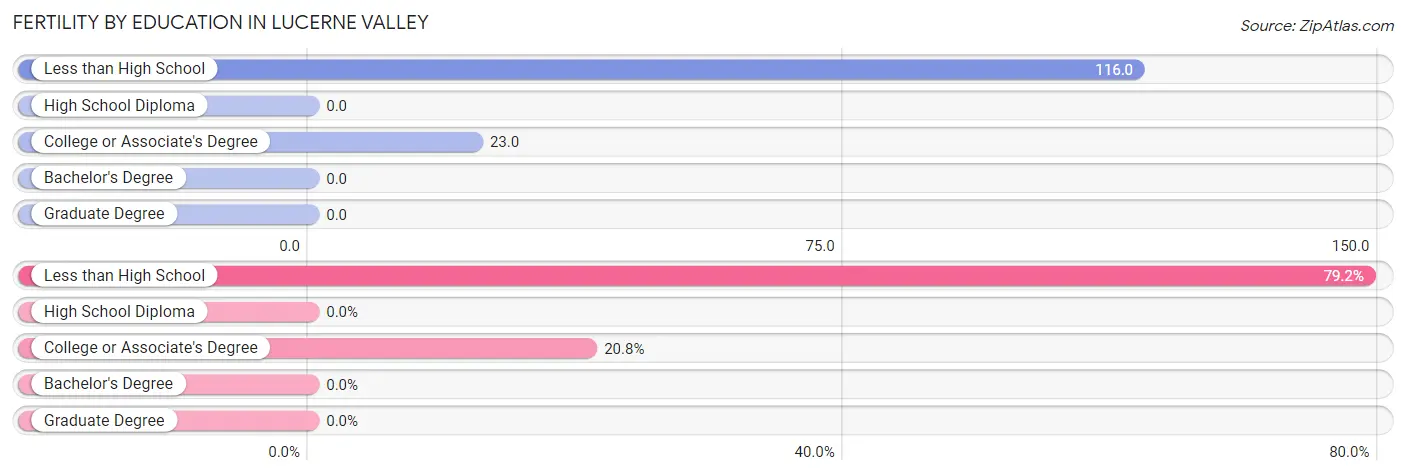
| Educational Attainment | Women with Births | Births / 1,000 Women |
| Less than High School | 38 (79.2%) | 116.0 |
| High School Diploma | 0 (0.0%) | 0.0 |
| College or Associate's Degree | 10 (20.8%) | 23.0 |
| Bachelor's Degree | 0 (0.0%) | 0.0 |
| Graduate Degree | 0 (0.0%) | 0.0 |
| Total | 48 (100.0%) | 37.0 |
Fertility by Education by Marriage Status in Lucerne Valley
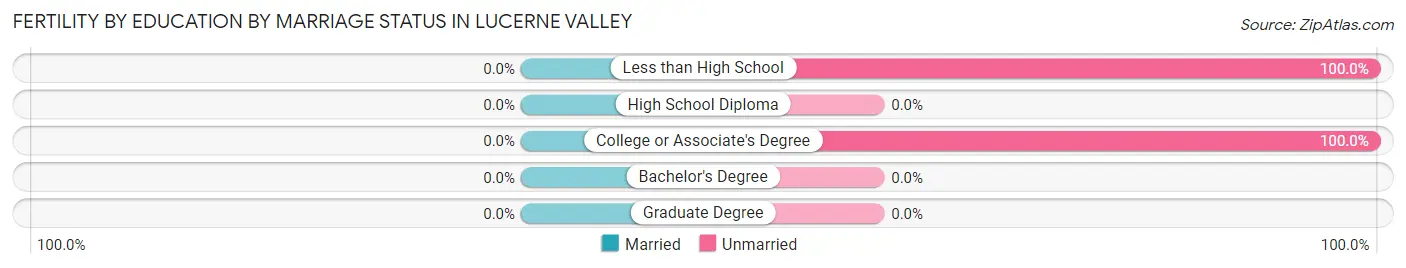
| Educational Attainment | Married | Unmarried |
| Less than High School | 0 (0.0%) | 38 (100.0%) |
| High School Diploma | 0 (0.0%) | 0 (0.0%) |
| College or Associate's Degree | 0 (0.0%) | 10 (100.0%) |
| Bachelor's Degree | 0 (0.0%) | 0 (0.0%) |
| Graduate Degree | 0 (0.0%) | 0 (0.0%) |
| Total | 0 (0.0%) | 48 (100.0%) |
Employment Characteristics in Lucerne Valley
Employment by Class of Employer in Lucerne Valley
Among the 1,619 employed individuals in Lucerne Valley, private company employees (998 | 61.6%), self-employed (not incorporated) (237 | 14.6%), and not-for-profit organizations (150 | 9.3%) make up the most common classes of employment.
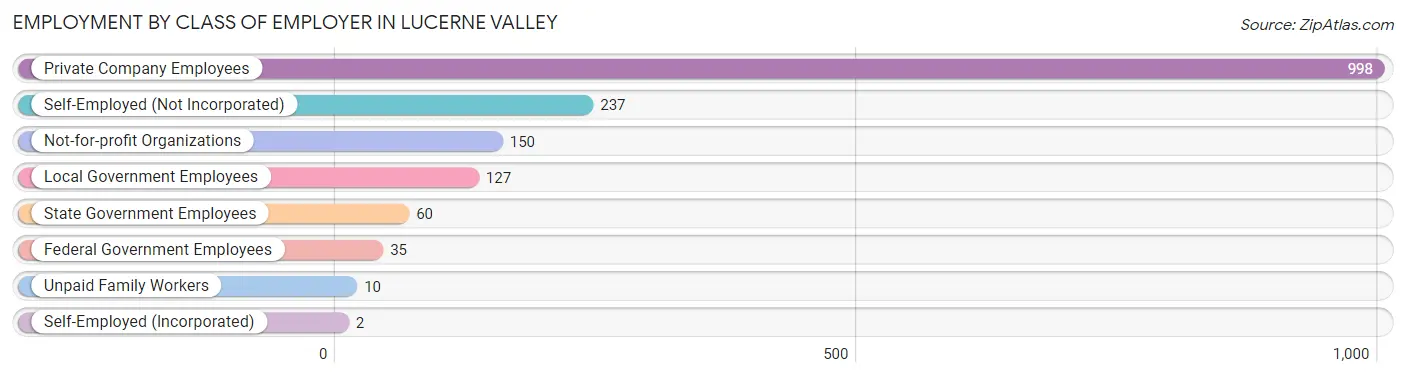
| Employer Class | # Employees | % Employees |
| Private Company Employees | 998 | 61.6% |
| Self-Employed (Incorporated) | 2 | 0.1% |
| Self-Employed (Not Incorporated) | 237 | 14.6% |
| Not-for-profit Organizations | 150 | 9.3% |
| Local Government Employees | 127 | 7.8% |
| State Government Employees | 60 | 3.7% |
| Federal Government Employees | 35 | 2.2% |
| Unpaid Family Workers | 10 | 0.6% |
| Total | 1,619 | 100.0% |
Employment Status by Age in Lucerne Valley
According to the labor force statistics for Lucerne Valley, out of the total population over 16 years of age (4,807), 44.8% or 2,154 individuals are in the labor force, with 21.7% or 467 of them unemployed. The age group with the highest labor force participation rate is 25 to 29 years, with 84.9% or 325 individuals in the labor force. Within the labor force, the 16 to 19 years age range has the highest percentage of unemployed individuals, with 42.6% or 52 of them being unemployed.
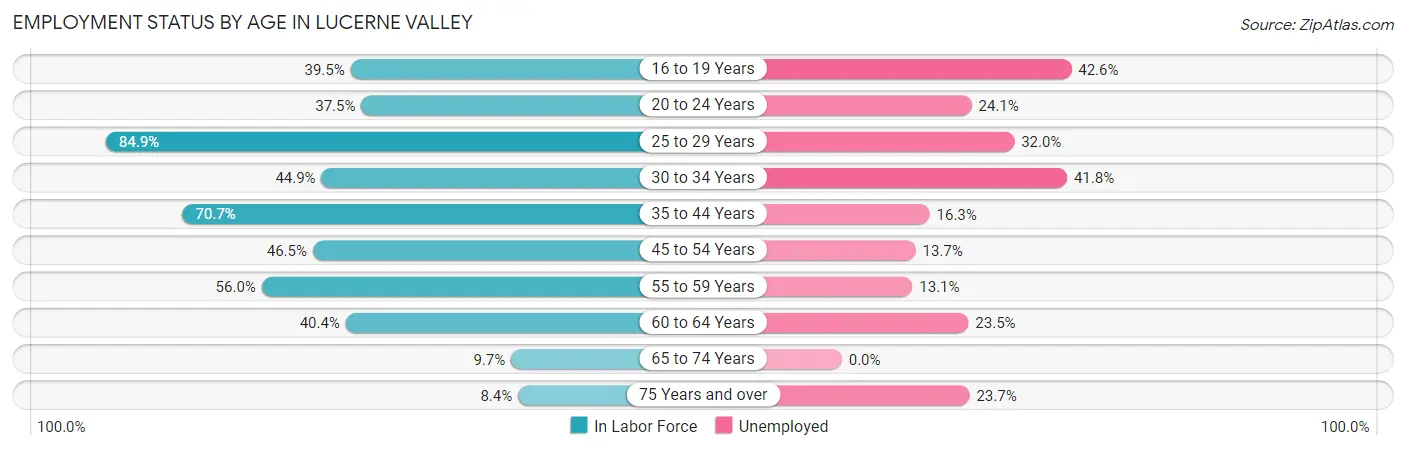
| Age Bracket | In Labor Force | Unemployed |
| 16 to 19 Years | 122 (39.5%) | 52 (42.6%) |
| 20 to 24 Years | 137 (37.5%) | 33 (24.1%) |
| 25 to 29 Years | 325 (84.9%) | 104 (32.0%) |
| 30 to 34 Years | 122 (44.9%) | 51 (41.8%) |
| 35 to 44 Years | 584 (70.7%) | 95 (16.3%) |
| 45 to 54 Years | 314 (46.5%) | 43 (13.7%) |
| 55 to 59 Years | 260 (56.0%) | 34 (13.1%) |
| 60 to 64 Years | 196 (40.4%) | 46 (23.5%) |
| 65 to 74 Years | 56 (9.7%) | 0 (0.0%) |
| 75 Years and over | 38 (8.4%) | 9 (23.7%) |
| Total | 2,154 (44.8%) | 467 (21.7%) |
Employment Status by Educational Attainment in Lucerne Valley
According to labor force statistics for Lucerne Valley, 58.0% of individuals (1,801) out of the total population between 25 and 64 years of age (3,105) are in the labor force, with 20.7% or 373 of them being unemployed. The group with the highest labor force participation rate are those with the educational attainment of college / associate degree, with 65.8% or 678 individuals in the labor force. Within the labor force, individuals with less than high school education have the highest percentage of unemployment, with 25.0% or 87 of them being unemployed.
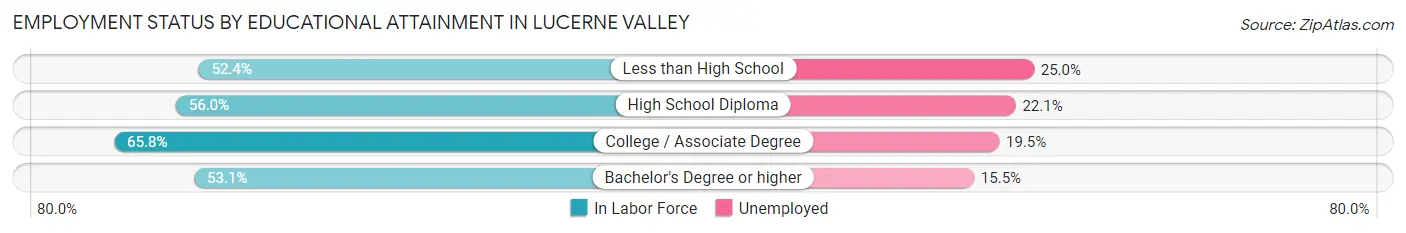
| Educational Attainment | In Labor Force | Unemployed |
| Less than High School | 348 (52.4%) | 166 (25.0%) |
| High School Diploma | 517 (56.0%) | 204 (22.1%) |
| College / Associate Degree | 678 (65.8%) | 201 (19.5%) |
| Bachelor's Degree or higher | 258 (53.1%) | 75 (15.5%) |
| Total | 1,801 (58.0%) | 643 (20.7%) |
Employment Occupations by Sex in Lucerne Valley
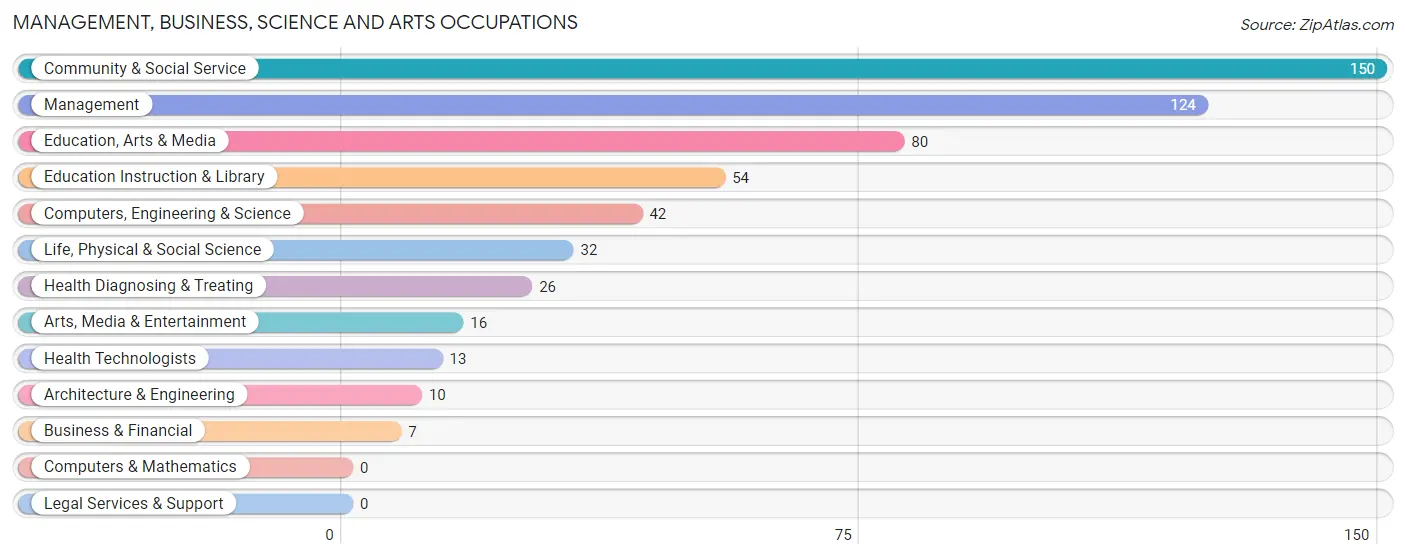
Management, Business, Science and Arts Occupations
The most common Management, Business, Science and Arts occupations in Lucerne Valley are Community & Social Service (150 | 8.9%), Management (124 | 7.3%), Education, Arts & Media (80 | 4.7%), Education Instruction & Library (54 | 3.2%), and Computers, Engineering & Science (42 | 2.5%).
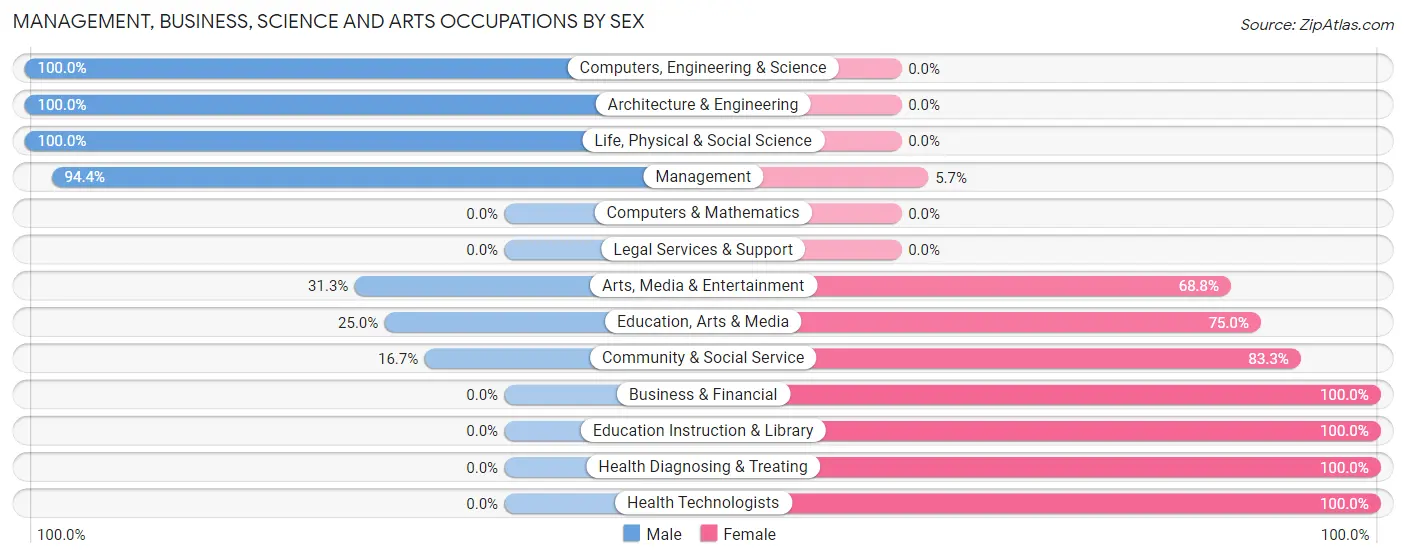
Management, Business, Science and Arts Occupations by Sex
Within the Management, Business, Science and Arts occupations in Lucerne Valley, the most male-oriented occupations are Computers, Engineering & Science (100.0%), Architecture & Engineering (100.0%), and Life, Physical & Social Science (100.0%), while the most female-oriented occupations are Business & Financial (100.0%), Education Instruction & Library (100.0%), and Health Diagnosing & Treating (100.0%).
| Occupation | Male | Female |
| Management | 117 (94.4%) | 7 (5.7%) |
| Business & Financial | 0 (0.0%) | 7 (100.0%) |
| Computers, Engineering & Science | 42 (100.0%) | 0 (0.0%) |
| Computers & Mathematics | 0 (0.0%) | 0 (0.0%) |
| Architecture & Engineering | 10 (100.0%) | 0 (0.0%) |
| Life, Physical & Social Science | 32 (100.0%) | 0 (0.0%) |
| Community & Social Service | 25 (16.7%) | 125 (83.3%) |
| Education, Arts & Media | 20 (25.0%) | 60 (75.0%) |
| Legal Services & Support | 0 (0.0%) | 0 (0.0%) |
| Education Instruction & Library | 0 (0.0%) | 54 (100.0%) |
| Arts, Media & Entertainment | 5 (31.2%) | 11 (68.8%) |
| Health Diagnosing & Treating | 0 (0.0%) | 26 (100.0%) |
| Health Technologists | 0 (0.0%) | 13 (100.0%) |
| Total (Category) | 184 (52.7%) | 165 (47.3%) |
| Total (Overall) | 1,060 (62.8%) | 627 (37.2%) |
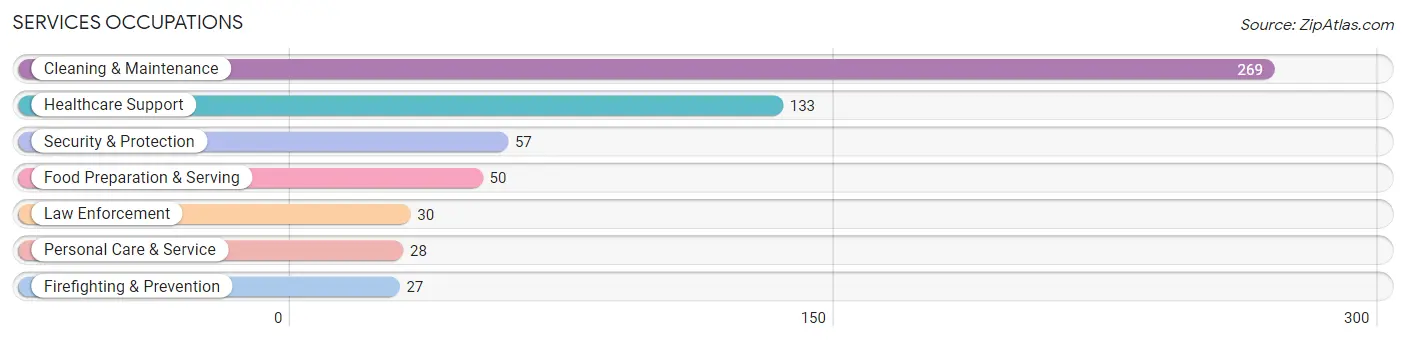
Services Occupations
The most common Services occupations in Lucerne Valley are Cleaning & Maintenance (269 | 16.0%), Healthcare Support (133 | 7.9%), Security & Protection (57 | 3.4%), Food Preparation & Serving (50 | 3.0%), and Law Enforcement (30 | 1.8%).
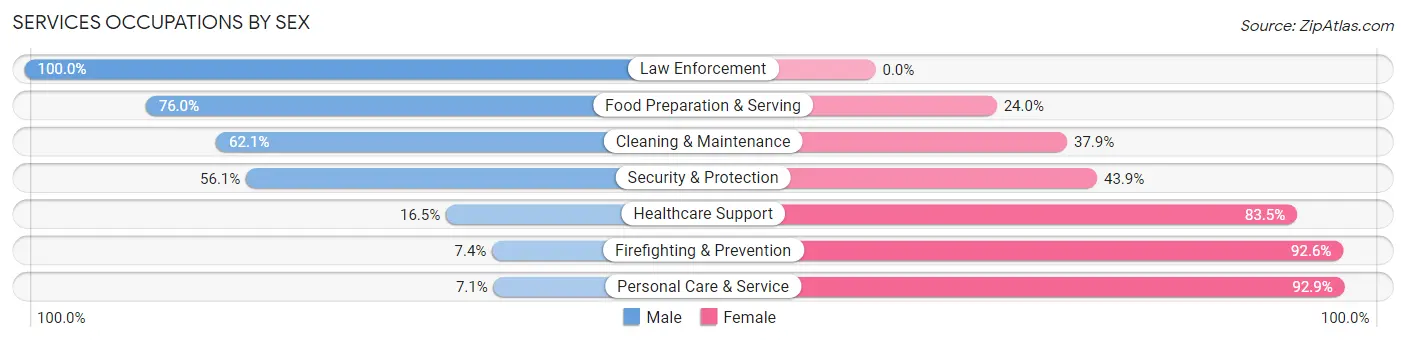
Services Occupations by Sex
Within the Services occupations in Lucerne Valley, the most male-oriented occupations are Law Enforcement (100.0%), Food Preparation & Serving (76.0%), and Cleaning & Maintenance (62.1%), while the most female-oriented occupations are Personal Care & Service (92.9%), Firefighting & Prevention (92.6%), and Healthcare Support (83.5%).
| Occupation | Male | Female |
| Healthcare Support | 22 (16.5%) | 111 (83.5%) |
| Security & Protection | 32 (56.1%) | 25 (43.9%) |
| Firefighting & Prevention | 2 (7.4%) | 25 (92.6%) |
| Law Enforcement | 30 (100.0%) | 0 (0.0%) |
| Food Preparation & Serving | 38 (76.0%) | 12 (24.0%) |
| Cleaning & Maintenance | 167 (62.1%) | 102 (37.9%) |
| Personal Care & Service | 2 (7.1%) | 26 (92.9%) |
| Total (Category) | 261 (48.6%) | 276 (51.4%) |
| Total (Overall) | 1,060 (62.8%) | 627 (37.2%) |
Sales and Office Occupations
The most common Sales and Office occupations in Lucerne Valley are Office & Administration (163 | 9.7%), and Sales & Related (47 | 2.8%).
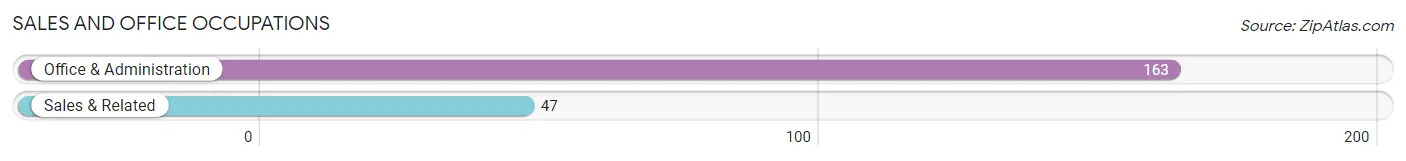
Sales and Office Occupations by Sex
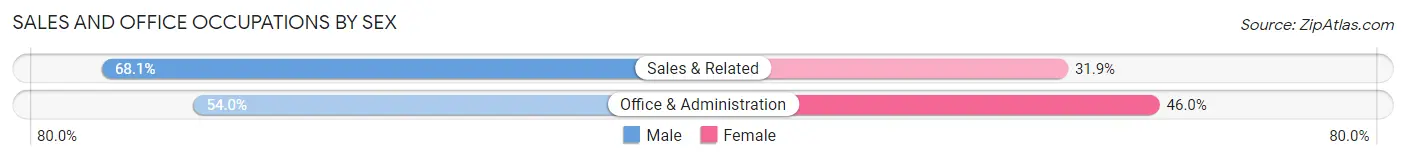
| Occupation | Male | Female |
| Sales & Related | 32 (68.1%) | 15 (31.9%) |
| Office & Administration | 88 (54.0%) | 75 (46.0%) |
| Total (Category) | 120 (57.1%) | 90 (42.9%) |
| Total (Overall) | 1,060 (62.8%) | 627 (37.2%) |
Natural Resources, Construction and Maintenance Occupations
The most common Natural Resources, Construction and Maintenance occupations in Lucerne Valley are Construction & Extraction (169 | 10.0%), Installation, Maintenance & Repair (117 | 6.9%), and Farming, Fishing & Forestry (33 | 2.0%).
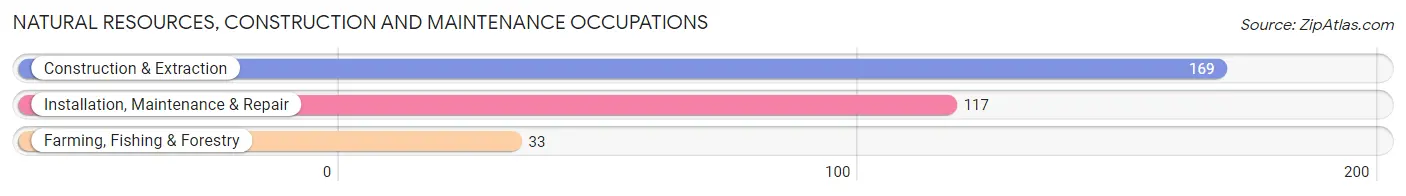
Natural Resources, Construction and Maintenance Occupations by Sex
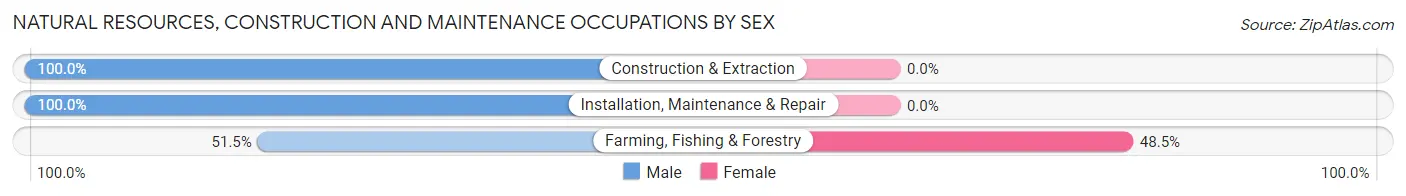
| Occupation | Male | Female |
| Farming, Fishing & Forestry | 17 (51.5%) | 16 (48.5%) |
| Construction & Extraction | 169 (100.0%) | 0 (0.0%) |
| Installation, Maintenance & Repair | 117 (100.0%) | 0 (0.0%) |
| Total (Category) | 303 (95.0%) | 16 (5.0%) |
| Total (Overall) | 1,060 (62.8%) | 627 (37.2%) |
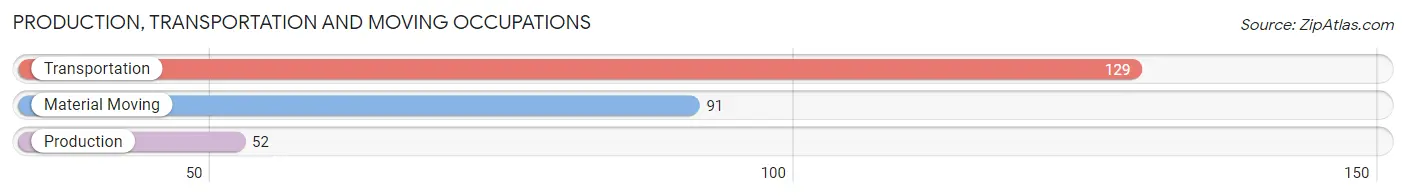
Production, Transportation and Moving Occupations
The most common Production, Transportation and Moving occupations in Lucerne Valley are Transportation (129 | 7.6%), Material Moving (91 | 5.4%), and Production (52 | 3.1%).
Production, Transportation and Moving Occupations by Sex
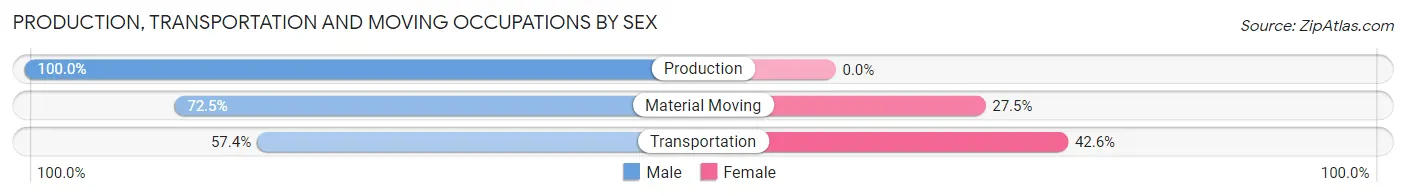
| Occupation | Male | Female |
| Production | 52 (100.0%) | 0 (0.0%) |
| Transportation | 74 (57.4%) | 55 (42.6%) |
| Material Moving | 66 (72.5%) | 25 (27.5%) |
| Total (Category) | 192 (70.6%) | 80 (29.4%) |
| Total (Overall) | 1,060 (62.8%) | 627 (37.2%) |
Employment Industries by Sex in Lucerne Valley
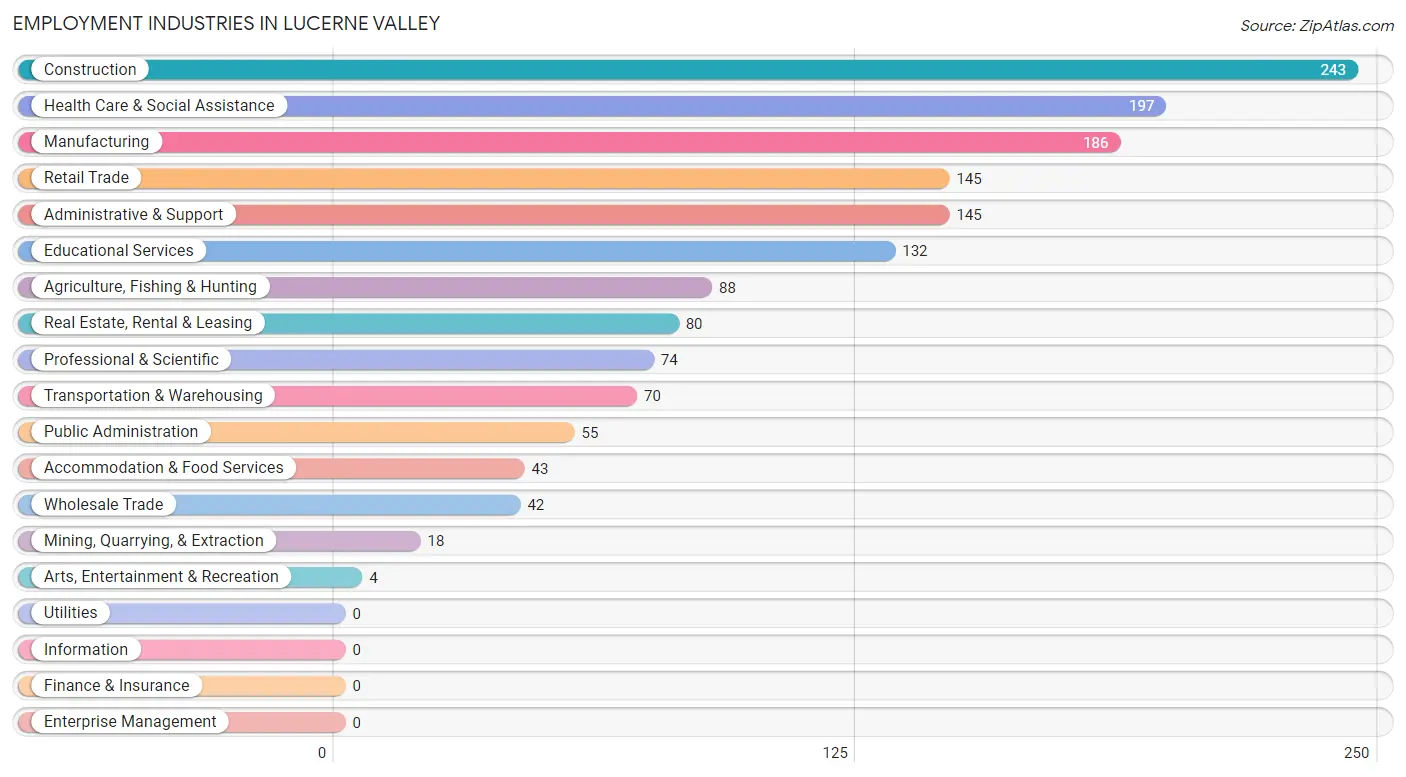
Employment Industries in Lucerne Valley
The major employment industries in Lucerne Valley include Construction (243 | 14.4%), Health Care & Social Assistance (197 | 11.7%), Manufacturing (186 | 11.0%), Retail Trade (145 | 8.6%), and Administrative & Support (145 | 8.6%).
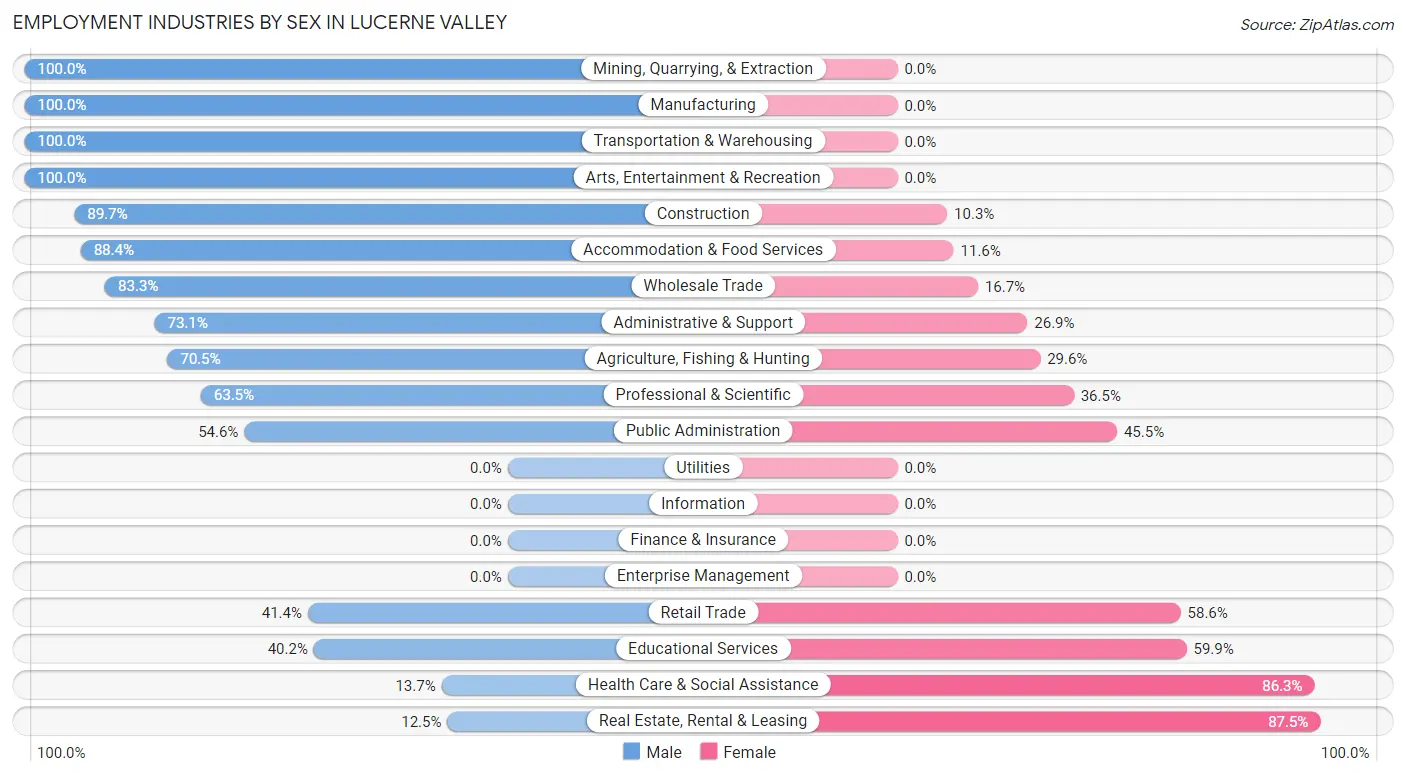
Employment Industries by Sex in Lucerne Valley
The Lucerne Valley industries that see more men than women are Mining, Quarrying, & Extraction (100.0%), Manufacturing (100.0%), and Transportation & Warehousing (100.0%), whereas the industries that tend to have a higher number of women are Real Estate, Rental & Leasing (87.5%), Health Care & Social Assistance (86.3%), and Educational Services (59.9%).
| Industry | Male | Female |
| Agriculture, Fishing & Hunting | 62 (70.5%) | 26 (29.5%) |
| Mining, Quarrying, & Extraction | 18 (100.0%) | 0 (0.0%) |
| Construction | 218 (89.7%) | 25 (10.3%) |
| Manufacturing | 186 (100.0%) | 0 (0.0%) |
| Wholesale Trade | 35 (83.3%) | 7 (16.7%) |
| Retail Trade | 60 (41.4%) | 85 (58.6%) |
| Transportation & Warehousing | 70 (100.0%) | 0 (0.0%) |
| Utilities | 0 (0.0%) | 0 (0.0%) |
| Information | 0 (0.0%) | 0 (0.0%) |
| Finance & Insurance | 0 (0.0%) | 0 (0.0%) |
| Real Estate, Rental & Leasing | 10 (12.5%) | 70 (87.5%) |
| Professional & Scientific | 47 (63.5%) | 27 (36.5%) |
| Enterprise Management | 0 (0.0%) | 0 (0.0%) |
| Administrative & Support | 106 (73.1%) | 39 (26.9%) |
| Educational Services | 53 (40.2%) | 79 (59.9%) |
| Health Care & Social Assistance | 27 (13.7%) | 170 (86.3%) |
| Arts, Entertainment & Recreation | 4 (100.0%) | 0 (0.0%) |
| Accommodation & Food Services | 38 (88.4%) | 5 (11.6%) |
| Public Administration | 30 (54.5%) | 25 (45.5%) |
| Total | 1,060 (62.8%) | 627 (37.2%) |
Education in Lucerne Valley
School Enrollment in Lucerne Valley
The most common levels of schooling among the 1,257 students in Lucerne Valley are elementary school (364 | 29.0%), high school (267 | 21.2%), and middle school (255 | 20.3%).
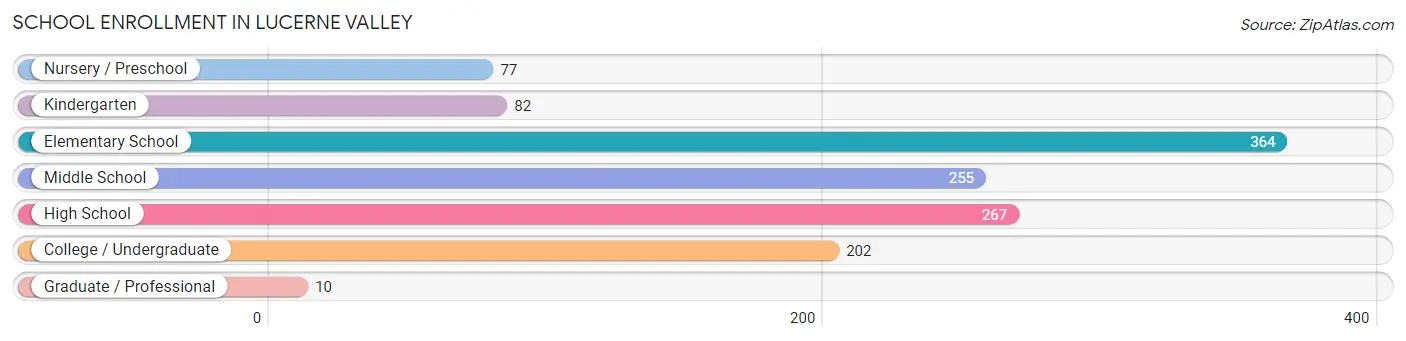
| School Level | # Students | % Students |
| Nursery / Preschool | 77 | 6.1% |
| Kindergarten | 82 | 6.5% |
| Elementary School | 364 | 29.0% |
| Middle School | 255 | 20.3% |
| High School | 267 | 21.2% |
| College / Undergraduate | 202 | 16.1% |
| Graduate / Professional | 10 | 0.8% |
| Total | 1,257 | 100.0% |
School Enrollment by Age by Funding Source in Lucerne Valley
Out of a total of 1,257 students who are enrolled in schools in Lucerne Valley, 67 (5.3%) attend a private institution, while the remaining 1,190 (94.7%) are enrolled in public schools. The age group of 35 years and over has the highest likelihood of being enrolled in private schools, with 41 (100.0% in the age bracket) enrolled. Conversely, the age group of 3 to 4 year olds has the lowest likelihood of being enrolled in a private school, with 77 (100.0% in the age bracket) attending a public institution.
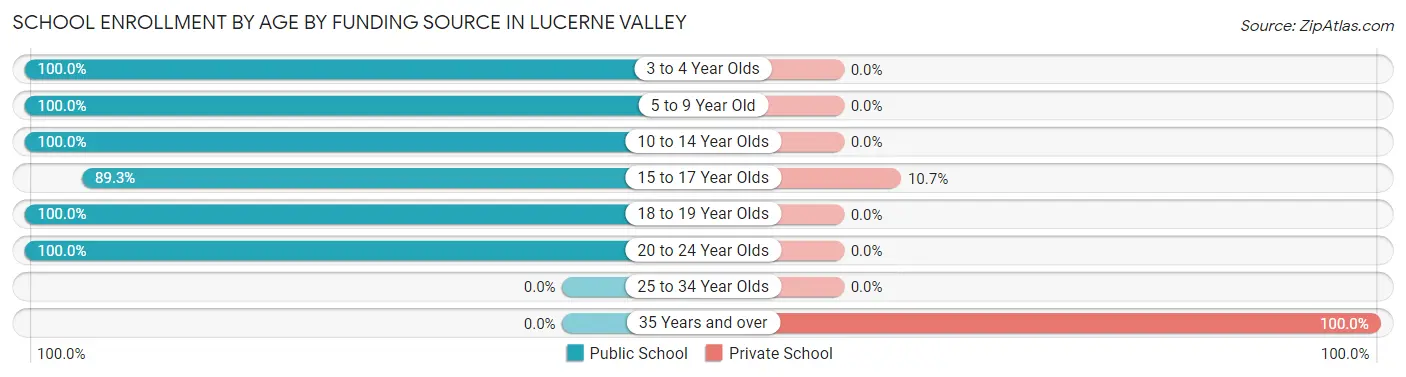
| Age Bracket | Public School | Private School |
| 3 to 4 Year Olds | 77 (100.0%) | 0 (0.0%) |
| 5 to 9 Year Old | 342 (100.0%) | 0 (0.0%) |
| 10 to 14 Year Olds | 391 (100.0%) | 0 (0.0%) |
| 15 to 17 Year Olds | 209 (89.3%) | 25 (10.7%) |
| 18 to 19 Year Olds | 52 (100.0%) | 0 (0.0%) |
| 20 to 24 Year Olds | 120 (100.0%) | 0 (0.0%) |
| 25 to 34 Year Olds | 0 (0.0%) | 0 (0.0%) |
| 35 Years and over | 0 (0.0%) | 41 (100.0%) |
| Total | 1,190 (94.7%) | 67 (5.3%) |
Educational Attainment by Field of Study in Lucerne Valley
Business (143 | 20.1%), visual & performing arts (106 | 14.9%), science & technology (82 | 11.6%), bio, nature & agricultural (61 | 8.6%), and psychology (60 | 8.5%) are the most common fields of study among 710 individuals in Lucerne Valley who have obtained a bachelor's degree or higher.
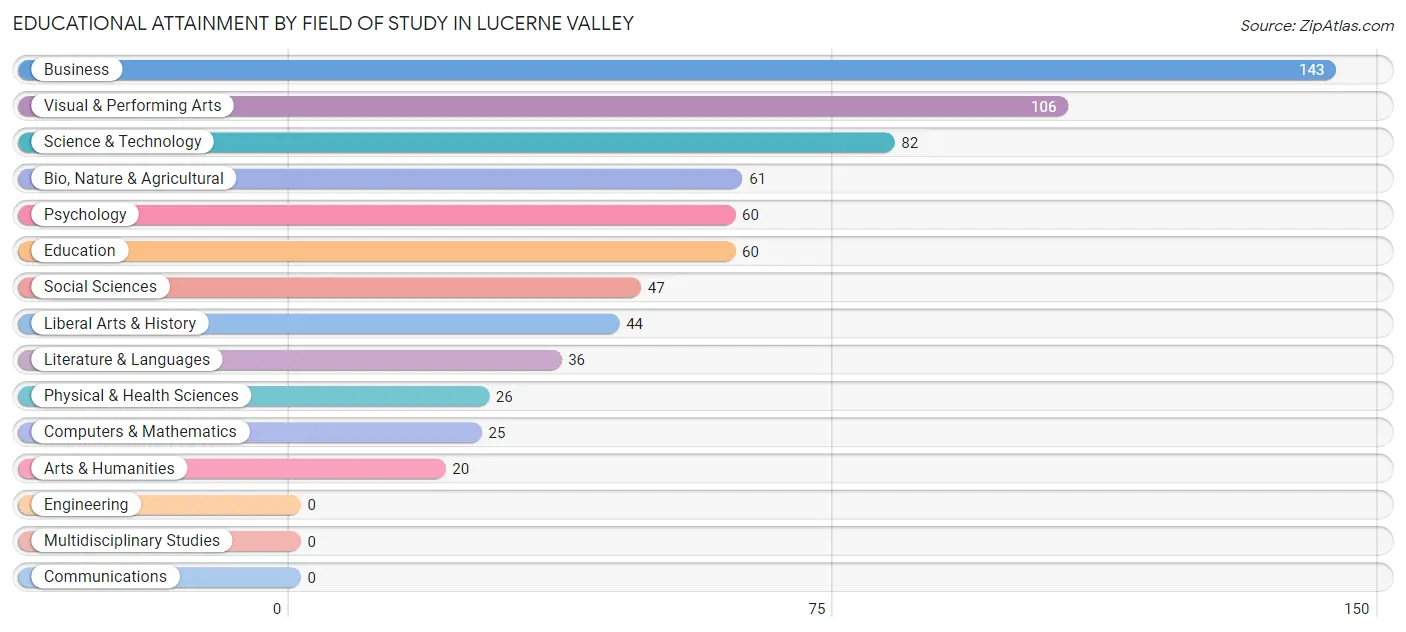
| Field of Study | # Graduates | % Graduates |
| Computers & Mathematics | 25 | 3.5% |
| Bio, Nature & Agricultural | 61 | 8.6% |
| Physical & Health Sciences | 26 | 3.7% |
| Psychology | 60 | 8.5% |
| Social Sciences | 47 | 6.6% |
| Engineering | 0 | 0.0% |
| Multidisciplinary Studies | 0 | 0.0% |
| Science & Technology | 82 | 11.6% |
| Business | 143 | 20.1% |
| Education | 60 | 8.5% |
| Literature & Languages | 36 | 5.1% |
| Liberal Arts & History | 44 | 6.2% |
| Visual & Performing Arts | 106 | 14.9% |
| Communications | 0 | 0.0% |
| Arts & Humanities | 20 | 2.8% |
| Total | 710 | 100.0% |
Transportation & Commute in Lucerne Valley
Vehicle Availability by Sex in Lucerne Valley
The most prevalent vehicle ownership categories in Lucerne Valley are males with 2 vehicles (366, accounting for 36.6%) and females with 2 vehicles (132, making up 63.8%).
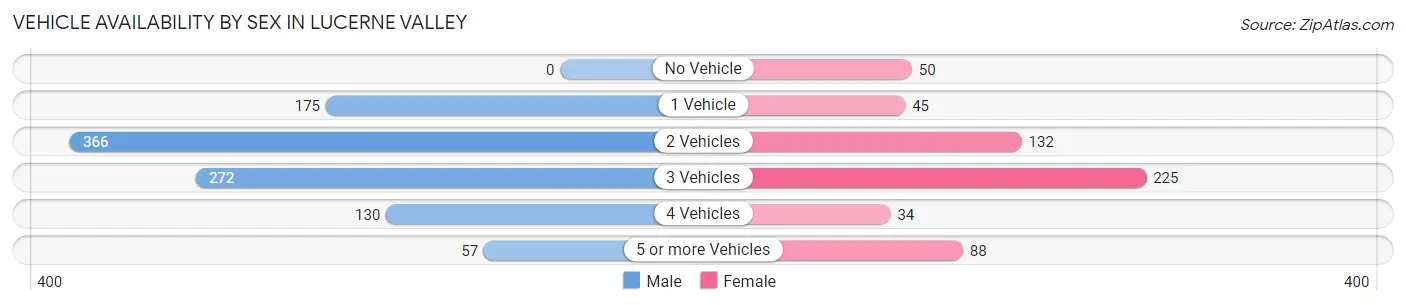
| Vehicles Available | Male | Female |
| No Vehicle | 0 (0.0%) | 50 (8.7%) |
| 1 Vehicle | 175 (17.5%) | 45 (7.8%) |
| 2 Vehicles | 366 (36.6%) | 132 (23.0%) |
| 3 Vehicles | 272 (27.2%) | 225 (39.2%) |
| 4 Vehicles | 130 (13.0%) | 34 (5.9%) |
| 5 or more Vehicles | 57 (5.7%) | 88 (15.3%) |
| Total | 1,000 (100.0%) | 574 (100.0%) |
Commute Time in Lucerne Valley
The most frequently occuring commute durations in Lucerne Valley are 90 or more minutes (355 commuters, 23.9%), 30 to 34 minutes (334 commuters, 22.5%), and 45 to 59 minutes (155 commuters, 10.4%).
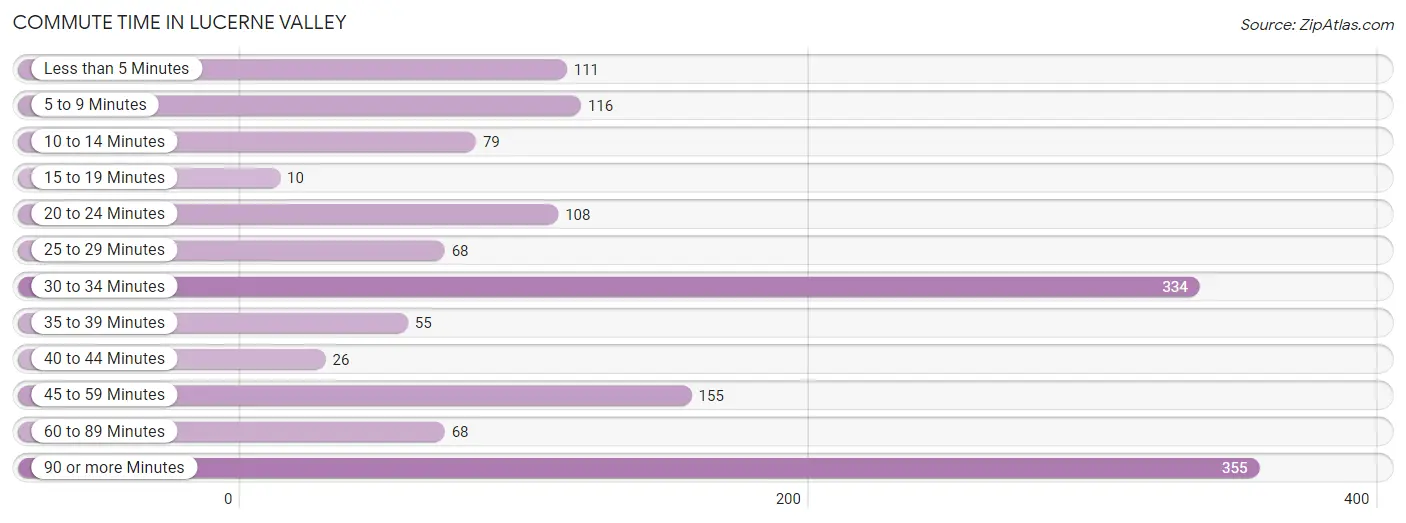
| Commute Time | # Commuters | % Commuters |
| Less than 5 Minutes | 111 | 7.5% |
| 5 to 9 Minutes | 116 | 7.8% |
| 10 to 14 Minutes | 79 | 5.3% |
| 15 to 19 Minutes | 10 | 0.7% |
| 20 to 24 Minutes | 108 | 7.3% |
| 25 to 29 Minutes | 68 | 4.6% |
| 30 to 34 Minutes | 334 | 22.5% |
| 35 to 39 Minutes | 55 | 3.7% |
| 40 to 44 Minutes | 26 | 1.8% |
| 45 to 59 Minutes | 155 | 10.4% |
| 60 to 89 Minutes | 68 | 4.6% |
| 90 or more Minutes | 355 | 23.9% |
Commute Time by Sex in Lucerne Valley
The most common commute times in Lucerne Valley are 90 or more minutes (307 commuters, 32.8%) for males and 30 to 34 minutes (181 commuters, 33.0%) for females.
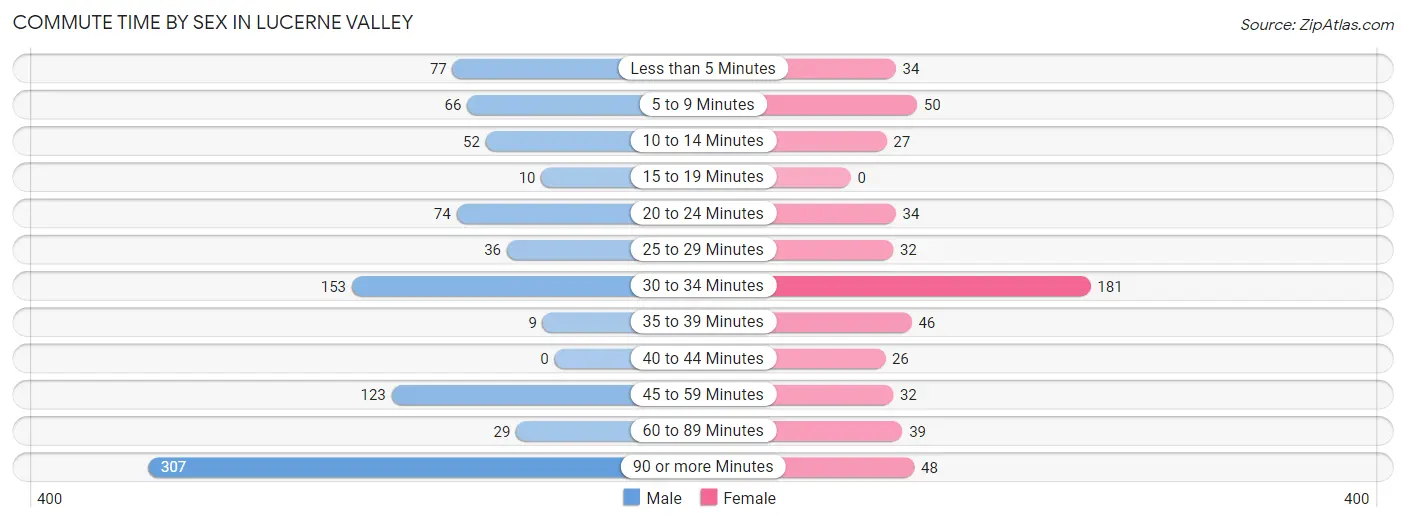
| Commute Time | Male | Female |
| Less than 5 Minutes | 77 (8.2%) | 34 (6.2%) |
| 5 to 9 Minutes | 66 (7.0%) | 50 (9.1%) |
| 10 to 14 Minutes | 52 (5.6%) | 27 (4.9%) |
| 15 to 19 Minutes | 10 (1.1%) | 0 (0.0%) |
| 20 to 24 Minutes | 74 (7.9%) | 34 (6.2%) |
| 25 to 29 Minutes | 36 (3.8%) | 32 (5.8%) |
| 30 to 34 Minutes | 153 (16.4%) | 181 (33.0%) |
| 35 to 39 Minutes | 9 (1.0%) | 46 (8.4%) |
| 40 to 44 Minutes | 0 (0.0%) | 26 (4.7%) |
| 45 to 59 Minutes | 123 (13.1%) | 32 (5.8%) |
| 60 to 89 Minutes | 29 (3.1%) | 39 (7.1%) |
| 90 or more Minutes | 307 (32.8%) | 48 (8.7%) |
Time of Departure to Work by Sex in Lucerne Valley
The most frequent times of departure to work in Lucerne Valley are 12:00 AM to 4:59 AM (212, 22.7%) for males and 9:00 AM to 9:59 AM (130, 23.7%) for females.
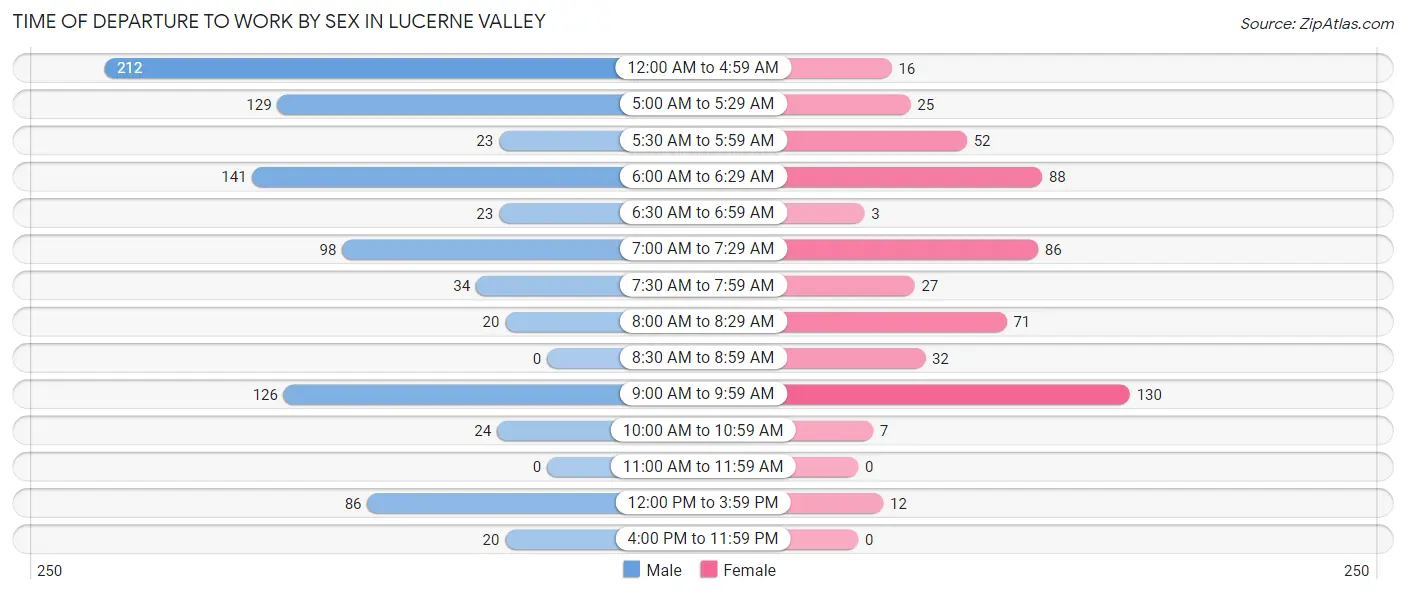
| Time of Departure | Male | Female |
| 12:00 AM to 4:59 AM | 212 (22.7%) | 16 (2.9%) |
| 5:00 AM to 5:29 AM | 129 (13.8%) | 25 (4.5%) |
| 5:30 AM to 5:59 AM | 23 (2.5%) | 52 (9.5%) |
| 6:00 AM to 6:29 AM | 141 (15.1%) | 88 (16.0%) |
| 6:30 AM to 6:59 AM | 23 (2.5%) | 3 (0.5%) |
| 7:00 AM to 7:29 AM | 98 (10.5%) | 86 (15.7%) |
| 7:30 AM to 7:59 AM | 34 (3.6%) | 27 (4.9%) |
| 8:00 AM to 8:29 AM | 20 (2.1%) | 71 (12.9%) |
| 8:30 AM to 8:59 AM | 0 (0.0%) | 32 (5.8%) |
| 9:00 AM to 9:59 AM | 126 (13.5%) | 130 (23.7%) |
| 10:00 AM to 10:59 AM | 24 (2.6%) | 7 (1.3%) |
| 11:00 AM to 11:59 AM | 0 (0.0%) | 0 (0.0%) |
| 12:00 PM to 3:59 PM | 86 (9.2%) | 12 (2.2%) |
| 4:00 PM to 11:59 PM | 20 (2.1%) | 0 (0.0%) |
| Total | 936 (100.0%) | 549 (100.0%) |
Housing Occupancy in Lucerne Valley
Occupancy by Ownership in Lucerne Valley
Of the total 2,163 dwellings in Lucerne Valley, owner-occupied units account for 1,433 (66.2%), while renter-occupied units make up 730 (33.8%).
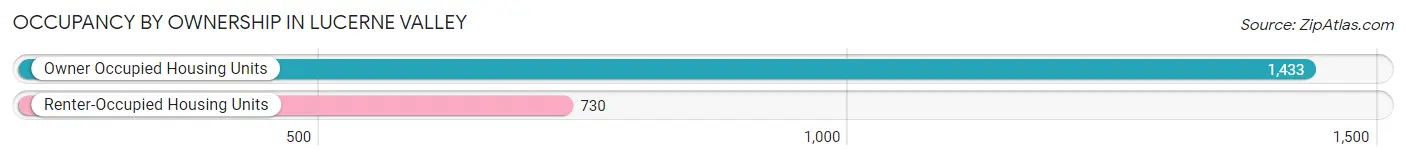
| Occupancy | # Housing Units | % Housing Units |
| Owner Occupied Housing Units | 1,433 | 66.2% |
| Renter-Occupied Housing Units | 730 | 33.8% |
| Total Occupied Housing Units | 2,163 | 100.0% |
Occupancy by Household Size in Lucerne Valley
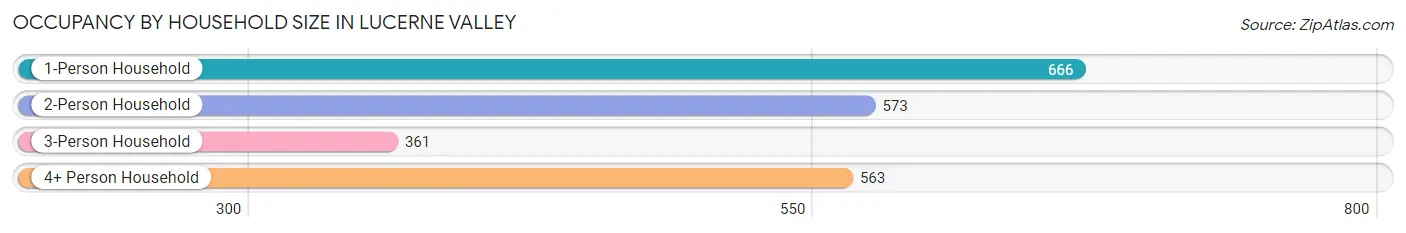
| Household Size | # Housing Units | % Housing Units |
| 1-Person Household | 666 | 30.8% |
| 2-Person Household | 573 | 26.5% |
| 3-Person Household | 361 | 16.7% |
| 4+ Person Household | 563 | 26.0% |
| Total Housing Units | 2,163 | 100.0% |
Occupancy by Ownership by Household Size in Lucerne Valley
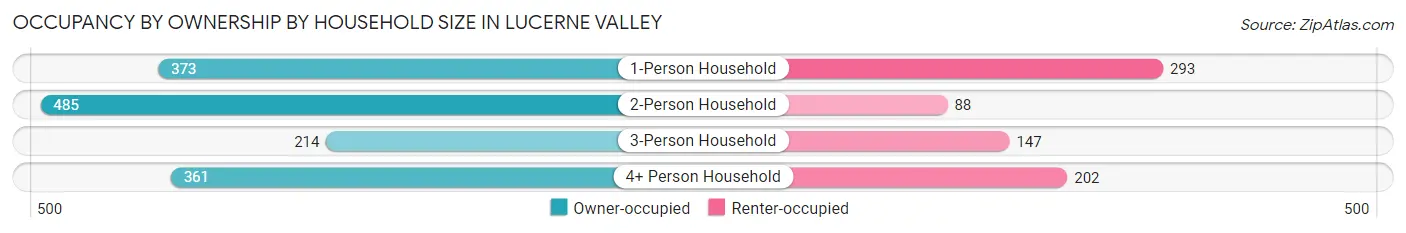
| Household Size | Owner-occupied | Renter-occupied |
| 1-Person Household | 373 (56.0%) | 293 (44.0%) |
| 2-Person Household | 485 (84.6%) | 88 (15.4%) |
| 3-Person Household | 214 (59.3%) | 147 (40.7%) |
| 4+ Person Household | 361 (64.1%) | 202 (35.9%) |
| Total Housing Units | 1,433 (66.2%) | 730 (33.8%) |
Occupancy by Educational Attainment in Lucerne Valley
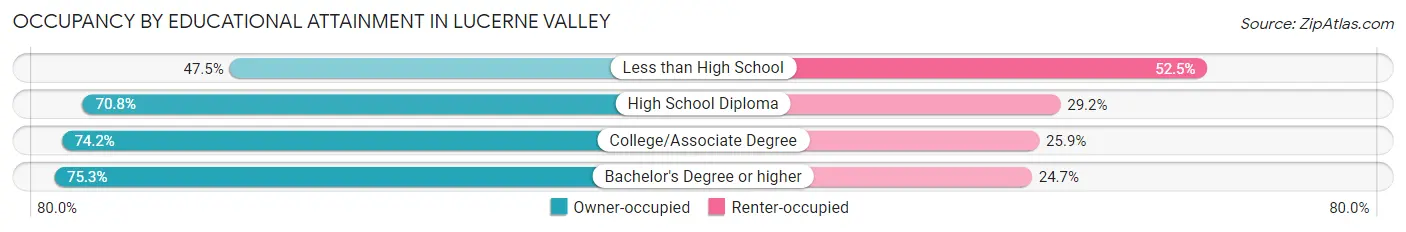
| Household Size | Owner-occupied | Renter-occupied |
| Less than High School | 284 (47.5%) | 314 (52.5%) |
| High School Diploma | 337 (70.8%) | 139 (29.2%) |
| College/Associate Degree | 522 (74.2%) | 182 (25.9%) |
| Bachelor's Degree or higher | 290 (75.3%) | 95 (24.7%) |
Occupancy by Age of Householder in Lucerne Valley
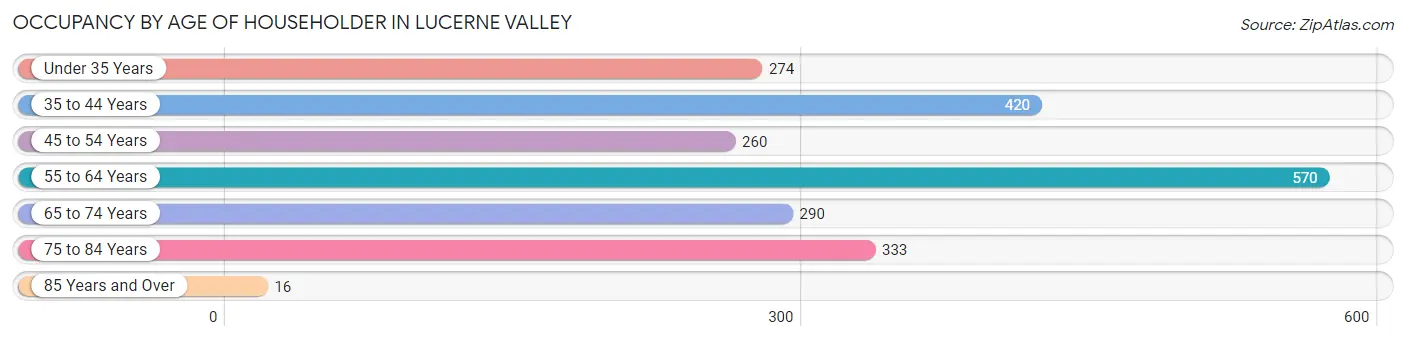
| Age Bracket | # Households | % Households |
| Under 35 Years | 274 | 12.7% |
| 35 to 44 Years | 420 | 19.4% |
| 45 to 54 Years | 260 | 12.0% |
| 55 to 64 Years | 570 | 26.4% |
| 65 to 74 Years | 290 | 13.4% |
| 75 to 84 Years | 333 | 15.4% |
| 85 Years and Over | 16 | 0.7% |
| Total | 2,163 | 100.0% |
Housing Finances in Lucerne Valley
Median Income by Occupancy in Lucerne Valley
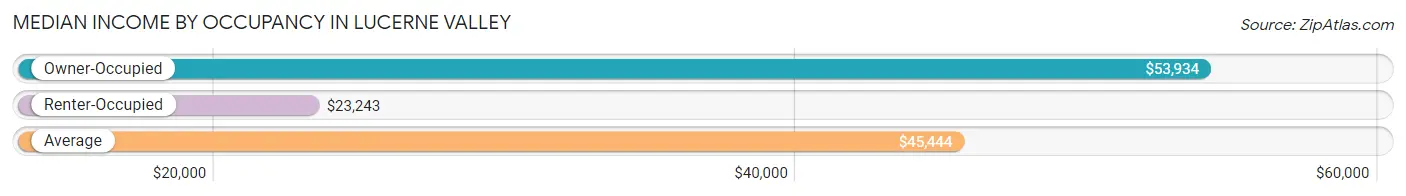
| Occupancy Type | # Households | Median Income |
| Owner-Occupied | 1,433 (66.2%) | $53,934 |
| Renter-Occupied | 730 (33.8%) | $23,243 |
| Average | 2,163 (100.0%) | $45,444 |
Occupancy by Householder Income Bracket in Lucerne Valley
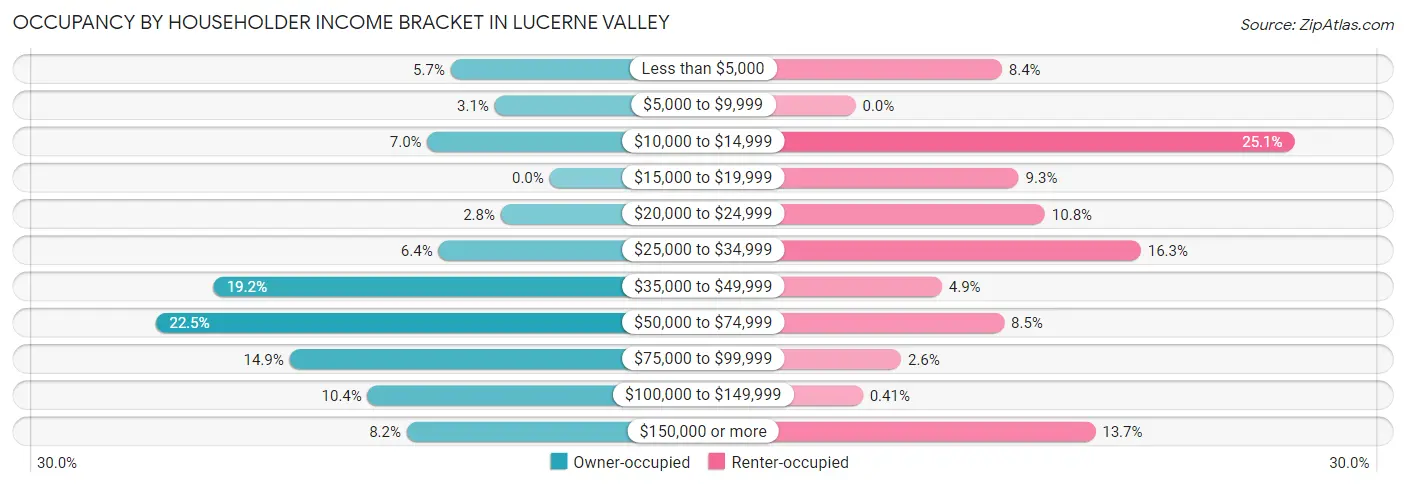
| Income Bracket | Owner-occupied | Renter-occupied |
| Less than $5,000 | 81 (5.7%) | 61 (8.4%) |
| $5,000 to $9,999 | 45 (3.1%) | 0 (0.0%) |
| $10,000 to $14,999 | 100 (7.0%) | 183 (25.1%) |
| $15,000 to $19,999 | 0 (0.0%) | 68 (9.3%) |
| $20,000 to $24,999 | 40 (2.8%) | 79 (10.8%) |
| $25,000 to $34,999 | 91 (6.4%) | 119 (16.3%) |
| $35,000 to $49,999 | 275 (19.2%) | 36 (4.9%) |
| $50,000 to $74,999 | 322 (22.5%) | 62 (8.5%) |
| $75,000 to $99,999 | 213 (14.9%) | 19 (2.6%) |
| $100,000 to $149,999 | 149 (10.4%) | 3 (0.4%) |
| $150,000 or more | 117 (8.2%) | 100 (13.7%) |
| Total | 1,433 (100.0%) | 730 (100.0%) |
Monthly Housing Cost Tiers in Lucerne Valley
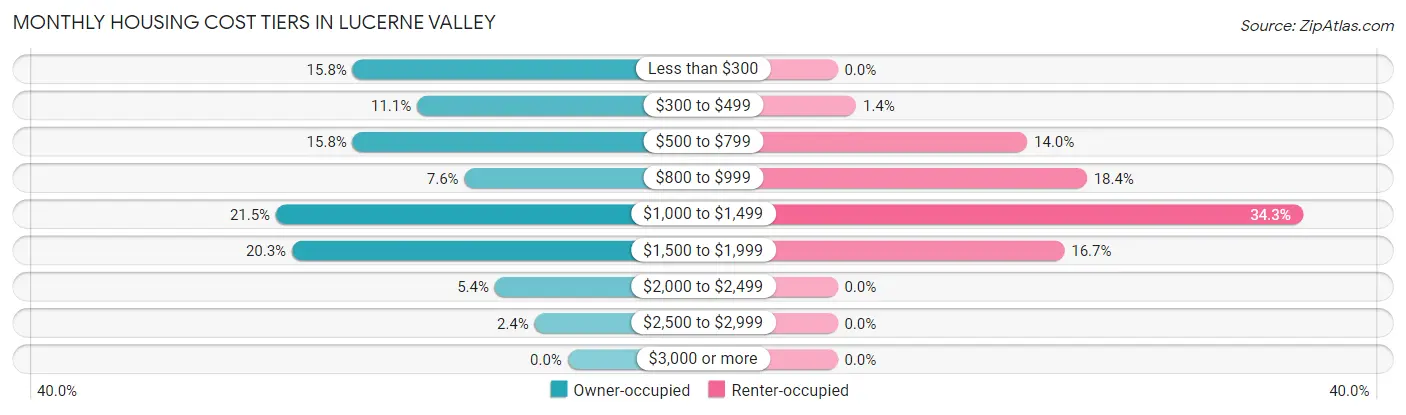
| Monthly Cost | Owner-occupied | Renter-occupied |
| Less than $300 | 227 (15.8%) | 0 (0.0%) |
| $300 to $499 | 159 (11.1%) | 10 (1.4%) |
| $500 to $799 | 227 (15.8%) | 102 (14.0%) |
| $800 to $999 | 109 (7.6%) | 134 (18.4%) |
| $1,000 to $1,499 | 308 (21.5%) | 250 (34.3%) |
| $1,500 to $1,999 | 291 (20.3%) | 122 (16.7%) |
| $2,000 to $2,499 | 77 (5.4%) | 0 (0.0%) |
| $2,500 to $2,999 | 35 (2.4%) | 0 (0.0%) |
| $3,000 or more | 0 (0.0%) | 0 (0.0%) |
| Total | 1,433 (100.0%) | 730 (100.0%) |
Physical Housing Characteristics in Lucerne Valley
Housing Structures in Lucerne Valley
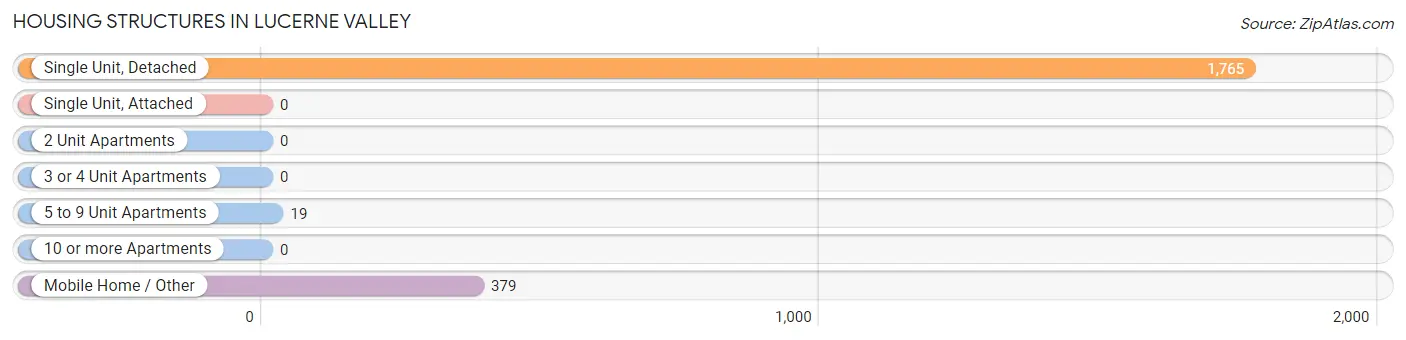
| Structure Type | # Housing Units | % Housing Units |
| Single Unit, Detached | 1,765 | 81.6% |
| Single Unit, Attached | 0 | 0.0% |
| 2 Unit Apartments | 0 | 0.0% |
| 3 or 4 Unit Apartments | 0 | 0.0% |
| 5 to 9 Unit Apartments | 19 | 0.9% |
| 10 or more Apartments | 0 | 0.0% |
| Mobile Home / Other | 379 | 17.5% |
| Total | 2,163 | 100.0% |
Housing Structures by Occupancy in Lucerne Valley
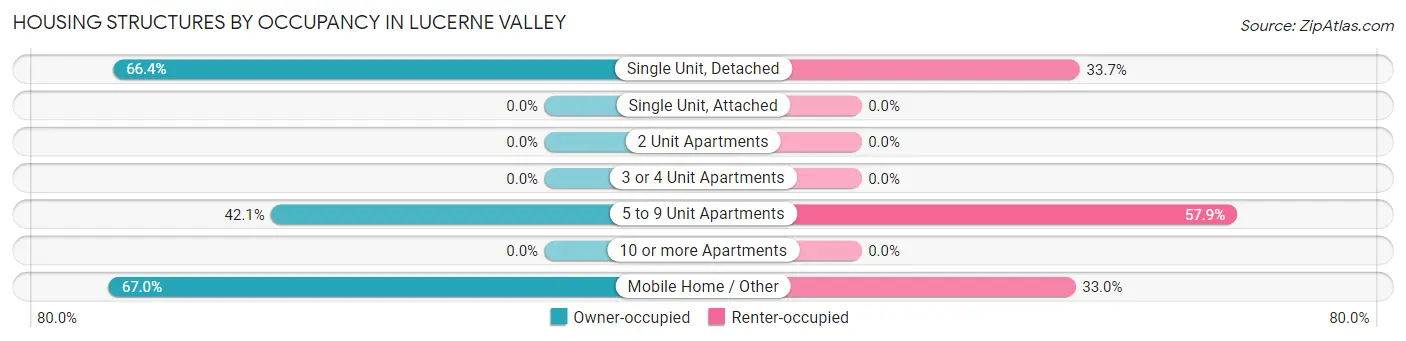
| Structure Type | Owner-occupied | Renter-occupied |
| Single Unit, Detached | 1,171 (66.3%) | 594 (33.7%) |
| Single Unit, Attached | 0 (0.0%) | 0 (0.0%) |
| 2 Unit Apartments | 0 (0.0%) | 0 (0.0%) |
| 3 or 4 Unit Apartments | 0 (0.0%) | 0 (0.0%) |
| 5 to 9 Unit Apartments | 8 (42.1%) | 11 (57.9%) |
| 10 or more Apartments | 0 (0.0%) | 0 (0.0%) |
| Mobile Home / Other | 254 (67.0%) | 125 (33.0%) |
| Total | 1,433 (66.2%) | 730 (33.8%) |
Housing Structures by Number of Rooms in Lucerne Valley
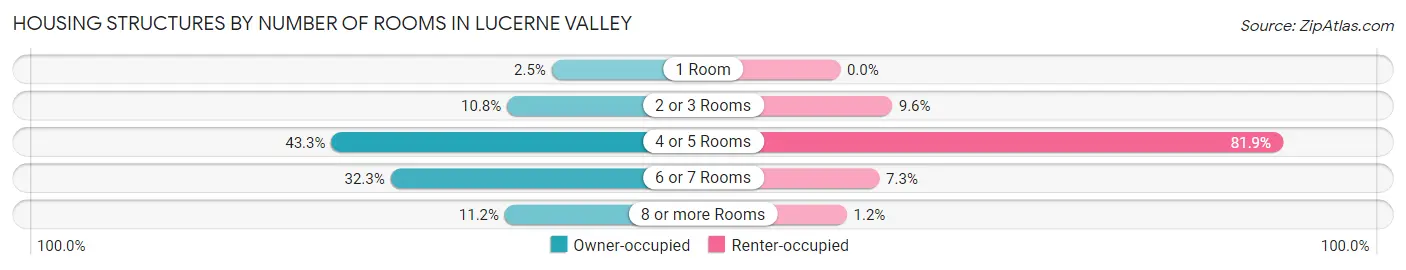
| Number of Rooms | Owner-occupied | Renter-occupied |
| 1 Room | 36 (2.5%) | 0 (0.0%) |
| 2 or 3 Rooms | 154 (10.7%) | 70 (9.6%) |
| 4 or 5 Rooms | 620 (43.3%) | 598 (81.9%) |
| 6 or 7 Rooms | 463 (32.3%) | 53 (7.3%) |
| 8 or more Rooms | 160 (11.2%) | 9 (1.2%) |
| Total | 1,433 (100.0%) | 730 (100.0%) |
Housing Structure by Heating Type in Lucerne Valley
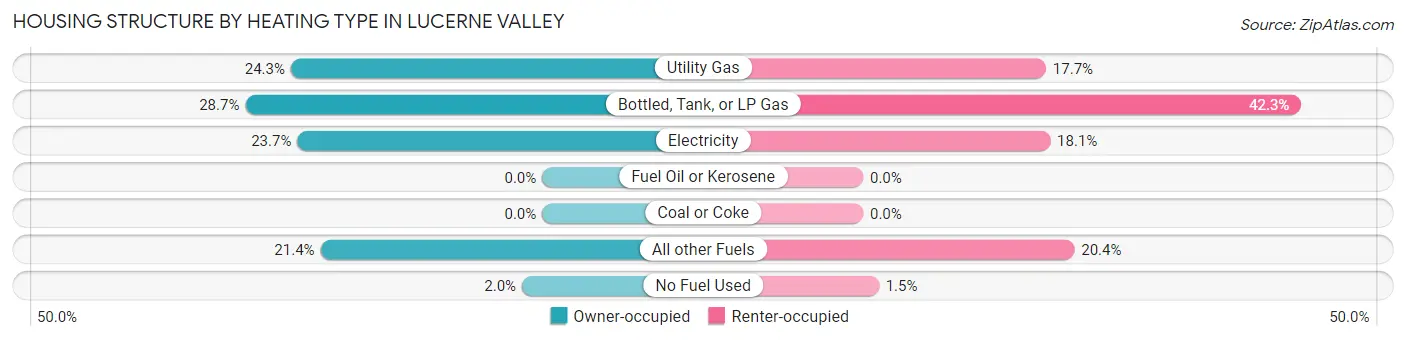
| Heating Type | Owner-occupied | Renter-occupied |
| Utility Gas | 348 (24.3%) | 129 (17.7%) |
| Bottled, Tank, or LP Gas | 411 (28.7%) | 309 (42.3%) |
| Electricity | 339 (23.7%) | 132 (18.1%) |
| Fuel Oil or Kerosene | 0 (0.0%) | 0 (0.0%) |
| Coal or Coke | 0 (0.0%) | 0 (0.0%) |
| All other Fuels | 307 (21.4%) | 149 (20.4%) |
| No Fuel Used | 28 (1.9%) | 11 (1.5%) |
| Total | 1,433 (100.0%) | 730 (100.0%) |
Household Vehicle Usage in Lucerne Valley
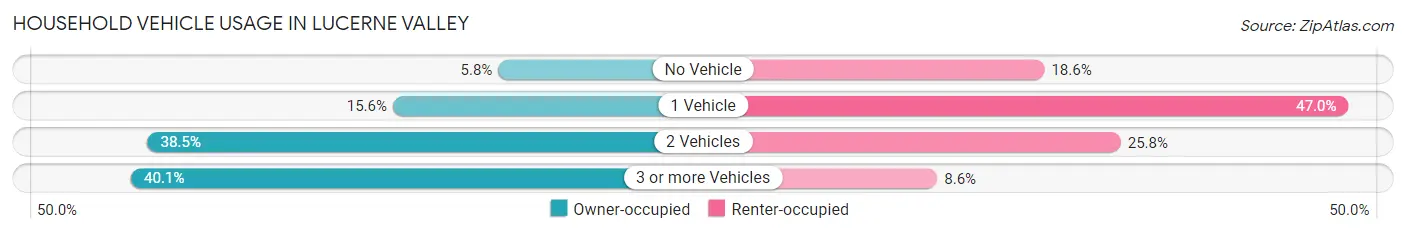
| Vehicles per Household | Owner-occupied | Renter-occupied |
| No Vehicle | 83 (5.8%) | 136 (18.6%) |
| 1 Vehicle | 224 (15.6%) | 343 (47.0%) |
| 2 Vehicles | 552 (38.5%) | 188 (25.8%) |
| 3 or more Vehicles | 574 (40.1%) | 63 (8.6%) |
| Total | 1,433 (100.0%) | 730 (100.0%) |
Real Estate & Mortgages in Lucerne Valley
Real Estate and Mortgage Overview in Lucerne Valley
| Characteristic | Without Mortgage | With Mortgage |
| Housing Units | 634 | 799 |
| Median Property Value | $160,300 | $233,900 |
| Median Household Income | $48,556 | $68 |
| Monthly Housing Costs | $408 | $0 |
| Real Estate Taxes | $1,019 | $61 |
Property Value by Mortgage Status in Lucerne Valley
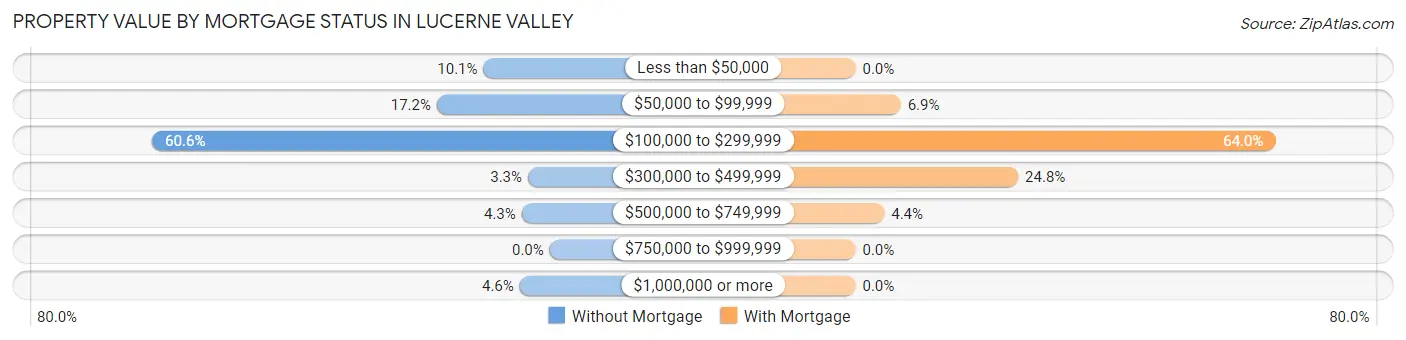
| Property Value | Without Mortgage | With Mortgage |
| Less than $50,000 | 64 (10.1%) | 0 (0.0%) |
| $50,000 to $99,999 | 109 (17.2%) | 55 (6.9%) |
| $100,000 to $299,999 | 384 (60.6%) | 511 (63.9%) |
| $300,000 to $499,999 | 21 (3.3%) | 198 (24.8%) |
| $500,000 to $749,999 | 27 (4.3%) | 35 (4.4%) |
| $750,000 to $999,999 | 0 (0.0%) | 0 (0.0%) |
| $1,000,000 or more | 29 (4.6%) | 0 (0.0%) |
| Total | 634 (100.0%) | 799 (100.0%) |
Household Income by Mortgage Status in Lucerne Valley
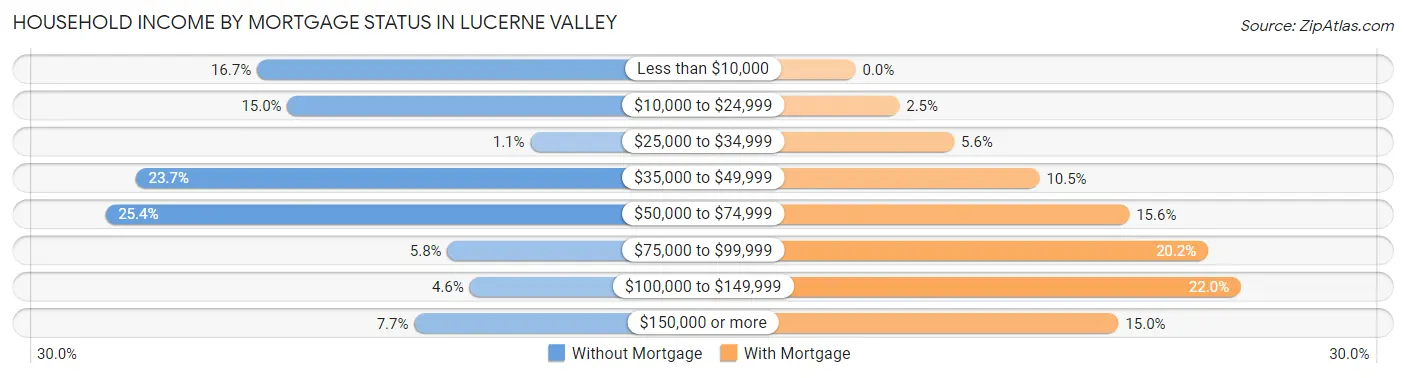
| Household Income | Without Mortgage | With Mortgage |
| Less than $10,000 | 106 (16.7%) | 0 (0.0%) |
| $10,000 to $24,999 | 95 (15.0%) | 20 (2.5%) |
| $25,000 to $34,999 | 7 (1.1%) | 45 (5.6%) |
| $35,000 to $49,999 | 150 (23.7%) | 84 (10.5%) |
| $50,000 to $74,999 | 161 (25.4%) | 125 (15.6%) |
| $75,000 to $99,999 | 37 (5.8%) | 161 (20.2%) |
| $100,000 to $149,999 | 29 (4.6%) | 176 (22.0%) |
| $150,000 or more | 49 (7.7%) | 120 (15.0%) |
| Total | 634 (100.0%) | 799 (100.0%) |
Property Value to Household Income Ratio in Lucerne Valley
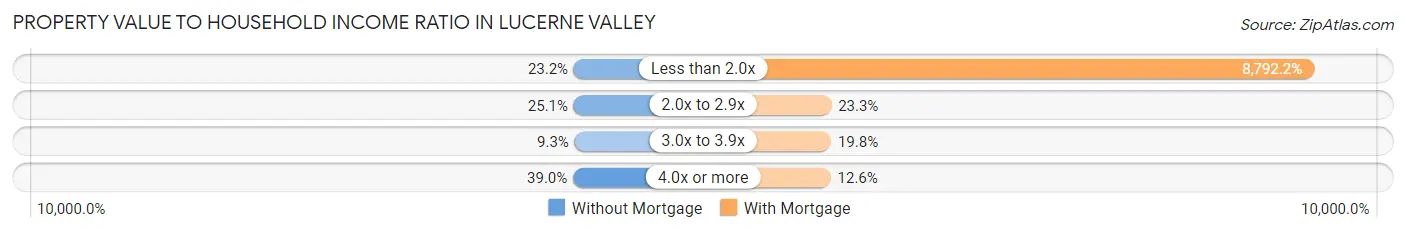
| Value-to-Income Ratio | Without Mortgage | With Mortgage |
| Less than 2.0x | 147 (23.2%) | 70,250 (8,792.2%) |
| 2.0x to 2.9x | 159 (25.1%) | 186 (23.3%) |
| 3.0x to 3.9x | 59 (9.3%) | 158 (19.8%) |
| 4.0x or more | 247 (39.0%) | 101 (12.6%) |
| Total | 634 (100.0%) | 799 (100.0%) |
Real Estate Taxes by Mortgage Status in Lucerne Valley
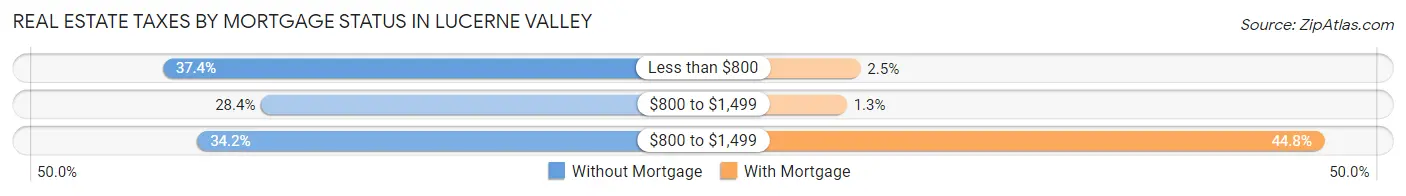
| Property Taxes | Without Mortgage | With Mortgage |
| Less than $800 | 237 (37.4%) | 20 (2.5%) |
| $800 to $1,499 | 180 (28.4%) | 10 (1.3%) |
| $800 to $1,499 | 217 (34.2%) | 358 (44.8%) |
| Total | 634 (100.0%) | 799 (100.0%) |
Health & Disability in Lucerne Valley
Health Insurance Coverage by Age in Lucerne Valley
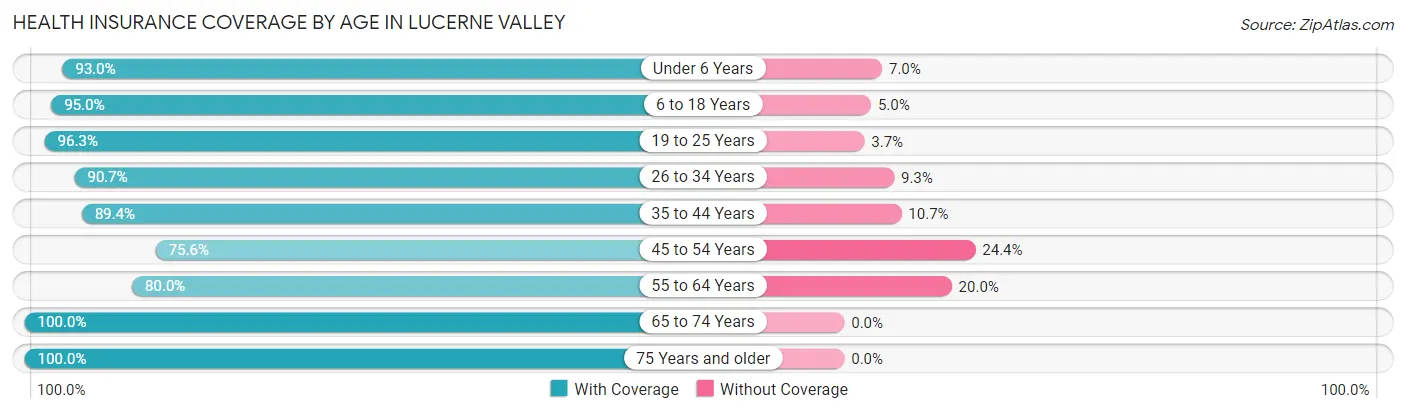
| Age Bracket | With Coverage | Without Coverage |
| Under 6 Years | 555 (93.0%) | 42 (7.0%) |
| 6 to 18 Years | 995 (95.0%) | 52 (5.0%) |
| 19 to 25 Years | 541 (96.3%) | 21 (3.7%) |
| 26 to 34 Years | 479 (90.7%) | 49 (9.3%) |
| 35 to 44 Years | 738 (89.3%) | 88 (10.6%) |
| 45 to 54 Years | 510 (75.6%) | 165 (24.4%) |
| 55 to 64 Years | 759 (80.0%) | 190 (20.0%) |
| 65 to 74 Years | 575 (100.0%) | 0 (0.0%) |
| 75 Years and older | 453 (100.0%) | 0 (0.0%) |
| Total | 5,605 (90.2%) | 607 (9.8%) |
Health Insurance Coverage by Citizenship Status in Lucerne Valley
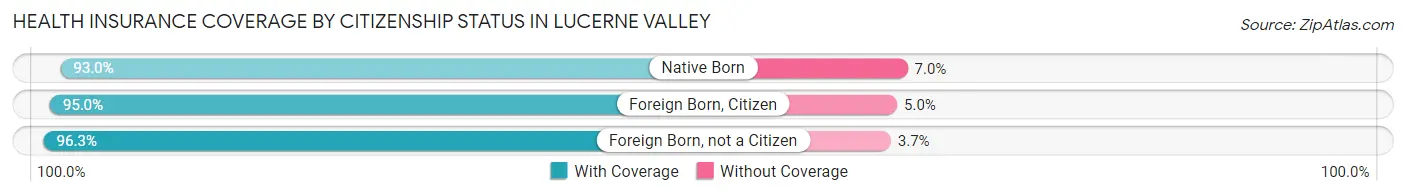
| Citizenship Status | With Coverage | Without Coverage |
| Native Born | 555 (93.0%) | 42 (7.0%) |
| Foreign Born, Citizen | 995 (95.0%) | 52 (5.0%) |
| Foreign Born, not a Citizen | 541 (96.3%) | 21 (3.7%) |
Health Insurance Coverage by Household Income in Lucerne Valley
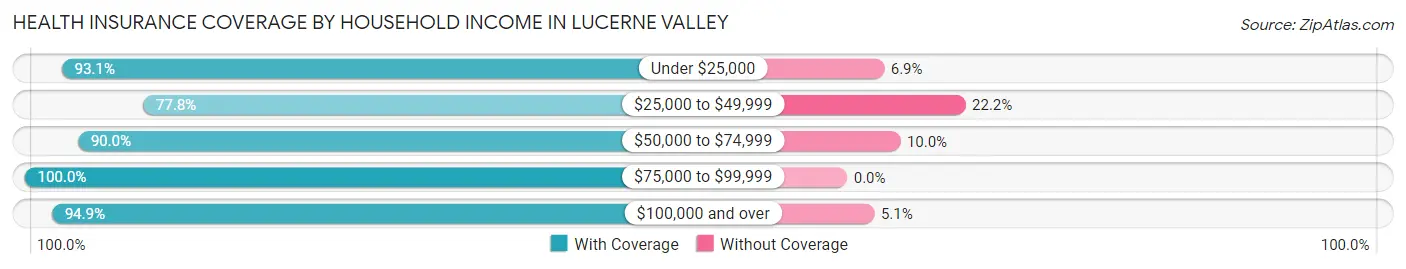
| Household Income | With Coverage | Without Coverage |
| Under $25,000 | 1,208 (93.1%) | 90 (6.9%) |
| $25,000 to $49,999 | 1,053 (77.8%) | 300 (22.2%) |
| $50,000 to $74,999 | 1,203 (90.0%) | 133 (10.0%) |
| $75,000 to $99,999 | 905 (100.0%) | 0 (0.0%) |
| $100,000 and over | 1,155 (94.9%) | 62 (5.1%) |
Public vs Private Health Insurance Coverage by Age in Lucerne Valley
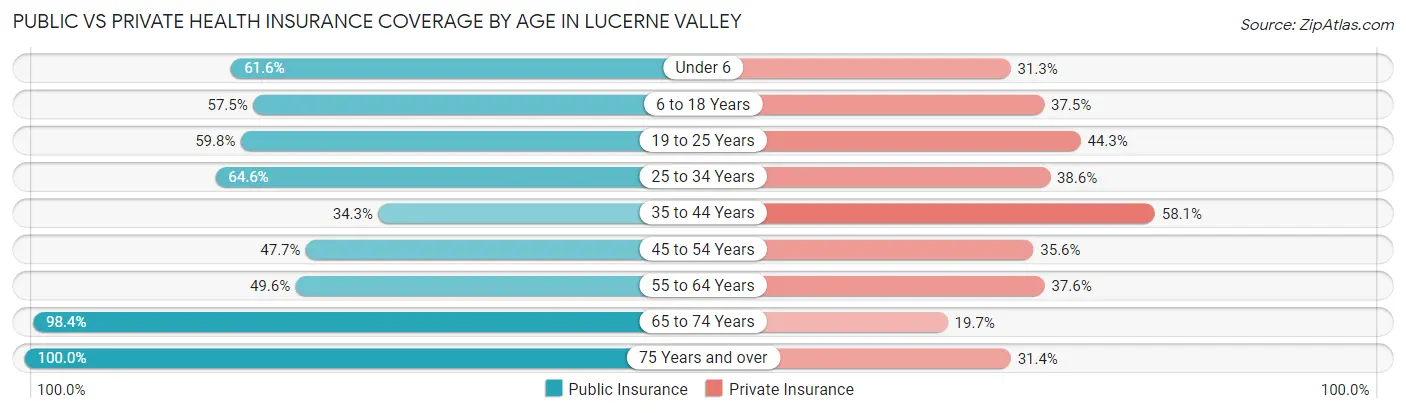
| Age Bracket | Public Insurance | Private Insurance |
| Under 6 | 368 (61.6%) | 187 (31.3%) |
| 6 to 18 Years | 602 (57.5%) | 393 (37.5%) |
| 19 to 25 Years | 336 (59.8%) | 249 (44.3%) |
| 25 to 34 Years | 341 (64.6%) | 204 (38.6%) |
| 35 to 44 Years | 283 (34.3%) | 480 (58.1%) |
| 45 to 54 Years | 322 (47.7%) | 240 (35.6%) |
| 55 to 64 Years | 471 (49.6%) | 357 (37.6%) |
| 65 to 74 Years | 566 (98.4%) | 113 (19.7%) |
| 75 Years and over | 453 (100.0%) | 142 (31.4%) |
| Total | 3,742 (60.2%) | 2,365 (38.1%) |
Disability Status by Sex by Age in Lucerne Valley
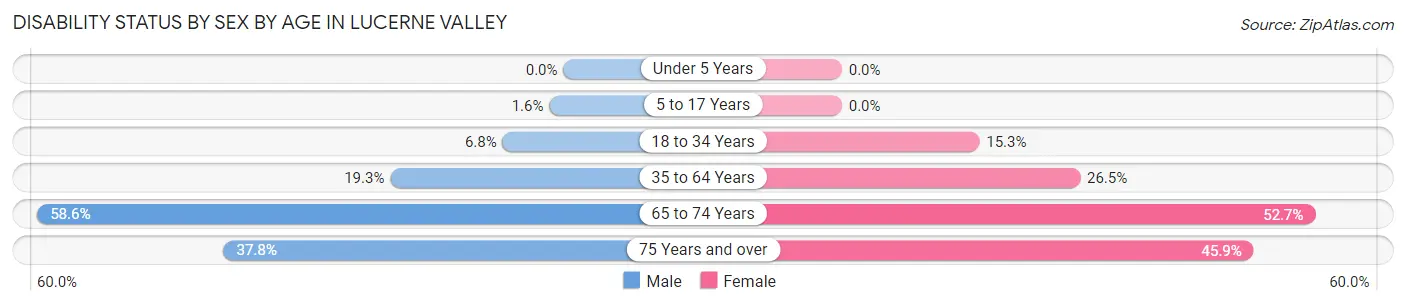
| Age Bracket | Male | Female |
| Under 5 Years | 0 (0.0%) | 0 (0.0%) |
| 5 to 17 Years | 11 (1.6%) | 0 (0.0%) |
| 18 to 34 Years | 40 (6.8%) | 92 (15.3%) |
| 35 to 64 Years | 258 (19.3%) | 295 (26.5%) |
| 65 to 74 Years | 208 (58.6%) | 116 (52.7%) |
| 75 Years and over | 112 (37.8%) | 72 (45.9%) |
Disability Class by Sex by Age in Lucerne Valley
Disability Class: Hearing Difficulty
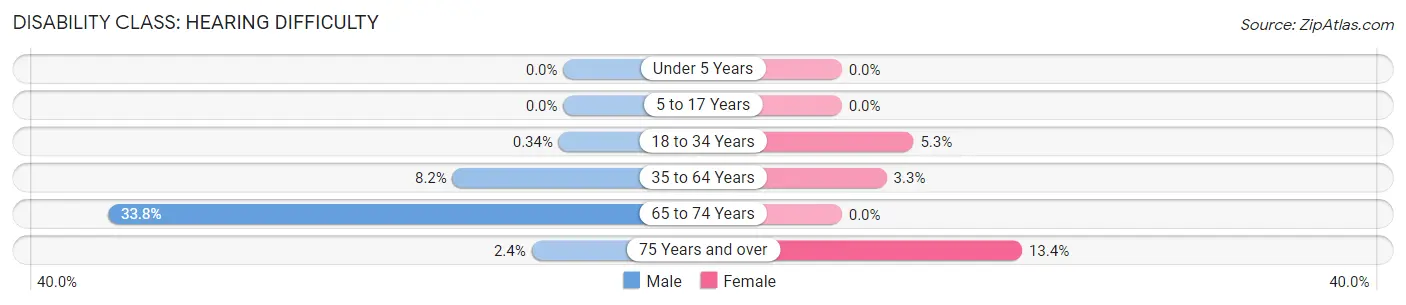
| Age Bracket | Male | Female |
| Under 5 Years | 0 (0.0%) | 0 (0.0%) |
| 5 to 17 Years | 0 (0.0%) | 0 (0.0%) |
| 18 to 34 Years | 2 (0.3%) | 32 (5.3%) |
| 35 to 64 Years | 110 (8.2%) | 37 (3.3%) |
| 65 to 74 Years | 120 (33.8%) | 0 (0.0%) |
| 75 Years and over | 7 (2.4%) | 21 (13.4%) |
Disability Class: Vision Difficulty
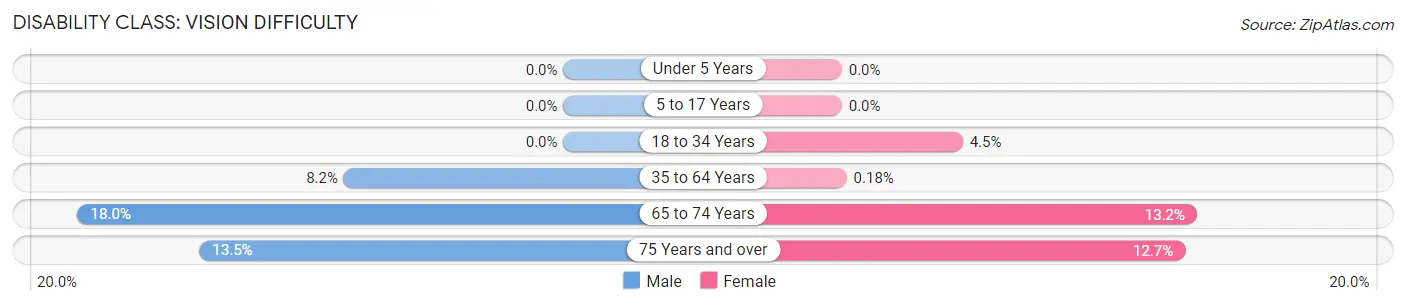
| Age Bracket | Male | Female |
| Under 5 Years | 0 (0.0%) | 0 (0.0%) |
| 5 to 17 Years | 0 (0.0%) | 0 (0.0%) |
| 18 to 34 Years | 0 (0.0%) | 27 (4.5%) |
| 35 to 64 Years | 109 (8.2%) | 2 (0.2%) |
| 65 to 74 Years | 64 (18.0%) | 29 (13.2%) |
| 75 Years and over | 40 (13.5%) | 20 (12.7%) |
Disability Class: Cognitive Difficulty
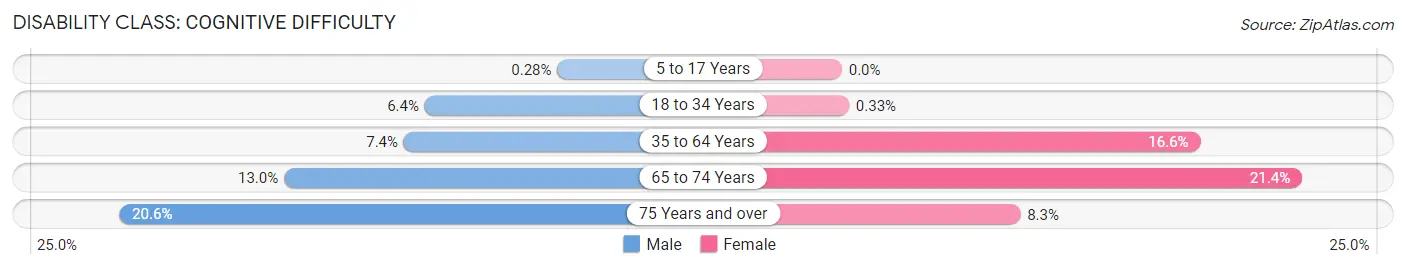
| Age Bracket | Male | Female |
| 5 to 17 Years | 2 (0.3%) | 0 (0.0%) |
| 18 to 34 Years | 38 (6.4%) | 2 (0.3%) |
| 35 to 64 Years | 99 (7.4%) | 185 (16.6%) |
| 65 to 74 Years | 46 (13.0%) | 47 (21.4%) |
| 75 Years and over | 61 (20.6%) | 13 (8.3%) |
Disability Class: Ambulatory Difficulty
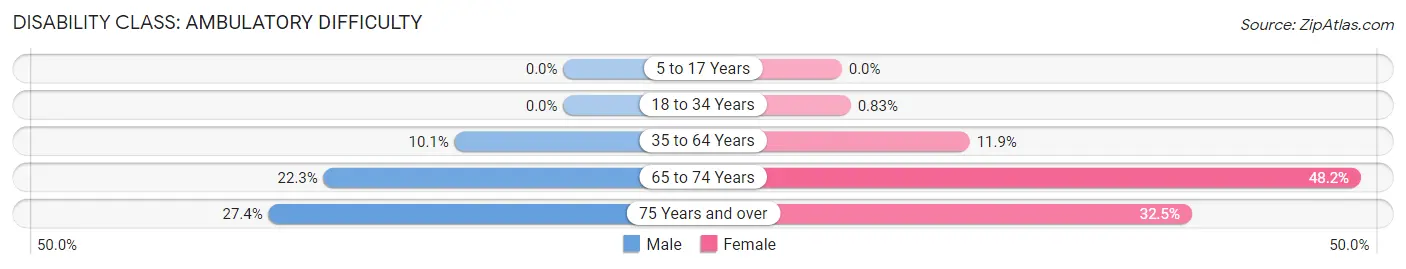
| Age Bracket | Male | Female |
| 5 to 17 Years | 0 (0.0%) | 0 (0.0%) |
| 18 to 34 Years | 0 (0.0%) | 5 (0.8%) |
| 35 to 64 Years | 135 (10.1%) | 132 (11.9%) |
| 65 to 74 Years | 79 (22.3%) | 106 (48.2%) |
| 75 Years and over | 81 (27.4%) | 51 (32.5%) |
Disability Class: Self-Care Difficulty
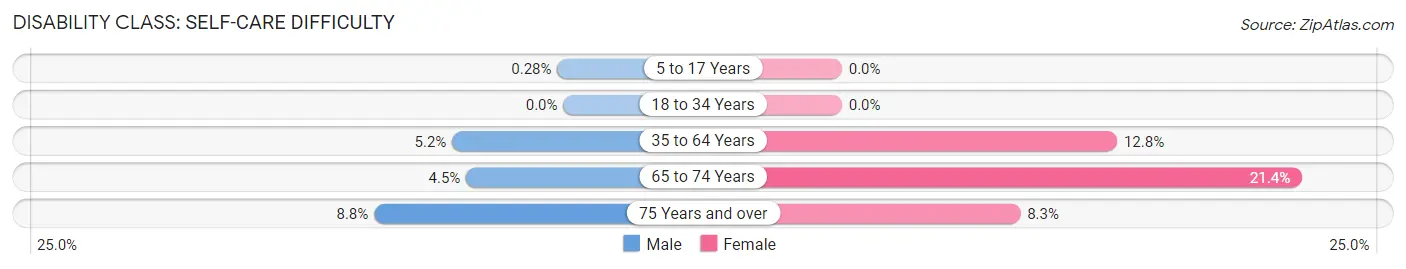
| Age Bracket | Male | Female |
| 5 to 17 Years | 2 (0.3%) | 0 (0.0%) |
| 18 to 34 Years | 0 (0.0%) | 0 (0.0%) |
| 35 to 64 Years | 69 (5.2%) | 142 (12.8%) |
| 65 to 74 Years | 16 (4.5%) | 47 (21.4%) |
| 75 Years and over | 26 (8.8%) | 13 (8.3%) |
Technology Access in Lucerne Valley
Computing Device Access in Lucerne Valley
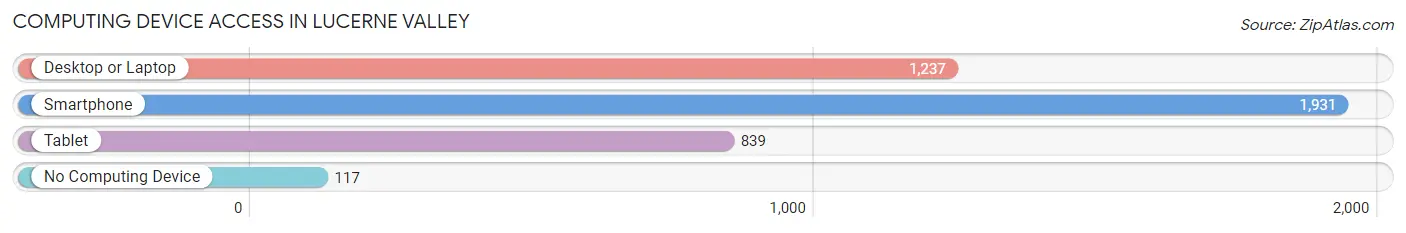
| Device Type | # Households | % Households |
| Desktop or Laptop | 1,237 | 57.2% |
| Smartphone | 1,931 | 89.3% |
| Tablet | 839 | 38.8% |
| No Computing Device | 117 | 5.4% |
| Total | 2,163 | 100.0% |
Internet Access in Lucerne Valley
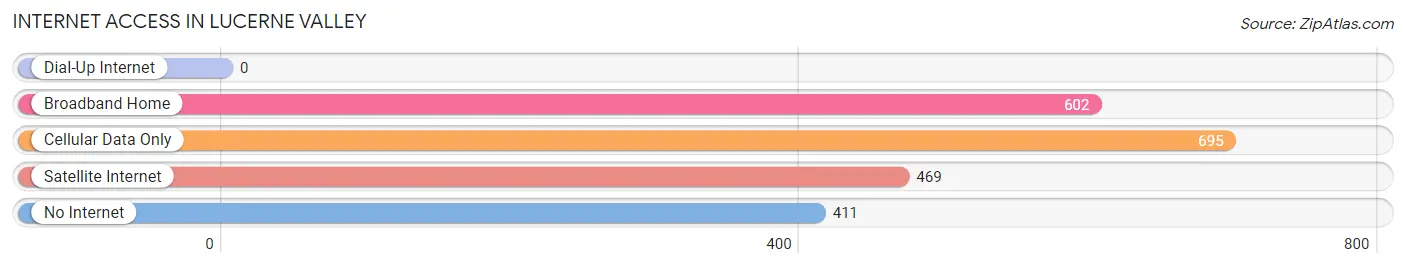
| Internet Type | # Households | % Households |
| Dial-Up Internet | 0 | 0.0% |
| Broadband Home | 602 | 27.8% |
| Cellular Data Only | 695 | 32.1% |
| Satellite Internet | 469 | 21.7% |
| No Internet | 411 | 19.0% |
| Total | 2,163 | 100.0% |
Lucerne Valley Summary
Lucerne Valley is a small unincorporated community located in the Mojave Desert of San Bernardino County, California. It is situated in the eastern part of the county, approximately 70 miles northeast of San Bernardino and about 20 miles west of Victorville. The population of Lucerne Valley was estimated to be 6,890 in 2019.
History
Lucerne Valley was first settled in the late 1800s by homesteaders who were attracted to the area by its abundant water supply. The area was originally known as Rabbit Springs, named after the numerous jackrabbits that inhabited the area. In the early 1900s, the area was renamed Lucerne Valley after the Lucerne Valley Ranch, which was owned by the local rancher, John Brown.
In the 1920s, the area began to attract tourists who were drawn to the area by its natural beauty and its proximity to Los Angeles. The area was also popular with hunters and fishermen, who were attracted to the area's abundant wildlife.
In the 1950s, the area began to attract retirees who were looking for a quiet place to live. The area was also popular with off-road enthusiasts, who were drawn to the area's rugged terrain.
In the 1960s, the area began to attract people who were looking for a place to grow vegetables and raise livestock. The area was also popular with rockhounds, who were attracted to the area's abundant deposits of quartz and other minerals.
In the 1970s, the area began to attract people who were looking for a place to escape the hustle and bustle of city life. The area was also popular with campers, who were drawn to the area's numerous campgrounds.
In the 1980s, the area began to attract people who were looking for a place to retire. The area was also popular with off-road enthusiasts, who were drawn to the area's rugged terrain.
Geography
Lucerne Valley is located in the Mojave Desert of San Bernardino County, California. It is situated in the eastern part of the county, approximately 70 miles northeast of San Bernardino and about 20 miles west of Victorville. The area is characterized by its dry, desert climate and its rugged terrain. The area is surrounded by the San Bernardino National Forest to the north and the San Gabriel Mountains to the south.
Economy
The economy of Lucerne Valley is largely based on agriculture and tourism. The area is home to numerous farms and ranches, which produce a variety of crops, including alfalfa, hay, and vegetables. The area is also popular with tourists, who are drawn to the area's natural beauty and its numerous outdoor recreational opportunities.
The area is also home to several businesses, including restaurants, gas stations, and convenience stores. The area is also home to several manufacturing companies, which produce a variety of products, including furniture, clothing, and electronics.
Demographics
As of 2019, the population of Lucerne Valley was estimated to be 6,890. The population is largely white (83.3%), with smaller percentages of Hispanic (7.3%), African American (3.2%), and Asian (2.2%) residents. The median household income in the area is $45,845, and the median age is 44.7 years. The area is largely rural, with only a small percentage of the population living in urban areas.
Common Questions
What is Per Capita Income in Lucerne Valley?
Per Capita income in Lucerne Valley is $22,835.
What is the Median Family Income in Lucerne Valley?
Median Family Income in Lucerne Valley is $54,596.
What is the Median Household income in Lucerne Valley?
Median Household Income in Lucerne Valley is $45,444.
What is Income or Wage Gap in Lucerne Valley?
Income or Wage Gap in Lucerne Valley is 30.9%.
Women in Lucerne Valley earn 69.1 cents for every dollar earned by a man.
What is Family Income Deficit in Lucerne Valley?
Family Income Deficit in Lucerne Valley is $13,537.
Families that are below poverty line in Lucerne Valley earn $13,537 less on average than the poverty threshold level.
What is Inequality or Gini Index in Lucerne Valley?
Inequality or Gini Index in Lucerne Valley is 0.50.
What is the Total Population of Lucerne Valley?
Total Population of Lucerne Valley is 6,212.
What is the Total Male Population of Lucerne Valley?
Total Male Population of Lucerne Valley is 3,480.
What is the Total Female Population of Lucerne Valley?
Total Female Population of Lucerne Valley is 2,732.
What is the Ratio of Males per 100 Females in Lucerne Valley?
There are 127.38 Males per 100 Females in Lucerne Valley.
What is the Ratio of Females per 100 Males in Lucerne Valley?
There are 78.51 Females per 100 Males in Lucerne Valley.
What is the Median Population Age in Lucerne Valley?
Median Population Age in Lucerne Valley is 38.3 Years.
What is the Average Family Size in Lucerne Valley
Average Family Size in Lucerne Valley is 3.6 People.
What is the Average Household Size in Lucerne Valley
Average Household Size in Lucerne Valley is 2.8 People.
How Large is the Labor Force in Lucerne Valley?
There are 2,154 People in the Labor Forcein in Lucerne Valley.
What is the Percentage of People in the Labor Force in Lucerne Valley?
44.8% of People are in the Labor Force in Lucerne Valley.
What is the Unemployment Rate in Lucerne Valley?
Unemployment Rate in Lucerne Valley is 21.7%.