Lake Riverside, CA Map & Demographics
Lake Riverside Map
Lake Riverside Overview
$34,808
PER CAPITA INCOME
$88,344
AVG FAMILY INCOME
$88,438
AVG HOUSEHOLD INCOME
10.1%
WAGE / INCOME GAP [ % ]
89.9¢/ $1
WAGE / INCOME GAP [ $ ]
0.35
INEQUALITY / GINI INDEX
1,417
TOTAL POPULATION
668
MALE POPULATION
749
FEMALE POPULATION
89.19
MALES / 100 FEMALES
112.13
FEMALES / 100 MALES
45.2
MEDIAN AGE
3.2
AVG FAMILY SIZE
3.1
AVG HOUSEHOLD SIZE
567
LABOR FORCE [ PEOPLE ]
48.8%
PERCENT IN LABOR FORCE
11.6%
UNEMPLOYMENT RATE
Income in Lake Riverside
Income Overview in Lake Riverside
Per Capita Income in Lake Riverside is $34,808, while median incomes of families and households are $88,344 and $88,438 respectively.
| Characteristic | Number | Measure |
| Per Capita Income | 1,417 | $34,808 |
| Median Family Income | 437 | $88,344 |
| Mean Family Income | 437 | $107,561 |
| Median Household Income | 450 | $88,438 |
| Mean Household Income | 450 | $108,267 |
| Income Deficit | 437 | $0 |
| Wage / Income Gap (%) | 1,417 | 10.14% |
| Wage / Income Gap ($) | 1,417 | 89.86¢ per $1 |
| Gini / Inequality Index | 1,417 | 0.35 |
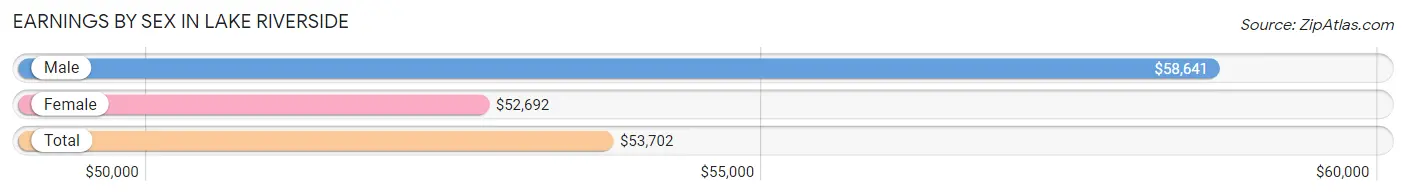
Earnings by Sex in Lake Riverside
Average Earnings in Lake Riverside are $53,702, $58,641 for men and $52,692 for women, a difference of 10.1%.
| Sex | Number | Average Earnings |
| Male | 333 (62.2%) | $58,641 |
| Female | 202 (37.8%) | $52,692 |
| Total | 535 (100.0%) | $53,702 |
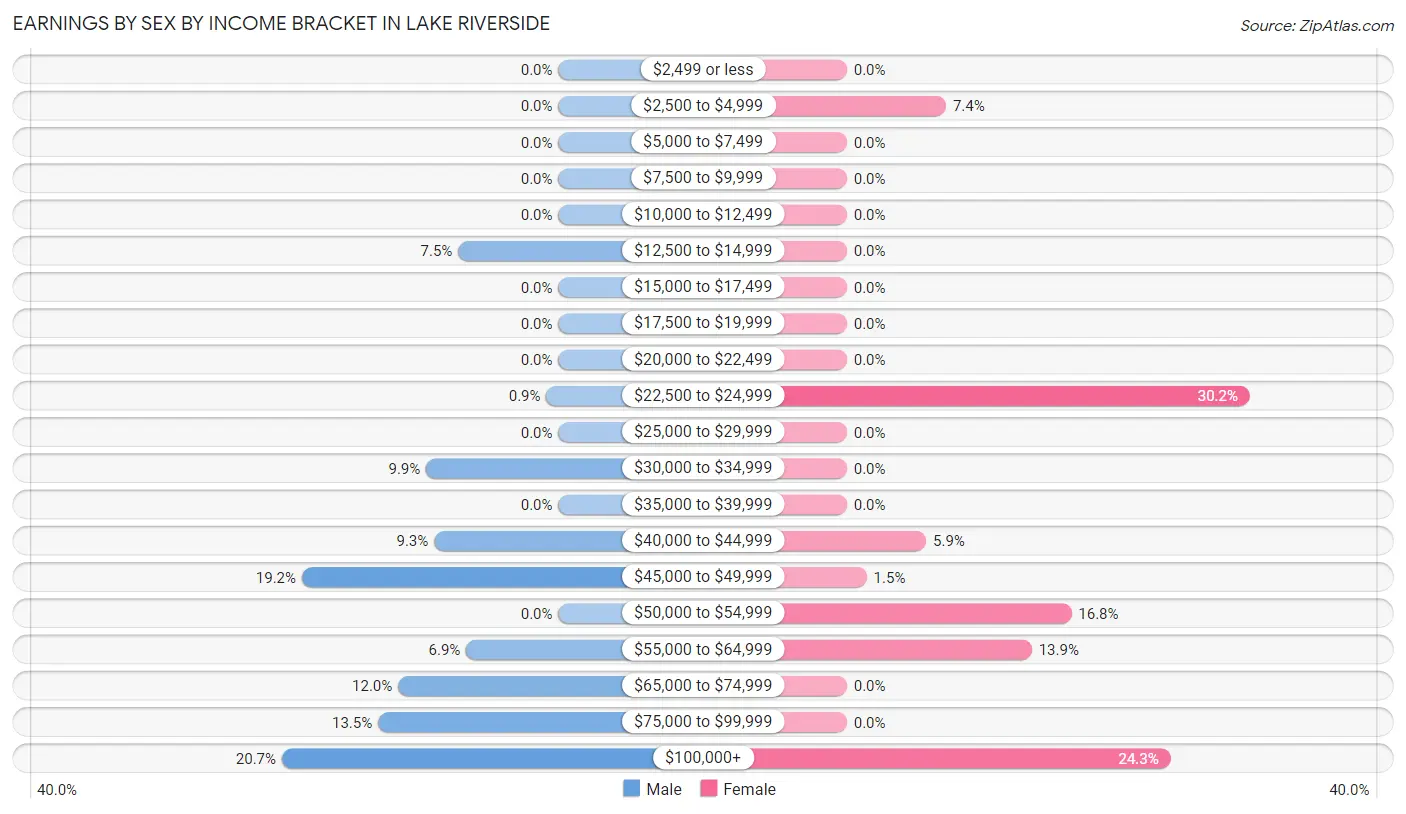
Earnings by Sex by Income Bracket in Lake Riverside
The most common earnings brackets in Lake Riverside are $100,000+ for men (69 | 20.7%) and $22,500 to $24,999 for women (61 | 30.2%).
| Income | Male | Female |
| $2,499 or less | 0 (0.0%) | 0 (0.0%) |
| $2,500 to $4,999 | 0 (0.0%) | 15 (7.4%) |
| $5,000 to $7,499 | 0 (0.0%) | 0 (0.0%) |
| $7,500 to $9,999 | 0 (0.0%) | 0 (0.0%) |
| $10,000 to $12,499 | 0 (0.0%) | 0 (0.0%) |
| $12,500 to $14,999 | 25 (7.5%) | 0 (0.0%) |
| $15,000 to $17,499 | 0 (0.0%) | 0 (0.0%) |
| $17,500 to $19,999 | 0 (0.0%) | 0 (0.0%) |
| $20,000 to $22,499 | 0 (0.0%) | 0 (0.0%) |
| $22,500 to $24,999 | 3 (0.9%) | 61 (30.2%) |
| $25,000 to $29,999 | 0 (0.0%) | 0 (0.0%) |
| $30,000 to $34,999 | 33 (9.9%) | 0 (0.0%) |
| $35,000 to $39,999 | 0 (0.0%) | 0 (0.0%) |
| $40,000 to $44,999 | 31 (9.3%) | 12 (5.9%) |
| $45,000 to $49,999 | 64 (19.2%) | 3 (1.5%) |
| $50,000 to $54,999 | 0 (0.0%) | 34 (16.8%) |
| $55,000 to $64,999 | 23 (6.9%) | 28 (13.9%) |
| $65,000 to $74,999 | 40 (12.0%) | 0 (0.0%) |
| $75,000 to $99,999 | 45 (13.5%) | 0 (0.0%) |
| $100,000+ | 69 (20.7%) | 49 (24.3%) |
| Total | 333 (100.0%) | 202 (100.0%) |
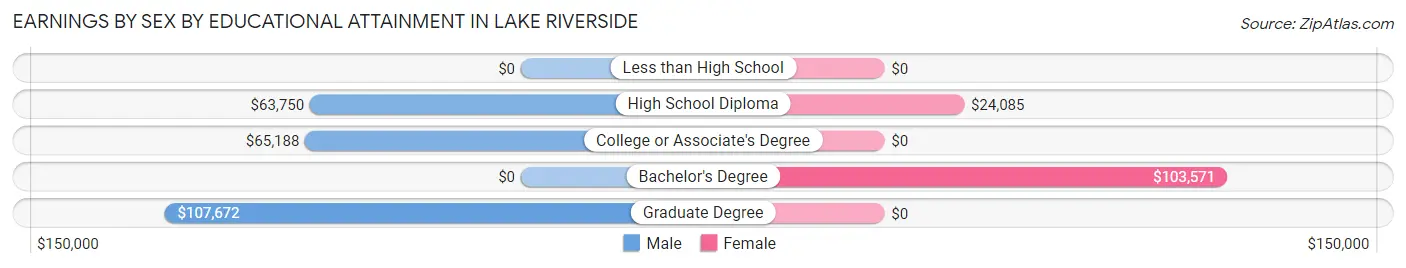
Earnings by Sex by Educational Attainment in Lake Riverside
Average earnings in Lake Riverside are $62,500 for men and $54,375 for women, a difference of 13.0%. Men with an educational attainment of graduate degree enjoy the highest average annual earnings of $107,672, while those with high school diploma education earn the least with $63,750. Women with an educational attainment of bachelor's degree earn the most with the average annual earnings of $103,571, while those with high school diploma education have the smallest earnings of $24,085.
| Educational Attainment | Male Income | Female Income |
| Less than High School | - | - |
| High School Diploma | $63,750 | $24,085 |
| College or Associate's Degree | $65,188 | $0 |
| Bachelor's Degree | - | - |
| Graduate Degree | $107,672 | $0 |
| Total | $62,500 | $54,375 |
Family Income in Lake Riverside
Family Income Brackets in Lake Riverside
According to the Lake Riverside family income data, there are 70 families falling into the $75,000 to $99,999 income range, which is the most common income bracket and makes up 16.0% of all families.
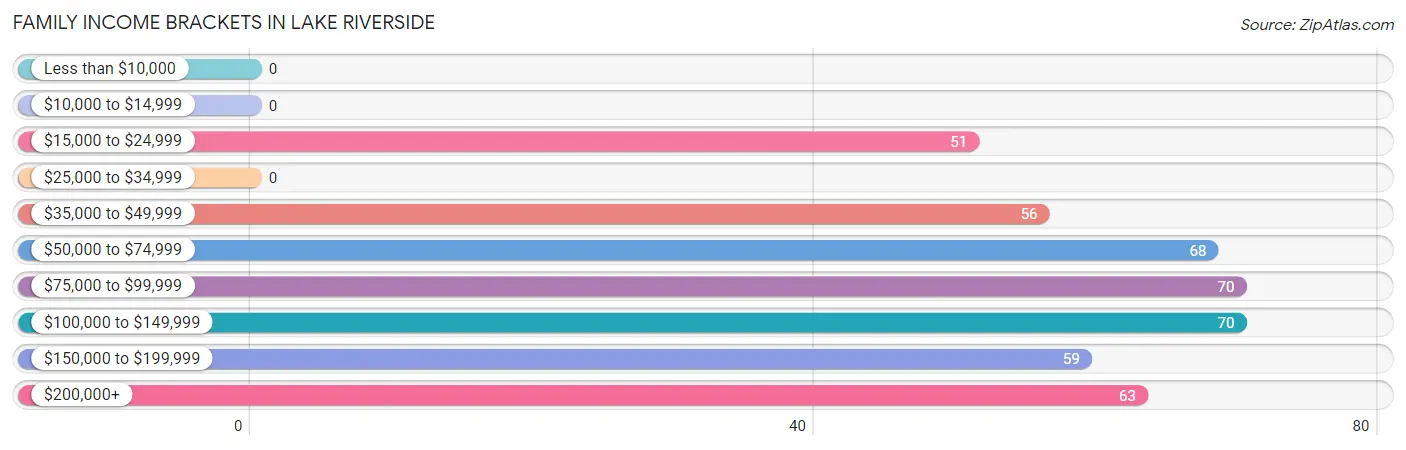
| Income Bracket | # Families | % Families |
| Less than $10,000 | 0 | 0.0% |
| $10,000 to $14,999 | 0 | 0.0% |
| $15,000 to $24,999 | 51 | 11.7% |
| $25,000 to $34,999 | 0 | 0.0% |
| $35,000 to $49,999 | 56 | 12.8% |
| $50,000 to $74,999 | 68 | 15.6% |
| $75,000 to $99,999 | 70 | 16.0% |
| $100,000 to $149,999 | 70 | 16.0% |
| $150,000 to $199,999 | 59 | 13.5% |
| $200,000+ | 63 | 14.4% |
Family Income by Famaliy Size in Lake Riverside
3-person families (83 | 19.0%) account for the highest median family income in Lake Riverside with $208,664 per family, while 3-person families (83 | 19.0%) have the highest median income of $69,555 per family member.
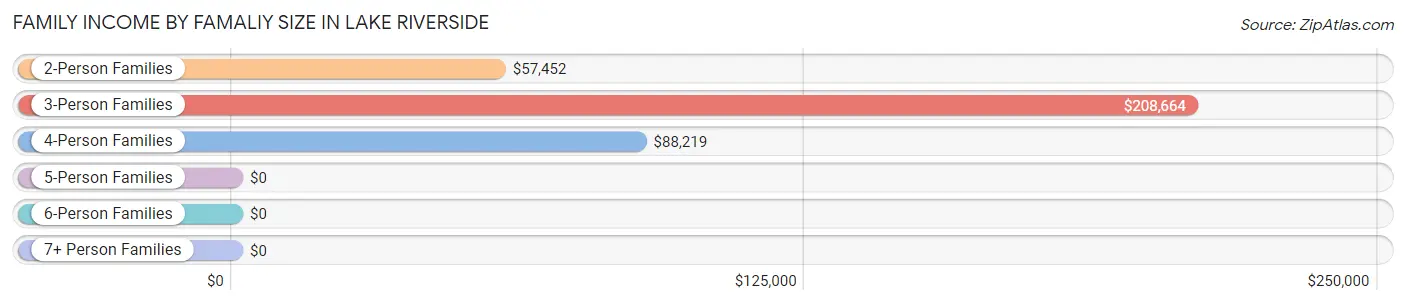
| Income Bracket | # Families | Median Income |
| 2-Person Families | 204 (46.7%) | $57,452 |
| 3-Person Families | 83 (19.0%) | $208,664 |
| 4-Person Families | 109 (24.9%) | $88,219 |
| 5-Person Families | 8 (1.8%) | $0 |
| 6-Person Families | 33 (7.5%) | $0 |
| 7+ Person Families | 0 (0.0%) | $0 |
| Total | 437 (100.0%) | $88,344 |
Family Income by Number of Earners in Lake Riverside
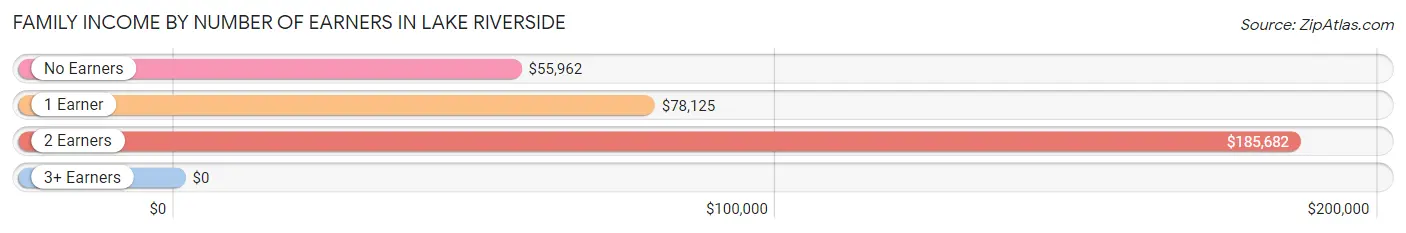
| Number of Earners | # Families | Median Income |
| No Earners | 132 (30.2%) | $55,962 |
| 1 Earner | 128 (29.3%) | $78,125 |
| 2 Earners | 150 (34.3%) | $185,682 |
| 3+ Earners | 27 (6.2%) | $0 |
| Total | 437 (100.0%) | $88,344 |
Household Income in Lake Riverside
Household Income Brackets in Lake Riverside
With 70 households falling in the category, the $75,000 to $99,999 income range is the most frequent in Lake Riverside, accounting for 15.6% of all households.
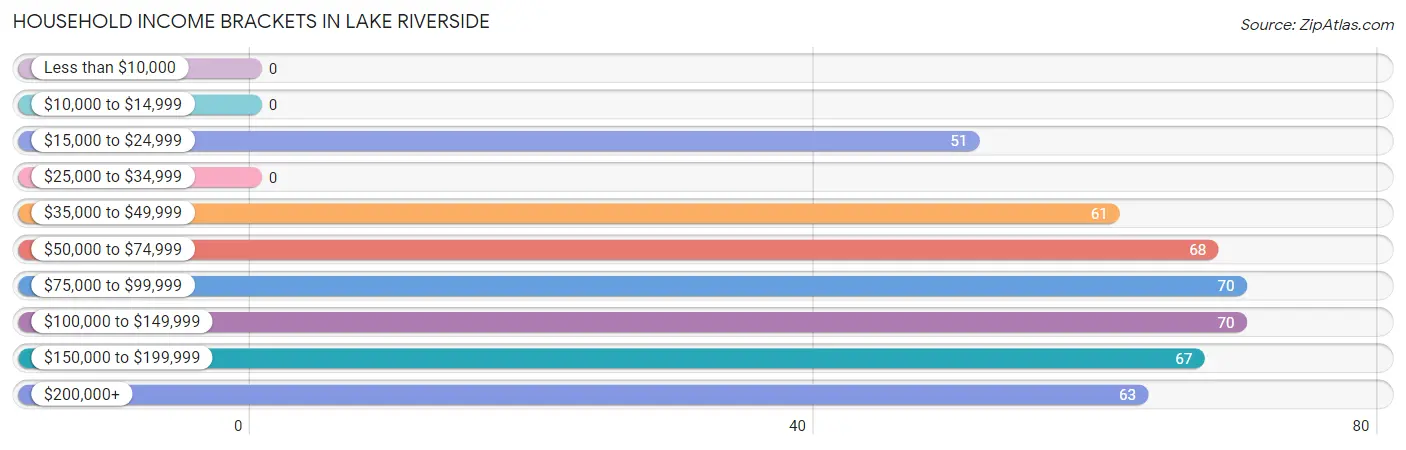
| Income Bracket | # Households | % Households |
| Less than $10,000 | 0 | 0.0% |
| $10,000 to $14,999 | 0 | 0.0% |
| $15,000 to $24,999 | 51 | 11.3% |
| $25,000 to $34,999 | 0 | 0.0% |
| $35,000 to $49,999 | 61 | 13.6% |
| $50,000 to $74,999 | 68 | 15.1% |
| $75,000 to $99,999 | 70 | 15.6% |
| $100,000 to $149,999 | 70 | 15.6% |
| $150,000 to $199,999 | 67 | 14.9% |
| $200,000+ | 63 | 14.0% |
Household Income by Householder Age in Lake Riverside
The median household income in Lake Riverside is $88,438, with the highest median household income of $171,583 found in the 45 to 64 years age bracket for the primary householder. A total of 137 households (30.4%) fall into this category.
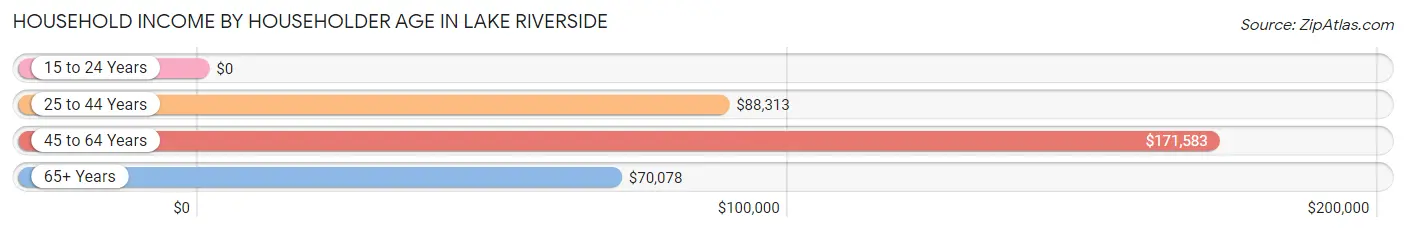
| Income Bracket | # Households | Median Income |
| 15 to 24 Years | 0 (0.0%) | $0 |
| 25 to 44 Years | 136 (30.2%) | $88,313 |
| 45 to 64 Years | 137 (30.4%) | $171,583 |
| 65+ Years | 177 (39.3%) | $70,078 |
| Total | 450 (100.0%) | $88,438 |
Poverty in Lake Riverside
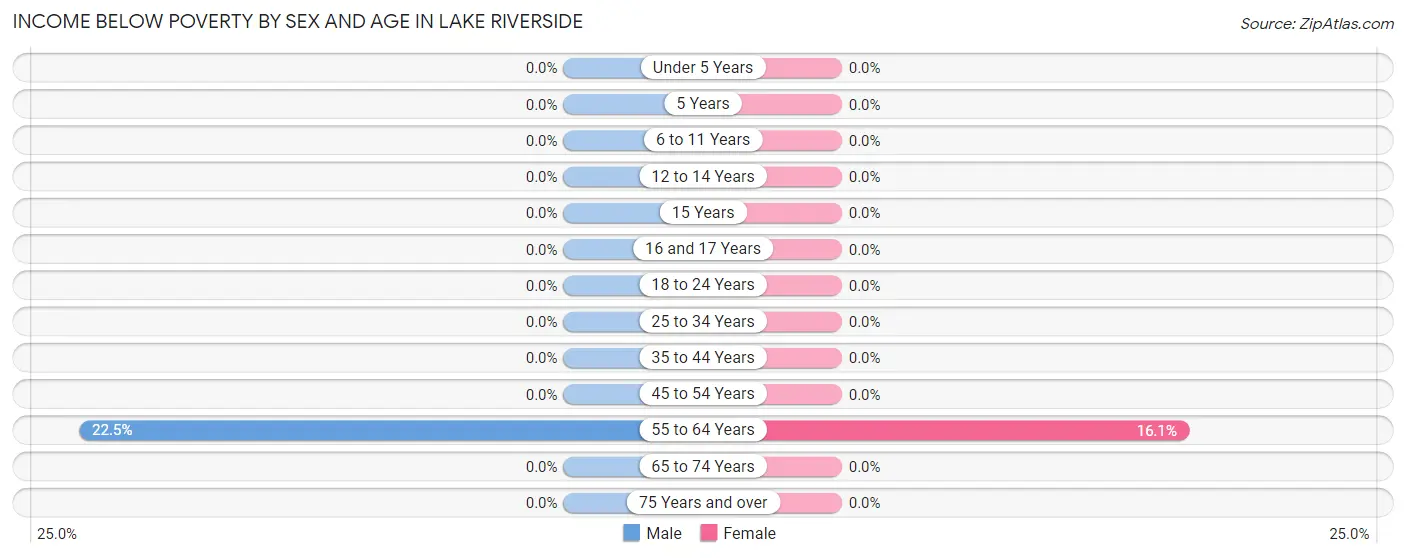
Income Below Poverty by Sex and Age in Lake Riverside
With 3.0% poverty level for males and 2.5% for females among the residents of Lake Riverside, 55 to 64 year old males and 55 to 64 year old females are the most vulnerable to poverty, with 20 males (22.5%) and 19 females (16.1%) in their respective age groups living below the poverty level.
| Age Bracket | Male | Female |
| Under 5 Years | 0 (0.0%) | 0 (0.0%) |
| 5 Years | 0 (0.0%) | 0 (0.0%) |
| 6 to 11 Years | 0 (0.0%) | 0 (0.0%) |
| 12 to 14 Years | 0 (0.0%) | 0 (0.0%) |
| 15 Years | 0 (0.0%) | 0 (0.0%) |
| 16 and 17 Years | 0 (0.0%) | 0 (0.0%) |
| 18 to 24 Years | 0 (0.0%) | 0 (0.0%) |
| 25 to 34 Years | 0 (0.0%) | 0 (0.0%) |
| 35 to 44 Years | 0 (0.0%) | 0 (0.0%) |
| 45 to 54 Years | 0 (0.0%) | 0 (0.0%) |
| 55 to 64 Years | 20 (22.5%) | 19 (16.1%) |
| 65 to 74 Years | 0 (0.0%) | 0 (0.0%) |
| 75 Years and over | 0 (0.0%) | 0 (0.0%) |
| Total | 20 (3.0%) | 19 (2.5%) |
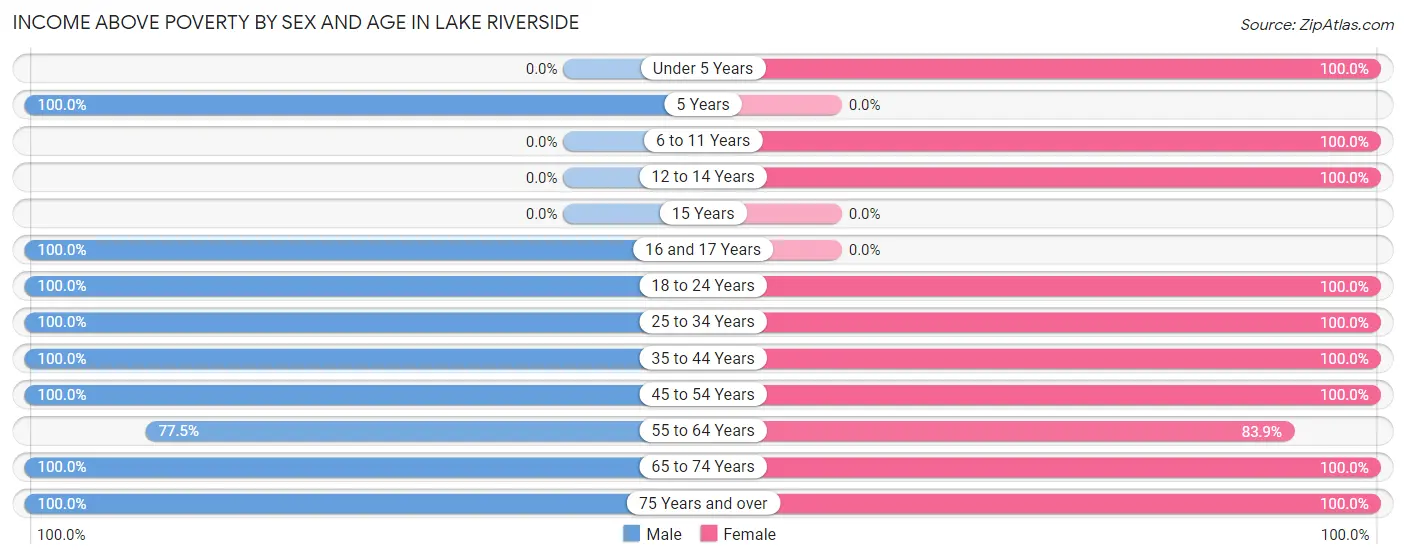
Income Above Poverty by Sex and Age in Lake Riverside
According to the poverty statistics in Lake Riverside, males aged 5 years and females aged under 5 years are the age groups that are most secure financially, with 100.0% of males and 100.0% of females in these age groups living above the poverty line.
| Age Bracket | Male | Female |
| Under 5 Years | 0 (0.0%) | 78 (100.0%) |
| 5 Years | 9 (100.0%) | 0 (0.0%) |
| 6 to 11 Years | 0 (0.0%) | 103 (100.0%) |
| 12 to 14 Years | 0 (0.0%) | 65 (100.0%) |
| 15 Years | 0 (0.0%) | 0 (0.0%) |
| 16 and 17 Years | 42 (100.0%) | 0 (0.0%) |
| 18 to 24 Years | 25 (100.0%) | 35 (100.0%) |
| 25 to 34 Years | 151 (100.0%) | 28 (100.0%) |
| 35 to 44 Years | 104 (100.0%) | 61 (100.0%) |
| 45 to 54 Years | 58 (100.0%) | 93 (100.0%) |
| 55 to 64 Years | 69 (77.5%) | 99 (83.9%) |
| 65 to 74 Years | 141 (100.0%) | 137 (100.0%) |
| 75 Years and over | 49 (100.0%) | 31 (100.0%) |
| Total | 648 (97.0%) | 730 (97.5%) |
Income Below Poverty Among Married-Couple Families in Lake Riverside
The poverty statistics for married-couple families in Lake Riverside show that 5.0% or 19 of the total 384 families live below the poverty line. Families with no children have the highest poverty rate of 7.3%, comprising of 19 families. On the other hand, families with 1 or 2 children have the lowest poverty rate of 0.0%, which includes 0 families.
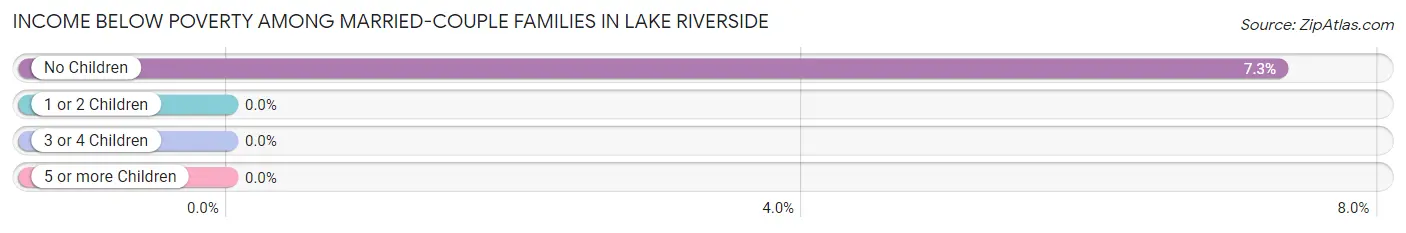
| Children | Above Poverty | Below Poverty |
| No Children | 241 (92.7%) | 19 (7.3%) |
| 1 or 2 Children | 91 (100.0%) | 0 (0.0%) |
| 3 or 4 Children | 33 (100.0%) | 0 (0.0%) |
| 5 or more Children | 0 (0.0%) | 0 (0.0%) |
| Total | 365 (95.1%) | 19 (5.0%) |
Income Below Poverty Among Single-Parent Households in Lake Riverside
| Children | Single Father | Single Mother |
| No Children | 0 (0.0%) | 0 (0.0%) |
| 1 or 2 Children | 0 (0.0%) | 0 (0.0%) |
| 3 or 4 Children | 0 (0.0%) | 0 (0.0%) |
| 5 or more Children | 0 (0.0%) | 0 (0.0%) |
| Total | 0 (0.0%) | 0 (0.0%) |
Income Below Poverty Among Married-Couple vs Single-Parent Households in Lake Riverside
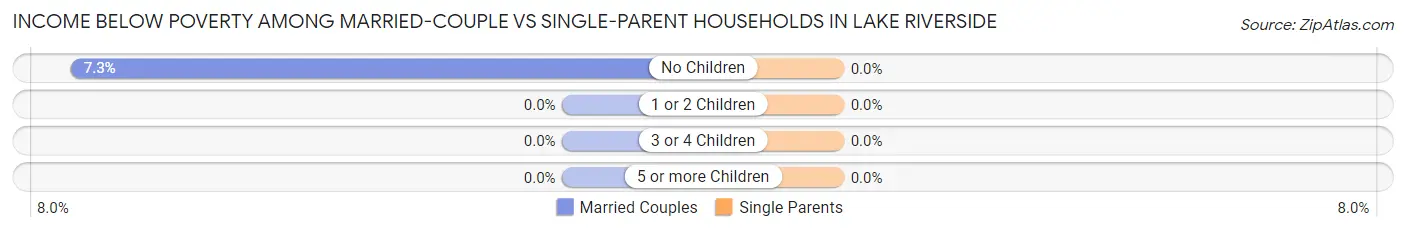
| Children | Married-Couple Families | Single-Parent Households |
| No Children | 19 (7.3%) | 0 (0.0%) |
| 1 or 2 Children | 0 (0.0%) | 0 (0.0%) |
| 3 or 4 Children | 0 (0.0%) | 0 (0.0%) |
| 5 or more Children | 0 (0.0%) | 0 (0.0%) |
| Total | 19 (5.0%) | 0 (0.0%) |
Race in Lake Riverside
The most populous races in Lake Riverside are White / Caucasian (927 | 65.4%), Hispanic or Latino (389 | 27.5%), and Two or more Races (326 | 23.0%).
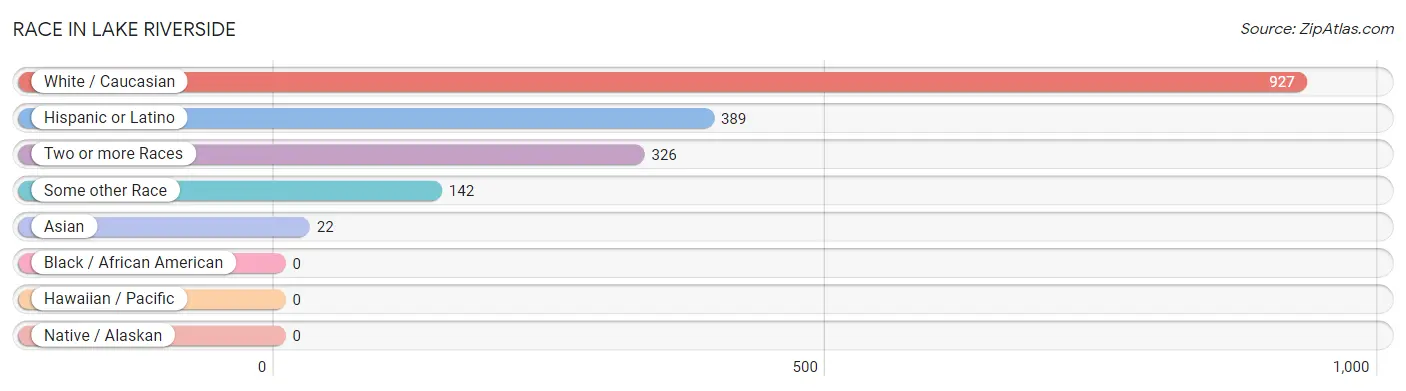
| Race | # Population | % Population |
| Asian | 22 | 1.5% |
| Black / African American | 0 | 0.0% |
| Hawaiian / Pacific | 0 | 0.0% |
| Hispanic or Latino | 389 | 27.5% |
| Native / Alaskan | 0 | 0.0% |
| White / Caucasian | 927 | 65.4% |
| Two or more Races | 326 | 23.0% |
| Some other Race | 142 | 10.0% |
| Total | 1,417 | 100.0% |
Ancestry in Lake Riverside
The most populous ancestries reported in Lake Riverside are Mexican (389 | 27.5%), German (200 | 14.1%), Eastern European (178 | 12.6%), English (136 | 9.6%), and Korean (84 | 5.9%), together accounting for 69.7% of all Lake Riverside residents.
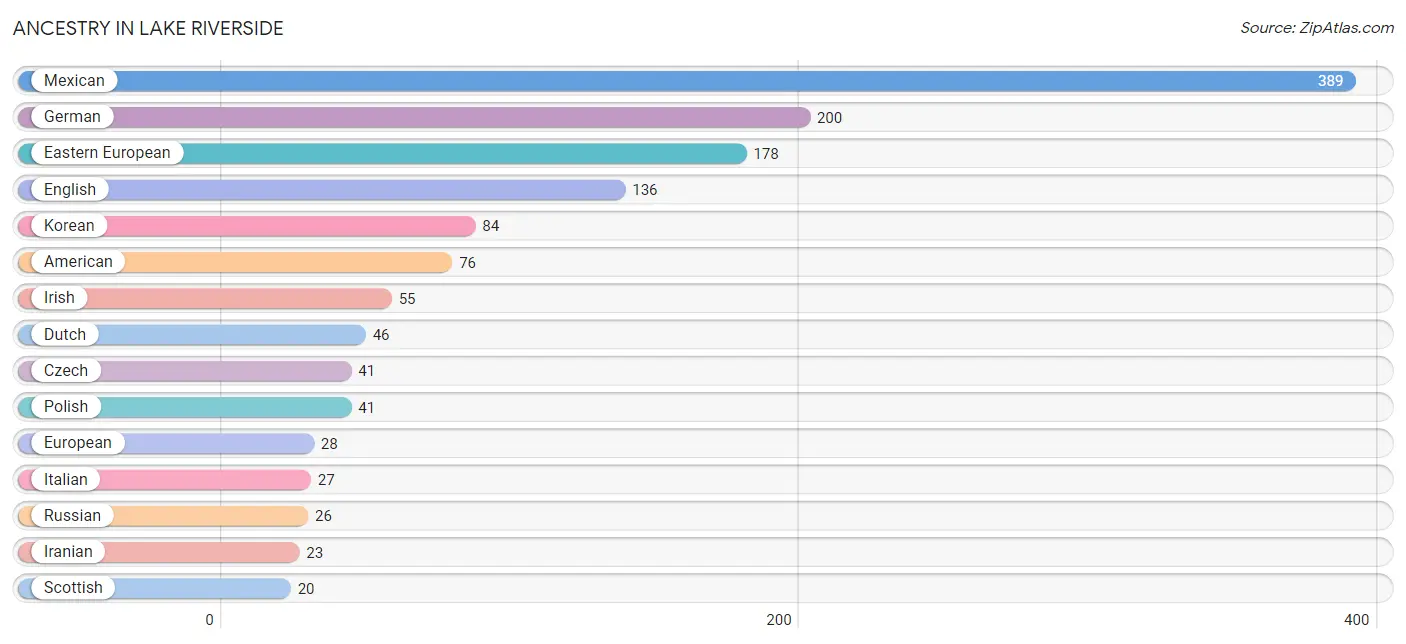
| Ancestry | # Population | % Population |
| American | 76 | 5.4% |
| Canadian | 8 | 0.6% |
| Czech | 41 | 2.9% |
| Danish | 8 | 0.6% |
| Dutch | 46 | 3.3% |
| Eastern European | 178 | 12.6% |
| English | 136 | 9.6% |
| European | 28 | 2.0% |
| Finnish | 5 | 0.4% |
| German | 200 | 14.1% |
| Iranian | 23 | 1.6% |
| Irish | 55 | 3.9% |
| Italian | 27 | 1.9% |
| Korean | 84 | 5.9% |
| Mexican | 389 | 27.5% |
| Northern European | 8 | 0.6% |
| Polish | 41 | 2.9% |
| Russian | 26 | 1.8% |
| Scottish | 20 | 1.4% |
| Welsh | 19 | 1.3% | View All 20 Rows |
Immigrants in Lake Riverside
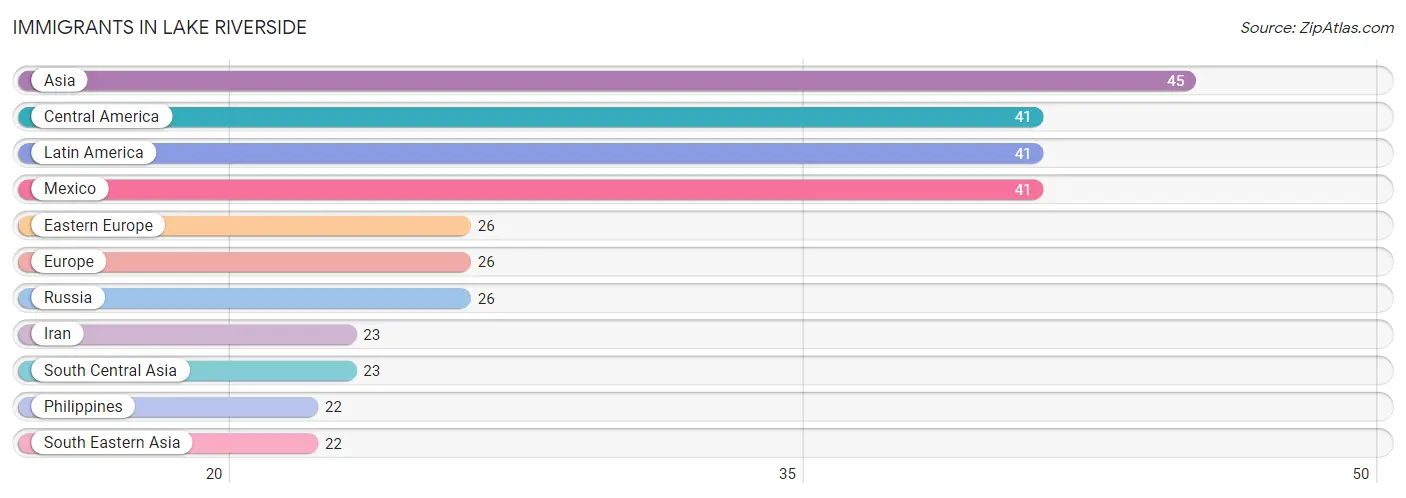
The most numerous immigrant groups reported in Lake Riverside came from Asia (45 | 3.2%), Central America (41 | 2.9%), Latin America (41 | 2.9%), Mexico (41 | 2.9%), and Eastern Europe (26 | 1.8%), together accounting for 13.7% of all Lake Riverside residents.
| Immigration Origin | # Population | % Population |
| Asia | 45 | 3.2% |
| Central America | 41 | 2.9% |
| Eastern Europe | 26 | 1.8% |
| Europe | 26 | 1.8% |
| Iran | 23 | 1.6% |
| Latin America | 41 | 2.9% |
| Mexico | 41 | 2.9% |
| Philippines | 22 | 1.5% |
| Russia | 26 | 1.8% |
| South Central Asia | 23 | 1.6% |
| South Eastern Asia | 22 | 1.5% | View All 11 Rows |
Sex and Age in Lake Riverside
Sex and Age in Lake Riverside
The most populous age groups in Lake Riverside are 25 to 29 Years (96 | 14.4%) for men and 65 to 69 Years (97 | 13.0%) for women.
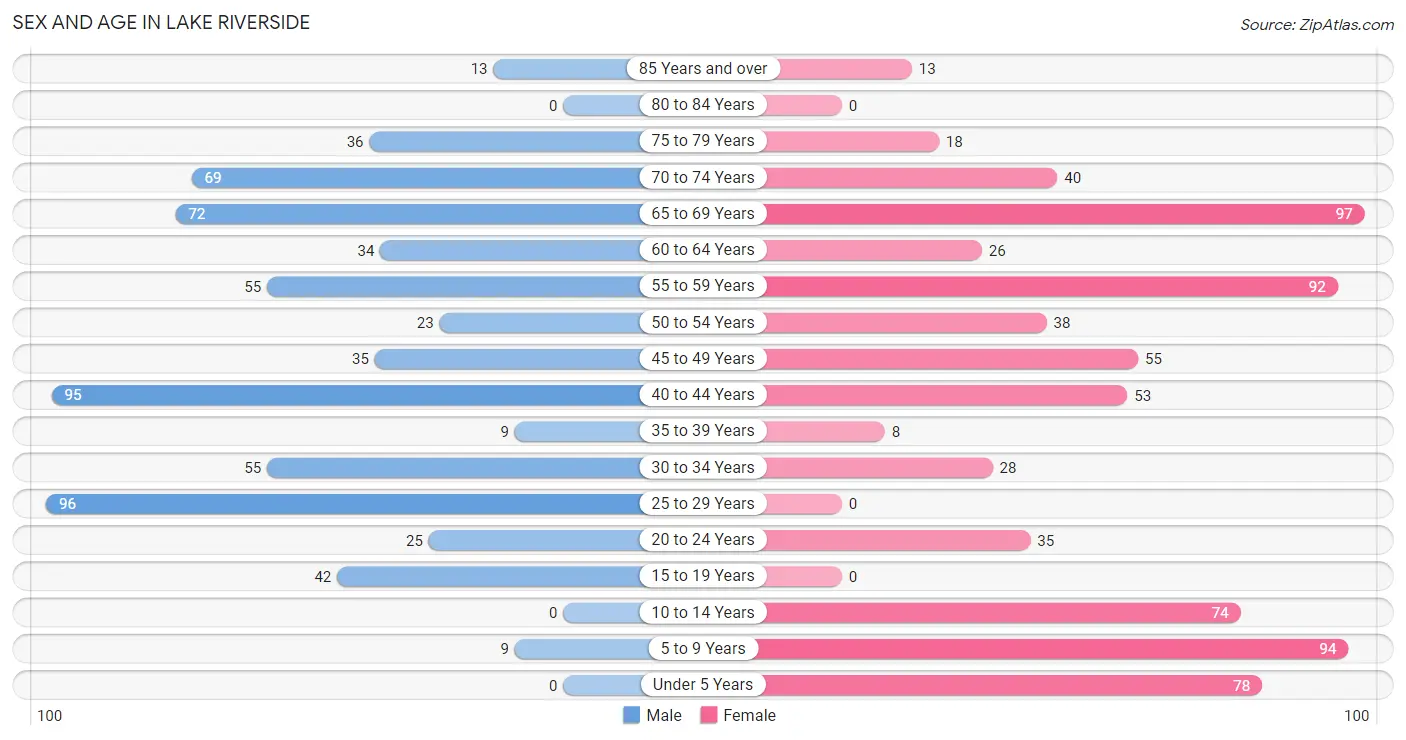
| Age Bracket | Male | Female |
| Under 5 Years | 0 (0.0%) | 78 (10.4%) |
| 5 to 9 Years | 9 (1.3%) | 94 (12.6%) |
| 10 to 14 Years | 0 (0.0%) | 74 (9.9%) |
| 15 to 19 Years | 42 (6.3%) | 0 (0.0%) |
| 20 to 24 Years | 25 (3.7%) | 35 (4.7%) |
| 25 to 29 Years | 96 (14.4%) | 0 (0.0%) |
| 30 to 34 Years | 55 (8.2%) | 28 (3.7%) |
| 35 to 39 Years | 9 (1.3%) | 8 (1.1%) |
| 40 to 44 Years | 95 (14.2%) | 53 (7.1%) |
| 45 to 49 Years | 35 (5.2%) | 55 (7.3%) |
| 50 to 54 Years | 23 (3.4%) | 38 (5.1%) |
| 55 to 59 Years | 55 (8.2%) | 92 (12.3%) |
| 60 to 64 Years | 34 (5.1%) | 26 (3.5%) |
| 65 to 69 Years | 72 (10.8%) | 97 (13.0%) |
| 70 to 74 Years | 69 (10.3%) | 40 (5.3%) |
| 75 to 79 Years | 36 (5.4%) | 18 (2.4%) |
| 80 to 84 Years | 0 (0.0%) | 0 (0.0%) |
| 85 Years and over | 13 (1.9%) | 13 (1.7%) |
| Total | 668 (100.0%) | 749 (100.0%) |
Families and Households in Lake Riverside
Median Family Size in Lake Riverside
The median family size in Lake Riverside is 3.21 persons per family, with married-couple families (384 | 87.9%) accounting for the largest median family size of 3.31 persons per family. On the other hand, single female/mother families (18 | 4.1%) represent the smallest median family size with 2.39 persons per family.
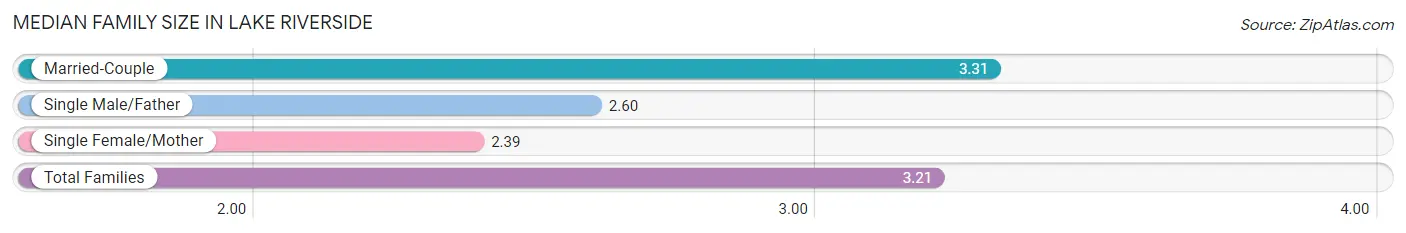
| Family Type | # Families | Family Size |
| Married-Couple | 384 (87.9%) | 3.31 |
| Single Male/Father | 35 (8.0%) | 2.60 |
| Single Female/Mother | 18 (4.1%) | 2.39 |
| Total Families | 437 (100.0%) | 3.21 |
Median Household Size in Lake Riverside
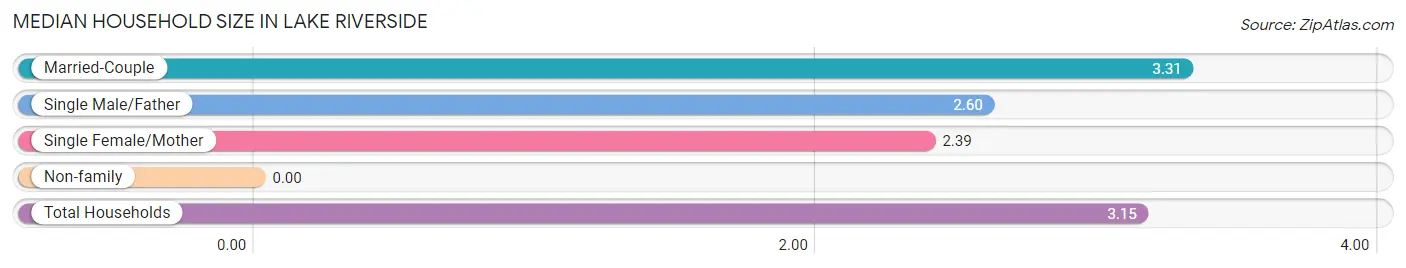
| Household Type | # Households | Household Size |
| Married-Couple | 384 (85.3%) | 3.31 |
| Single Male/Father | 35 (7.8%) | 2.60 |
| Single Female/Mother | 18 (4.0%) | 2.39 |
| Non-family | 13 (2.9%) | - |
| Total Households | 450 (100.0%) | 3.15 |
Household Size by Marriage Status in Lake Riverside
Out of a total of 450 households in Lake Riverside, 437 (97.1%) are family households, while 13 (2.9%) are nonfamily households. The most numerous type of family households are 2-person households, comprising 204, and the most common type of nonfamily households are 1-person households, comprising 13.
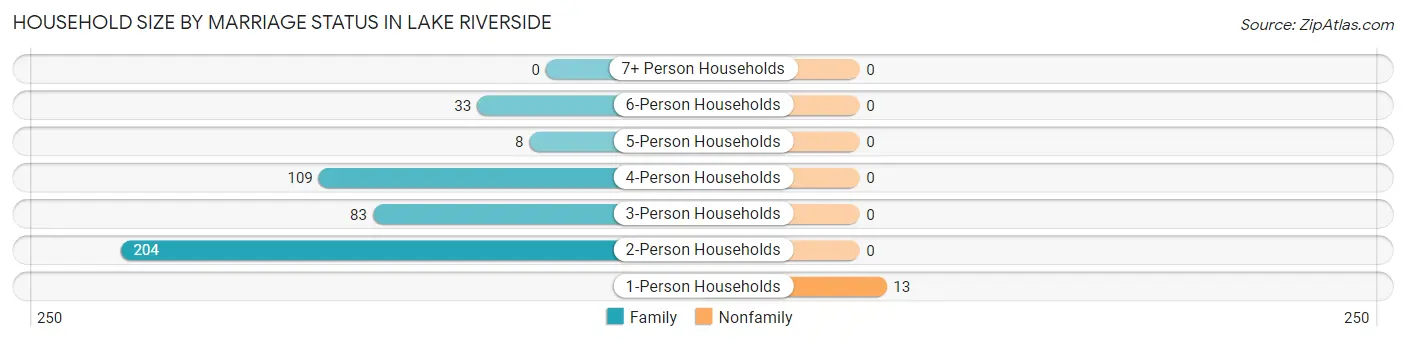
| Household Size | Family Households | Nonfamily Households |
| 1-Person Households | - | 13 (2.9%) |
| 2-Person Households | 204 (45.3%) | 0 (0.0%) |
| 3-Person Households | 83 (18.4%) | 0 (0.0%) |
| 4-Person Households | 109 (24.2%) | 0 (0.0%) |
| 5-Person Households | 8 (1.8%) | 0 (0.0%) |
| 6-Person Households | 33 (7.3%) | 0 (0.0%) |
| 7+ Person Households | 0 (0.0%) | 0 (0.0%) |
| Total | 437 (97.1%) | 13 (2.9%) |
Female Fertility in Lake Riverside
Fertility by Age in Lake Riverside
| Age Bracket | Women with Births | Births / 1,000 Women |
| 15 to 19 years | 0 (0.0%) | 0.0 |
| 20 to 34 years | 0 (0.0%) | 0.0 |
| 35 to 50 years | 0 (0.0%) | 0.0 |
| Total | 0 (0.0%) | 0.0 |
Fertility by Age by Marriage Status in Lake Riverside
| Age Bracket | Married | Unmarried |
| 15 to 19 years | 0 (0.0%) | 0 (0.0%) |
| 20 to 34 years | 0 (0.0%) | 0 (0.0%) |
| 35 to 50 years | 0 (0.0%) | 0 (0.0%) |
| Total | 0 (0.0%) | 0 (0.0%) |
Fertility by Education in Lake Riverside
| Educational Attainment | Women with Births | Births / 1,000 Women |
| Less than High School | 0 (0.0%) | 0.0 |
| High School Diploma | 0 (0.0%) | 0.0 |
| College or Associate's Degree | 0 (0.0%) | 0.0 |
| Bachelor's Degree | 0 (0.0%) | 0.0 |
| Graduate Degree | 0 (0.0%) | 0.0 |
| Total | 0 (0.0%) | 0.0 |
Fertility by Education by Marriage Status in Lake Riverside
| Educational Attainment | Married | Unmarried |
| Less than High School | 0 (0.0%) | 0 (0.0%) |
| High School Diploma | 0 (0.0%) | 0 (0.0%) |
| College or Associate's Degree | 0 (0.0%) | 0 (0.0%) |
| Bachelor's Degree | 0 (0.0%) | 0 (0.0%) |
| Graduate Degree | 0 (0.0%) | 0 (0.0%) |
| Total | 0 (0.0%) | 0 (0.0%) |
Employment Characteristics in Lake Riverside
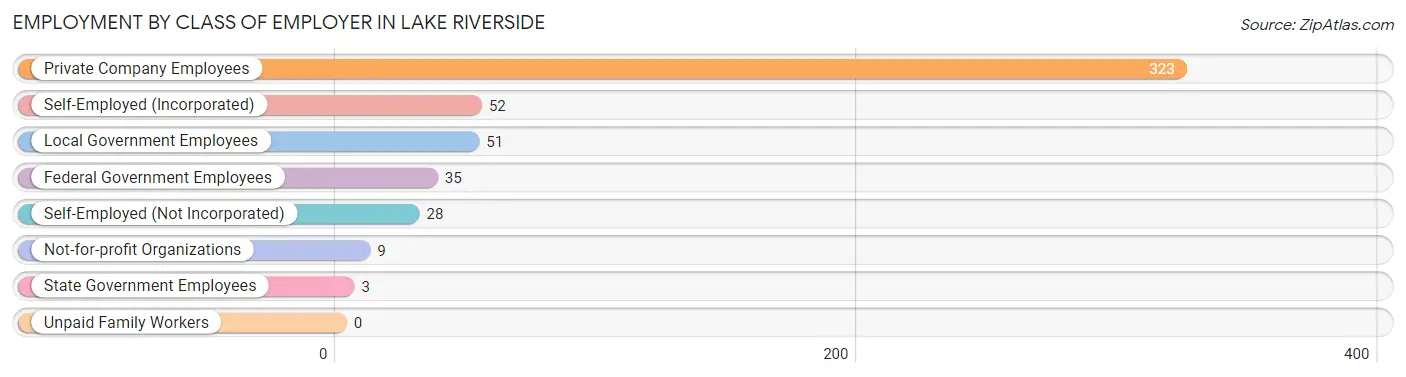
Employment by Class of Employer in Lake Riverside
Among the 501 employed individuals in Lake Riverside, private company employees (323 | 64.5%), self-employed (incorporated) (52 | 10.4%), and local government employees (51 | 10.2%) make up the most common classes of employment.
| Employer Class | # Employees | % Employees |
| Private Company Employees | 323 | 64.5% |
| Self-Employed (Incorporated) | 52 | 10.4% |
| Self-Employed (Not Incorporated) | 28 | 5.6% |
| Not-for-profit Organizations | 9 | 1.8% |
| Local Government Employees | 51 | 10.2% |
| State Government Employees | 3 | 0.6% |
| Federal Government Employees | 35 | 7.0% |
| Unpaid Family Workers | 0 | 0.0% |
| Total | 501 | 100.0% |
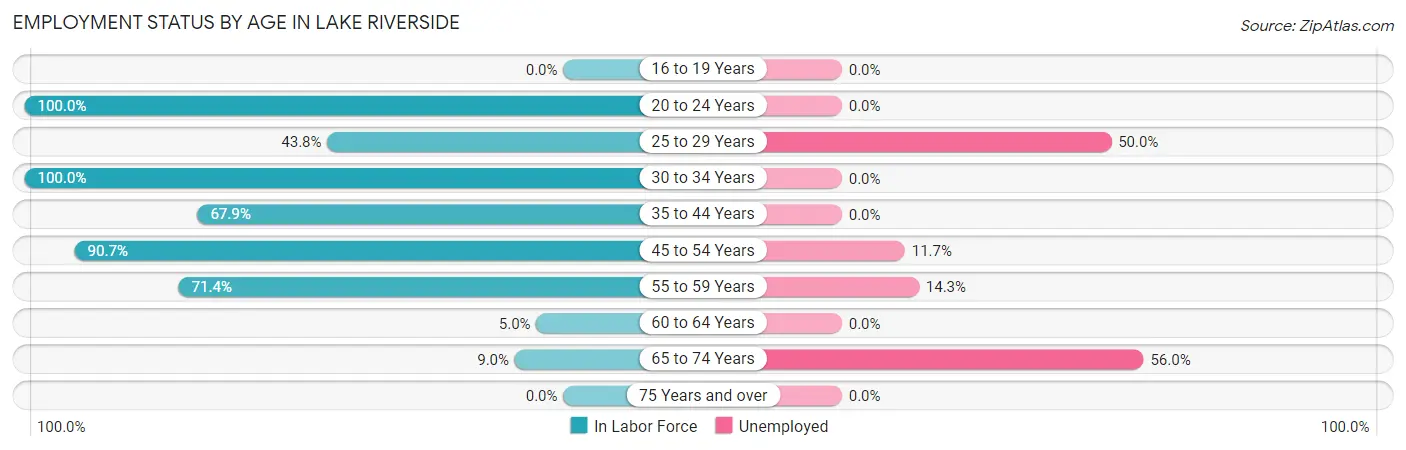
Employment Status by Age in Lake Riverside
According to the labor force statistics for Lake Riverside, out of the total population over 16 years of age (1,162), 48.8% or 567 individuals are in the labor force, with 11.6% or 66 of them unemployed. The age group with the highest labor force participation rate is 20 to 24 years, with 100.0% or 60 individuals in the labor force. Within the labor force, the 65 to 74 years age range has the highest percentage of unemployed individuals, with 56.0% or 14 of them being unemployed.
| Age Bracket | In Labor Force | Unemployed |
| 16 to 19 Years | 0 (0.0%) | 0 (0.0%) |
| 20 to 24 Years | 60 (100.0%) | 0 (0.0%) |
| 25 to 29 Years | 42 (43.8%) | 21 (50.0%) |
| 30 to 34 Years | 83 (100.0%) | 0 (0.0%) |
| 35 to 44 Years | 112 (67.9%) | 0 (0.0%) |
| 45 to 54 Years | 137 (90.7%) | 16 (11.7%) |
| 55 to 59 Years | 105 (71.4%) | 15 (14.3%) |
| 60 to 64 Years | 3 (5.0%) | 0 (0.0%) |
| 65 to 74 Years | 25 (9.0%) | 14 (56.0%) |
| 75 Years and over | 0 (0.0%) | 0 (0.0%) |
| Total | 567 (48.8%) | 66 (11.6%) |
Employment Status by Educational Attainment in Lake Riverside
According to labor force statistics for Lake Riverside, 68.7% of individuals (482) out of the total population between 25 and 64 years of age (702) are in the labor force, with 10.8% or 52 of them being unemployed. The group with the highest labor force participation rate are those with the educational attainment of bachelor's degree or higher, with 91.3% or 231 individuals in the labor force. Within the labor force, individuals with bachelor's degree or higher education have the highest percentage of unemployment, with 22.5% or 52 of them being unemployed.
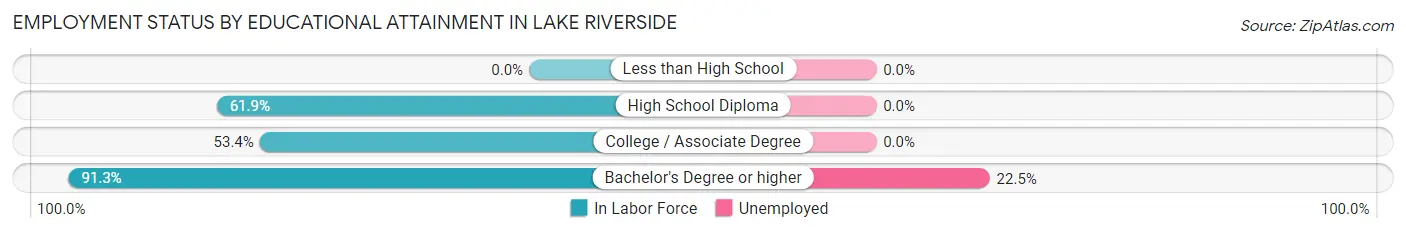
| Educational Attainment | In Labor Force | Unemployed |
| Less than High School | 0 (0.0%) | 0 (0.0%) |
| High School Diploma | 125 (61.9%) | 0 (0.0%) |
| College / Associate Degree | 126 (53.4%) | 0 (0.0%) |
| Bachelor's Degree or higher | 231 (91.3%) | 57 (22.5%) |
| Total | 482 (68.7%) | 76 (10.8%) |
Employment Occupations by Sex in Lake Riverside
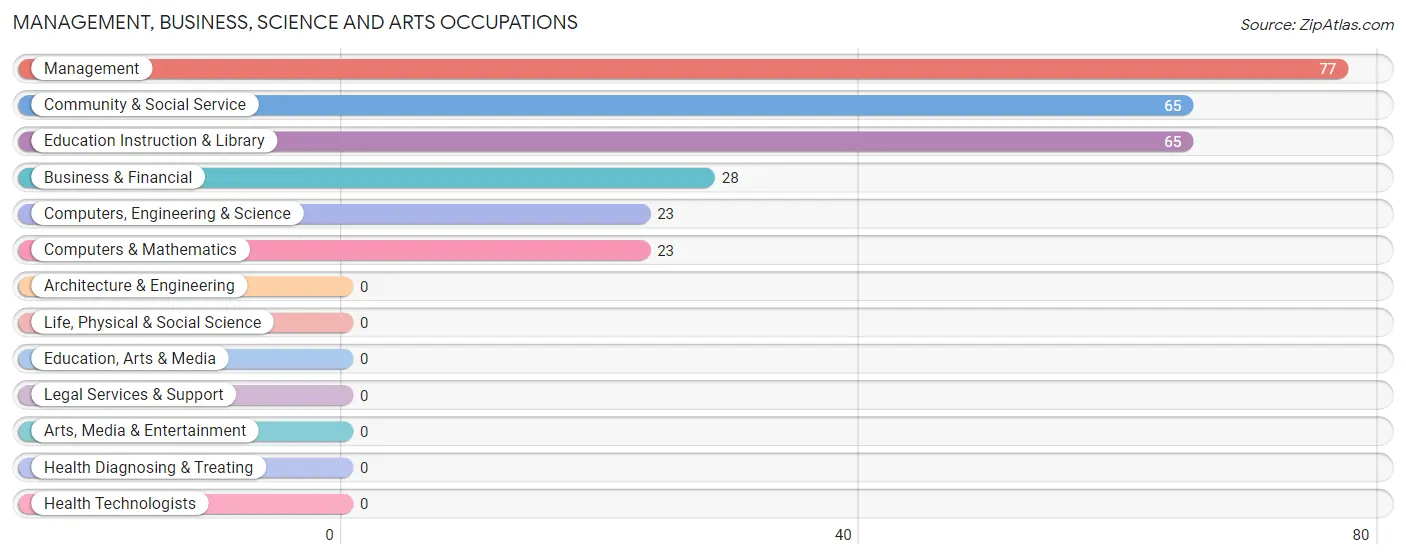
Management, Business, Science and Arts Occupations
The most common Management, Business, Science and Arts occupations in Lake Riverside are Management (77 | 15.4%), Community & Social Service (65 | 13.0%), Education Instruction & Library (65 | 13.0%), Business & Financial (28 | 5.6%), and Computers, Engineering & Science (23 | 4.6%).
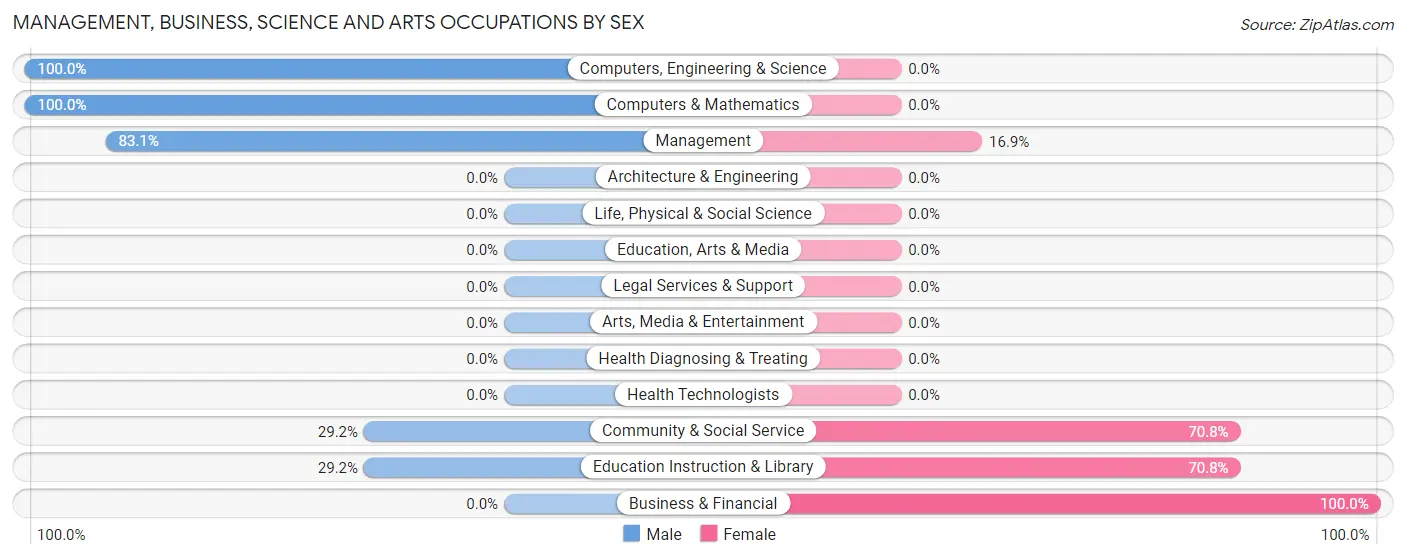
Management, Business, Science and Arts Occupations by Sex
Within the Management, Business, Science and Arts occupations in Lake Riverside, the most male-oriented occupations are Computers, Engineering & Science (100.0%), Computers & Mathematics (100.0%), and Management (83.1%), while the most female-oriented occupations are Business & Financial (100.0%), Community & Social Service (70.8%), and Education Instruction & Library (70.8%).
| Occupation | Male | Female |
| Management | 64 (83.1%) | 13 (16.9%) |
| Business & Financial | 0 (0.0%) | 28 (100.0%) |
| Computers, Engineering & Science | 23 (100.0%) | 0 (0.0%) |
| Computers & Mathematics | 23 (100.0%) | 0 (0.0%) |
| Architecture & Engineering | 0 (0.0%) | 0 (0.0%) |
| Life, Physical & Social Science | 0 (0.0%) | 0 (0.0%) |
| Community & Social Service | 19 (29.2%) | 46 (70.8%) |
| Education, Arts & Media | 0 (0.0%) | 0 (0.0%) |
| Legal Services & Support | 0 (0.0%) | 0 (0.0%) |
| Education Instruction & Library | 19 (29.2%) | 46 (70.8%) |
| Arts, Media & Entertainment | 0 (0.0%) | 0 (0.0%) |
| Health Diagnosing & Treating | 0 (0.0%) | 0 (0.0%) |
| Health Technologists | 0 (0.0%) | 0 (0.0%) |
| Total (Category) | 106 (54.9%) | 87 (45.1%) |
| Total (Overall) | 299 (59.7%) | 202 (40.3%) |
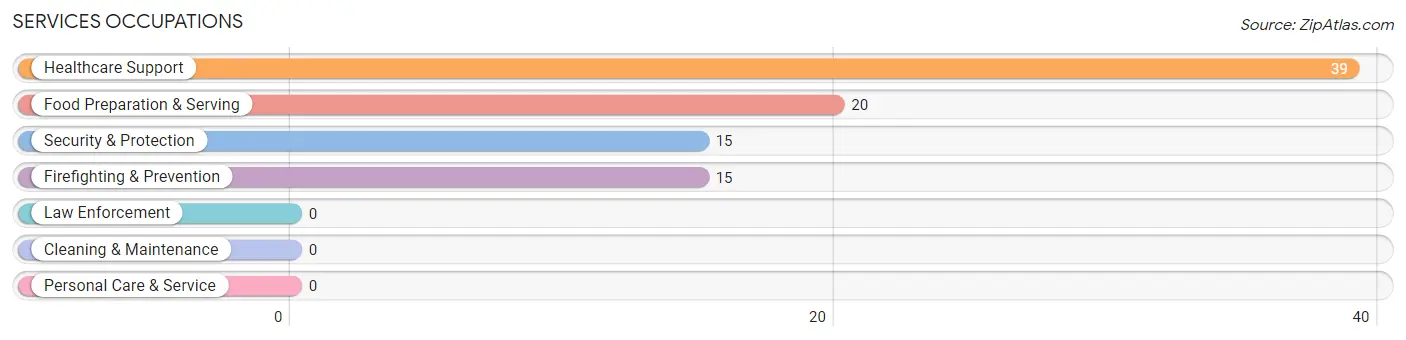
Services Occupations
The most common Services occupations in Lake Riverside are Healthcare Support (39 | 7.8%), Food Preparation & Serving (20 | 4.0%), Security & Protection (15 | 3.0%), and Firefighting & Prevention (15 | 3.0%).
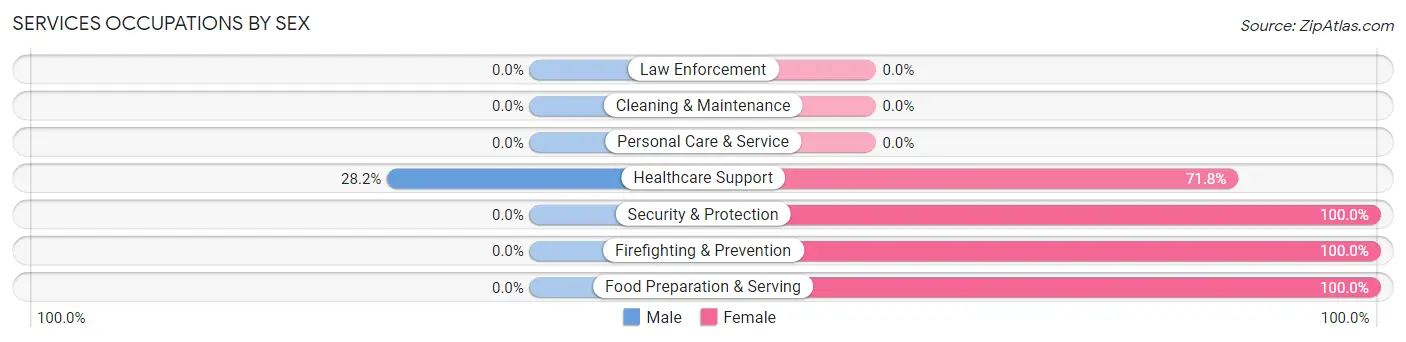
Services Occupations by Sex
| Occupation | Male | Female |
| Healthcare Support | 11 (28.2%) | 28 (71.8%) |
| Security & Protection | 0 (0.0%) | 15 (100.0%) |
| Firefighting & Prevention | 0 (0.0%) | 15 (100.0%) |
| Law Enforcement | 0 (0.0%) | 0 (0.0%) |
| Food Preparation & Serving | 0 (0.0%) | 20 (100.0%) |
| Cleaning & Maintenance | 0 (0.0%) | 0 (0.0%) |
| Personal Care & Service | 0 (0.0%) | 0 (0.0%) |
| Total (Category) | 11 (14.9%) | 63 (85.1%) |
| Total (Overall) | 299 (59.7%) | 202 (40.3%) |
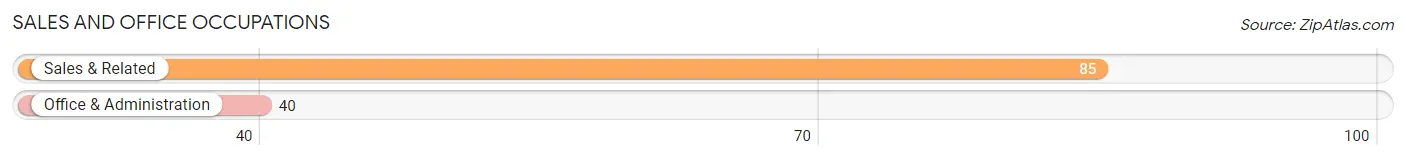
Sales and Office Occupations
The most common Sales and Office occupations in Lake Riverside are Sales & Related (85 | 17.0%), and Office & Administration (40 | 8.0%).
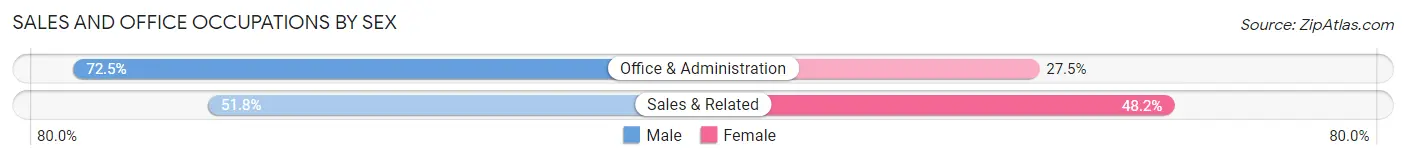
Sales and Office Occupations by Sex
| Occupation | Male | Female |
| Sales & Related | 44 (51.8%) | 41 (48.2%) |
| Office & Administration | 29 (72.5%) | 11 (27.5%) |
| Total (Category) | 73 (58.4%) | 52 (41.6%) |
| Total (Overall) | 299 (59.7%) | 202 (40.3%) |
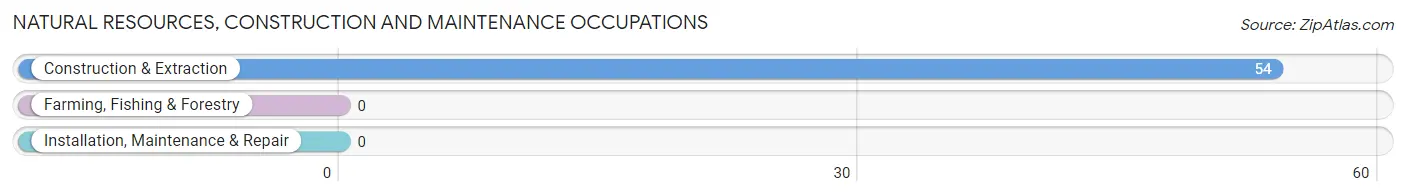
Natural Resources, Construction and Maintenance Occupations
The most common Natural Resources, Construction and Maintenance occupations in Lake Riverside are , and Construction & Extraction (54 | 10.8%).
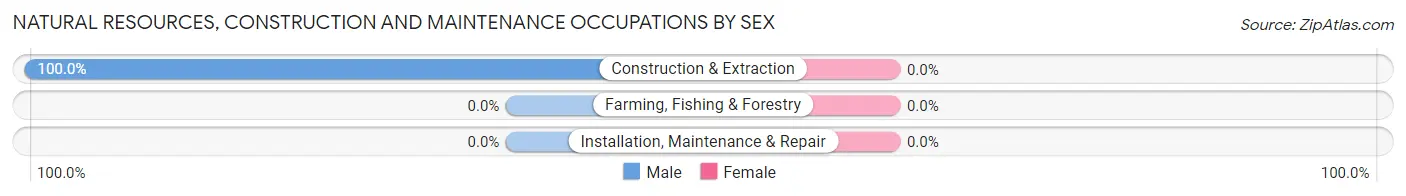
Natural Resources, Construction and Maintenance Occupations by Sex
| Occupation | Male | Female |
| Farming, Fishing & Forestry | 0 (0.0%) | 0 (0.0%) |
| Construction & Extraction | 54 (100.0%) | 0 (0.0%) |
| Installation, Maintenance & Repair | 0 (0.0%) | 0 (0.0%) |
| Total (Category) | 54 (100.0%) | 0 (0.0%) |
| Total (Overall) | 299 (59.7%) | 202 (40.3%) |
Production, Transportation and Moving Occupations
The most common Production, Transportation and Moving occupations in Lake Riverside are Material Moving (43 | 8.6%), and Production (12 | 2.4%).
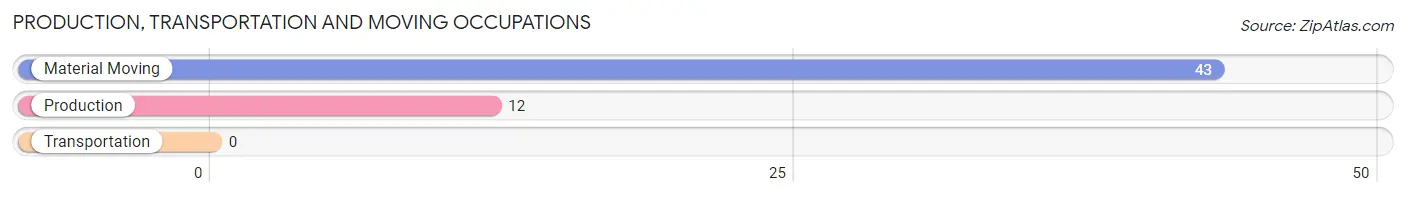
Production, Transportation and Moving Occupations by Sex
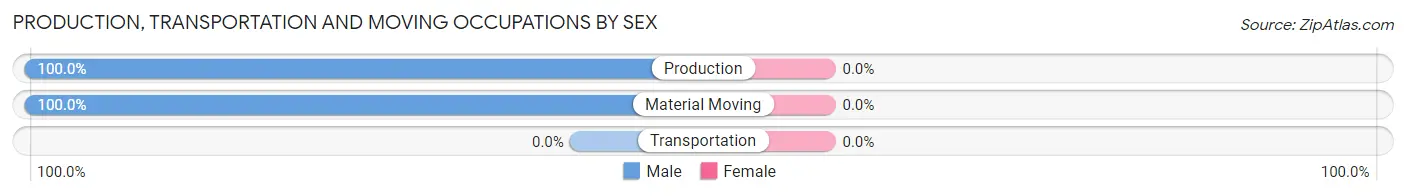
| Occupation | Male | Female |
| Production | 12 (100.0%) | 0 (0.0%) |
| Transportation | 0 (0.0%) | 0 (0.0%) |
| Material Moving | 43 (100.0%) | 0 (0.0%) |
| Total (Category) | 55 (100.0%) | 0 (0.0%) |
| Total (Overall) | 299 (59.7%) | 202 (40.3%) |
Employment Industries by Sex in Lake Riverside
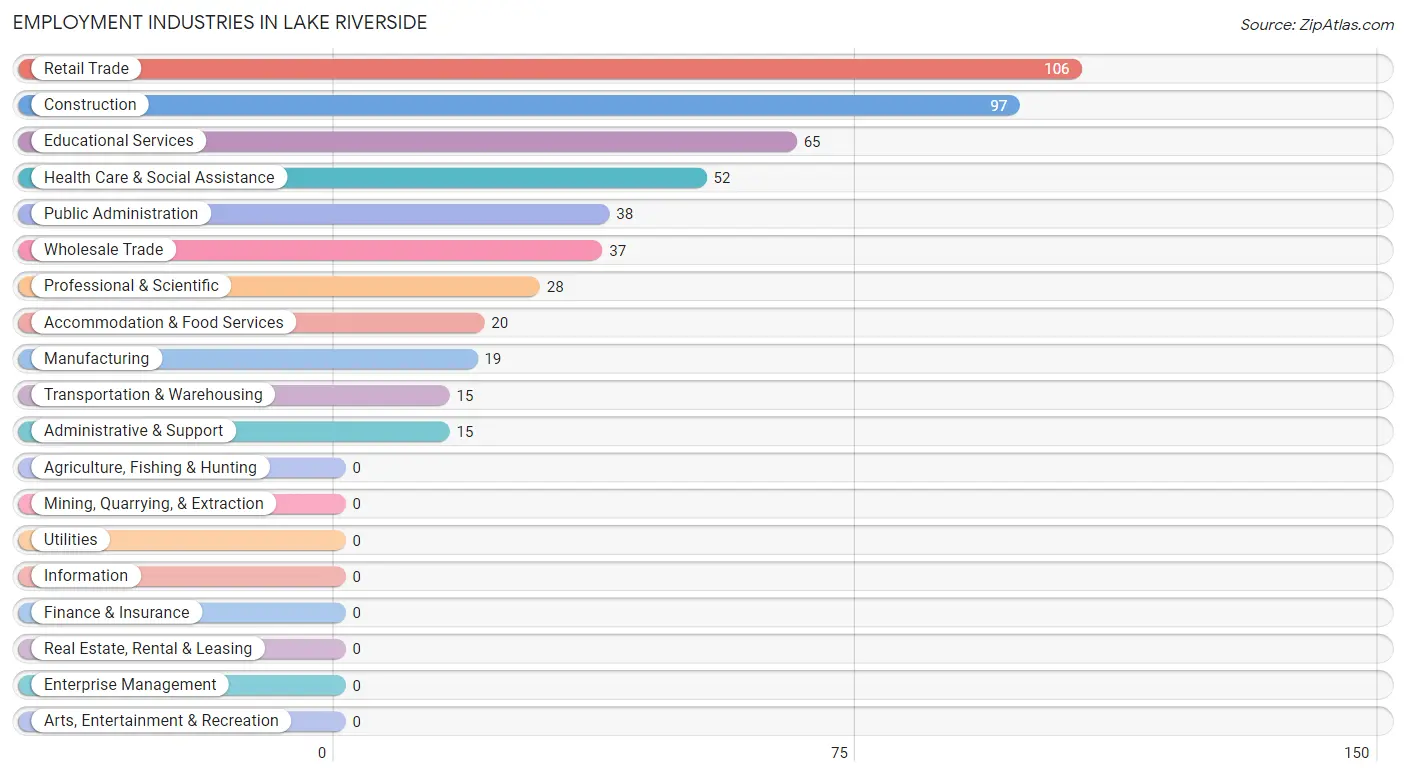
Employment Industries in Lake Riverside
The major employment industries in Lake Riverside include Retail Trade (106 | 21.2%), Construction (97 | 19.4%), Educational Services (65 | 13.0%), Health Care & Social Assistance (52 | 10.4%), and Public Administration (38 | 7.6%).
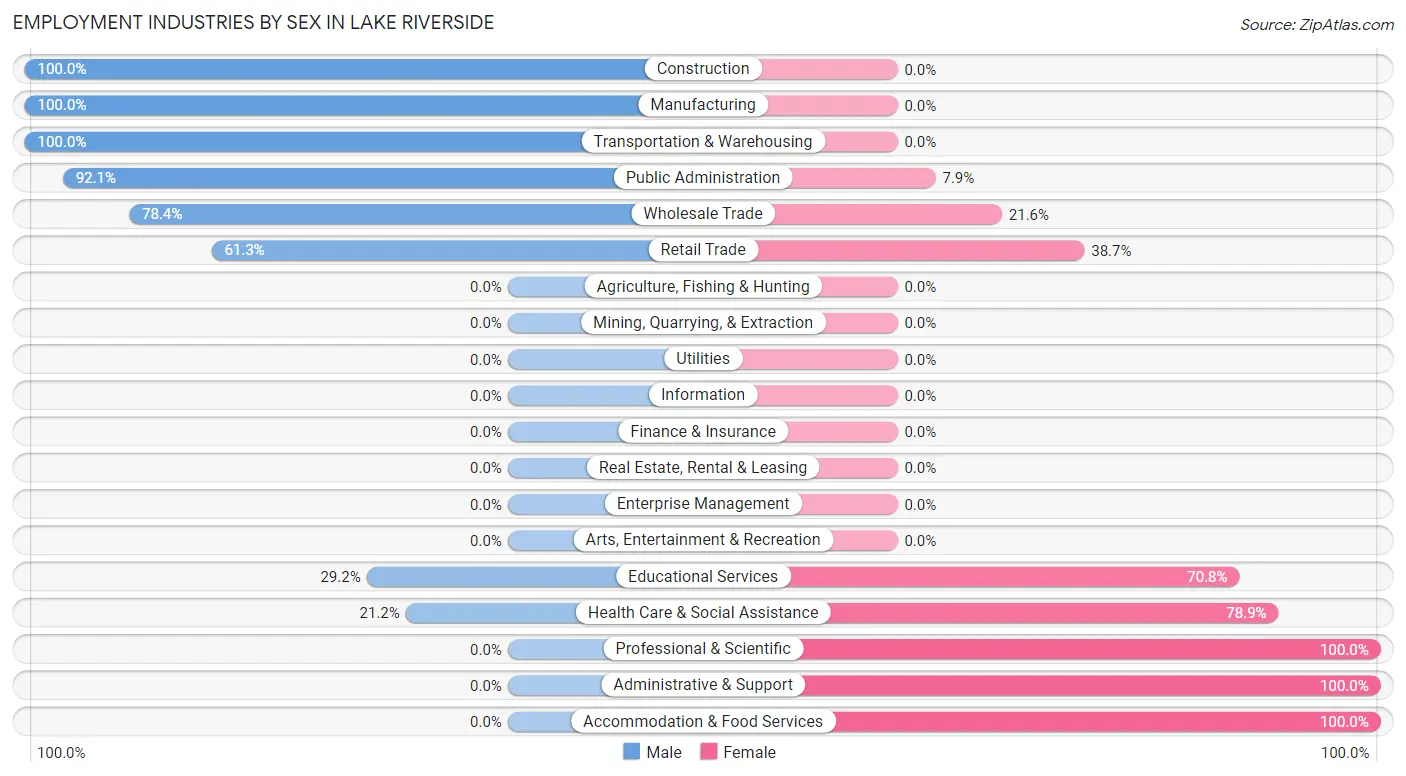
Employment Industries by Sex in Lake Riverside
The Lake Riverside industries that see more men than women are Construction (100.0%), Manufacturing (100.0%), and Transportation & Warehousing (100.0%), whereas the industries that tend to have a higher number of women are Professional & Scientific (100.0%), Administrative & Support (100.0%), and Accommodation & Food Services (100.0%).
| Industry | Male | Female |
| Agriculture, Fishing & Hunting | 0 (0.0%) | 0 (0.0%) |
| Mining, Quarrying, & Extraction | 0 (0.0%) | 0 (0.0%) |
| Construction | 97 (100.0%) | 0 (0.0%) |
| Manufacturing | 19 (100.0%) | 0 (0.0%) |
| Wholesale Trade | 29 (78.4%) | 8 (21.6%) |
| Retail Trade | 65 (61.3%) | 41 (38.7%) |
| Transportation & Warehousing | 15 (100.0%) | 0 (0.0%) |
| Utilities | 0 (0.0%) | 0 (0.0%) |
| Information | 0 (0.0%) | 0 (0.0%) |
| Finance & Insurance | 0 (0.0%) | 0 (0.0%) |
| Real Estate, Rental & Leasing | 0 (0.0%) | 0 (0.0%) |
| Professional & Scientific | 0 (0.0%) | 28 (100.0%) |
| Enterprise Management | 0 (0.0%) | 0 (0.0%) |
| Administrative & Support | 0 (0.0%) | 15 (100.0%) |
| Educational Services | 19 (29.2%) | 46 (70.8%) |
| Health Care & Social Assistance | 11 (21.1%) | 41 (78.8%) |
| Arts, Entertainment & Recreation | 0 (0.0%) | 0 (0.0%) |
| Accommodation & Food Services | 0 (0.0%) | 20 (100.0%) |
| Public Administration | 35 (92.1%) | 3 (7.9%) |
| Total | 299 (59.7%) | 202 (40.3%) |
Education in Lake Riverside
School Enrollment in Lake Riverside
The most common levels of schooling among the 328 students in Lake Riverside are elementary school (94 | 28.7%), high school (75 | 22.9%), and college / undergraduate (52 | 15.9%).
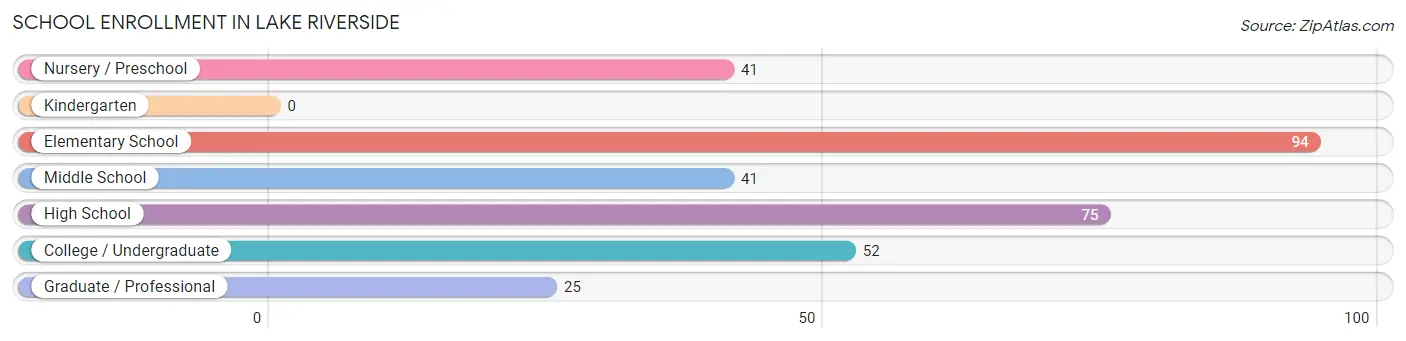
| School Level | # Students | % Students |
| Nursery / Preschool | 41 | 12.5% |
| Kindergarten | 0 | 0.0% |
| Elementary School | 94 | 28.7% |
| Middle School | 41 | 12.5% |
| High School | 75 | 22.9% |
| College / Undergraduate | 52 | 15.9% |
| Graduate / Professional | 25 | 7.6% |
| Total | 328 | 100.0% |
School Enrollment by Age by Funding Source in Lake Riverside
Out of a total of 328 students who are enrolled in schools in Lake Riverside, 32 (9.8%) attend a private institution, while the remaining 296 (90.2%) are enrolled in public schools. The age group of 25 to 34 year olds has the highest likelihood of being enrolled in private schools, with 19 (86.4% in the age bracket) enrolled. Conversely, the age group of 3 to 4 year olds has the lowest likelihood of being enrolled in a private school, with 32 (100.0% in the age bracket) attending a public institution.
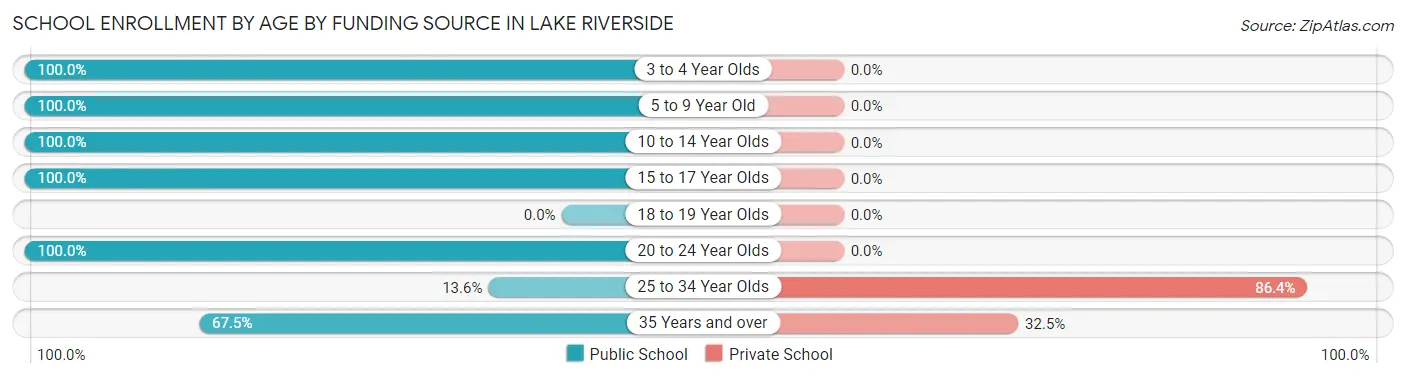
| Age Bracket | Public School | Private School |
| 3 to 4 Year Olds | 32 (100.0%) | 0 (0.0%) |
| 5 to 9 Year Old | 103 (100.0%) | 0 (0.0%) |
| 10 to 14 Year Olds | 74 (100.0%) | 0 (0.0%) |
| 15 to 17 Year Olds | 42 (100.0%) | 0 (0.0%) |
| 18 to 19 Year Olds | 0 (0.0%) | 0 (0.0%) |
| 20 to 24 Year Olds | 15 (100.0%) | 0 (0.0%) |
| 25 to 34 Year Olds | 3 (13.6%) | 19 (86.4%) |
| 35 Years and over | 27 (67.5%) | 13 (32.5%) |
| Total | 296 (90.2%) | 32 (9.8%) |
Educational Attainment by Field of Study in Lake Riverside
Liberal arts & history (79 | 23.9%), visual & performing arts (64 | 19.3%), business (56 | 16.9%), communications (44 | 13.3%), and arts & humanities (43 | 13.0%) are the most common fields of study among 331 individuals in Lake Riverside who have obtained a bachelor's degree or higher.
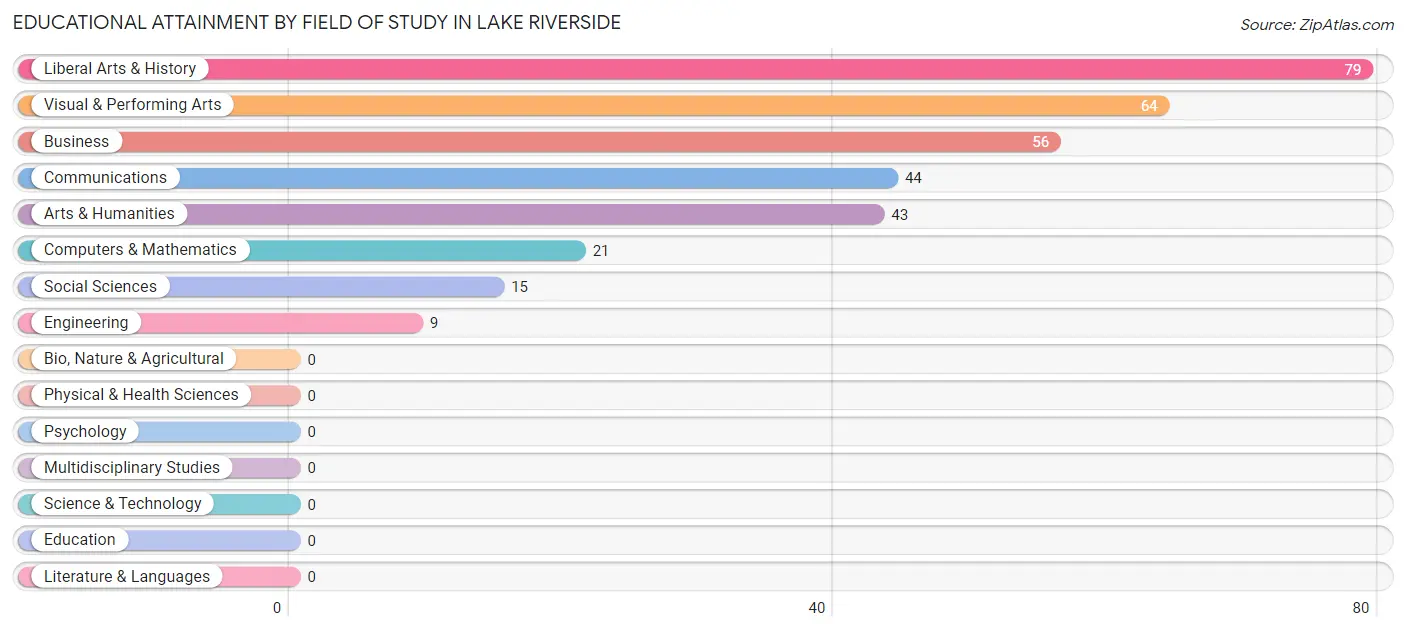
| Field of Study | # Graduates | % Graduates |
| Computers & Mathematics | 21 | 6.3% |
| Bio, Nature & Agricultural | 0 | 0.0% |
| Physical & Health Sciences | 0 | 0.0% |
| Psychology | 0 | 0.0% |
| Social Sciences | 15 | 4.5% |
| Engineering | 9 | 2.7% |
| Multidisciplinary Studies | 0 | 0.0% |
| Science & Technology | 0 | 0.0% |
| Business | 56 | 16.9% |
| Education | 0 | 0.0% |
| Literature & Languages | 0 | 0.0% |
| Liberal Arts & History | 79 | 23.9% |
| Visual & Performing Arts | 64 | 19.3% |
| Communications | 44 | 13.3% |
| Arts & Humanities | 43 | 13.0% |
| Total | 331 | 100.0% |
Transportation & Commute in Lake Riverside
Vehicle Availability by Sex in Lake Riverside
The most prevalent vehicle ownership categories in Lake Riverside are males with 4 vehicles (116, accounting for 38.8%) and females with 4 vehicles (87, making up 57.4%).
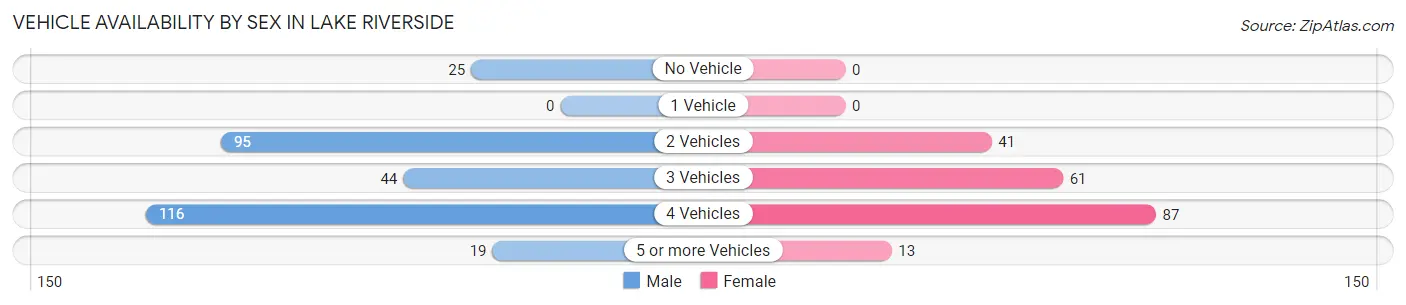
| Vehicles Available | Male | Female |
| No Vehicle | 25 (8.4%) | 0 (0.0%) |
| 1 Vehicle | 0 (0.0%) | 0 (0.0%) |
| 2 Vehicles | 95 (31.8%) | 41 (20.3%) |
| 3 Vehicles | 44 (14.7%) | 61 (30.2%) |
| 4 Vehicles | 116 (38.8%) | 87 (43.1%) |
| 5 or more Vehicles | 19 (6.4%) | 13 (6.4%) |
| Total | 299 (100.0%) | 202 (100.0%) |
Commute Time in Lake Riverside
The most frequently occuring commute durations in Lake Riverside are 45 to 59 minutes (173 commuters, 38.1%), 90 or more minutes (113 commuters, 24.9%), and less than 5 minutes (66 commuters, 14.5%).
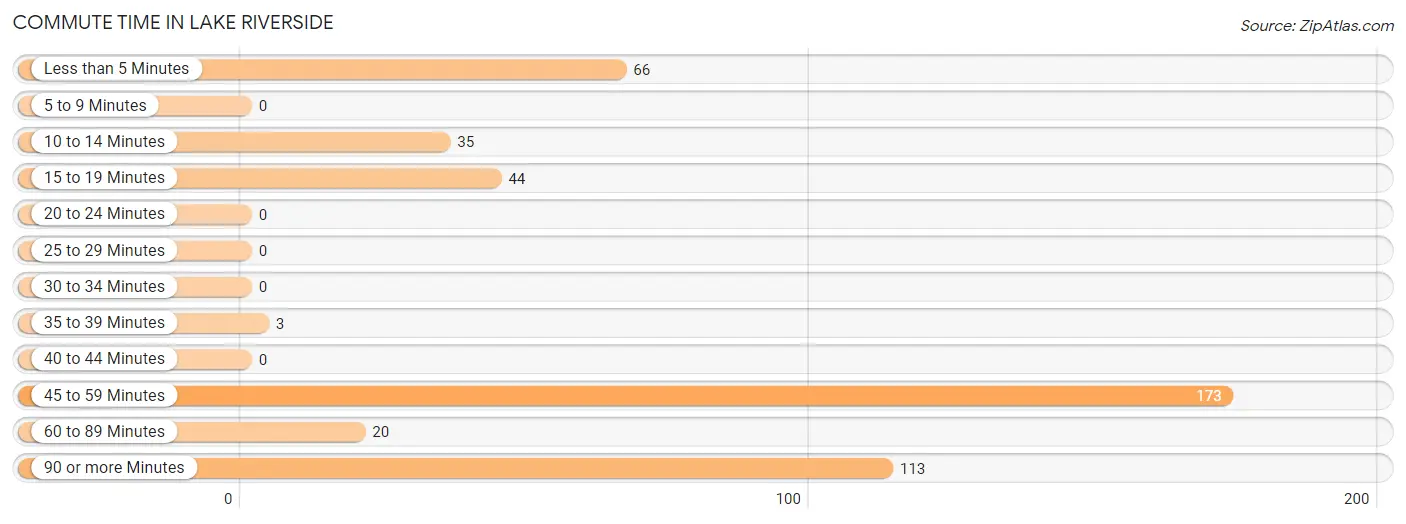
| Commute Time | # Commuters | % Commuters |
| Less than 5 Minutes | 66 | 14.5% |
| 5 to 9 Minutes | 0 | 0.0% |
| 10 to 14 Minutes | 35 | 7.7% |
| 15 to 19 Minutes | 44 | 9.7% |
| 20 to 24 Minutes | 0 | 0.0% |
| 25 to 29 Minutes | 0 | 0.0% |
| 30 to 34 Minutes | 0 | 0.0% |
| 35 to 39 Minutes | 3 | 0.7% |
| 40 to 44 Minutes | 0 | 0.0% |
| 45 to 59 Minutes | 173 | 38.1% |
| 60 to 89 Minutes | 20 | 4.4% |
| 90 or more Minutes | 113 | 24.9% |
Commute Time by Sex in Lake Riverside
The most common commute times in Lake Riverside are 45 to 59 minutes (119 commuters, 41.3%) for males and 45 to 59 minutes (54 commuters, 32.5%) for females.
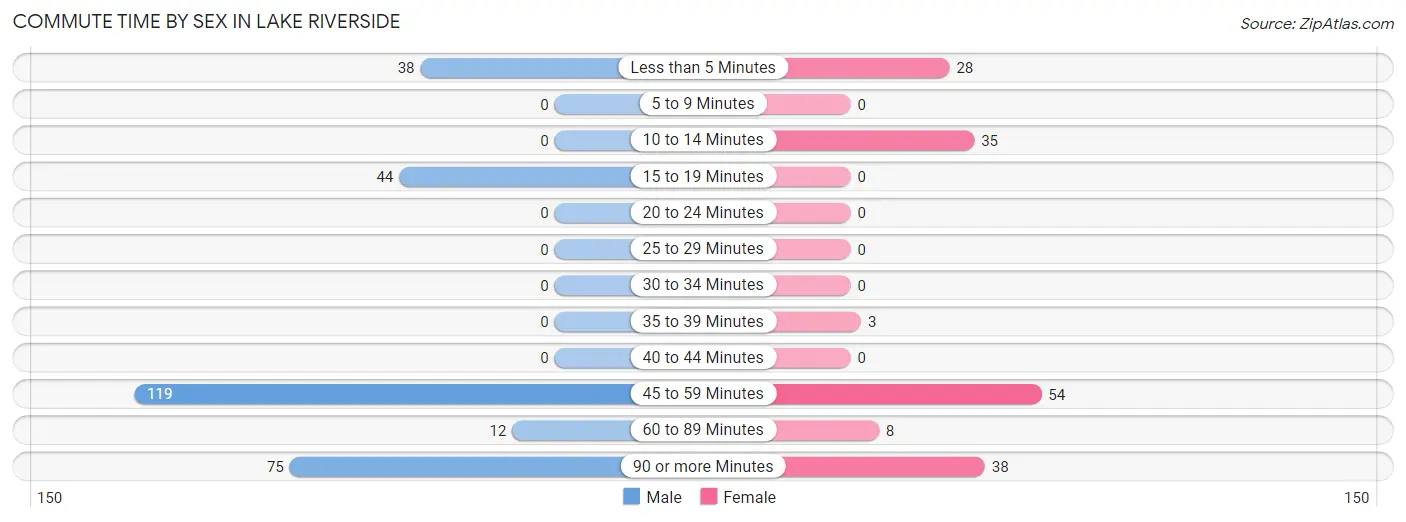
| Commute Time | Male | Female |
| Less than 5 Minutes | 38 (13.2%) | 28 (16.9%) |
| 5 to 9 Minutes | 0 (0.0%) | 0 (0.0%) |
| 10 to 14 Minutes | 0 (0.0%) | 35 (21.1%) |
| 15 to 19 Minutes | 44 (15.3%) | 0 (0.0%) |
| 20 to 24 Minutes | 0 (0.0%) | 0 (0.0%) |
| 25 to 29 Minutes | 0 (0.0%) | 0 (0.0%) |
| 30 to 34 Minutes | 0 (0.0%) | 0 (0.0%) |
| 35 to 39 Minutes | 0 (0.0%) | 3 (1.8%) |
| 40 to 44 Minutes | 0 (0.0%) | 0 (0.0%) |
| 45 to 59 Minutes | 119 (41.3%) | 54 (32.5%) |
| 60 to 89 Minutes | 12 (4.2%) | 8 (4.8%) |
| 90 or more Minutes | 75 (26.0%) | 38 (22.9%) |
Time of Departure to Work by Sex in Lake Riverside
The most frequent times of departure to work in Lake Riverside are 6:00 AM to 6:29 AM (79, 27.4%) for males and 4:00 PM to 11:59 PM (41, 24.7%) for females.
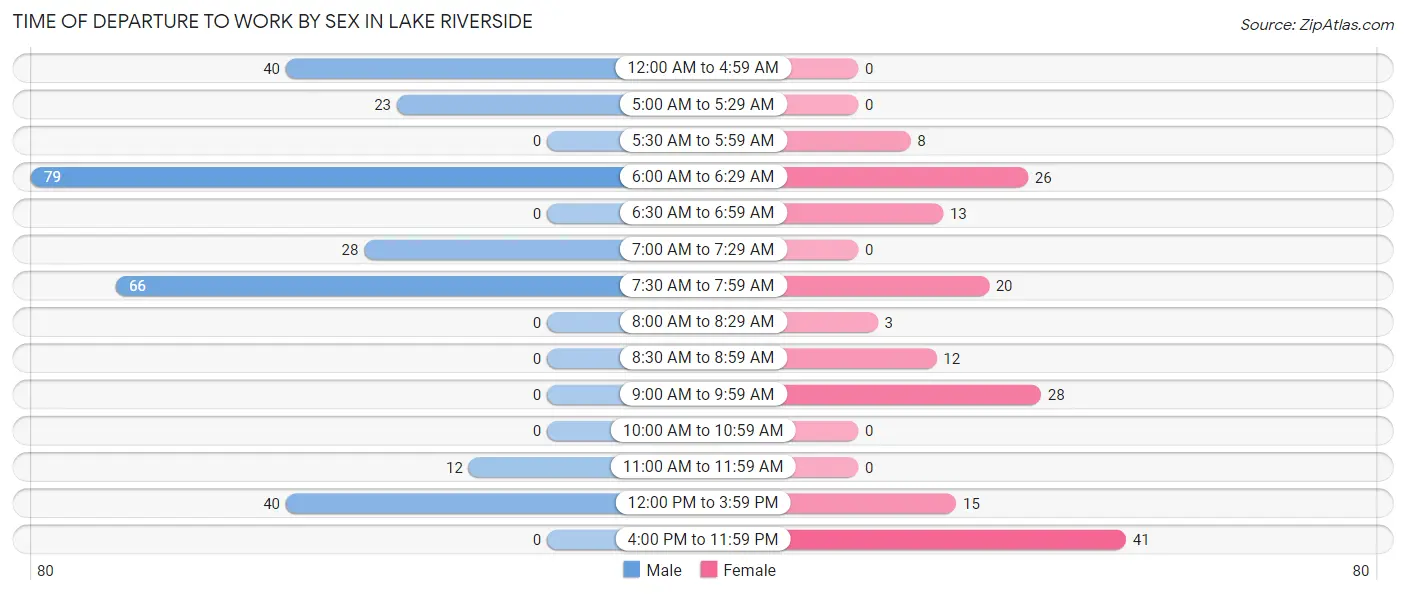
| Time of Departure | Male | Female |
| 12:00 AM to 4:59 AM | 40 (13.9%) | 0 (0.0%) |
| 5:00 AM to 5:29 AM | 23 (8.0%) | 0 (0.0%) |
| 5:30 AM to 5:59 AM | 0 (0.0%) | 8 (4.8%) |
| 6:00 AM to 6:29 AM | 79 (27.4%) | 26 (15.7%) |
| 6:30 AM to 6:59 AM | 0 (0.0%) | 13 (7.8%) |
| 7:00 AM to 7:29 AM | 28 (9.7%) | 0 (0.0%) |
| 7:30 AM to 7:59 AM | 66 (22.9%) | 20 (12.0%) |
| 8:00 AM to 8:29 AM | 0 (0.0%) | 3 (1.8%) |
| 8:30 AM to 8:59 AM | 0 (0.0%) | 12 (7.2%) |
| 9:00 AM to 9:59 AM | 0 (0.0%) | 28 (16.9%) |
| 10:00 AM to 10:59 AM | 0 (0.0%) | 0 (0.0%) |
| 11:00 AM to 11:59 AM | 12 (4.2%) | 0 (0.0%) |
| 12:00 PM to 3:59 PM | 40 (13.9%) | 15 (9.0%) |
| 4:00 PM to 11:59 PM | 0 (0.0%) | 41 (24.7%) |
| Total | 288 (100.0%) | 166 (100.0%) |
Housing Occupancy in Lake Riverside
Occupancy by Ownership in Lake Riverside
Of the total 450 dwellings in Lake Riverside, owner-occupied units account for 450 (100.0%), while renter-occupied units make up 0 (0.0%).
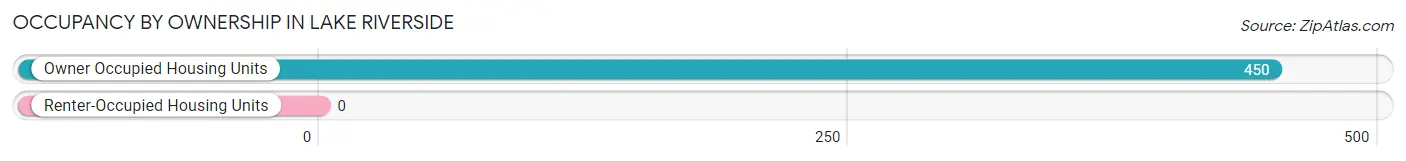
| Occupancy | # Housing Units | % Housing Units |
| Owner Occupied Housing Units | 450 | 100.0% |
| Renter-Occupied Housing Units | 0 | 0.0% |
| Total Occupied Housing Units | 450 | 100.0% |
Occupancy by Household Size in Lake Riverside
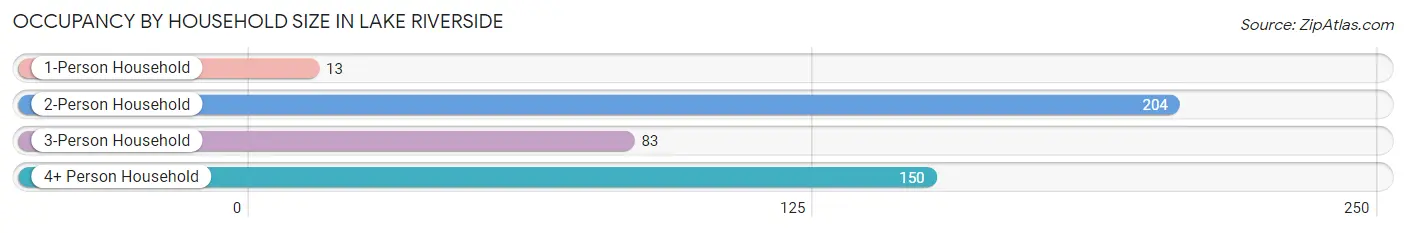
| Household Size | # Housing Units | % Housing Units |
| 1-Person Household | 13 | 2.9% |
| 2-Person Household | 204 | 45.3% |
| 3-Person Household | 83 | 18.4% |
| 4+ Person Household | 150 | 33.3% |
| Total Housing Units | 450 | 100.0% |
Occupancy by Ownership by Household Size in Lake Riverside
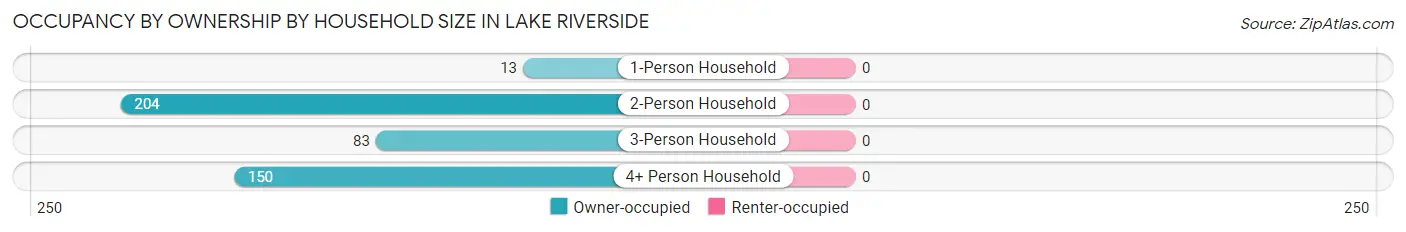
| Household Size | Owner-occupied | Renter-occupied |
| 1-Person Household | 13 (100.0%) | 0 (0.0%) |
| 2-Person Household | 204 (100.0%) | 0 (0.0%) |
| 3-Person Household | 83 (100.0%) | 0 (0.0%) |
| 4+ Person Household | 150 (100.0%) | 0 (0.0%) |
| Total Housing Units | 450 (100.0%) | 0 (0.0%) |
Occupancy by Educational Attainment in Lake Riverside
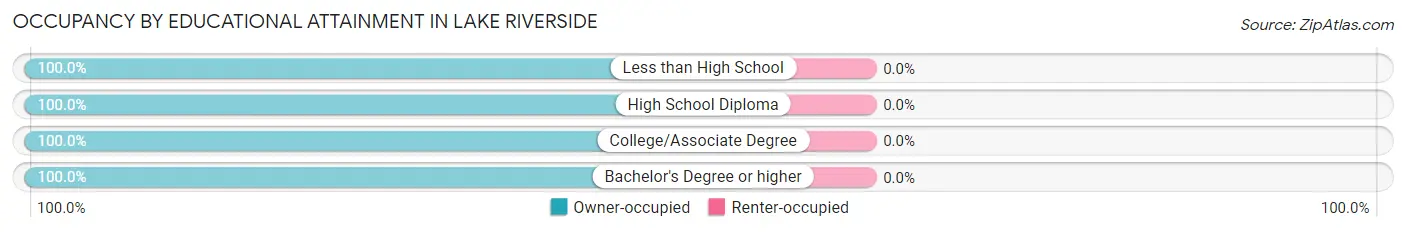
| Household Size | Owner-occupied | Renter-occupied |
| Less than High School | 52 (100.0%) | 0 (0.0%) |
| High School Diploma | 52 (100.0%) | 0 (0.0%) |
| College/Associate Degree | 226 (100.0%) | 0 (0.0%) |
| Bachelor's Degree or higher | 120 (100.0%) | 0 (0.0%) |
Occupancy by Age of Householder in Lake Riverside
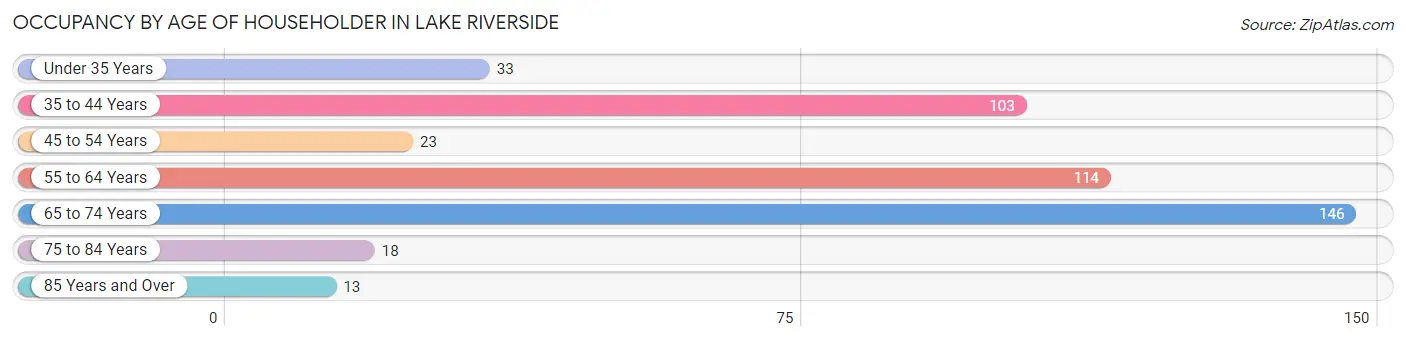
| Age Bracket | # Households | % Households |
| Under 35 Years | 33 | 7.3% |
| 35 to 44 Years | 103 | 22.9% |
| 45 to 54 Years | 23 | 5.1% |
| 55 to 64 Years | 114 | 25.3% |
| 65 to 74 Years | 146 | 32.4% |
| 75 to 84 Years | 18 | 4.0% |
| 85 Years and Over | 13 | 2.9% |
| Total | 450 | 100.0% |
Housing Finances in Lake Riverside
Median Income by Occupancy in Lake Riverside
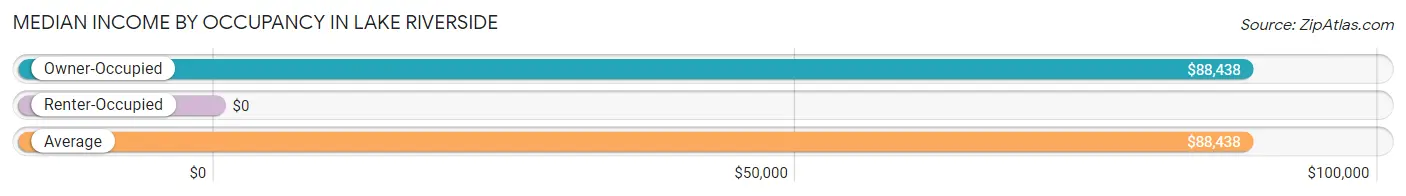
| Occupancy Type | # Households | Median Income |
| Owner-Occupied | 450 (100.0%) | $88,438 |
| Renter-Occupied | 0 (0.0%) | $0 |
| Average | 450 (100.0%) | $88,438 |
Occupancy by Householder Income Bracket in Lake Riverside
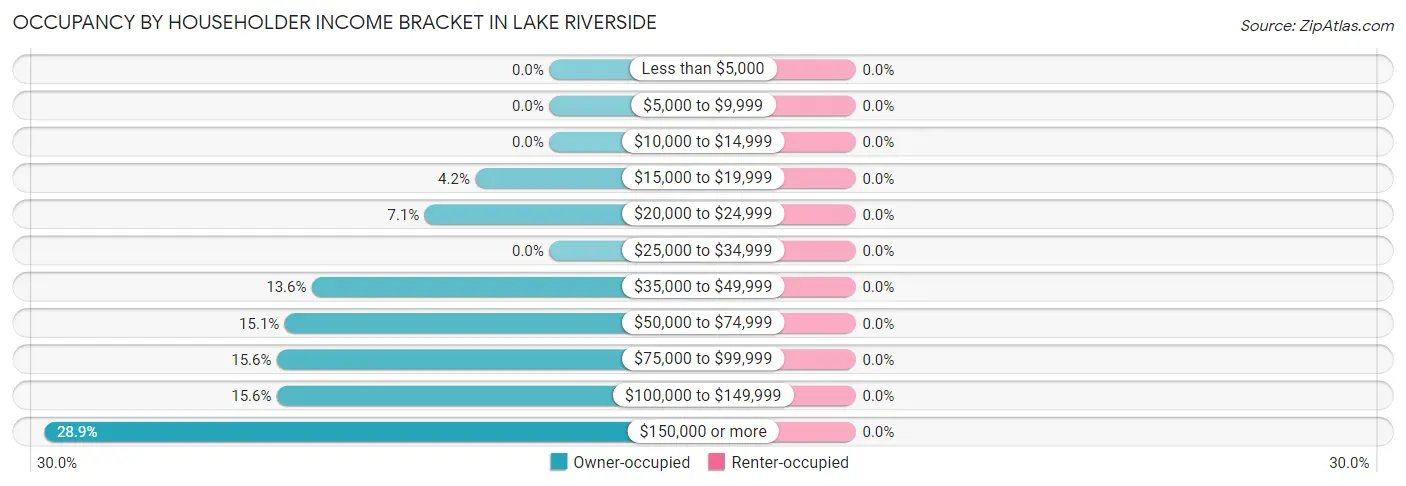
| Income Bracket | Owner-occupied | Renter-occupied |
| Less than $5,000 | 0 (0.0%) | 0 (0.0%) |
| $5,000 to $9,999 | 0 (0.0%) | 0 (0.0%) |
| $10,000 to $14,999 | 0 (0.0%) | 0 (0.0%) |
| $15,000 to $19,999 | 19 (4.2%) | 0 (0.0%) |
| $20,000 to $24,999 | 32 (7.1%) | 0 (0.0%) |
| $25,000 to $34,999 | 0 (0.0%) | 0 (0.0%) |
| $35,000 to $49,999 | 61 (13.6%) | 0 (0.0%) |
| $50,000 to $74,999 | 68 (15.1%) | 0 (0.0%) |
| $75,000 to $99,999 | 70 (15.6%) | 0 (0.0%) |
| $100,000 to $149,999 | 70 (15.6%) | 0 (0.0%) |
| $150,000 or more | 130 (28.9%) | 0 (0.0%) |
| Total | 450 (100.0%) | 0 (0.0%) |
Monthly Housing Cost Tiers in Lake Riverside
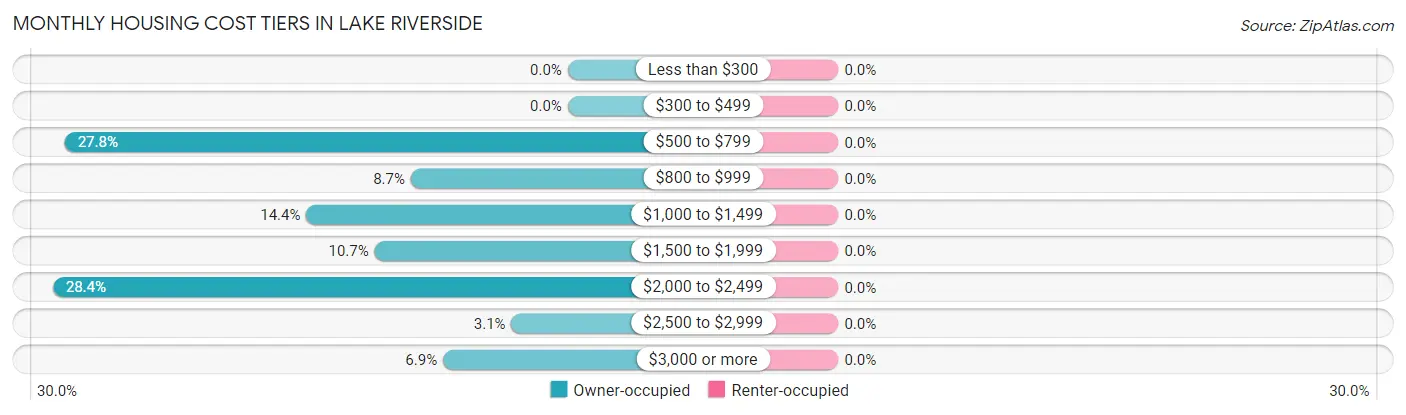
| Monthly Cost | Owner-occupied | Renter-occupied |
| Less than $300 | 0 (0.0%) | 0 (0.0%) |
| $300 to $499 | 0 (0.0%) | 0 (0.0%) |
| $500 to $799 | 125 (27.8%) | 0 (0.0%) |
| $800 to $999 | 39 (8.7%) | 0 (0.0%) |
| $1,000 to $1,499 | 65 (14.4%) | 0 (0.0%) |
| $1,500 to $1,999 | 48 (10.7%) | 0 (0.0%) |
| $2,000 to $2,499 | 128 (28.4%) | 0 (0.0%) |
| $2,500 to $2,999 | 14 (3.1%) | 0 (0.0%) |
| $3,000 or more | 31 (6.9%) | 0 (0.0%) |
| Total | 450 (100.0%) | 0 (0.0%) |
Physical Housing Characteristics in Lake Riverside
Housing Structures in Lake Riverside
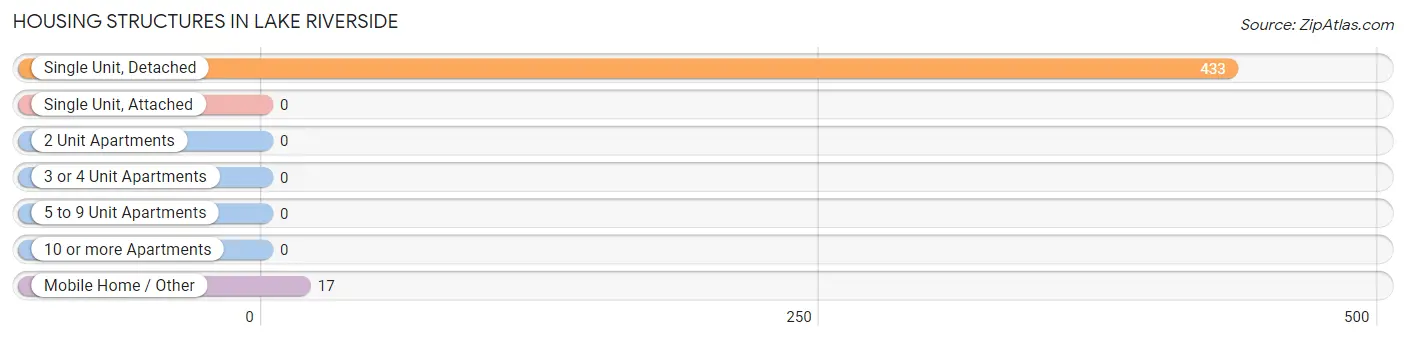
| Structure Type | # Housing Units | % Housing Units |
| Single Unit, Detached | 433 | 96.2% |
| Single Unit, Attached | 0 | 0.0% |
| 2 Unit Apartments | 0 | 0.0% |
| 3 or 4 Unit Apartments | 0 | 0.0% |
| 5 to 9 Unit Apartments | 0 | 0.0% |
| 10 or more Apartments | 0 | 0.0% |
| Mobile Home / Other | 17 | 3.8% |
| Total | 450 | 100.0% |
Housing Structures by Occupancy in Lake Riverside
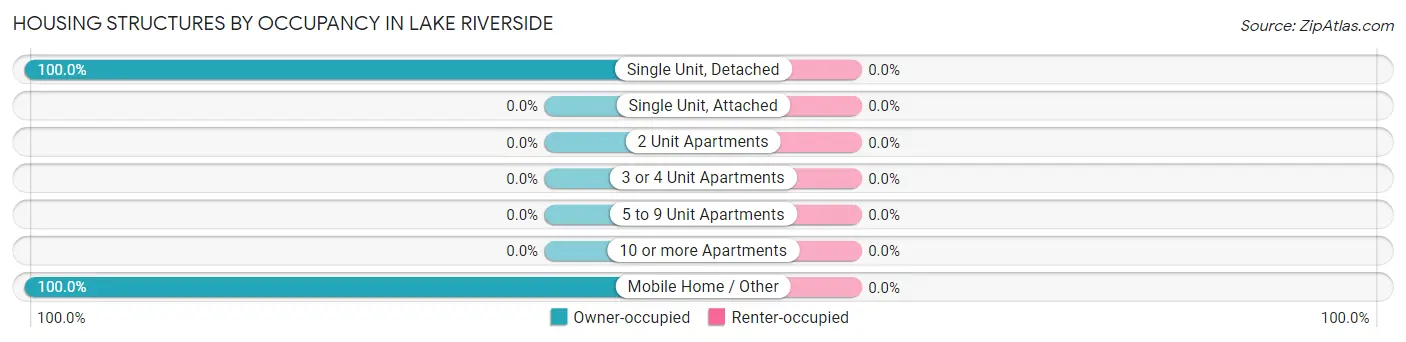
| Structure Type | Owner-occupied | Renter-occupied |
| Single Unit, Detached | 433 (100.0%) | 0 (0.0%) |
| Single Unit, Attached | 0 (0.0%) | 0 (0.0%) |
| 2 Unit Apartments | 0 (0.0%) | 0 (0.0%) |
| 3 or 4 Unit Apartments | 0 (0.0%) | 0 (0.0%) |
| 5 to 9 Unit Apartments | 0 (0.0%) | 0 (0.0%) |
| 10 or more Apartments | 0 (0.0%) | 0 (0.0%) |
| Mobile Home / Other | 17 (100.0%) | 0 (0.0%) |
| Total | 450 (100.0%) | 0 (0.0%) |
Housing Structures by Number of Rooms in Lake Riverside
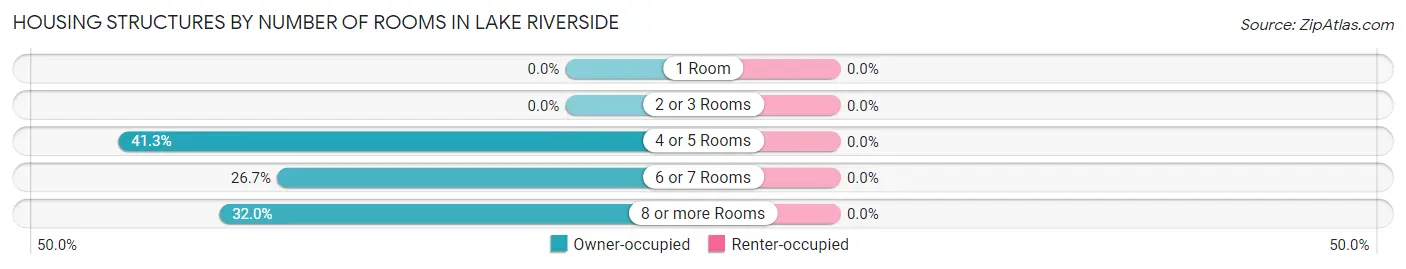
| Number of Rooms | Owner-occupied | Renter-occupied |
| 1 Room | 0 (0.0%) | 0 (0.0%) |
| 2 or 3 Rooms | 0 (0.0%) | 0 (0.0%) |
| 4 or 5 Rooms | 186 (41.3%) | 0 (0.0%) |
| 6 or 7 Rooms | 120 (26.7%) | 0 (0.0%) |
| 8 or more Rooms | 144 (32.0%) | 0 (0.0%) |
| Total | 450 (100.0%) | 0 (0.0%) |
Housing Structure by Heating Type in Lake Riverside
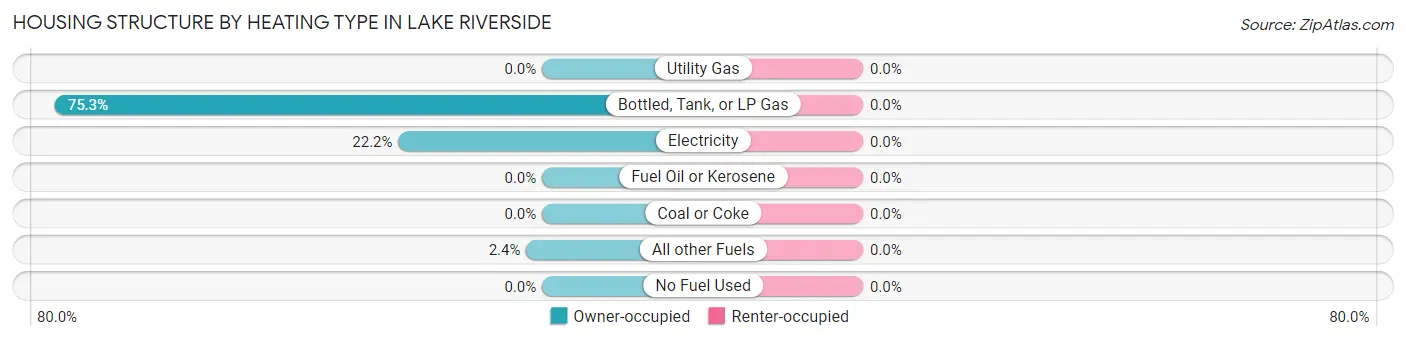
| Heating Type | Owner-occupied | Renter-occupied |
| Utility Gas | 0 (0.0%) | 0 (0.0%) |
| Bottled, Tank, or LP Gas | 339 (75.3%) | 0 (0.0%) |
| Electricity | 100 (22.2%) | 0 (0.0%) |
| Fuel Oil or Kerosene | 0 (0.0%) | 0 (0.0%) |
| Coal or Coke | 0 (0.0%) | 0 (0.0%) |
| All other Fuels | 11 (2.4%) | 0 (0.0%) |
| No Fuel Used | 0 (0.0%) | 0 (0.0%) |
| Total | 450 (100.0%) | 0 (0.0%) |
Household Vehicle Usage in Lake Riverside
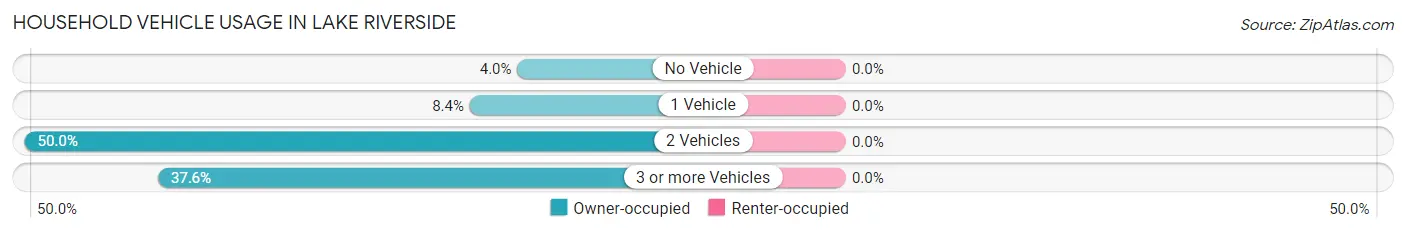
| Vehicles per Household | Owner-occupied | Renter-occupied |
| No Vehicle | 18 (4.0%) | 0 (0.0%) |
| 1 Vehicle | 38 (8.4%) | 0 (0.0%) |
| 2 Vehicles | 225 (50.0%) | 0 (0.0%) |
| 3 or more Vehicles | 169 (37.6%) | 0 (0.0%) |
| Total | 450 (100.0%) | 0 (0.0%) |
Real Estate & Mortgages in Lake Riverside
Real Estate and Mortgage Overview in Lake Riverside
| Characteristic | Without Mortgage | With Mortgage |
| Housing Units | 157 | 293 |
| Median Property Value | $389,700 | $427,500 |
| Median Household Income | $56,611 | $107 |
| Monthly Housing Costs | $792 | $31 |
| Real Estate Taxes | $3,449 | $0 |
Property Value by Mortgage Status in Lake Riverside
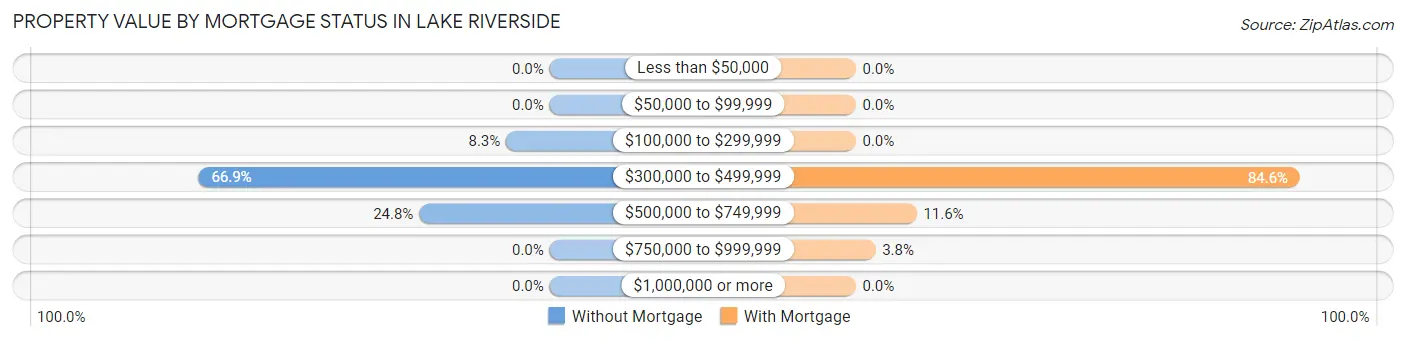
| Property Value | Without Mortgage | With Mortgage |
| Less than $50,000 | 0 (0.0%) | 0 (0.0%) |
| $50,000 to $99,999 | 0 (0.0%) | 0 (0.0%) |
| $100,000 to $299,999 | 13 (8.3%) | 0 (0.0%) |
| $300,000 to $499,999 | 105 (66.9%) | 248 (84.6%) |
| $500,000 to $749,999 | 39 (24.8%) | 34 (11.6%) |
| $750,000 to $999,999 | 0 (0.0%) | 11 (3.7%) |
| $1,000,000 or more | 0 (0.0%) | 0 (0.0%) |
| Total | 157 (100.0%) | 293 (100.0%) |
Household Income by Mortgage Status in Lake Riverside
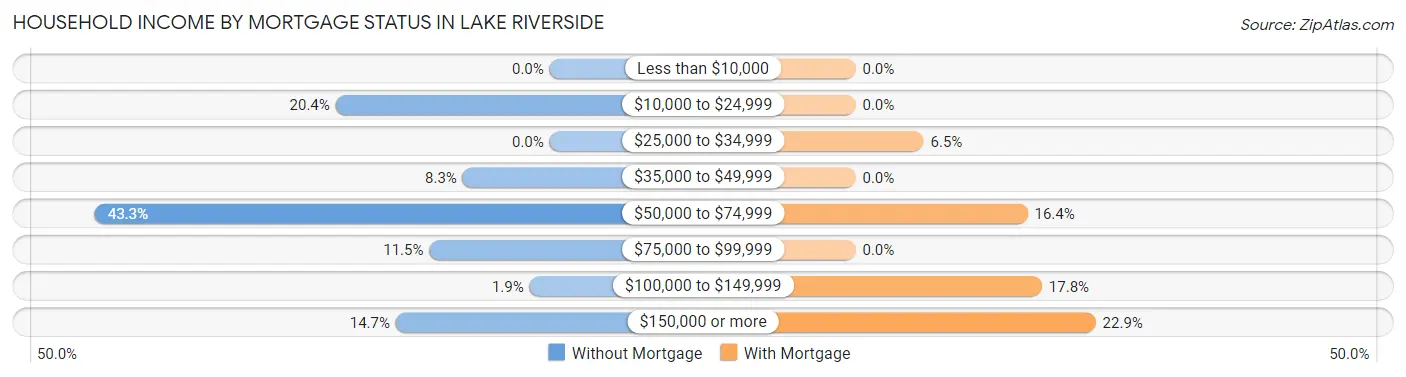
| Household Income | Without Mortgage | With Mortgage |
| Less than $10,000 | 0 (0.0%) | 0 (0.0%) |
| $10,000 to $24,999 | 32 (20.4%) | 0 (0.0%) |
| $25,000 to $34,999 | 0 (0.0%) | 19 (6.5%) |
| $35,000 to $49,999 | 13 (8.3%) | 0 (0.0%) |
| $50,000 to $74,999 | 68 (43.3%) | 48 (16.4%) |
| $75,000 to $99,999 | 18 (11.5%) | 0 (0.0%) |
| $100,000 to $149,999 | 3 (1.9%) | 52 (17.7%) |
| $150,000 or more | 23 (14.6%) | 67 (22.9%) |
| Total | 157 (100.0%) | 293 (100.0%) |
Property Value to Household Income Ratio in Lake Riverside
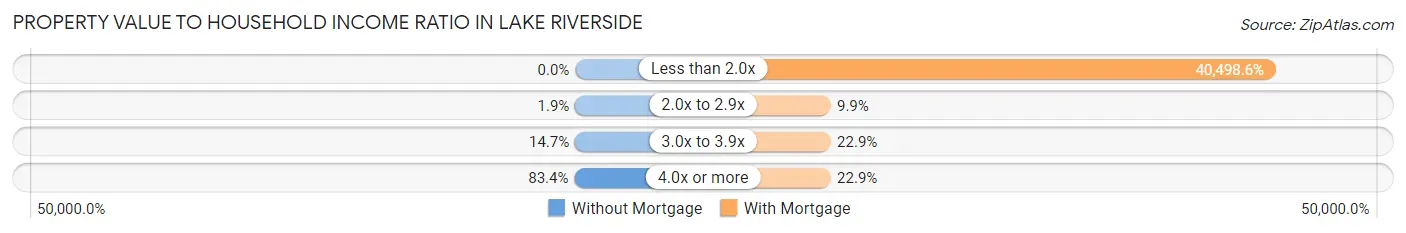
| Value-to-Income Ratio | Without Mortgage | With Mortgage |
| Less than 2.0x | 0 (0.0%) | 118,661 (40,498.6%) |
| 2.0x to 2.9x | 3 (1.9%) | 29 (9.9%) |
| 3.0x to 3.9x | 23 (14.6%) | 67 (22.9%) |
| 4.0x or more | 131 (83.4%) | 67 (22.9%) |
| Total | 157 (100.0%) | 293 (100.0%) |
Real Estate Taxes by Mortgage Status in Lake Riverside
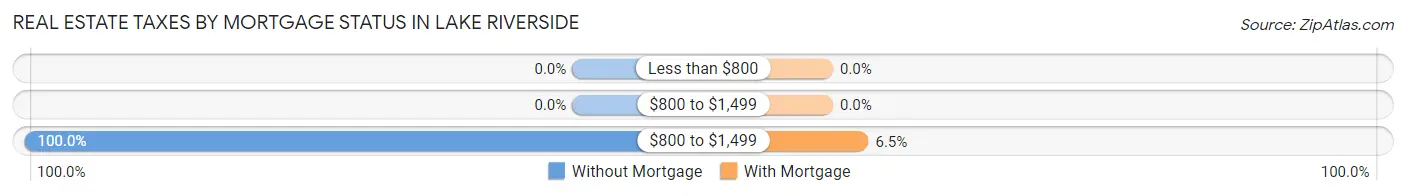
| Property Taxes | Without Mortgage | With Mortgage |
| Less than $800 | 0 (0.0%) | 0 (0.0%) |
| $800 to $1,499 | 0 (0.0%) | 0 (0.0%) |
| $800 to $1,499 | 157 (100.0%) | 19 (6.5%) |
| Total | 157 (100.0%) | 293 (100.0%) |
Health & Disability in Lake Riverside
Health Insurance Coverage by Age in Lake Riverside
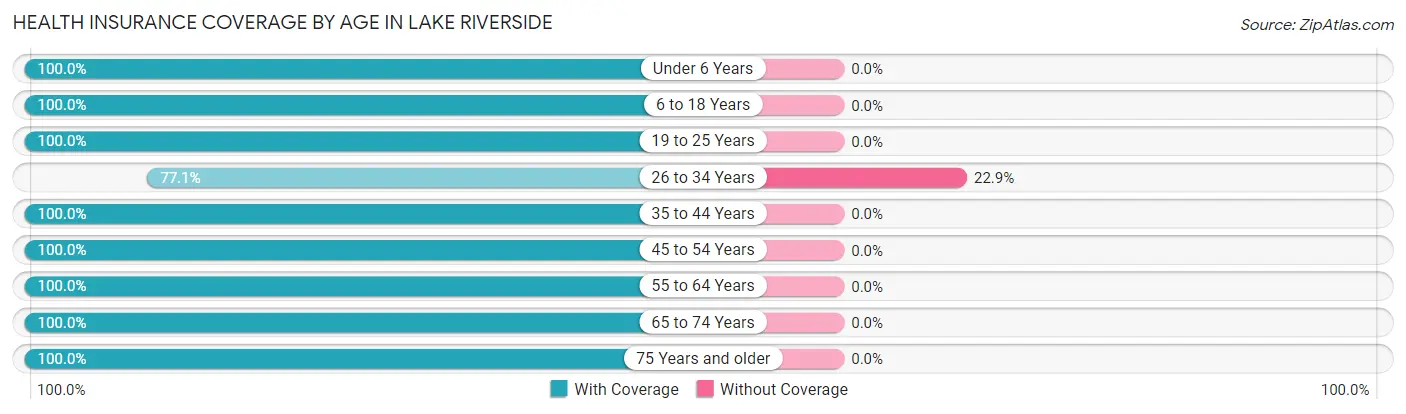
| Age Bracket | With Coverage | Without Coverage |
| Under 6 Years | 87 (100.0%) | 0 (0.0%) |
| 6 to 18 Years | 210 (100.0%) | 0 (0.0%) |
| 19 to 25 Years | 156 (100.0%) | 0 (0.0%) |
| 26 to 34 Years | 64 (77.1%) | 19 (22.9%) |
| 35 to 44 Years | 165 (100.0%) | 0 (0.0%) |
| 45 to 54 Years | 151 (100.0%) | 0 (0.0%) |
| 55 to 64 Years | 207 (100.0%) | 0 (0.0%) |
| 65 to 74 Years | 278 (100.0%) | 0 (0.0%) |
| 75 Years and older | 80 (100.0%) | 0 (0.0%) |
| Total | 1,398 (98.7%) | 19 (1.3%) |
Health Insurance Coverage by Citizenship Status in Lake Riverside
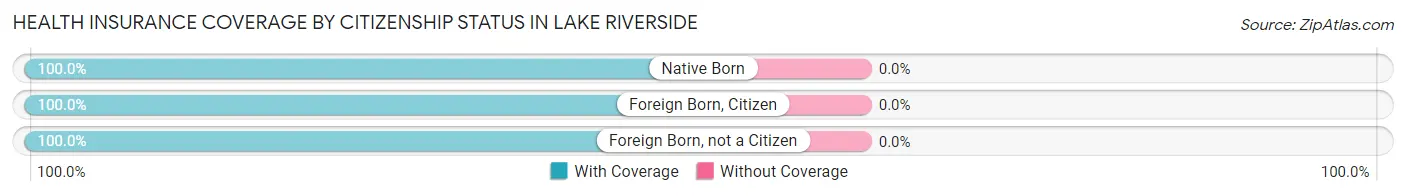
| Citizenship Status | With Coverage | Without Coverage |
| Native Born | 87 (100.0%) | 0 (0.0%) |
| Foreign Born, Citizen | 210 (100.0%) | 0 (0.0%) |
| Foreign Born, not a Citizen | 156 (100.0%) | 0 (0.0%) |
Health Insurance Coverage by Household Income in Lake Riverside
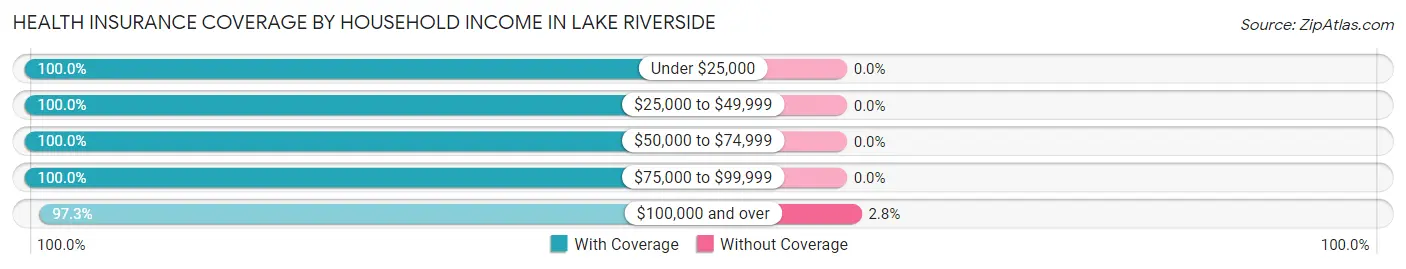
| Household Income | With Coverage | Without Coverage |
| Under $25,000 | 110 (100.0%) | 0 (0.0%) |
| $25,000 to $49,999 | 224 (100.0%) | 0 (0.0%) |
| $50,000 to $74,999 | 136 (100.0%) | 0 (0.0%) |
| $75,000 to $99,999 | 256 (100.0%) | 0 (0.0%) |
| $100,000 and over | 672 (97.3%) | 19 (2.8%) |
Public vs Private Health Insurance Coverage by Age in Lake Riverside
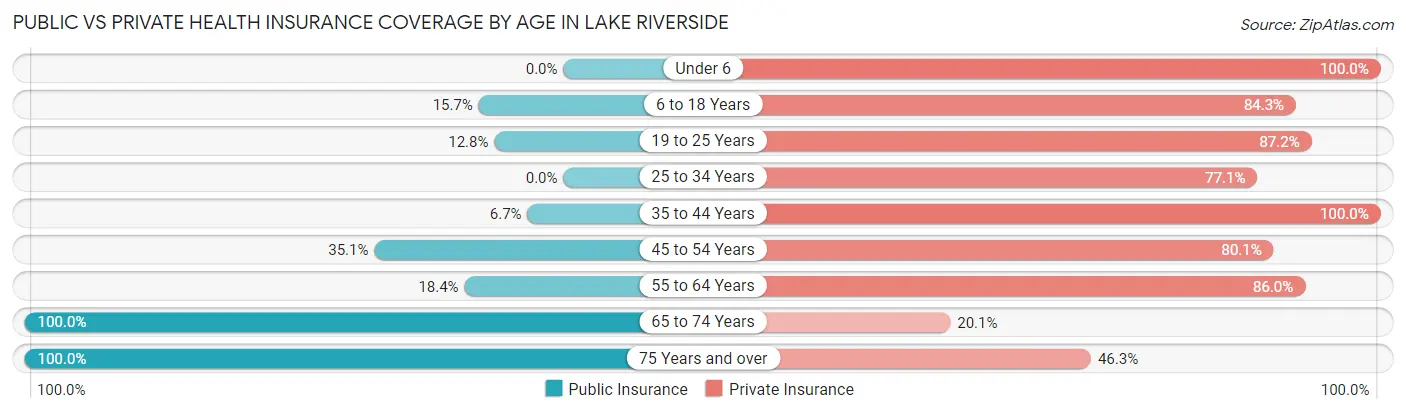
| Age Bracket | Public Insurance | Private Insurance |
| Under 6 | 0 (0.0%) | 87 (100.0%) |
| 6 to 18 Years | 33 (15.7%) | 177 (84.3%) |
| 19 to 25 Years | 20 (12.8%) | 136 (87.2%) |
| 25 to 34 Years | 0 (0.0%) | 64 (77.1%) |
| 35 to 44 Years | 11 (6.7%) | 165 (100.0%) |
| 45 to 54 Years | 53 (35.1%) | 121 (80.1%) |
| 55 to 64 Years | 38 (18.4%) | 178 (86.0%) |
| 65 to 74 Years | 278 (100.0%) | 56 (20.1%) |
| 75 Years and over | 80 (100.0%) | 37 (46.3%) |
| Total | 513 (36.2%) | 1,021 (72.1%) |
Disability Status by Sex by Age in Lake Riverside
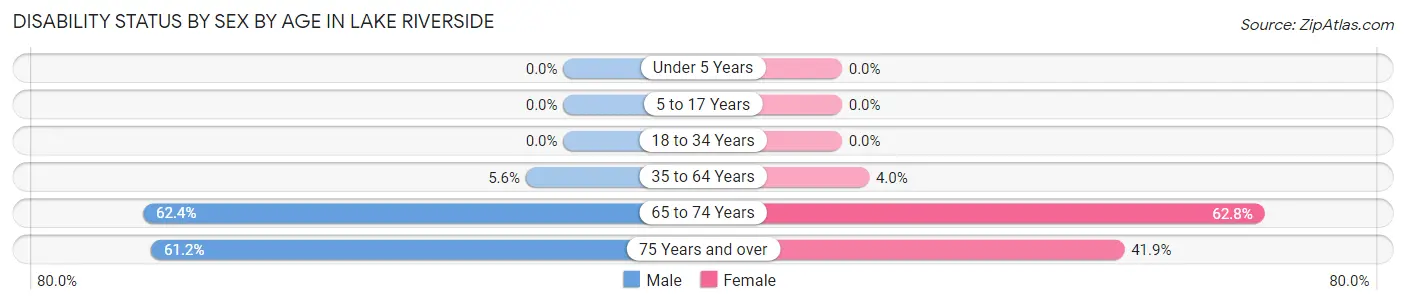
| Age Bracket | Male | Female |
| Under 5 Years | 0 (0.0%) | 0 (0.0%) |
| 5 to 17 Years | 0 (0.0%) | 0 (0.0%) |
| 18 to 34 Years | 0 (0.0%) | 0 (0.0%) |
| 35 to 64 Years | 14 (5.6%) | 11 (4.0%) |
| 65 to 74 Years | 88 (62.4%) | 86 (62.8%) |
| 75 Years and over | 30 (61.2%) | 13 (41.9%) |
Disability Class by Sex by Age in Lake Riverside
Disability Class: Hearing Difficulty
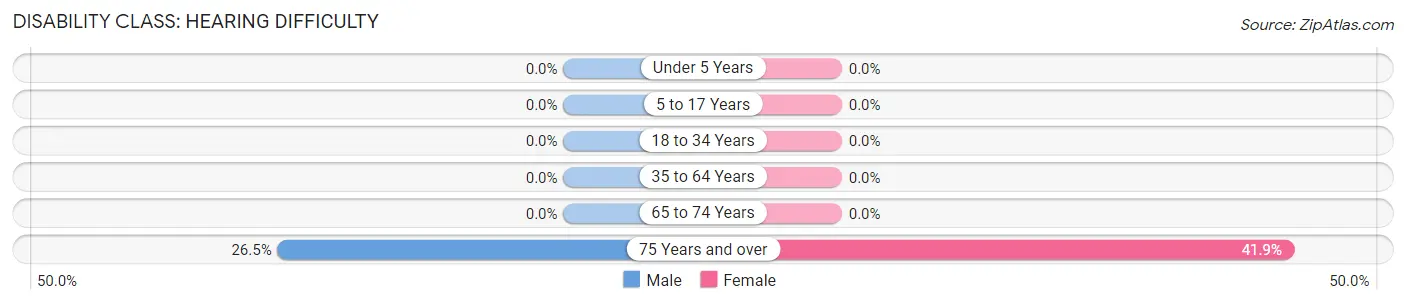
| Age Bracket | Male | Female |
| Under 5 Years | 0 (0.0%) | 0 (0.0%) |
| 5 to 17 Years | 0 (0.0%) | 0 (0.0%) |
| 18 to 34 Years | 0 (0.0%) | 0 (0.0%) |
| 35 to 64 Years | 0 (0.0%) | 0 (0.0%) |
| 65 to 74 Years | 0 (0.0%) | 0 (0.0%) |
| 75 Years and over | 13 (26.5%) | 13 (41.9%) |
Disability Class: Vision Difficulty
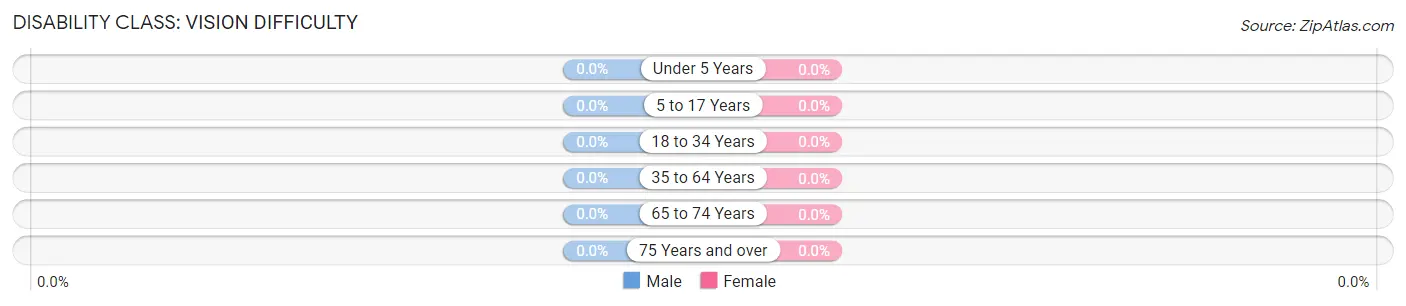
| Age Bracket | Male | Female |
| Under 5 Years | 0 (0.0%) | 0 (0.0%) |
| 5 to 17 Years | 0 (0.0%) | 0 (0.0%) |
| 18 to 34 Years | 0 (0.0%) | 0 (0.0%) |
| 35 to 64 Years | 0 (0.0%) | 0 (0.0%) |
| 65 to 74 Years | 0 (0.0%) | 0 (0.0%) |
| 75 Years and over | 0 (0.0%) | 0 (0.0%) |
Disability Class: Cognitive Difficulty
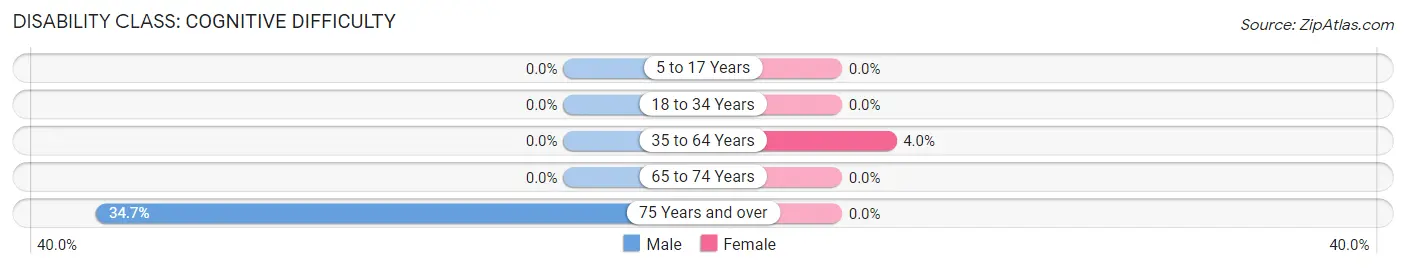
| Age Bracket | Male | Female |
| 5 to 17 Years | 0 (0.0%) | 0 (0.0%) |
| 18 to 34 Years | 0 (0.0%) | 0 (0.0%) |
| 35 to 64 Years | 0 (0.0%) | 11 (4.0%) |
| 65 to 74 Years | 0 (0.0%) | 0 (0.0%) |
| 75 Years and over | 17 (34.7%) | 0 (0.0%) |
Disability Class: Ambulatory Difficulty
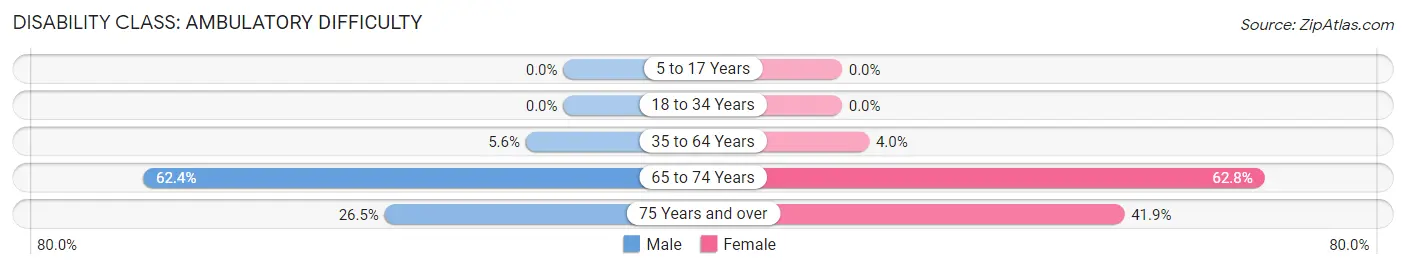
| Age Bracket | Male | Female |
| 5 to 17 Years | 0 (0.0%) | 0 (0.0%) |
| 18 to 34 Years | 0 (0.0%) | 0 (0.0%) |
| 35 to 64 Years | 14 (5.6%) | 11 (4.0%) |
| 65 to 74 Years | 88 (62.4%) | 86 (62.8%) |
| 75 Years and over | 13 (26.5%) | 13 (41.9%) |
Disability Class: Self-Care Difficulty
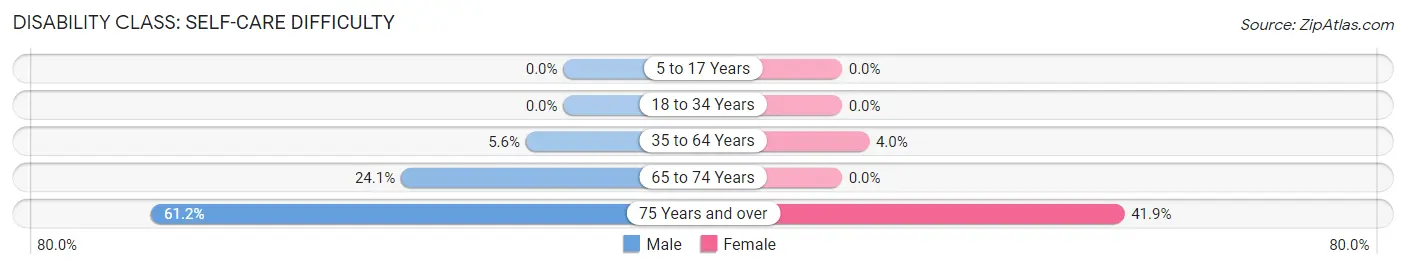
| Age Bracket | Male | Female |
| 5 to 17 Years | 0 (0.0%) | 0 (0.0%) |
| 18 to 34 Years | 0 (0.0%) | 0 (0.0%) |
| 35 to 64 Years | 14 (5.6%) | 11 (4.0%) |
| 65 to 74 Years | 34 (24.1%) | 0 (0.0%) |
| 75 Years and over | 30 (61.2%) | 13 (41.9%) |
Technology Access in Lake Riverside
Computing Device Access in Lake Riverside
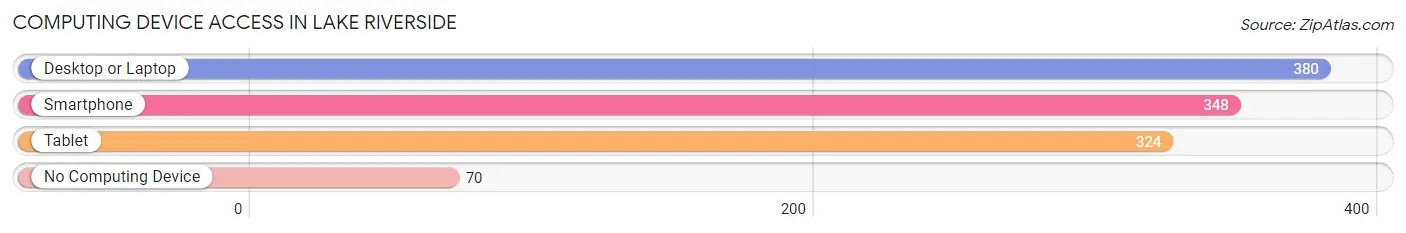
| Device Type | # Households | % Households |
| Desktop or Laptop | 380 | 84.4% |
| Smartphone | 348 | 77.3% |
| Tablet | 324 | 72.0% |
| No Computing Device | 70 | 15.6% |
| Total | 450 | 100.0% |
Internet Access in Lake Riverside
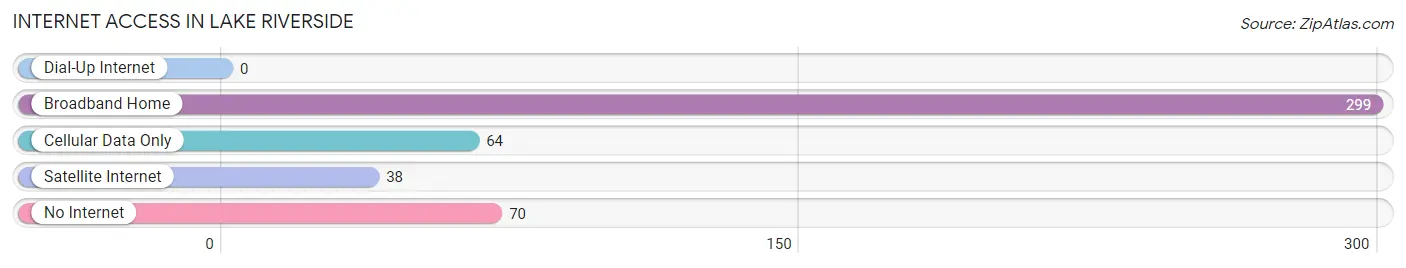
| Internet Type | # Households | % Households |
| Dial-Up Internet | 0 | 0.0% |
| Broadband Home | 299 | 66.4% |
| Cellular Data Only | 64 | 14.2% |
| Satellite Internet | 38 | 8.4% |
| No Internet | 70 | 15.6% |
| Total | 450 | 100.0% |
Lake Riverside Summary
Riverside, California is a city located in Riverside County, California, United States. It is the county seat of Riverside County and the largest city in the Inland Empire region of Southern California. The city is situated in the Riverside-San Bernardino-Ontario metropolitan area, which is the 12th largest metropolitan area in the United States. Riverside is located approximately 60 miles east of Los Angeles and is part of the Greater Los Angeles Area.
History
Riverside was founded in 1870 by John W. North and a group of businessmen and land speculators. The city was named for its location on the Santa Ana River. The city was incorporated in 1883 and became a charter city in 1893.
Riverside experienced rapid growth in the late 19th and early 20th centuries, due to its proximity to Los Angeles and the development of the citrus industry. The city was a major center for the citrus industry, with over 100 packing houses and processing plants. The city was also a major center for the defense industry during World War II, with the establishment of the March Air Force Base in 1942.
Geography
Riverside is located in the Inland Empire region of Southern California, approximately 60 miles east of Los Angeles. The city is situated in the Riverside-San Bernardino-Ontario metropolitan area, which is the 12th largest metropolitan area in the United States. The city is located at the confluence of the Santa Ana River and the San Jacinto River.
Riverside has a total area of 81.3 square miles, of which 79.9 square miles is land and 1.4 square miles is water. The city is located in a semi-arid climate zone, with hot summers and mild winters.
Economy
Riverside is a major center for the citrus industry, with over 100 packing houses and processing plants. The city is also a major center for the defense industry, with the March Air Force Base located in the city.
The city is home to several major employers, including the University of California, Riverside, the Riverside Community College District, the Riverside Unified School District, the Riverside County Sheriff's Department, and the Riverside County Regional Medical Center.
Demographics
As of the 2010 census, Riverside had a population of 303,871. The racial makeup of the city was 57.2% White, 11.2% African American, 1.2% Native American, 8.2% Asian, 0.3% Pacific Islander, 17.7% from other races, and 4.3% from two or more races. Hispanic or Latino of any race were 37.2% of the population.
The median income for a household in the city was $45,837, and the median income for a family was $51,837. The per capita income for the city was $21,837. About 17.2% of families and 21.3% of the population were below the poverty line, including 30.2% of those under age 18 and 9.2% of those age 65 or over.
Common Questions
What is Per Capita Income in Lake Riverside?
Per Capita income in Lake Riverside is $34,808.
What is the Median Family Income in Lake Riverside?
Median Family Income in Lake Riverside is $88,344.
What is the Median Household income in Lake Riverside?
Median Household Income in Lake Riverside is $88,438.
What is Income or Wage Gap in Lake Riverside?
Income or Wage Gap in Lake Riverside is 10.1%.
Women in Lake Riverside earn 89.9 cents for every dollar earned by a man.
What is Inequality or Gini Index in Lake Riverside?
Inequality or Gini Index in Lake Riverside is 0.35.
What is the Total Population of Lake Riverside?
Total Population of Lake Riverside is 1,417.
What is the Total Male Population of Lake Riverside?
Total Male Population of Lake Riverside is 668.
What is the Total Female Population of Lake Riverside?
Total Female Population of Lake Riverside is 749.
What is the Ratio of Males per 100 Females in Lake Riverside?
There are 89.19 Males per 100 Females in Lake Riverside.
What is the Ratio of Females per 100 Males in Lake Riverside?
There are 112.13 Females per 100 Males in Lake Riverside.
What is the Median Population Age in Lake Riverside?
Median Population Age in Lake Riverside is 45.2 Years.
What is the Average Family Size in Lake Riverside
Average Family Size in Lake Riverside is 3.2 People.
What is the Average Household Size in Lake Riverside
Average Household Size in Lake Riverside is 3.1 People.
How Large is the Labor Force in Lake Riverside?
There are 567 People in the Labor Forcein in Lake Riverside.
What is the Percentage of People in the Labor Force in Lake Riverside?
48.8% of People are in the Labor Force in Lake Riverside.
What is the Unemployment Rate in Lake Riverside?
Unemployment Rate in Lake Riverside is 11.6%.