Cities with the Highest Percentage of Population with a Degree in Visual and Performing Arts in Wisconsin
RELATED REPORTS & OPTIONS
Visual and Performing Arts
Wisconsin
Compare Cities
Map of Cities with the Highest Percentage of Population with a Degree in Visual and Performing Arts in Wisconsin
0.0%
40.0%
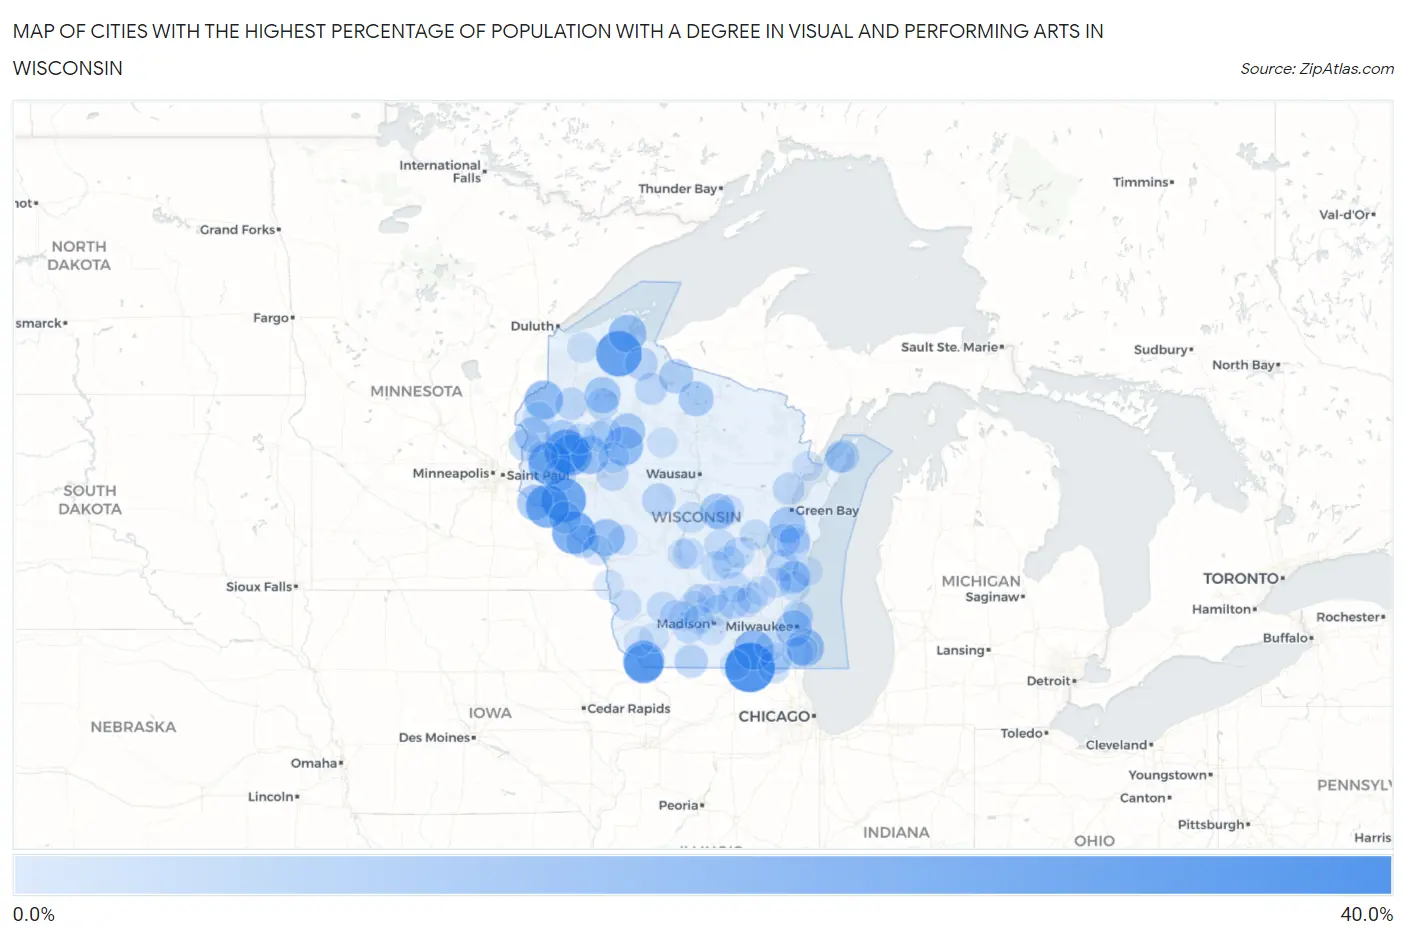
Cities with the Highest Percentage of Population with a Degree in Visual and Performing Arts in Wisconsin
| City | % Graduates | vs State | vs National | |
| 1. | Sharon | 34.4% | 3.7%(+30.7)#1 | 4.3%(+30.2)#236 |
| 2. | Mason | 28.6% | 3.7%(+24.8)#2 | 4.3%(+24.3)#345 |
| 3. | Arkansaw | 27.3% | 3.7%(+23.5)#3 | 4.3%(+23.0)#370 |
| 4. | Prairie Farm | 25.6% | 3.7%(+21.9)#4 | 4.3%(+21.4)#405 |
| 5. | Cochrane | 25.0% | 3.7%(+21.3)#5 | 4.3%(+20.7)#422 |
| 6. | Emerald | 25.0% | 3.7%(+21.3)#6 | 4.3%(+20.7)#435 |
| 7. | Maiden Rock | 25.0% | 3.7%(+21.3)#7 | 4.3%(+20.7)#439 |
| 8. | Kieler | 22.5% | 3.7%(+18.8)#8 | 4.3%(+18.3)#501 |
| 9. | Ridgeland | 22.2% | 3.7%(+18.5)#9 | 4.3%(+18.0)#516 |
| 10. | Turtle Lake | 20.3% | 3.7%(+16.5)#10 | 4.3%(+16.0)#612 |
| 11. | Rock Falls | 20.0% | 3.7%(+16.3)#11 | 4.3%(+15.7)#633 |
| 12. | Sandy Hook | 19.6% | 3.7%(+15.8)#12 | 4.3%(+15.3)#665 |
| 13. | Sheldon | 18.8% | 3.7%(+15.0)#13 | 4.3%(+14.5)#727 |
| 14. | Webster | 18.7% | 3.7%(+14.9)#14 | 4.3%(+14.4)#736 |
| 15. | North Bay | 17.9% | 3.7%(+14.2)#15 | 4.3%(+13.6)#786 |
| 16. | New Auburn | 17.9% | 3.7%(+14.1)#16 | 4.3%(+13.6)#790 |
| 17. | Washburn | 17.5% | 3.7%(+13.8)#17 | 4.3%(+13.3)#812 |
| 18. | Ettrick | 16.4% | 3.7%(+12.6)#18 | 4.3%(+12.1)#919 |
| 19. | Mindoro | 16.1% | 3.7%(+12.4)#19 | 4.3%(+11.9)#944 |
| 20. | West Milwaukee | 15.7% | 3.7%(+11.9)#20 | 4.3%(+11.4)#989 |
| 21. | Chief Lake | 15.1% | 3.7%(+11.3)#21 | 4.3%(+10.8)#1,047 |
| 22. | Greenleaf | 14.9% | 3.7%(+11.2)#22 | 4.3%(+10.7)#1,075 |
| 23. | Hager City | 14.5% | 3.7%(+10.8)#23 | 4.3%(+10.3)#1,115 |
| 24. | Centuria | 14.3% | 3.7%(+10.5)#24 | 4.3%(+10.0)#1,144 |
| 25. | Glen Flora | 14.3% | 3.7%(+10.5)#25 | 4.3%(+10.0)#1,170 |
| 26. | Nelsonville | 14.0% | 3.7%(+10.2)#26 | 4.3%(+9.70)#1,205 |
| 27. | Almena | 13.6% | 3.7%(+9.89)#27 | 4.3%(+9.38)#1,242 |
| 28. | Woodruff | 13.6% | 3.7%(+9.81)#28 | 4.3%(+9.31)#1,254 |
| 29. | Mercer | 12.7% | 3.7%(+8.91)#29 | 4.3%(+8.41)#1,393 |
| 30. | Chili | 11.4% | 3.7%(+7.68)#30 | 4.3%(+7.18)#1,638 |
| 31. | Sister Bay | 11.3% | 3.7%(+7.53)#31 | 4.3%(+7.02)#1,660 |
| 32. | Cascade | 11.2% | 3.7%(+7.48)#32 | 4.3%(+6.97)#1,670 |
| 33. | Fountain City | 11.2% | 3.7%(+7.44)#33 | 4.3%(+6.93)#1,677 |
| 34. | Collins | 11.1% | 3.7%(+7.37)#34 | 4.3%(+6.86)#1,718 |
| 35. | Browntown | 11.1% | 3.7%(+7.37)#35 | 4.3%(+6.86)#1,719 |
| 36. | Hilbert | 10.9% | 3.7%(+7.12)#36 | 4.3%(+6.62)#1,779 |
| 37. | Mellen | 10.8% | 3.7%(+7.02)#37 | 4.3%(+6.52)#1,811 |
| 38. | Columbus | 10.7% | 3.7%(+6.98)#38 | 4.3%(+6.47)#1,823 |
| 39. | Nelson | 10.1% | 3.7%(+6.40)#39 | 4.3%(+5.89)#2,018 |
| 40. | Spooner | 10.1% | 3.7%(+6.32)#40 | 4.3%(+5.81)#2,035 |
| 41. | Princeton | 10.0% | 3.7%(+6.26)#41 | 4.3%(+5.75)#2,054 |
| 42. | St Cloud | 9.8% | 3.7%(+6.09)#42 | 4.3%(+5.58)#2,126 |
| 43. | Knapp | 9.8% | 3.7%(+6.06)#43 | 4.3%(+5.55)#2,132 |
| 44. | Butternut | 9.8% | 3.7%(+6.01)#44 | 4.3%(+5.50)#2,150 |
| 45. | Reserve | 9.8% | 3.7%(+6.01)#45 | 4.3%(+5.50)#2,151 |
| 46. | Osceola | 9.6% | 3.7%(+5.89)#46 | 4.3%(+5.39)#2,196 |
| 47. | Cadott | 9.6% | 3.7%(+5.81)#47 | 4.3%(+5.30)#2,222 |
| 48. | Merrimac | 9.5% | 3.7%(+5.78)#48 | 4.3%(+5.27)#2,235 |
| 49. | Abrams | 9.4% | 3.7%(+5.63)#49 | 4.3%(+5.12)#2,301 |
| 50. | Waldo | 9.2% | 3.7%(+5.47)#50 | 4.3%(+4.96)#2,356 |
| 51. | Blue Mounds | 9.2% | 3.7%(+5.43)#51 | 4.3%(+4.93)#2,368 |
| 52. | Genoa City | 9.0% | 3.7%(+5.27)#52 | 4.3%(+4.76)#2,447 |
| 53. | Bohners Lake | 9.0% | 3.7%(+5.25)#53 | 4.3%(+4.74)#2,456 |
| 54. | Frederic | 8.7% | 3.7%(+4.99)#54 | 4.3%(+4.49)#2,578 |
| 55. | Adams | 8.7% | 3.7%(+4.91)#55 | 4.3%(+4.40)#2,624 |
| 56. | Sturtevant | 8.6% | 3.7%(+4.90)#56 | 4.3%(+4.39)#2,630 |
| 57. | Randolph | 8.6% | 3.7%(+4.83)#57 | 4.3%(+4.32)#2,659 |
| 58. | Sextonville | 8.6% | 3.7%(+4.83)#58 | 4.3%(+4.32)#2,663 |
| 59. | Wautoma | 8.5% | 3.7%(+4.80)#59 | 4.3%(+4.29)#2,674 |
| 60. | Bruce | 8.5% | 3.7%(+4.73)#60 | 4.3%(+4.22)#2,706 |
| 61. | Deer Park | 8.3% | 3.7%(+4.59)#61 | 4.3%(+4.08)#2,791 |
| 62. | Weyerhaeuser | 8.3% | 3.7%(+4.59)#62 | 4.3%(+4.08)#2,795 |
| 63. | Cameron | 8.3% | 3.7%(+4.54)#63 | 4.3%(+4.03)#2,822 |
| 64. | Cornell | 8.3% | 3.7%(+4.53)#64 | 4.3%(+4.02)#2,826 |
| 65. | Juneau | 8.3% | 3.7%(+4.52)#65 | 4.3%(+4.01)#2,835 |
| 66. | Prairie Du Sac | 8.2% | 3.7%(+4.50)#66 | 4.3%(+3.99)#2,845 |
| 67. | Berlin | 8.1% | 3.7%(+4.38)#67 | 4.3%(+3.87)#2,903 |
| 68. | Windsor | 8.1% | 3.7%(+4.36)#68 | 4.3%(+3.85)#2,915 |
| 69. | Montello | 8.0% | 3.7%(+4.26)#69 | 4.3%(+3.75)#2,963 |
| 70. | Biron | 8.0% | 3.7%(+4.26)#70 | 4.3%(+3.75)#2,967 |
| 71. | Winchester | 7.9% | 3.7%(+4.19)#71 | 4.3%(+3.68)#3,012 |
| 72. | Poynette | 7.9% | 3.7%(+4.12)#72 | 4.3%(+3.62)#3,044 |
| 73. | Amherst | 7.8% | 3.7%(+4.03)#73 | 4.3%(+3.52)#3,111 |
| 74. | Random Lake | 7.5% | 3.7%(+3.72)#74 | 4.3%(+3.21)#3,311 |
| 75. | Ephraim | 7.4% | 3.7%(+3.70)#75 | 4.3%(+3.19)#3,328 |
| 76. | Lake Nebagamon | 7.4% | 3.7%(+3.68)#76 | 4.3%(+3.18)#3,334 |
| 77. | Racine | 7.4% | 3.7%(+3.67)#77 | 4.3%(+3.16)#3,345 |
| 78. | Melrose | 7.4% | 3.7%(+3.66)#78 | 4.3%(+3.16)#3,354 |
| 79. | Campbellsport | 7.4% | 3.7%(+3.61)#79 | 4.3%(+3.11)#3,392 |
| 80. | Reedsville | 7.3% | 3.7%(+3.59)#80 | 4.3%(+3.09)#3,407 |
| 81. | Westboro | 7.3% | 3.7%(+3.57)#81 | 4.3%(+3.06)#3,435 |
| 82. | Arena | 7.3% | 3.7%(+3.53)#82 | 4.3%(+3.02)#3,469 |
| 83. | Spring Green | 7.2% | 3.7%(+3.50)#83 | 4.3%(+2.99)#3,500 |
| 84. | Peshtigo | 7.2% | 3.7%(+3.47)#84 | 4.3%(+2.97)#3,511 |
| 85. | East Troy | 7.2% | 3.7%(+3.44)#85 | 4.3%(+2.93)#3,529 |
| 86. | Dellwood | 7.1% | 3.7%(+3.40)#86 | 4.3%(+2.89)#3,576 |
| 87. | Lowell | 7.1% | 3.7%(+3.40)#87 | 4.3%(+2.89)#3,595 |
| 88. | Mount Sterling | 7.1% | 3.7%(+3.40)#88 | 4.3%(+2.89)#3,600 |
| 89. | Beloit | 7.1% | 3.7%(+3.36)#89 | 4.3%(+2.86)#3,621 |
| 90. | Iola | 7.1% | 3.7%(+3.31)#90 | 4.3%(+2.80)#3,667 |
| 91. | Trempealeau | 7.0% | 3.7%(+3.28)#91 | 4.3%(+2.78)#3,682 |
| 92. | Fitchburg | 7.0% | 3.7%(+3.24)#92 | 4.3%(+2.73)#3,717 |
| 93. | Sheboygan | 7.0% | 3.7%(+3.23)#93 | 4.3%(+2.73)#3,719 |
| 94. | Livingston | 7.0% | 3.7%(+3.23)#94 | 4.3%(+2.72)#3,729 |
| 95. | Mayville | 6.9% | 3.7%(+3.18)#95 | 4.3%(+2.67)#3,765 |
| 96. | Fox Point | 6.9% | 3.7%(+3.18)#96 | 4.3%(+2.67)#3,767 |
| 97. | Genoa | 6.9% | 3.7%(+3.15)#97 | 4.3%(+2.64)#3,792 |
| 98. | Cross Plains | 6.9% | 3.7%(+3.14)#98 | 4.3%(+2.63)#3,803 |
| 99. | Lancaster | 6.9% | 3.7%(+3.11)#99 | 4.3%(+2.60)#3,833 |
| 100. | Bayside | 6.8% | 3.7%(+3.04)#100 | 4.3%(+2.53)#3,912 |
Common Questions
What are the Top 10 Cities with the Highest Percentage of Population with a Degree in Visual and Performing Arts in Wisconsin?
Top 10 Cities with the Highest Percentage of Population with a Degree in Visual and Performing Arts in Wisconsin are:
#1
34.4%
#2
28.6%
#3
27.3%
#4
25.6%
#5
25.0%
#6
25.0%
#7
25.0%
#8
22.5%
#9
22.2%
#10
20.3%
What city has the Highest Percentage of Population with a Degree in Visual and Performing Arts in Wisconsin?
Sharon has the Highest Percentage of Population with a Degree in Visual and Performing Arts in Wisconsin with 34.4%.
What is the Percentage of Population with a Degree in Visual and Performing Arts in the State of Wisconsin?
Percentage of Population with a Degree in Visual and Performing Arts in Wisconsin is 3.7%.
What is the Percentage of Population with a Degree in Visual and Performing Arts in the United States?
Percentage of Population with a Degree in Visual and Performing Arts in the United States is 4.3%.