Cities with the Highest Percentage of Population with a Degree in Visual and Performing Arts in New Jersey
RELATED REPORTS & OPTIONS
Visual and Performing Arts
New Jersey
Compare Cities
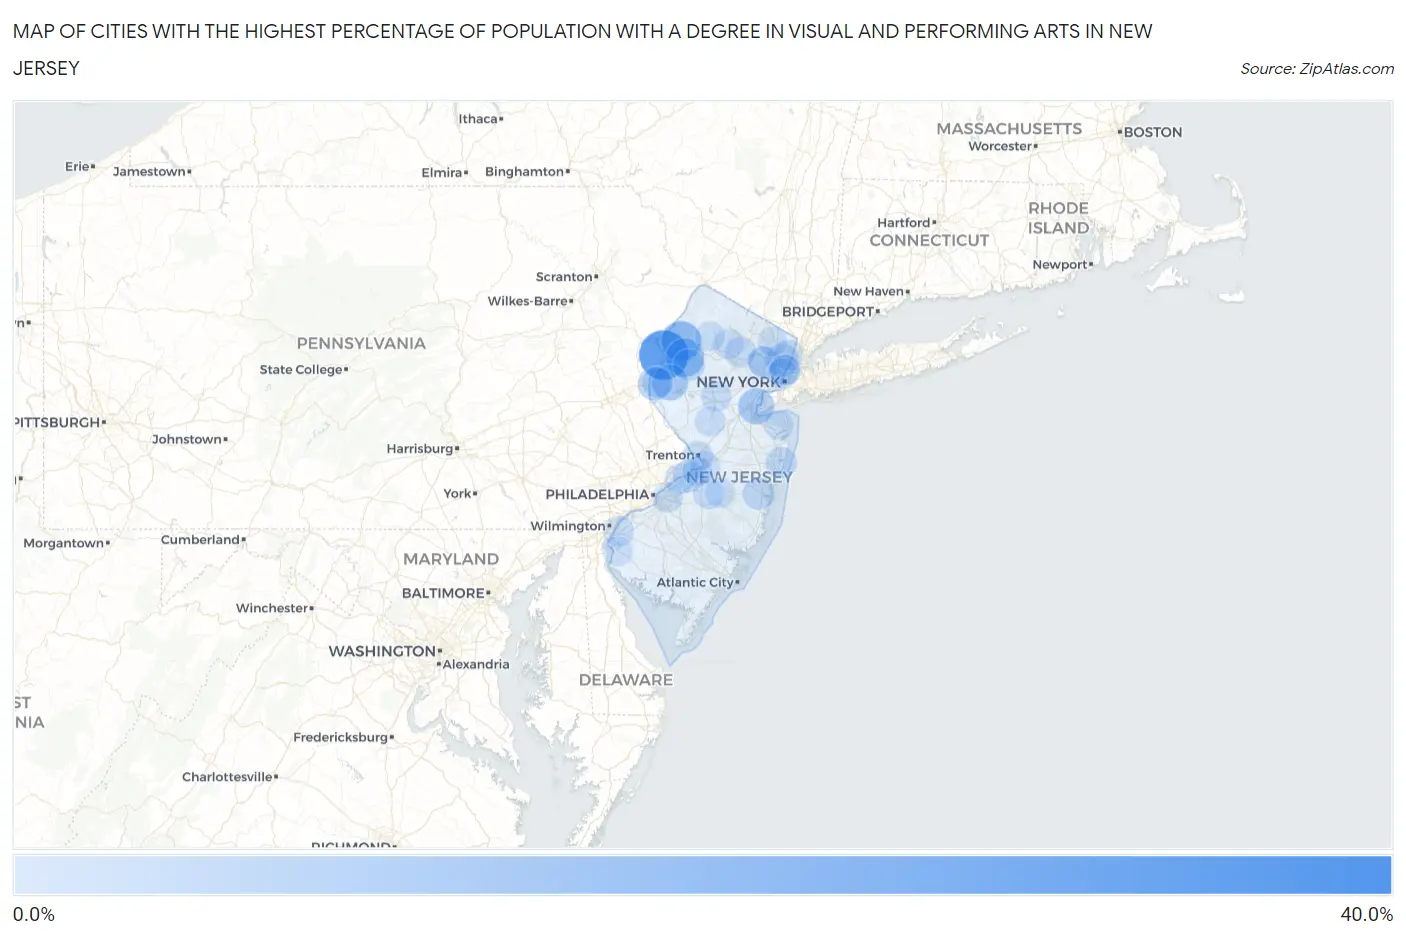
Map of Cities with the Highest Percentage of Population with a Degree in Visual and Performing Arts in New Jersey
0.0%
40.0%
Cities with the Highest Percentage of Population with a Degree in Visual and Performing Arts in New Jersey
| City | % Graduates | vs State | vs National | |
| 1. | Tavistock Borough | 40.0% | 4.0%(+36.0)#1 | 4.3%(+35.7)#176 |
| 2. | Delaware | 36.4% | 4.0%(+32.3)#2 | 4.3%(+32.1)#209 |
| 3. | Vincentown | 30.7% | 4.0%(+26.7)#3 | 4.3%(+26.5)#301 |
| 4. | Newfoundland | 30.5% | 4.0%(+26.5)#4 | 4.3%(+26.3)#303 |
| 5. | Pottersville | 30.2% | 4.0%(+26.2)#5 | 4.3%(+26.0)#308 |
| 6. | Marksboro | 21.9% | 4.0%(+17.8)#6 | 4.3%(+17.6)#532 |
| 7. | Vienna | 19.6% | 4.0%(+15.5)#7 | 4.3%(+15.3)#662 |
| 8. | Llewellyn Park | 18.2% | 4.0%(+14.2)#8 | 4.3%(+14.0)#758 |
| 9. | Fieldsboro Borough | 16.7% | 4.0%(+12.6)#9 | 4.3%(+12.4)#875 |
| 10. | Asbury | 15.5% | 4.0%(+11.5)#10 | 4.3%(+11.3)#1,011 |
| 11. | Sewaren | 15.5% | 4.0%(+11.4)#11 | 4.3%(+11.2)#1,014 |
| 12. | Ocean Gate Borough | 15.1% | 4.0%(+11.1)#12 | 4.3%(+10.9)#1,045 |
| 13. | West Berlin | 14.8% | 4.0%(+10.8)#13 | 4.3%(+10.6)#1,080 |
| 14. | Sussex Borough | 14.7% | 4.0%(+10.6)#14 | 4.3%(+10.4)#1,101 |
| 15. | Harrisonville | 14.1% | 4.0%(+10.0)#15 | 4.3%(+9.81)#1,191 |
| 16. | Wrightstown Borough | 13.0% | 4.0%(+8.92)#16 | 4.3%(+8.71)#1,349 |
| 17. | Lopatcong Overlook | 12.5% | 4.0%(+8.45)#17 | 4.3%(+8.25)#1,413 |
| 18. | Leonia Borough | 12.4% | 4.0%(+8.39)#18 | 4.3%(+8.19)#1,438 |
| 19. | Green | 12.4% | 4.0%(+8.35)#19 | 4.3%(+8.14)#1,443 |
| 20. | Mount Tabor | 12.2% | 4.0%(+8.11)#20 | 4.3%(+7.91)#1,494 |
| 21. | Moonachie Borough | 11.9% | 4.0%(+7.81)#21 | 4.3%(+7.61)#1,551 |
| 22. | Landing | 11.8% | 4.0%(+7.72)#22 | 4.3%(+7.51)#1,569 |
| 23. | Lavallette Borough | 11.4% | 4.0%(+7.31)#23 | 4.3%(+7.11)#1,644 |
| 24. | Keansburg Borough | 11.1% | 4.0%(+7.10)#24 | 4.3%(+6.89)#1,681 |
| 25. | Stockton Borough | 11.1% | 4.0%(+7.01)#25 | 4.3%(+6.81)#1,740 |
| 26. | Ridgefield Park | 10.7% | 4.0%(+6.63)#26 | 4.3%(+6.42)#1,846 |
| 27. | Roosevelt Borough | 10.6% | 4.0%(+6.54)#27 | 4.3%(+6.34)#1,874 |
| 28. | Laurel Springs Borough | 10.6% | 4.0%(+6.53)#28 | 4.3%(+6.32)#1,877 |
| 29. | Stockton University | 10.5% | 4.0%(+6.42)#29 | 4.3%(+6.21)#1,910 |
| 30. | Crosswicks | 10.5% | 4.0%(+6.41)#30 | 4.3%(+6.21)#1,912 |
| 31. | Rockleigh Borough | 10.3% | 4.0%(+6.30)#31 | 4.3%(+6.09)#1,951 |
| 32. | Paulsboro Borough | 10.3% | 4.0%(+6.23)#32 | 4.3%(+6.03)#1,968 |
| 33. | Chesilhurst Borough | 10.2% | 4.0%(+6.18)#33 | 4.3%(+5.98)#1,982 |
| 34. | Brookdale | 10.2% | 4.0%(+6.17)#34 | 4.3%(+5.97)#1,984 |
| 35. | Titusville | 10.2% | 4.0%(+6.14)#35 | 4.3%(+5.94)#2,002 |
| 36. | Hopewell Borough | 10.1% | 4.0%(+6.06)#36 | 4.3%(+5.85)#2,027 |
| 37. | Rutgers University-Livingston Campus | 10.0% | 4.0%(+5.95)#37 | 4.3%(+5.75)#2,049 |
| 38. | Silver Ridge | 9.9% | 4.0%(+5.83)#38 | 4.3%(+5.62)#2,110 |
| 39. | Frenchtown Borough | 9.6% | 4.0%(+5.58)#39 | 4.3%(+5.38)#2,200 |
| 40. | Beattystown | 9.5% | 4.0%(+5.47)#40 | 4.3%(+5.27)#2,247 |
| 41. | Guttenberg | 9.0% | 4.0%(+4.94)#41 | 4.3%(+4.73)#2,461 |
| 42. | Palisades Park Borough | 8.8% | 4.0%(+4.70)#42 | 4.3%(+4.50)#2,573 |
| 43. | Burlington | 8.7% | 4.0%(+4.68)#43 | 4.3%(+4.48)#2,581 |
| 44. | West Belmar | 8.7% | 4.0%(+4.67)#44 | 4.3%(+4.47)#2,587 |
| 45. | Upper Stewartsville | 8.6% | 4.0%(+4.52)#45 | 4.3%(+4.32)#2,664 |
| 46. | Spotswood Borough | 8.5% | 4.0%(+4.48)#46 | 4.3%(+4.28)#2,682 |
| 47. | Milford Borough | 8.5% | 4.0%(+4.41)#47 | 4.3%(+4.21)#2,717 |
| 48. | Island Heights Borough | 8.3% | 4.0%(+4.30)#48 | 4.3%(+4.09)#2,767 |
| 49. | Merchantville Borough | 8.3% | 4.0%(+4.27)#49 | 4.3%(+4.06)#2,807 |
| 50. | Collingswood Borough | 8.3% | 4.0%(+4.21)#50 | 4.3%(+4.00)#2,839 |
| 51. | Carlstadt Borough | 8.2% | 4.0%(+4.18)#51 | 4.3%(+3.97)#2,857 |
| 52. | Stanhope Borough | 8.2% | 4.0%(+4.12)#52 | 4.3%(+3.91)#2,883 |
| 53. | Pemberton Heights | 8.1% | 4.0%(+4.10)#53 | 4.3%(+3.89)#2,894 |
| 54. | Alpine Borough | 8.1% | 4.0%(+4.01)#54 | 4.3%(+3.80)#2,935 |
| 55. | Trenton | 8.0% | 4.0%(+3.94)#55 | 4.3%(+3.74)#2,982 |
| 56. | Dennisville | 8.0% | 4.0%(+3.92)#56 | 4.3%(+3.72)#2,991 |
| 57. | Boonton | 8.0% | 4.0%(+3.91)#57 | 4.3%(+3.71)#3,002 |
| 58. | Pennington Borough | 7.9% | 4.0%(+3.87)#58 | 4.3%(+3.67)#3,016 |
| 59. | Englewood | 7.9% | 4.0%(+3.84)#59 | 4.3%(+3.64)#3,034 |
| 60. | Carneys Point | 7.9% | 4.0%(+3.82)#60 | 4.3%(+3.61)#3,046 |
| 61. | Beverly | 7.9% | 4.0%(+3.80)#61 | 4.3%(+3.60)#3,058 |
| 62. | Haworth Borough | 7.7% | 4.0%(+3.68)#62 | 4.3%(+3.48)#3,130 |
| 63. | Golden Triangle | 7.7% | 4.0%(+3.64)#63 | 4.3%(+3.44)#3,179 |
| 64. | Atlantic Highlands Borough | 7.7% | 4.0%(+3.63)#64 | 4.3%(+3.43)#3,183 |
| 65. | Green Knoll | 7.7% | 4.0%(+3.61)#65 | 4.3%(+3.40)#3,193 |
| 66. | West Long Branch Borough | 7.6% | 4.0%(+3.58)#66 | 4.3%(+3.37)#3,211 |
| 67. | Caldwell Borough | 7.6% | 4.0%(+3.57)#67 | 4.3%(+3.36)#3,218 |
| 68. | Rutherford Borough | 7.6% | 4.0%(+3.56)#68 | 4.3%(+3.36)#3,221 |
| 69. | Harlingen | 7.6% | 4.0%(+3.55)#69 | 4.3%(+3.34)#3,239 |
| 70. | Lake Telemark | 7.6% | 4.0%(+3.53)#70 | 4.3%(+3.32)#3,252 |
| 71. | Bordentown | 7.5% | 4.0%(+3.50)#71 | 4.3%(+3.30)#3,263 |
| 72. | Red Bank Borough | 7.5% | 4.0%(+3.49)#72 | 4.3%(+3.29)#3,268 |
| 73. | Ridgefield Borough | 7.5% | 4.0%(+3.49)#73 | 4.3%(+3.29)#3,271 |
| 74. | Milmay | 7.5% | 4.0%(+3.44)#74 | 4.3%(+3.24)#3,298 |
| 75. | Pluckemin | 7.5% | 4.0%(+3.43)#75 | 4.3%(+3.23)#3,299 |
| 76. | Basking Ridge | 7.4% | 4.0%(+3.34)#76 | 4.3%(+3.14)#3,372 |
| 77. | High Bridge Borough | 7.4% | 4.0%(+3.34)#77 | 4.3%(+3.13)#3,380 |
| 78. | Bay Head Borough | 7.3% | 4.0%(+3.27)#78 | 4.3%(+3.07)#3,425 |
| 79. | Cape May Point Borough | 7.3% | 4.0%(+3.27)#79 | 4.3%(+3.06)#3,437 |
| 80. | Flagtown | 7.3% | 4.0%(+3.26)#80 | 4.3%(+3.06)#3,440 |
| 81. | Clementon Borough | 7.3% | 4.0%(+3.26)#81 | 4.3%(+3.05)#3,443 |
| 82. | Glen Ridge Borough | 7.2% | 4.0%(+3.18)#82 | 4.3%(+2.97)#3,508 |
| 83. | Watsessing | 7.2% | 4.0%(+3.18)#83 | 4.3%(+2.97)#3,509 |
| 84. | Upper Montclair | 7.2% | 4.0%(+3.15)#84 | 4.3%(+2.94)#3,528 |
| 85. | Rainbow Lakes | 7.1% | 4.0%(+3.10)#85 | 4.3%(+2.89)#3,562 |
| 86. | Salem | 7.0% | 4.0%(+2.98)#86 | 4.3%(+2.77)#3,685 |
| 87. | Browns Mills | 7.0% | 4.0%(+2.95)#87 | 4.3%(+2.74)#3,708 |
| 88. | Lake Mohawk | 7.0% | 4.0%(+2.91)#88 | 4.3%(+2.70)#3,741 |
| 89. | Neptune City Borough | 6.9% | 4.0%(+2.90)#89 | 4.3%(+2.69)#3,747 |
| 90. | Ridgewood | 6.9% | 4.0%(+2.88)#90 | 4.3%(+2.68)#3,763 |
| 91. | Union City | 6.9% | 4.0%(+2.84)#91 | 4.3%(+2.64)#3,802 |
| 92. | Absecon Highlands | 6.9% | 4.0%(+2.81)#92 | 4.3%(+2.60)#3,831 |
| 93. | Demarest Borough | 6.8% | 4.0%(+2.80)#93 | 4.3%(+2.59)#3,840 |
| 94. | Far Hills Borough | 6.8% | 4.0%(+2.79)#94 | 4.3%(+2.58)#3,849 |
| 95. | Clayton Borough | 6.8% | 4.0%(+2.76)#95 | 4.3%(+2.56)#3,885 |
| 96. | Leonardo | 6.8% | 4.0%(+2.76)#96 | 4.3%(+2.56)#3,888 |
| 97. | West New York | 6.8% | 4.0%(+2.75)#97 | 4.3%(+2.55)#3,894 |
| 98. | Roebling | 6.8% | 4.0%(+2.74)#98 | 4.3%(+2.54)#3,907 |
| 99. | Edgewater Borough | 6.8% | 4.0%(+2.74)#99 | 4.3%(+2.54)#3,908 |
| 100. | West Wildwood Borough | 6.8% | 4.0%(+2.73)#100 | 4.3%(+2.53)#3,920 |
Common Questions
What are the Top 10 Cities with the Highest Percentage of Population with a Degree in Visual and Performing Arts in New Jersey?
Top 10 Cities with the Highest Percentage of Population with a Degree in Visual and Performing Arts in New Jersey are:
#1
36.4%
#2
21.9%
#3
19.6%
#4
15.5%
#5
15.5%
#6
12.5%
#7
10.7%
#8
10.2%
#9
9.9%
#10
9.5%
What city has the Highest Percentage of Population with a Degree in Visual and Performing Arts in New Jersey?
Delaware has the Highest Percentage of Population with a Degree in Visual and Performing Arts in New Jersey with 36.4%.
What is the Percentage of Population with a Degree in Visual and Performing Arts in the State of New Jersey?
Percentage of Population with a Degree in Visual and Performing Arts in New Jersey is 4.0%.
What is the Percentage of Population with a Degree in Visual and Performing Arts in the United States?
Percentage of Population with a Degree in Visual and Performing Arts in the United States is 4.3%.