Zip Codes with the Highest Percentage of Population with a Degree in Visual and Performing Arts in Citrus Heights, CA
RELATED REPORTS & OPTIONS
Visual and Performing Arts
Citrus Heights
Compare Zip Codes
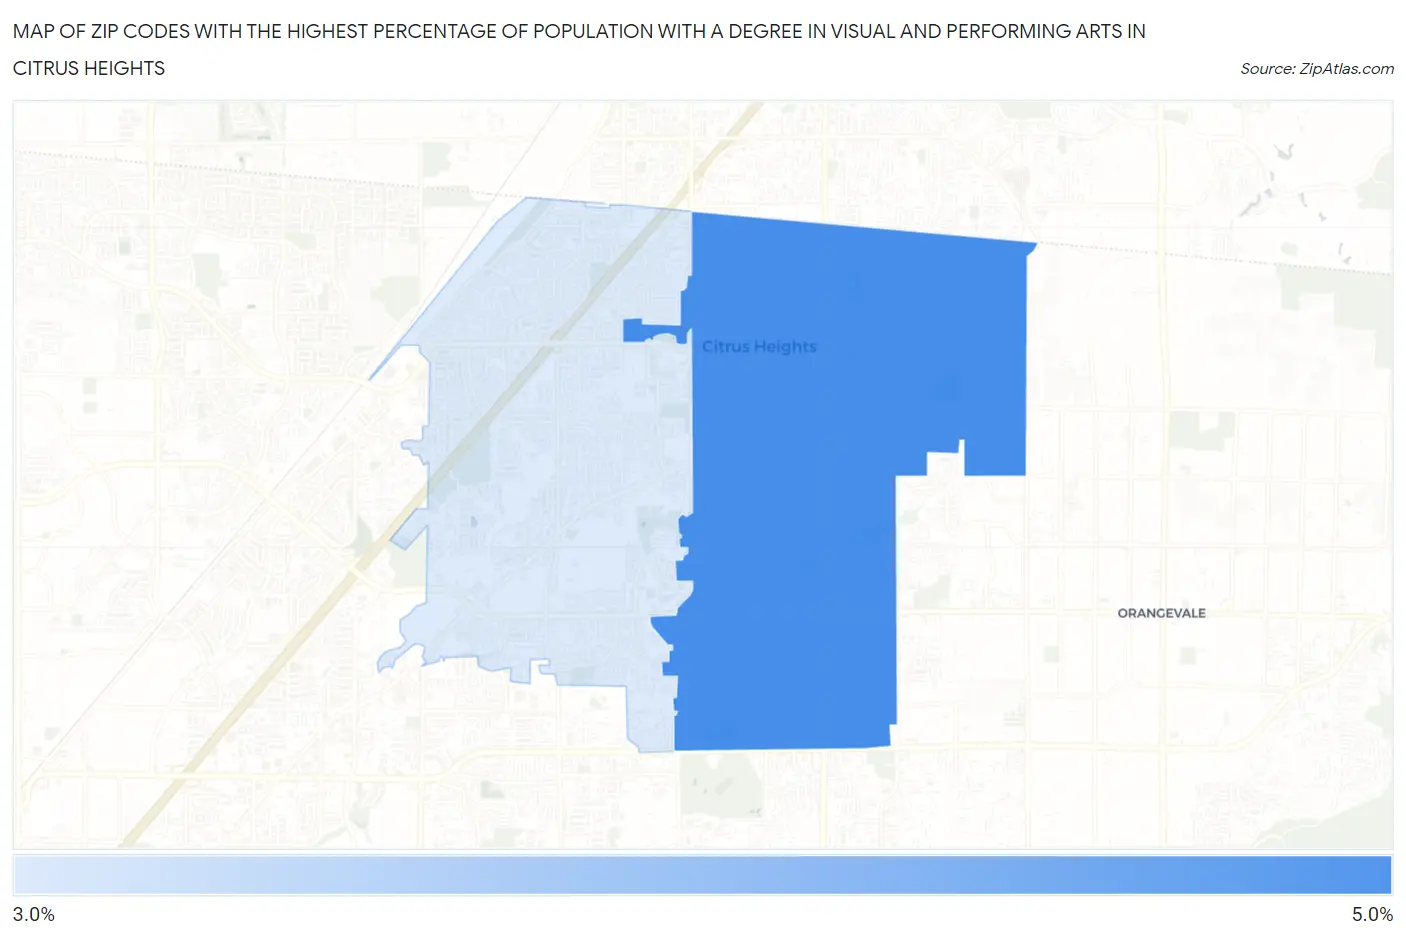
Map of Zip Codes with the Highest Percentage of Population with a Degree in Visual and Performing Arts in Citrus Heights
3.4%
4.9%
Zip Codes with the Highest Percentage of Population with a Degree in Visual and Performing Arts in Citrus Heights, CA
| Zip Code | % Graduates | vs State | vs National | |
| 1. | 95610 | 4.9% | 5.7%(-0.864)#679 | 4.3%(+0.623)#6,910 |
| 2. | 95621 | 3.4% | 5.7%(-2.31)#1,010 | 4.3%(-0.820)#11,140 |
1
Common Questions
What are the Top Zip Codes with the Highest Percentage of Population with a Degree in Visual and Performing Arts in Citrus Heights, CA?
Top Zip Codes with the Highest Percentage of Population with a Degree in Visual and Performing Arts in Citrus Heights, CA are:
What zip code has the Highest Percentage of Population with a Degree in Visual and Performing Arts in Citrus Heights, CA?
95610 has the Highest Percentage of Population with a Degree in Visual and Performing Arts in Citrus Heights, CA with 4.9%.
What is the Percentage of Population with a Degree in Visual and Performing Arts in Citrus Heights, CA?
Percentage of Population with a Degree in Visual and Performing Arts in Citrus Heights is 4.3%.
What is the Percentage of Population with a Degree in Visual and Performing Arts in California?
Percentage of Population with a Degree in Visual and Performing Arts in California is 5.7%.
What is the Percentage of Population with a Degree in Visual and Performing Arts in the United States?
Percentage of Population with a Degree in Visual and Performing Arts in the United States is 4.3%.