Cities with the Highest Percentage of Population with a Degree in Visual and Performing Arts in Indiana
RELATED REPORTS & OPTIONS
Visual and Performing Arts
Indiana
Compare Cities
Map of Cities with the Highest Percentage of Population with a Degree in Visual and Performing Arts in Indiana
0.0%
100.0%
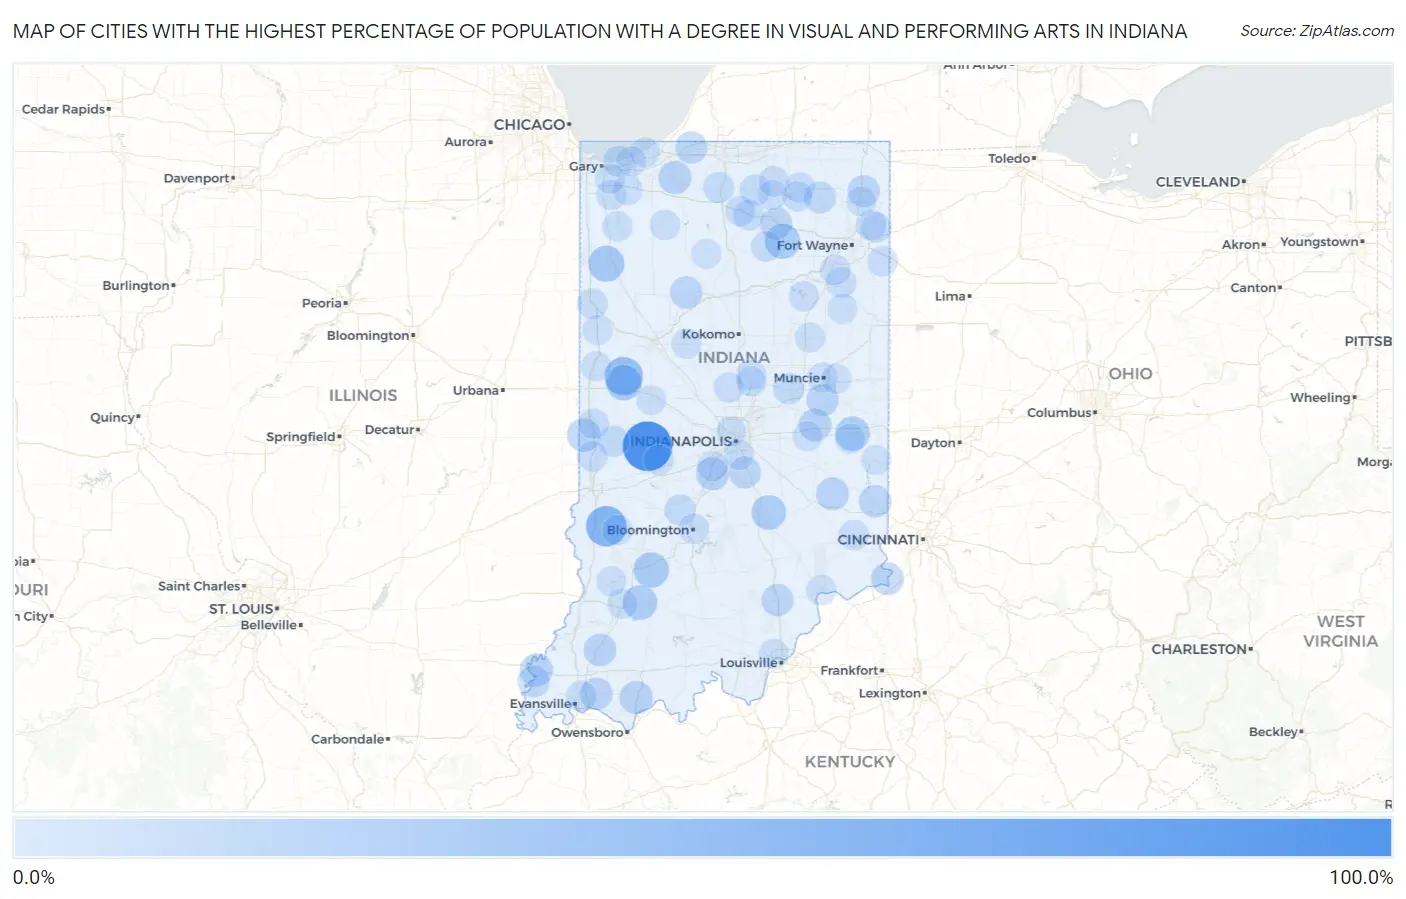
Cities with the Highest Percentage of Population with a Degree in Visual and Performing Arts in Indiana
| City | % Graduates | vs State | vs National | |
| 1. | Van Bibber Lake | 100.0% | 3.2%(+96.8)#1 | 4.3%(+95.7)#7 |
| 2. | Lamb | 100.0% | 3.2%(+96.8)#2 | 4.3%(+95.7)#17 |
| 3. | Green Hill | 62.5% | 3.2%(+59.3)#3 | 4.3%(+58.2)#72 |
| 4. | Hymera | 55.6% | 3.2%(+52.3)#4 | 4.3%(+51.3)#95 |
| 5. | Oswego | 46.7% | 3.2%(+43.4)#5 | 4.3%(+42.4)#143 |
| 6. | Newtown | 44.8% | 3.2%(+41.6)#6 | 4.3%(+40.6)#151 |
| 7. | Mount Ayr | 33.3% | 3.2%(+30.1)#7 | 4.3%(+29.1)#263 |
| 8. | Mellott | 31.6% | 3.2%(+28.3)#8 | 4.3%(+27.3)#288 |
| 9. | South Center | 31.0% | 3.2%(+27.8)#9 | 4.3%(+26.8)#297 |
| 10. | Crane | 30.0% | 3.2%(+26.8)#10 | 4.3%(+25.7)#312 |
| 11. | Sidney | 28.6% | 3.2%(+25.3)#11 | 4.3%(+24.3)#346 |
| 12. | Clifford | 26.7% | 3.2%(+23.4)#12 | 4.3%(+22.4)#386 |
| 13. | Cannelburg | 26.7% | 3.2%(+23.4)#13 | 4.3%(+22.4)#387 |
| 14. | East Germantown | 26.3% | 3.2%(+23.1)#14 | 4.3%(+22.1)#392 |
| 15. | Dana | 21.9% | 3.2%(+18.6)#15 | 4.3%(+17.6)#531 |
| 16. | Chrisney | 20.0% | 3.2%(+16.8)#16 | 4.3%(+15.7)#628 |
| 17. | Kingsbury | 20.0% | 3.2%(+16.8)#17 | 4.3%(+15.7)#632 |
| 18. | Brooklyn | 19.8% | 3.2%(+16.6)#18 | 4.3%(+15.5)#650 |
| 19. | Blairsville | 19.5% | 3.2%(+16.3)#19 | 4.3%(+15.3)#670 |
| 20. | Lake Santee | 19.1% | 3.2%(+15.9)#20 | 4.3%(+14.9)#698 |
| 21. | Griffin | 19.0% | 3.2%(+15.8)#21 | 4.3%(+14.8)#708 |
| 22. | Bennetts Switch | 18.8% | 3.2%(+15.6)#22 | 4.3%(+14.5)#723 |
| 23. | Patriot | 18.2% | 3.2%(+14.9)#23 | 4.3%(+13.9)#768 |
| 24. | Greensboro | 18.2% | 3.2%(+14.9)#24 | 4.3%(+13.9)#770 |
| 25. | Oakland City | 17.9% | 3.2%(+14.6)#25 | 4.3%(+13.6)#787 |
| 26. | Chandler | 16.9% | 3.2%(+13.7)#26 | 4.3%(+12.7)#855 |
| 27. | Burnettsville | 16.7% | 3.2%(+13.4)#27 | 4.3%(+12.4)#884 |
| 28. | Cedar Grove | 16.7% | 3.2%(+13.4)#28 | 4.3%(+12.4)#893 |
| 29. | Springport | 16.7% | 3.2%(+13.4)#29 | 4.3%(+12.4)#897 |
| 30. | Pleasant View | 16.1% | 3.2%(+12.8)#30 | 4.3%(+11.8)#949 |
| 31. | Waterloo | 15.7% | 3.2%(+12.5)#31 | 4.3%(+11.5)#980 |
| 32. | Whiteland | 15.0% | 3.2%(+11.8)#32 | 4.3%(+10.8)#1,055 |
| 33. | Hudson Lake | 15.0% | 3.2%(+11.8)#33 | 4.3%(+10.7)#1,057 |
| 34. | Scottsburg | 14.9% | 3.2%(+11.7)#34 | 4.3%(+10.7)#1,074 |
| 35. | Winona Lake | 14.9% | 3.2%(+11.6)#35 | 4.3%(+10.6)#1,079 |
| 36. | Albion | 14.4% | 3.2%(+11.2)#36 | 4.3%(+10.2)#1,131 |
| 37. | Nineveh | 14.2% | 3.2%(+10.9)#37 | 4.3%(+9.90)#1,180 |
| 38. | Celestine | 14.0% | 3.2%(+10.7)#38 | 4.3%(+9.70)#1,202 |
| 39. | New Harmony | 13.8% | 3.2%(+10.5)#39 | 4.3%(+9.51)#1,234 |
| 40. | Antioch | 13.6% | 3.2%(+10.3)#40 | 4.3%(+9.31)#1,256 |
| 41. | Barbee | 12.6% | 3.2%(+9.36)#41 | 4.3%(+8.35)#1,404 |
| 42. | Rockville | 11.9% | 3.2%(+8.61)#42 | 4.3%(+7.60)#1,553 |
| 43. | Woodlawn Heights | 11.6% | 3.2%(+8.38)#43 | 4.3%(+7.38)#1,605 |
| 44. | Stinesville | 11.3% | 3.2%(+8.07)#44 | 4.3%(+7.07)#1,653 |
| 45. | La Paz | 10.8% | 3.2%(+7.56)#45 | 4.3%(+6.56)#1,797 |
| 46. | Ogden Dunes | 10.8% | 3.2%(+7.55)#46 | 4.3%(+6.54)#1,804 |
| 47. | Nappanee | 10.3% | 3.2%(+7.01)#47 | 4.3%(+6.00)#1,980 |
| 48. | Etna Green | 9.5% | 3.2%(+6.28)#48 | 4.3%(+5.27)#2,236 |
| 49. | Melody Hill | 9.5% | 3.2%(+6.24)#49 | 4.3%(+5.23)#2,255 |
| 50. | Reo | 9.5% | 3.2%(+6.21)#50 | 4.3%(+5.21)#2,264 |
| 51. | Harlan | 9.2% | 3.2%(+5.96)#51 | 4.3%(+4.95)#2,358 |
| 52. | Earl Park | 8.8% | 3.2%(+5.58)#52 | 4.3%(+4.57)#2,543 |
| 53. | Silver Lake | 8.5% | 3.2%(+5.26)#53 | 4.3%(+4.26)#2,693 |
| 54. | Uniondale | 8.3% | 3.2%(+5.09)#54 | 4.3%(+4.08)#2,789 |
| 55. | Clinton | 8.3% | 3.2%(+5.05)#55 | 4.3%(+4.04)#2,817 |
| 56. | Bloomington | 8.0% | 3.2%(+4.76)#56 | 4.3%(+3.76)#2,961 |
| 57. | New Paris | 8.0% | 3.2%(+4.71)#57 | 4.3%(+3.70)#3,004 |
| 58. | Milan | 7.9% | 3.2%(+4.67)#58 | 4.3%(+3.66)#3,023 |
| 59. | Homecroft | 7.8% | 3.2%(+4.60)#59 | 4.3%(+3.60)#3,061 |
| 60. | Atlanta | 7.8% | 3.2%(+4.60)#60 | 4.3%(+3.59)#3,062 |
| 61. | Ardmore | 7.7% | 3.2%(+4.45)#61 | 4.3%(+3.44)#3,143 |
| 62. | Newport | 7.7% | 3.2%(+4.45)#62 | 4.3%(+3.44)#3,159 |
| 63. | Mount Etna | 7.7% | 3.2%(+4.45)#63 | 4.3%(+3.44)#3,168 |
| 64. | Ligonier | 7.6% | 3.2%(+4.38)#64 | 4.3%(+3.38)#3,210 |
| 65. | Monroeville | 7.6% | 3.2%(+4.36)#65 | 4.3%(+3.36)#3,222 |
| 66. | Jasonville | 7.6% | 3.2%(+4.33)#66 | 4.3%(+3.32)#3,247 |
| 67. | Grabill | 7.6% | 3.2%(+4.33)#67 | 4.3%(+3.32)#3,249 |
| 68. | Greencastle | 7.4% | 3.2%(+4.17)#68 | 4.3%(+3.16)#3,342 |
| 69. | Zanesville | 7.4% | 3.2%(+4.16)#69 | 4.3%(+3.16)#3,355 |
| 70. | Mooresville | 7.4% | 3.2%(+4.14)#70 | 4.3%(+3.14)#3,374 |
| 71. | De Motte | 7.3% | 3.2%(+4.05)#71 | 4.3%(+3.04)#3,451 |
| 72. | North Judson | 7.2% | 3.2%(+3.96)#72 | 4.3%(+2.96)#3,520 |
| 73. | Cromwell | 7.1% | 3.2%(+3.90)#73 | 4.3%(+2.89)#3,577 |
| 74. | Sheridan | 7.1% | 3.2%(+3.88)#74 | 4.3%(+2.88)#3,611 |
| 75. | Bourbon | 7.0% | 3.2%(+3.75)#75 | 4.3%(+2.74)#3,710 |
| 76. | Arcadia | 7.0% | 3.2%(+3.74)#76 | 4.3%(+2.74)#3,713 |
| 77. | Winfield | 7.0% | 3.2%(+3.72)#77 | 4.3%(+2.71)#3,736 |
| 78. | Madison | 6.9% | 3.2%(+3.66)#78 | 4.3%(+2.65)#3,777 |
| 79. | Muncie | 6.8% | 3.2%(+3.56)#79 | 4.3%(+2.56)#3,889 |
| 80. | Milford | 6.8% | 3.2%(+3.51)#80 | 4.3%(+2.50)#3,944 |
| 81. | Town Of Pines | 6.7% | 3.2%(+3.50)#81 | 4.3%(+2.49)#3,962 |
| 82. | Washington | 6.7% | 3.2%(+3.44)#82 | 4.3%(+2.43)#4,013 |
| 83. | West Lebanon | 6.7% | 3.2%(+3.42)#83 | 4.3%(+2.41)#4,025 |
| 84. | Milton | 6.7% | 3.2%(+3.42)#84 | 4.3%(+2.41)#4,036 |
| 85. | Edwardsport | 6.7% | 3.2%(+3.42)#85 | 4.3%(+2.41)#4,040 |
| 86. | Poneto | 6.7% | 3.2%(+3.42)#86 | 4.3%(+2.41)#4,054 |
| 87. | Aberdeen | 6.6% | 3.2%(+3.40)#87 | 4.3%(+2.40)#4,072 |
| 88. | Rossville | 6.6% | 3.2%(+3.39)#88 | 4.3%(+2.39)#4,079 |
| 89. | Upland | 6.6% | 3.2%(+3.37)#89 | 4.3%(+2.37)#4,100 |
| 90. | Porter | 6.6% | 3.2%(+3.34)#90 | 4.3%(+2.34)#4,124 |
| 91. | Hobart | 6.5% | 3.2%(+3.29)#91 | 4.3%(+2.28)#4,164 |
| 92. | Selma | 6.5% | 3.2%(+3.28)#92 | 4.3%(+2.27)#4,175 |
| 93. | Boswell | 6.5% | 3.2%(+3.28)#93 | 4.3%(+2.27)#4,176 |
| 94. | Wynnedale | 6.4% | 3.2%(+3.14)#94 | 4.3%(+2.13)#4,316 |
| 95. | Knightstown | 6.4% | 3.2%(+3.11)#95 | 4.3%(+2.11)#4,330 |
| 96. | Kewanna | 6.3% | 3.2%(+3.10)#96 | 4.3%(+2.10)#4,343 |
| 97. | Auburn | 6.2% | 3.2%(+2.99)#97 | 4.3%(+1.98)#4,470 |
| 98. | Liberty | 6.2% | 3.2%(+2.97)#98 | 4.3%(+1.96)#4,489 |
| 99. | Crawfordsville | 6.2% | 3.2%(+2.96)#99 | 4.3%(+1.96)#4,496 |
| 100. | New Albany | 6.1% | 3.2%(+2.90)#100 | 4.3%(+1.90)#4,538 |
Common Questions
What are the Top 10 Cities with the Highest Percentage of Population with a Degree in Visual and Performing Arts in Indiana?
Top 10 Cities with the Highest Percentage of Population with a Degree in Visual and Performing Arts in Indiana are:
#1
100.0%
#2
55.6%
#3
44.8%
#4
33.3%
#5
31.6%
#6
30.0%
#7
28.6%
#8
26.7%
#9
26.7%
#10
26.3%
What city has the Highest Percentage of Population with a Degree in Visual and Performing Arts in Indiana?
Van Bibber Lake has the Highest Percentage of Population with a Degree in Visual and Performing Arts in Indiana with 100.0%.
What is the Percentage of Population with a Degree in Visual and Performing Arts in the State of Indiana?
Percentage of Population with a Degree in Visual and Performing Arts in Indiana is 3.2%.
What is the Percentage of Population with a Degree in Visual and Performing Arts in the United States?
Percentage of Population with a Degree in Visual and Performing Arts in the United States is 4.3%.