Inyokern, CA Map & Demographics
Inyokern Map
Inyokern Overview
$26,061
PER CAPITA INCOME
$66,683
AVG FAMILY INCOME
$65,240
AVG HOUSEHOLD INCOME
74.2%
WAGE / INCOME GAP [ % ]
25.8¢/ $1
WAGE / INCOME GAP [ $ ]
0.38
INEQUALITY / GINI INDEX
922
TOTAL POPULATION
367
MALE POPULATION
555
FEMALE POPULATION
66.13
MALES / 100 FEMALES
151.23
FEMALES / 100 MALES
55.2
MEDIAN AGE
2.8
AVG FAMILY SIZE
2.3
AVG HOUSEHOLD SIZE
473
LABOR FORCE [ PEOPLE ]
61.1%
PERCENT IN LABOR FORCE
22.3%
UNEMPLOYMENT RATE
Inyokern Zip Codes
Inyokern Area Codes
Income in Inyokern
Income Overview in Inyokern
Per Capita Income in Inyokern is $26,061, while median incomes of families and households are $66,683 and $65,240 respectively.
| Characteristic | Number | Measure |
| Per Capita Income | 922 | $26,061 |
| Median Family Income | 260 | $66,683 |
| Mean Family Income | 260 | $67,028 |
| Median Household Income | 404 | $65,240 |
| Mean Household Income | 404 | $59,658 |
| Income Deficit | 260 | $0 |
| Wage / Income Gap (%) | 922 | 74.17% |
| Wage / Income Gap ($) | 922 | 25.83¢ per $1 |
| Gini / Inequality Index | 922 | 0.38 |
Earnings by Sex in Inyokern
Average Earnings in Inyokern are $35,243, $73,600 for men and $19,008 for women, a difference of 74.2%.
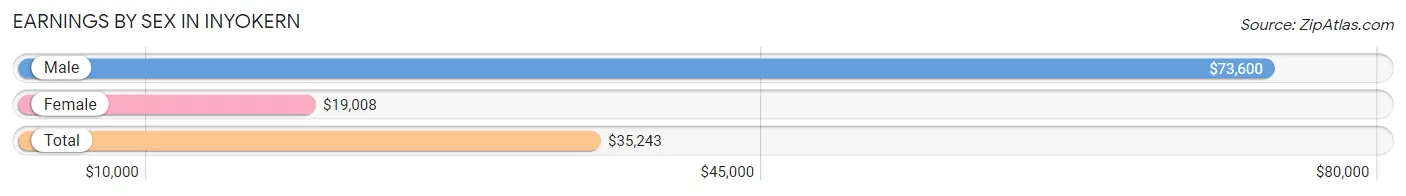
| Sex | Number | Average Earnings |
| Male | 200 (47.4%) | $73,600 |
| Female | 222 (52.6%) | $19,008 |
| Total | 422 (100.0%) | $35,243 |
Earnings by Sex by Income Bracket in Inyokern
The most common earnings brackets in Inyokern are $35,000 to $39,999 for men (52 | 26.0%) and $2,499 or less for women (73 | 32.9%).
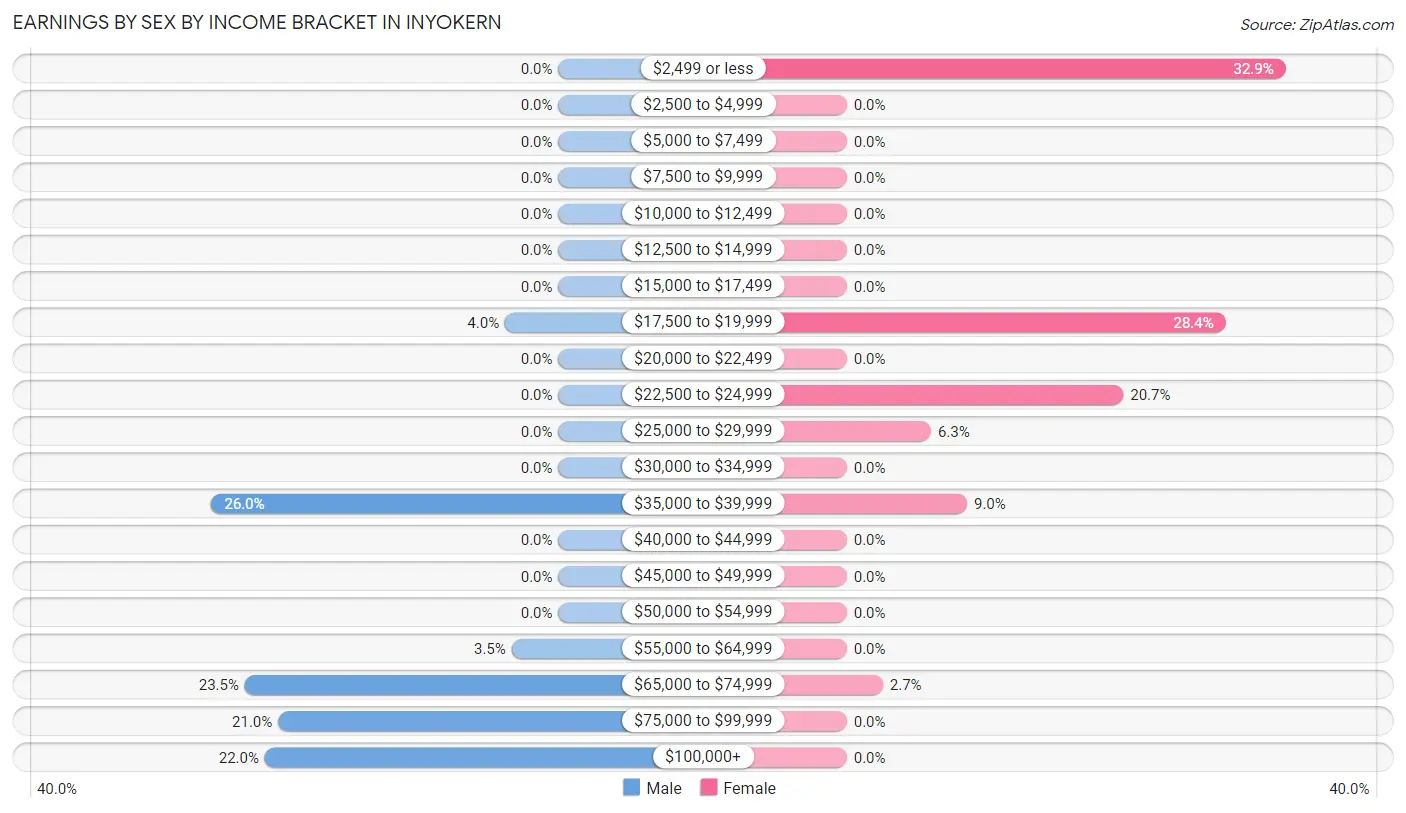
| Income | Male | Female |
| $2,499 or less | 0 (0.0%) | 73 (32.9%) |
| $2,500 to $4,999 | 0 (0.0%) | 0 (0.0%) |
| $5,000 to $7,499 | 0 (0.0%) | 0 (0.0%) |
| $7,500 to $9,999 | 0 (0.0%) | 0 (0.0%) |
| $10,000 to $12,499 | 0 (0.0%) | 0 (0.0%) |
| $12,500 to $14,999 | 0 (0.0%) | 0 (0.0%) |
| $15,000 to $17,499 | 0 (0.0%) | 0 (0.0%) |
| $17,500 to $19,999 | 8 (4.0%) | 63 (28.4%) |
| $20,000 to $22,499 | 0 (0.0%) | 0 (0.0%) |
| $22,500 to $24,999 | 0 (0.0%) | 46 (20.7%) |
| $25,000 to $29,999 | 0 (0.0%) | 14 (6.3%) |
| $30,000 to $34,999 | 0 (0.0%) | 0 (0.0%) |
| $35,000 to $39,999 | 52 (26.0%) | 20 (9.0%) |
| $40,000 to $44,999 | 0 (0.0%) | 0 (0.0%) |
| $45,000 to $49,999 | 0 (0.0%) | 0 (0.0%) |
| $50,000 to $54,999 | 0 (0.0%) | 0 (0.0%) |
| $55,000 to $64,999 | 7 (3.5%) | 0 (0.0%) |
| $65,000 to $74,999 | 47 (23.5%) | 6 (2.7%) |
| $75,000 to $99,999 | 42 (21.0%) | 0 (0.0%) |
| $100,000+ | 44 (22.0%) | 0 (0.0%) |
| Total | 200 (100.0%) | 222 (100.0%) |
Earnings by Sex by Educational Attainment in Inyokern
Average earnings in Inyokern are $74,350 for men and $19,286 for women, a difference of 74.1%. Men with an educational attainment of high school diploma enjoy the highest average annual earnings of $73,750, while those with high school diploma education earn the least with $73,750. Women with an educational attainment of college or associate's degree earn the most with the average annual earnings of $19,425, while those with college or associate's degree education have the smallest earnings of $19,425.
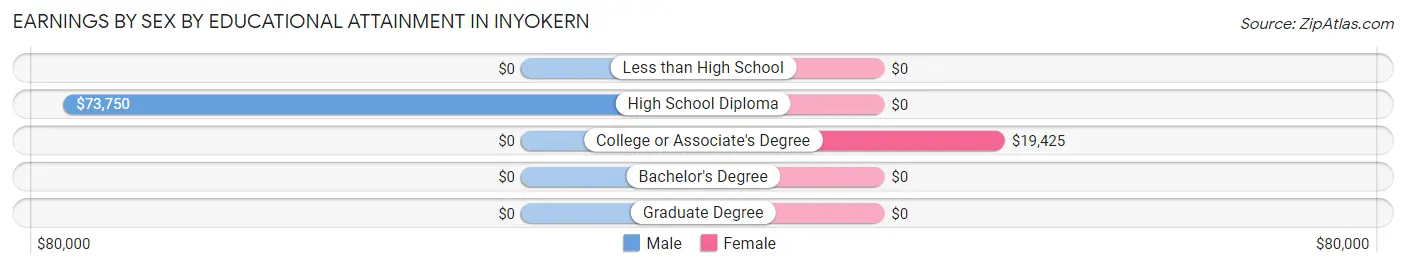
| Educational Attainment | Male Income | Female Income |
| Less than High School | - | - |
| High School Diploma | $73,750 | $0 |
| College or Associate's Degree | - | - |
| Bachelor's Degree | - | - |
| Graduate Degree | - | - |
| Total | $74,350 | $19,286 |
Family Income in Inyokern
Family Income Brackets in Inyokern
According to the Inyokern family income data, there are 76 families falling into the $15,000 to $24,999 income range, which is the most common income bracket and makes up 29.2% of all families.
| Income Bracket | # Families | % Families |
| Less than $10,000 | 0 | 0.0% |
| $10,000 to $14,999 | 0 | 0.0% |
| $15,000 to $24,999 | 76 | 29.2% |
| $25,000 to $34,999 | 19 | 7.3% |
| $35,000 to $49,999 | 0 | 0.0% |
| $50,000 to $74,999 | 52 | 20.0% |
| $75,000 to $99,999 | 42 | 16.2% |
| $100,000 to $149,999 | 71 | 27.3% |
| $150,000 to $199,999 | 0 | 0.0% |
| $200,000+ | 0 | 0.0% |
Family Income by Famaliy Size in Inyokern
| Income Bracket | # Families | Median Income |
| 2-Person Families | 197 (75.8%) | $0 |
| 3-Person Families | 7 (2.7%) | $0 |
| 4-Person Families | 14 (5.4%) | $0 |
| 5-Person Families | 26 (10.0%) | $0 |
| 6-Person Families | 0 (0.0%) | $0 |
| 7+ Person Families | 16 (6.1%) | $0 |
| Total | 260 (100.0%) | $66,683 |
Family Income by Number of Earners in Inyokern
| Number of Earners | # Families | Median Income |
| No Earners | 0 (0.0%) | $0 |
| 1 Earner | 158 (60.8%) | $0 |
| 2 Earners | 102 (39.2%) | $66,346 |
| 3+ Earners | 0 (0.0%) | $0 |
| Total | 260 (100.0%) | $66,683 |
Household Income in Inyokern
Household Income Brackets in Inyokern
With 90 households falling in the category, the $100,000 to $149,999 income range is the most frequent in Inyokern, accounting for 22.3% of all households.
| Income Bracket | # Households | % Households |
| Less than $10,000 | 0 | 0.0% |
| $10,000 to $14,999 | 61 | 15.1% |
| $15,000 to $24,999 | 71 | 17.6% |
| $25,000 to $34,999 | 19 | 4.7% |
| $35,000 to $49,999 | 46 | 11.4% |
| $50,000 to $74,999 | 52 | 12.9% |
| $75,000 to $99,999 | 65 | 16.1% |
| $100,000 to $149,999 | 90 | 22.3% |
| $150,000 to $199,999 | 0 | 0.0% |
| $200,000+ | 0 | 0.0% |
Household Income by Householder Age in Inyokern
The median household income in Inyokern is $65,240, with the highest median household income of $67,139 found in the 45 to 64 years age bracket for the primary householder. A total of 267 households (66.1%) fall into this category. Meanwhile, the 15 to 24 years age bracket for the primary householder has the lowest median household income of $0, with 7 households (1.7%) in this group.
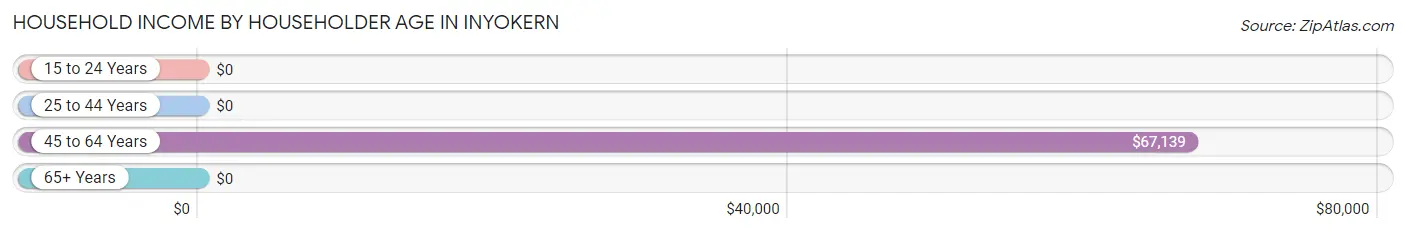
| Income Bracket | # Households | Median Income |
| 15 to 24 Years | 7 (1.7%) | $0 |
| 25 to 44 Years | 89 (22.0%) | $0 |
| 45 to 64 Years | 267 (66.1%) | $67,139 |
| 65+ Years | 41 (10.2%) | $0 |
| Total | 404 (100.0%) | $65,240 |
Poverty in Inyokern
Income Below Poverty by Sex and Age in Inyokern
With 4.4% poverty level for males and 30.8% for females among the residents of Inyokern, 15 year old males and 6 to 11 year old females are the most vulnerable to poverty, with 16 males (100.0%) and 15 females (100.0%) in their respective age groups living below the poverty level.
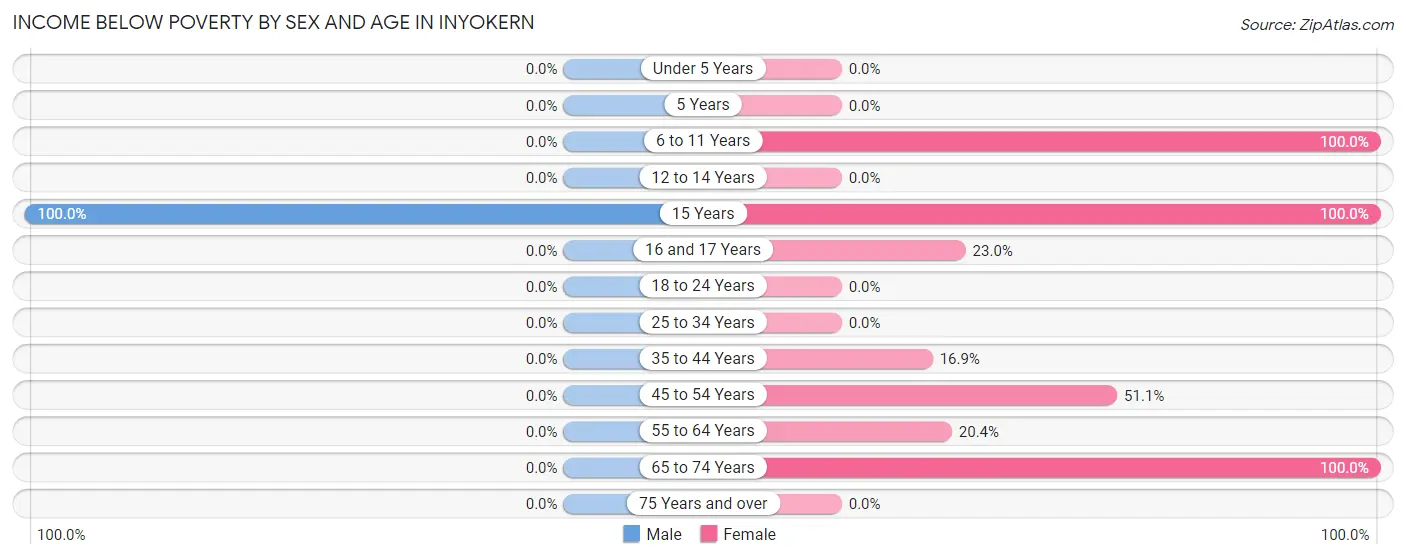
| Age Bracket | Male | Female |
| Under 5 Years | 0 (0.0%) | 0 (0.0%) |
| 5 Years | 0 (0.0%) | 0 (0.0%) |
| 6 to 11 Years | 0 (0.0%) | 15 (100.0%) |
| 12 to 14 Years | 0 (0.0%) | 0 (0.0%) |
| 15 Years | 16 (100.0%) | 15 (100.0%) |
| 16 and 17 Years | 0 (0.0%) | 20 (23.0%) |
| 18 to 24 Years | 0 (0.0%) | 0 (0.0%) |
| 25 to 34 Years | 0 (0.0%) | 0 (0.0%) |
| 35 to 44 Years | 0 (0.0%) | 14 (16.9%) |
| 45 to 54 Years | 0 (0.0%) | 23 (51.1%) |
| 55 to 64 Years | 0 (0.0%) | 48 (20.4%) |
| 65 to 74 Years | 0 (0.0%) | 36 (100.0%) |
| 75 Years and over | 0 (0.0%) | 0 (0.0%) |
| Total | 16 (4.4%) | 171 (30.8%) |
Income Above Poverty by Sex and Age in Inyokern
According to the poverty statistics in Inyokern, males aged under 5 years and females aged under 5 years are the age groups that are most secure financially, with 100.0% of males and 100.0% of females in these age groups living above the poverty line.
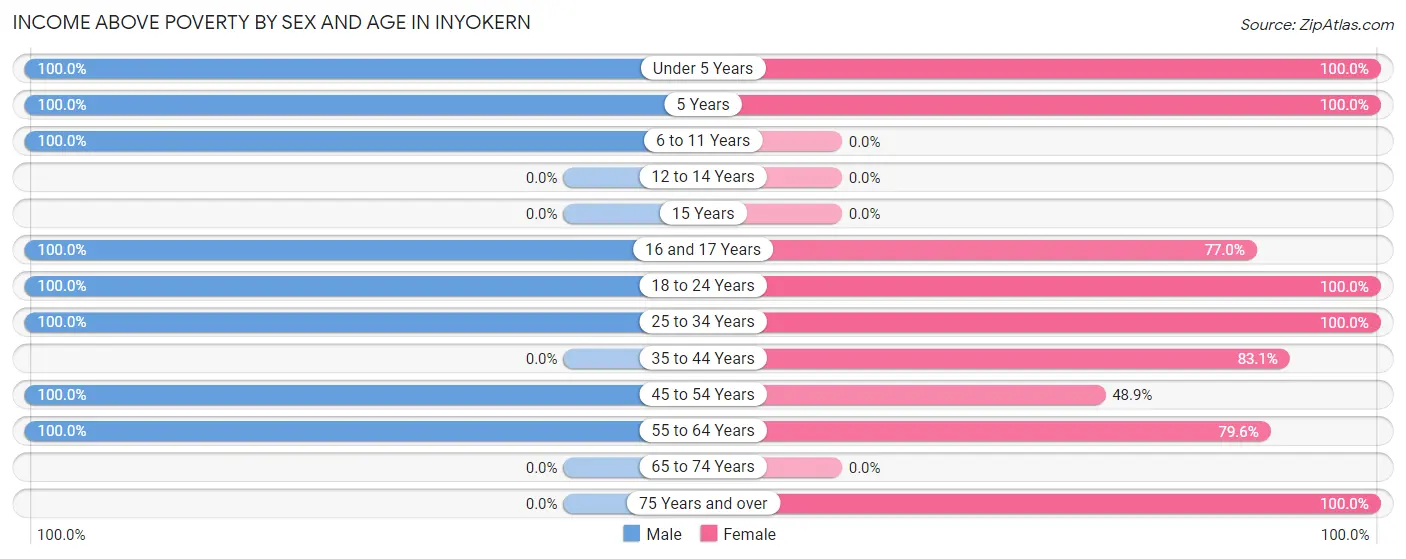
| Age Bracket | Male | Female |
| Under 5 Years | 31 (100.0%) | 14 (100.0%) |
| 5 Years | 17 (100.0%) | 7 (100.0%) |
| 6 to 11 Years | 33 (100.0%) | 0 (0.0%) |
| 12 to 14 Years | 0 (0.0%) | 0 (0.0%) |
| 15 Years | 0 (0.0%) | 0 (0.0%) |
| 16 and 17 Years | 19 (100.0%) | 67 (77.0%) |
| 18 to 24 Years | 15 (100.0%) | 6 (100.0%) |
| 25 to 34 Years | 22 (100.0%) | 7 (100.0%) |
| 35 to 44 Years | 0 (0.0%) | 69 (83.1%) |
| 45 to 54 Years | 25 (100.0%) | 22 (48.9%) |
| 55 to 64 Years | 189 (100.0%) | 187 (79.6%) |
| 65 to 74 Years | 0 (0.0%) | 0 (0.0%) |
| 75 Years and over | 0 (0.0%) | 5 (100.0%) |
| Total | 351 (95.6%) | 384 (69.2%) |
Income Below Poverty Among Married-Couple Families in Inyokern
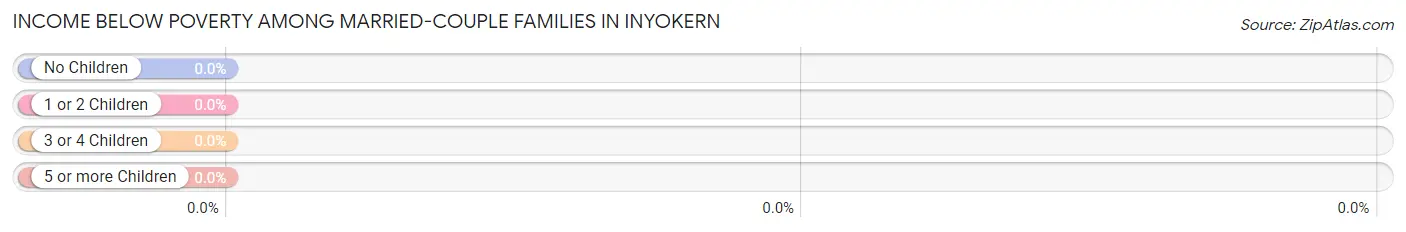
| Children | Above Poverty | Below Poverty |
| No Children | 116 (100.0%) | 0 (0.0%) |
| 1 or 2 Children | 7 (100.0%) | 0 (0.0%) |
| 3 or 4 Children | 26 (100.0%) | 0 (0.0%) |
| 5 or more Children | 16 (100.0%) | 0 (0.0%) |
| Total | 165 (100.0%) | 0 (0.0%) |
Income Below Poverty Among Single-Parent Households in Inyokern
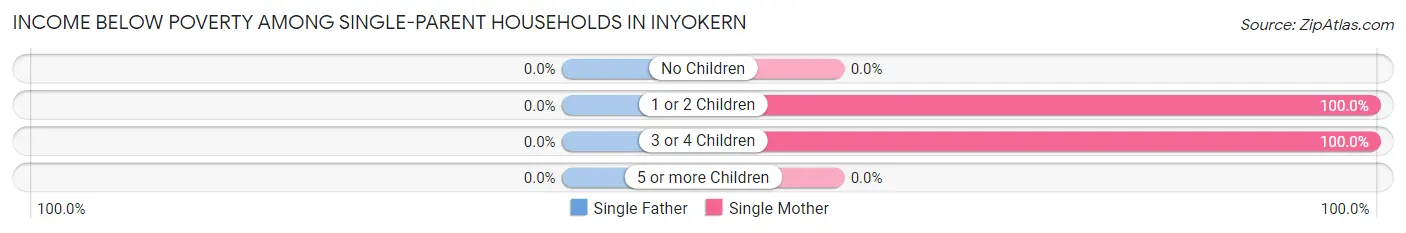
| Children | Single Father | Single Mother |
| No Children | 0 (0.0%) | 0 (0.0%) |
| 1 or 2 Children | 0 (0.0%) | 23 (100.0%) |
| 3 or 4 Children | 0 (0.0%) | 14 (100.0%) |
| 5 or more Children | 0 (0.0%) | 0 (0.0%) |
| Total | 0 (0.0%) | 37 (39.0%) |
Income Below Poverty Among Married-Couple vs Single-Parent Households in Inyokern
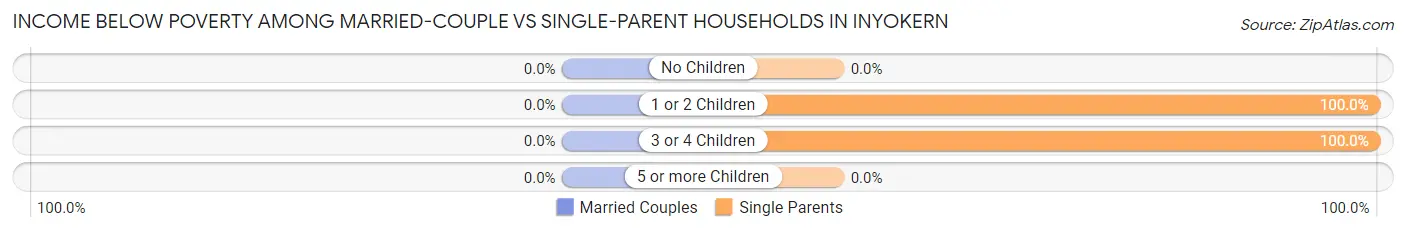
| Children | Married-Couple Families | Single-Parent Households |
| No Children | 0 (0.0%) | 0 (0.0%) |
| 1 or 2 Children | 0 (0.0%) | 23 (100.0%) |
| 3 or 4 Children | 0 (0.0%) | 14 (100.0%) |
| 5 or more Children | 0 (0.0%) | 0 (0.0%) |
| Total | 0 (0.0%) | 37 (39.0%) |
Race in Inyokern
The most populous races in Inyokern are White / Caucasian (747 | 81.0%), Two or more Races (162 | 17.6%), and Hispanic or Latino (93 | 10.1%).
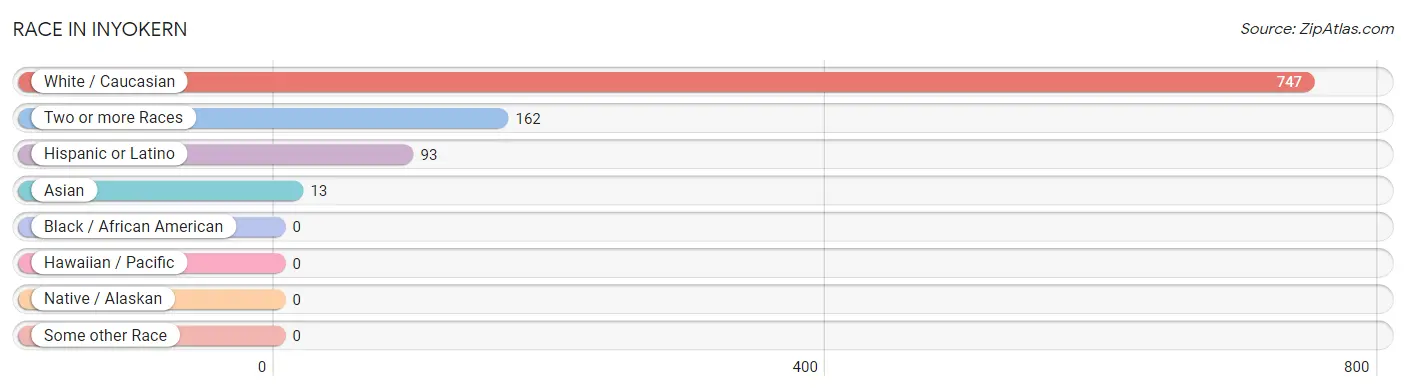
| Race | # Population | % Population |
| Asian | 13 | 1.4% |
| Black / African American | 0 | 0.0% |
| Hawaiian / Pacific | 0 | 0.0% |
| Hispanic or Latino | 93 | 10.1% |
| Native / Alaskan | 0 | 0.0% |
| White / Caucasian | 747 | 81.0% |
| Two or more Races | 162 | 17.6% |
| Some other Race | 0 | 0.0% |
| Total | 922 | 100.0% |
Ancestry in Inyokern
The most populous ancestries reported in Inyokern are Irish (355 | 38.5%), German (229 | 24.8%), English (109 | 11.8%), Mexican (93 | 10.1%), and Thai (53 | 5.8%), together accounting for 91.0% of all Inyokern residents.
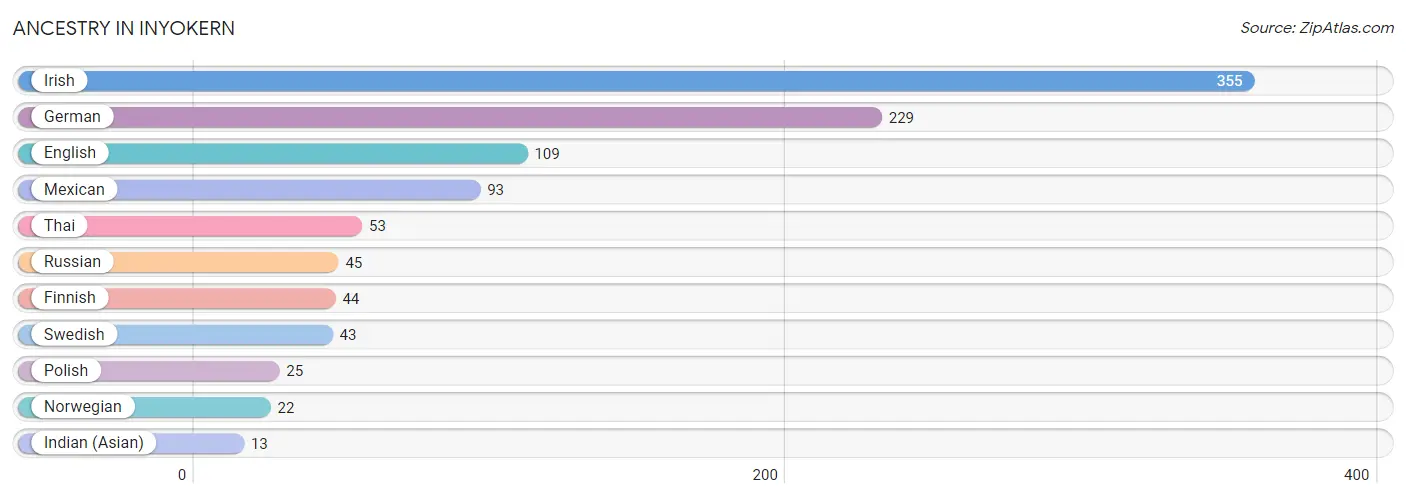
| Ancestry | # Population | % Population |
| English | 109 | 11.8% |
| Finnish | 44 | 4.8% |
| German | 229 | 24.8% |
| Indian (Asian) | 13 | 1.4% |
| Irish | 355 | 38.5% |
| Mexican | 93 | 10.1% |
| Norwegian | 22 | 2.4% |
| Polish | 25 | 2.7% |
| Russian | 45 | 4.9% |
| Swedish | 43 | 4.7% |
| Thai | 53 | 5.8% | View All 11 Rows |
Immigrants in Inyokern
The most numerous immigrant groups reported in Inyokern came from Asia (5 | 0.5%), China (5 | 0.5%), and Eastern Asia (5 | 0.5%), together accounting for 1.6% of all Inyokern residents.
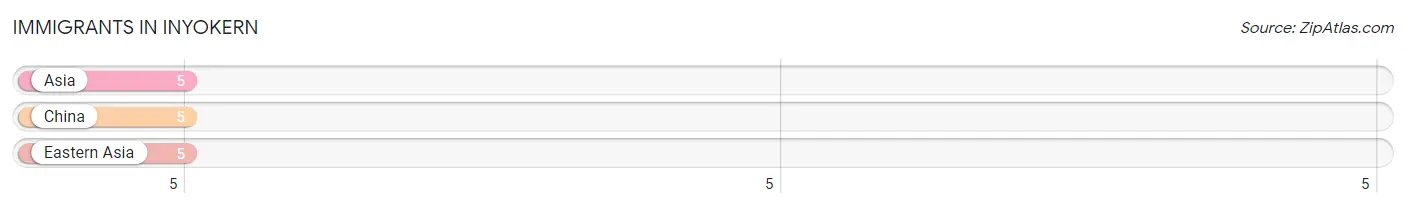
| Immigration Origin | # Population | % Population |
| Asia | 5 | 0.5% |
| China | 5 | 0.5% |
| Eastern Asia | 5 | 0.5% | View All 3 Rows |
Sex and Age in Inyokern
Sex and Age in Inyokern
The most populous age groups in Inyokern are 60 to 64 Years (125 | 34.1%) for men and 60 to 64 Years (168 | 30.3%) for women.
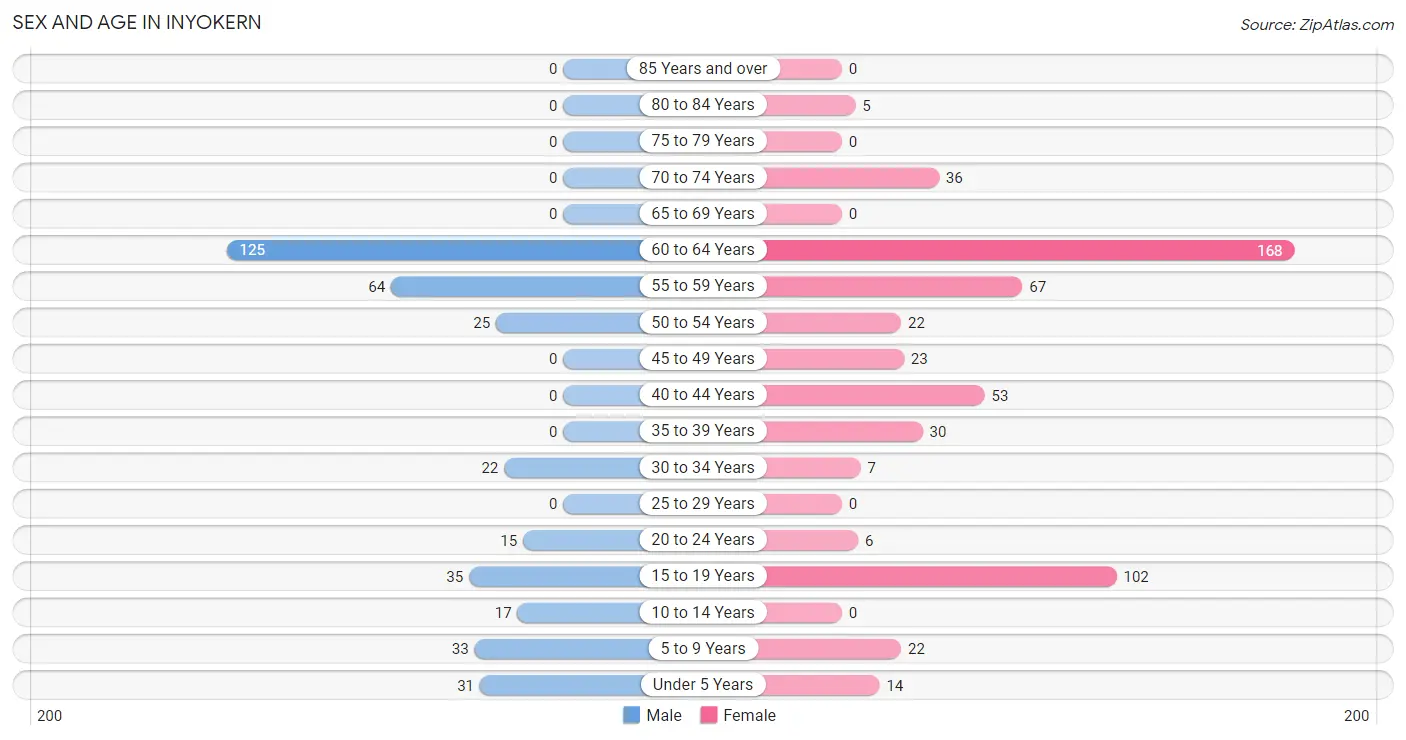
| Age Bracket | Male | Female |
| Under 5 Years | 31 (8.5%) | 14 (2.5%) |
| 5 to 9 Years | 33 (9.0%) | 22 (4.0%) |
| 10 to 14 Years | 17 (4.6%) | 0 (0.0%) |
| 15 to 19 Years | 35 (9.5%) | 102 (18.4%) |
| 20 to 24 Years | 15 (4.1%) | 6 (1.1%) |
| 25 to 29 Years | 0 (0.0%) | 0 (0.0%) |
| 30 to 34 Years | 22 (6.0%) | 7 (1.3%) |
| 35 to 39 Years | 0 (0.0%) | 30 (5.4%) |
| 40 to 44 Years | 0 (0.0%) | 53 (9.6%) |
| 45 to 49 Years | 0 (0.0%) | 23 (4.1%) |
| 50 to 54 Years | 25 (6.8%) | 22 (4.0%) |
| 55 to 59 Years | 64 (17.4%) | 67 (12.1%) |
| 60 to 64 Years | 125 (34.1%) | 168 (30.3%) |
| 65 to 69 Years | 0 (0.0%) | 0 (0.0%) |
| 70 to 74 Years | 0 (0.0%) | 36 (6.5%) |
| 75 to 79 Years | 0 (0.0%) | 0 (0.0%) |
| 80 to 84 Years | 0 (0.0%) | 5 (0.9%) |
| 85 Years and over | 0 (0.0%) | 0 (0.0%) |
| Total | 367 (100.0%) | 555 (100.0%) |
Families and Households in Inyokern
Median Family Size in Inyokern
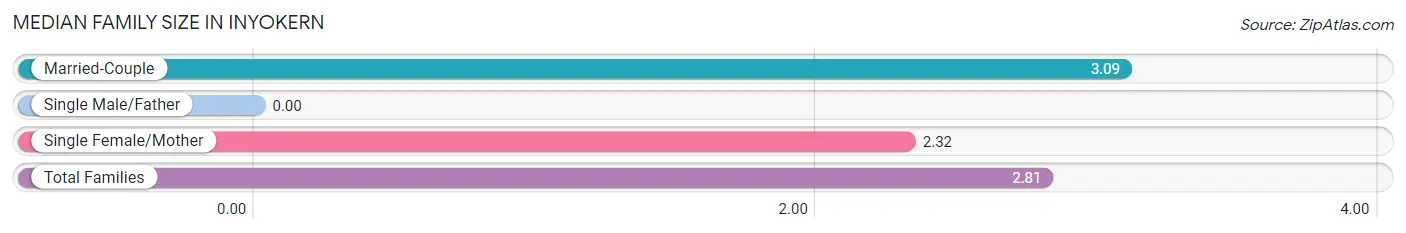
| Family Type | # Families | Family Size |
| Married-Couple | 165 (63.5%) | 3.09 |
| Single Male/Father | 0 (0.0%) | - |
| Single Female/Mother | 95 (36.5%) | 2.32 |
| Total Families | 260 (100.0%) | 2.81 |
Median Household Size in Inyokern
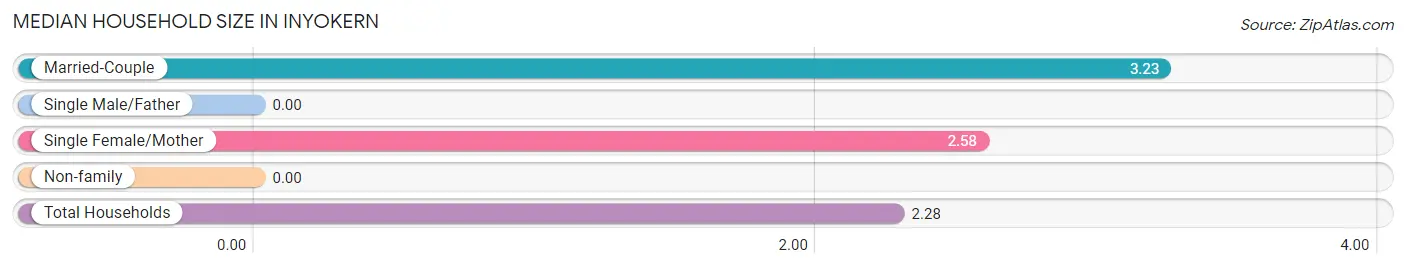
| Household Type | # Households | Household Size |
| Married-Couple | 165 (40.8%) | 3.23 |
| Single Male/Father | 0 (0.0%) | - |
| Single Female/Mother | 95 (23.5%) | 2.58 |
| Non-family | 144 (35.6%) | - |
| Total Households | 404 (100.0%) | 2.28 |
Household Size by Marriage Status in Inyokern
Out of a total of 404 households in Inyokern, 260 (64.4%) are family households, while 144 (35.6%) are nonfamily households. The most numerous type of family households are 2-person households, comprising 174, and the most common type of nonfamily households are 1-person households, comprising 144.
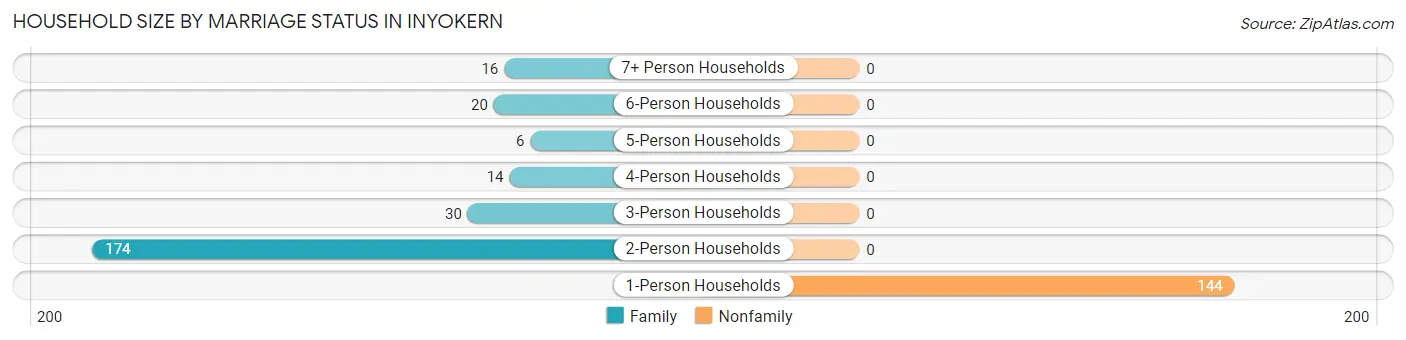
| Household Size | Family Households | Nonfamily Households |
| 1-Person Households | - | 144 (35.6%) |
| 2-Person Households | 174 (43.1%) | 0 (0.0%) |
| 3-Person Households | 30 (7.4%) | 0 (0.0%) |
| 4-Person Households | 14 (3.5%) | 0 (0.0%) |
| 5-Person Households | 6 (1.5%) | 0 (0.0%) |
| 6-Person Households | 20 (5.0%) | 0 (0.0%) |
| 7+ Person Households | 16 (4.0%) | 0 (0.0%) |
| Total | 260 (64.4%) | 144 (35.6%) |
Female Fertility in Inyokern
Fertility by Age in Inyokern
Average fertility rate in Inyokern is 59.0 births per 1,000 women. Women in the age bracket of 20 to 34 years have the highest fertility rate with 1,000.0 births per 1,000 women. Women in the age bracket of 20 to 34 years acount for 100.0% of all women with births.
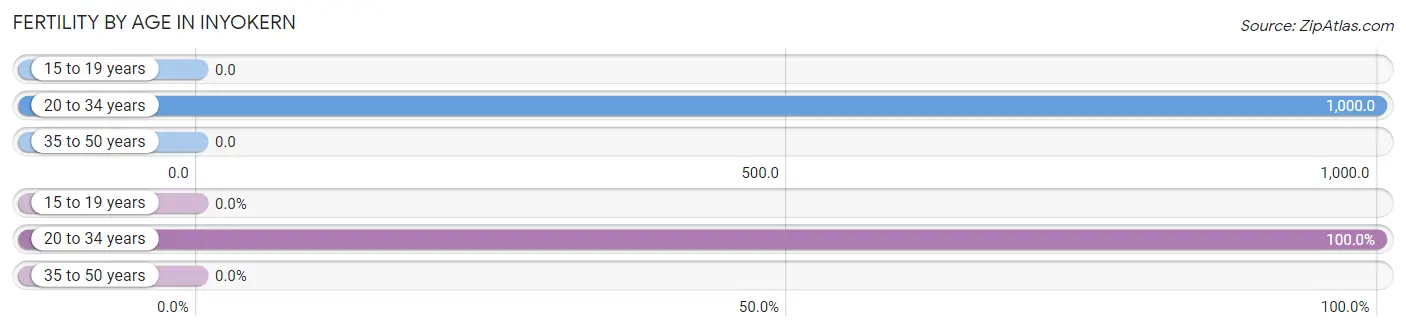
| Age Bracket | Women with Births | Births / 1,000 Women |
| 15 to 19 years | 0 (0.0%) | 0.0 |
| 20 to 34 years | 13 (100.0%) | 1,000.0 |
| 35 to 50 years | 0 (0.0%) | 0.0 |
| Total | 13 (100.0%) | 59.0 |
Fertility by Age by Marriage Status in Inyokern
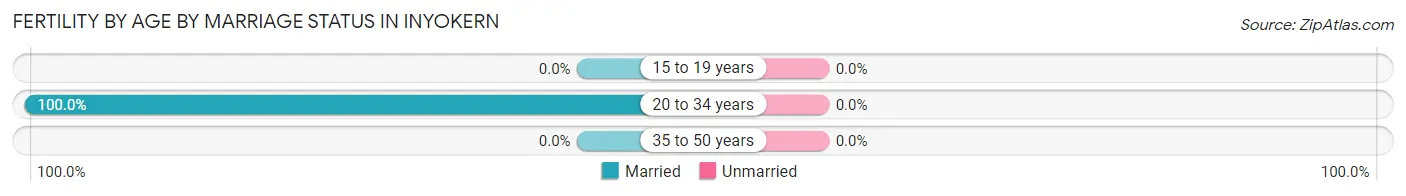
| Age Bracket | Married | Unmarried |
| 15 to 19 years | 0 (0.0%) | 0 (0.0%) |
| 20 to 34 years | 13 (100.0%) | 0 (0.0%) |
| 35 to 50 years | 0 (0.0%) | 0 (0.0%) |
| Total | 13 (100.0%) | 0 (0.0%) |
Fertility by Education in Inyokern
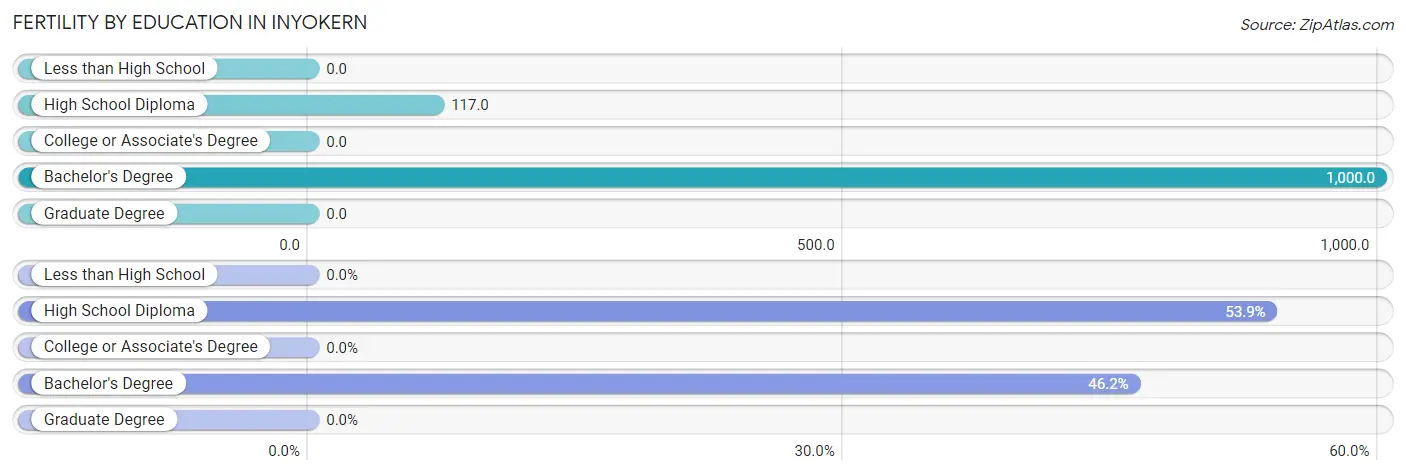
| Educational Attainment | Women with Births | Births / 1,000 Women |
| Less than High School | 0 (0.0%) | 0.0 |
| High School Diploma | 7 (53.8%) | 117.0 |
| College or Associate's Degree | 0 (0.0%) | 0.0 |
| Bachelor's Degree | 6 (46.2%) | 1,000.0 |
| Graduate Degree | 0 (0.0%) | 0.0 |
| Total | 13 (100.0%) | 59.0 |
Fertility by Education by Marriage Status in Inyokern
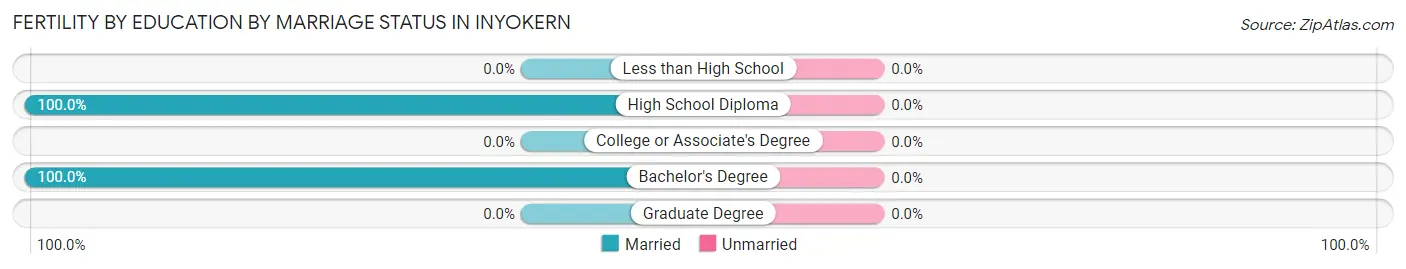
| Educational Attainment | Married | Unmarried |
| Less than High School | 0 (0.0%) | 0 (0.0%) |
| High School Diploma | 7 (100.0%) | 0 (0.0%) |
| College or Associate's Degree | 0 (0.0%) | 0 (0.0%) |
| Bachelor's Degree | 6 (100.0%) | 0 (0.0%) |
| Graduate Degree | 0 (0.0%) | 0 (0.0%) |
| Total | 13 (100.0%) | 0 (0.0%) |
Employment Characteristics in Inyokern
Employment by Class of Employer in Inyokern
Among the 369 employed individuals in Inyokern, private company employees (315 | 85.4%), federal government employees (32 | 8.7%), and not-for-profit organizations (14 | 3.8%) make up the most common classes of employment.
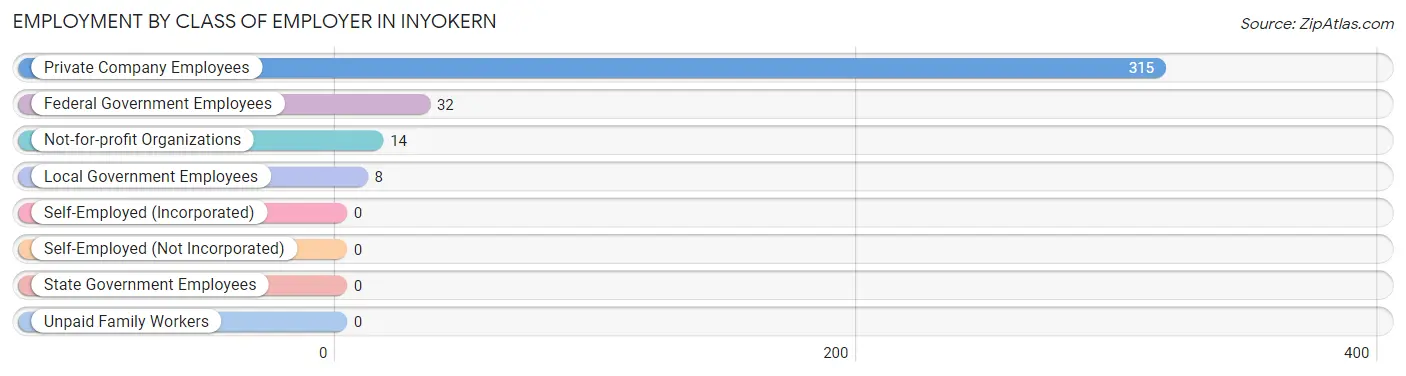
| Employer Class | # Employees | % Employees |
| Private Company Employees | 315 | 85.4% |
| Self-Employed (Incorporated) | 0 | 0.0% |
| Self-Employed (Not Incorporated) | 0 | 0.0% |
| Not-for-profit Organizations | 14 | 3.8% |
| Local Government Employees | 8 | 2.2% |
| State Government Employees | 0 | 0.0% |
| Federal Government Employees | 32 | 8.7% |
| Unpaid Family Workers | 0 | 0.0% |
| Total | 369 | 100.0% |
Employment Status by Age in Inyokern
According to the labor force statistics for Inyokern, out of the total population over 16 years of age (774), 61.1% or 473 individuals are in the labor force, with 22.3% or 105 of them unemployed. The age group with the highest labor force participation rate is 20 to 24 years, with 100.0% or 21 individuals in the labor force. Within the labor force, the 35 to 44 years age range has the highest percentage of unemployed individuals, with 79.1% or 53 of them being unemployed.
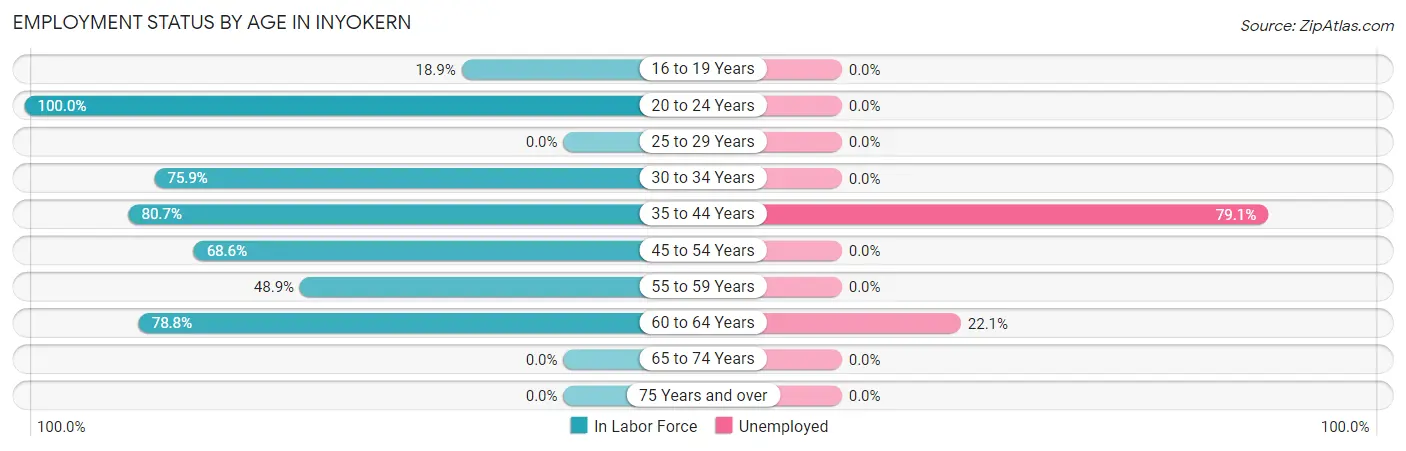
| Age Bracket | In Labor Force | Unemployed |
| 16 to 19 Years | 20 (18.9%) | 0 (0.0%) |
| 20 to 24 Years | 21 (100.0%) | 0 (0.0%) |
| 25 to 29 Years | 0 (0.0%) | 0 (0.0%) |
| 30 to 34 Years | 22 (75.9%) | 0 (0.0%) |
| 35 to 44 Years | 67 (80.7%) | 53 (79.1%) |
| 45 to 54 Years | 48 (68.6%) | 0 (0.0%) |
| 55 to 59 Years | 64 (48.9%) | 0 (0.0%) |
| 60 to 64 Years | 231 (78.8%) | 51 (22.1%) |
| 65 to 74 Years | 0 (0.0%) | 0 (0.0%) |
| 75 Years and over | 0 (0.0%) | 0 (0.0%) |
| Total | 473 (61.1%) | 105 (22.3%) |
Employment Status by Educational Attainment in Inyokern
According to labor force statistics for Inyokern, 71.3% of individuals (432) out of the total population between 25 and 64 years of age (606) are in the labor force, with 24.1% or 104 of them being unemployed. The group with the highest labor force participation rate are those with the educational attainment of high school diploma, with 77.6% or 173 individuals in the labor force. Within the labor force, individuals with high school diploma education have the highest percentage of unemployment, with 60.1% or 104 of them being unemployed.
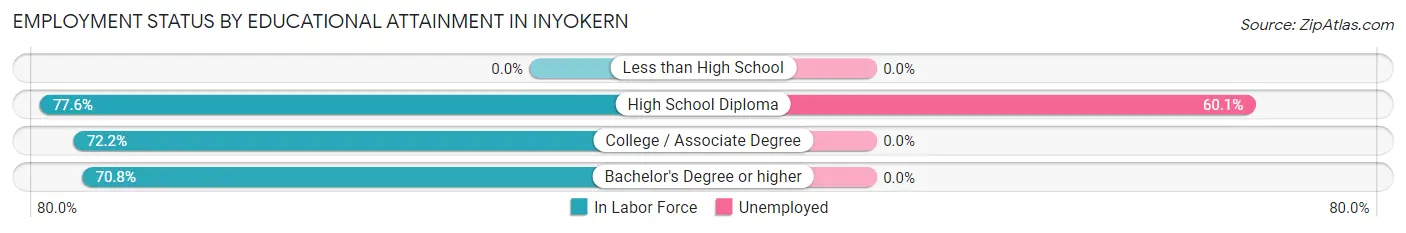
| Educational Attainment | In Labor Force | Unemployed |
| Less than High School | 0 (0.0%) | 0 (0.0%) |
| High School Diploma | 173 (77.6%) | 134 (60.1%) |
| College / Associate Degree | 213 (72.2%) | 0 (0.0%) |
| Bachelor's Degree or higher | 46 (70.8%) | 0 (0.0%) |
| Total | 432 (71.3%) | 146 (24.1%) |
Employment Occupations by Sex in Inyokern
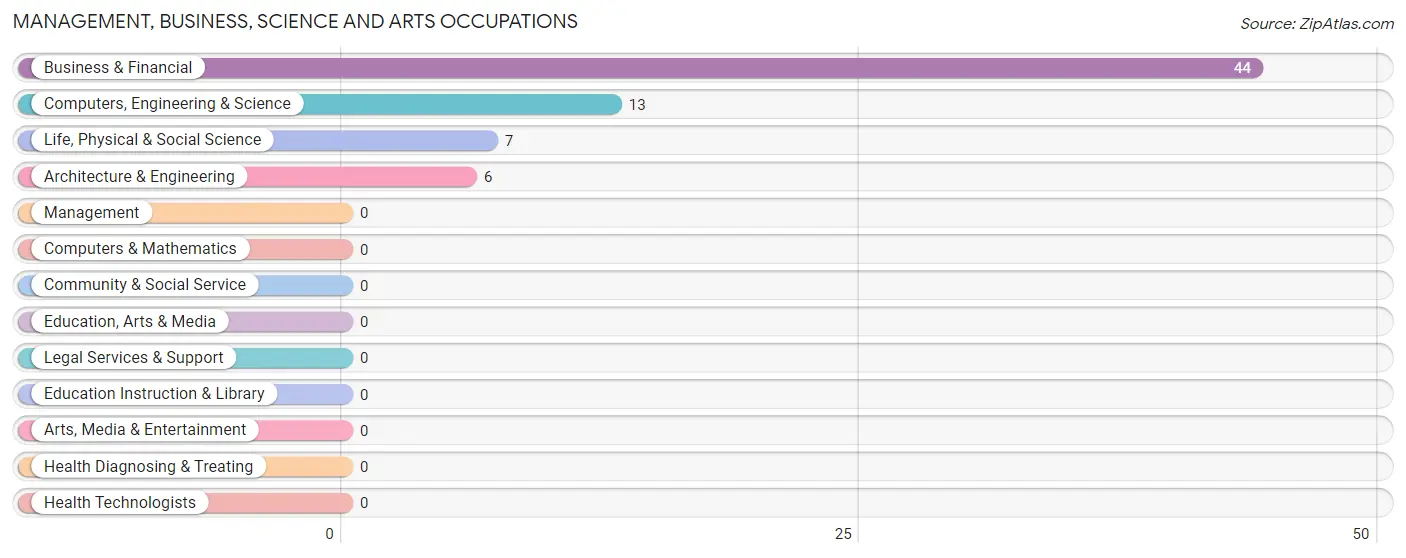
Management, Business, Science and Arts Occupations
The most common Management, Business, Science and Arts occupations in Inyokern are Business & Financial (44 | 12.1%), Computers, Engineering & Science (13 | 3.6%), Life, Physical & Social Science (7 | 1.9%), and Architecture & Engineering (6 | 1.7%).
Management, Business, Science and Arts Occupations by Sex
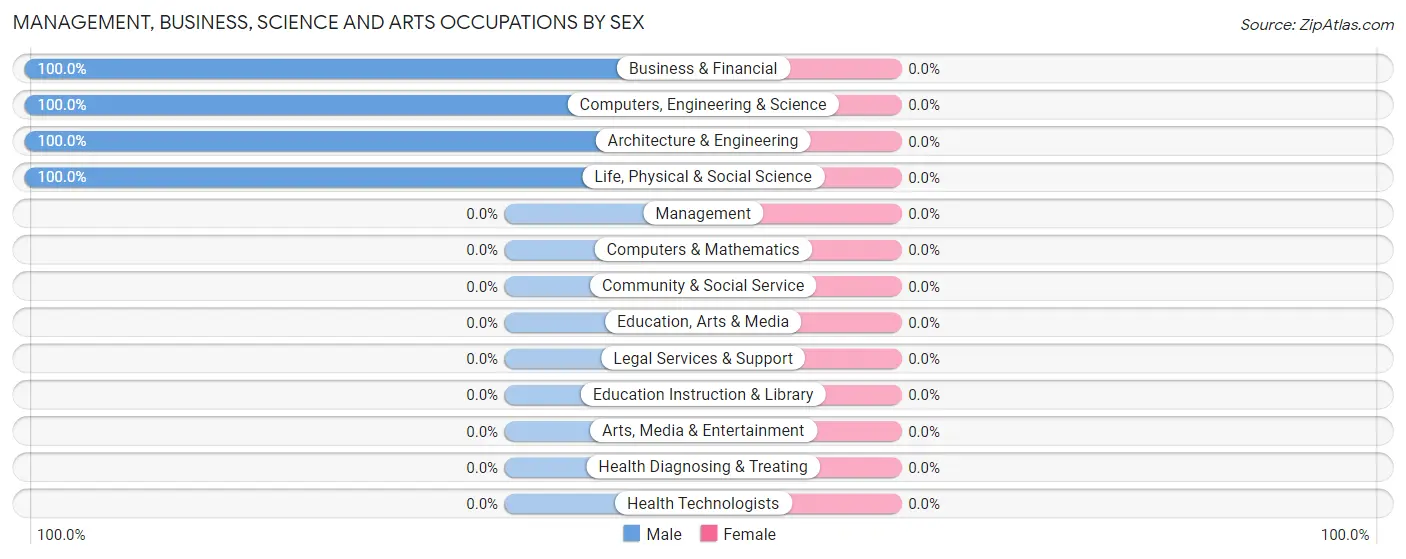
| Occupation | Male | Female |
| Management | 0 (0.0%) | 0 (0.0%) |
| Business & Financial | 44 (100.0%) | 0 (0.0%) |
| Computers, Engineering & Science | 13 (100.0%) | 0 (0.0%) |
| Computers & Mathematics | 0 (0.0%) | 0 (0.0%) |
| Architecture & Engineering | 6 (100.0%) | 0 (0.0%) |
| Life, Physical & Social Science | 7 (100.0%) | 0 (0.0%) |
| Community & Social Service | 0 (0.0%) | 0 (0.0%) |
| Education, Arts & Media | 0 (0.0%) | 0 (0.0%) |
| Legal Services & Support | 0 (0.0%) | 0 (0.0%) |
| Education Instruction & Library | 0 (0.0%) | 0 (0.0%) |
| Arts, Media & Entertainment | 0 (0.0%) | 0 (0.0%) |
| Health Diagnosing & Treating | 0 (0.0%) | 0 (0.0%) |
| Health Technologists | 0 (0.0%) | 0 (0.0%) |
| Total (Category) | 57 (100.0%) | 0 (0.0%) |
| Total (Overall) | 200 (55.1%) | 163 (44.9%) |
Services Occupations
The most common Services occupations in Inyokern are Food Preparation & Serving (43 | 11.8%), and Healthcare Support (22 | 6.1%).
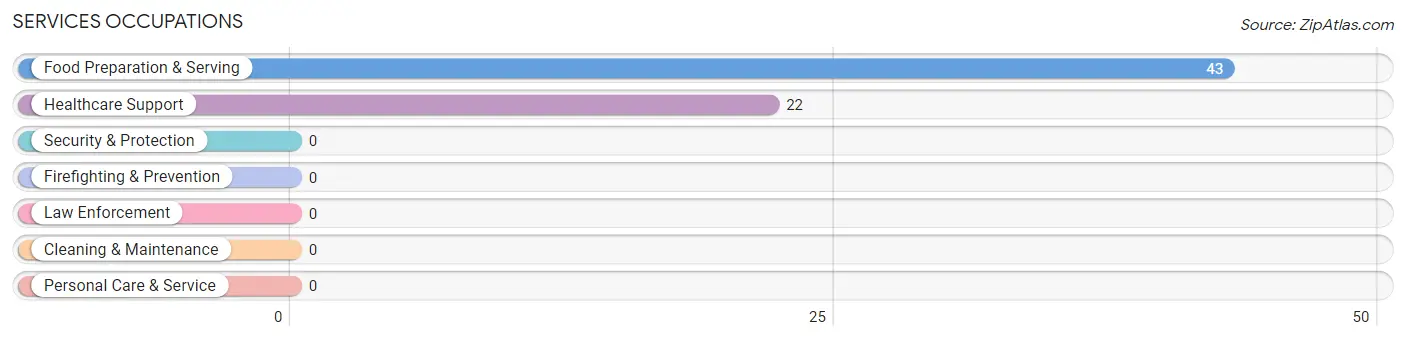
Services Occupations by Sex
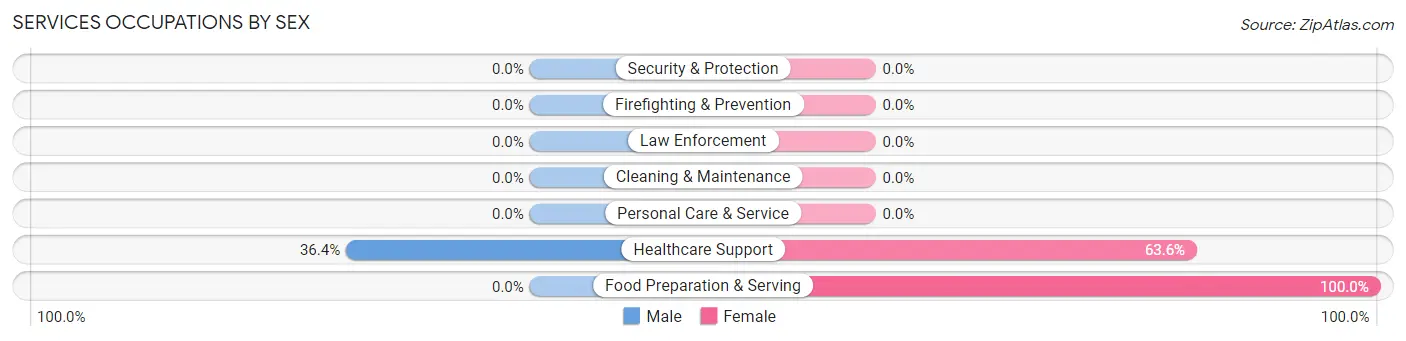
| Occupation | Male | Female |
| Healthcare Support | 8 (36.4%) | 14 (63.6%) |
| Security & Protection | 0 (0.0%) | 0 (0.0%) |
| Firefighting & Prevention | 0 (0.0%) | 0 (0.0%) |
| Law Enforcement | 0 (0.0%) | 0 (0.0%) |
| Food Preparation & Serving | 0 (0.0%) | 43 (100.0%) |
| Cleaning & Maintenance | 0 (0.0%) | 0 (0.0%) |
| Personal Care & Service | 0 (0.0%) | 0 (0.0%) |
| Total (Category) | 8 (12.3%) | 57 (87.7%) |
| Total (Overall) | 200 (55.1%) | 163 (44.9%) |
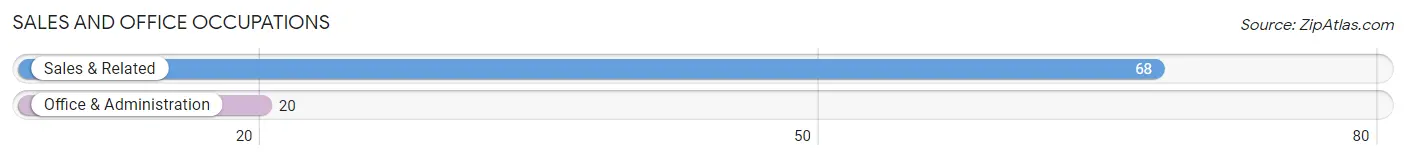
Sales and Office Occupations
The most common Sales and Office occupations in Inyokern are Sales & Related (68 | 18.7%), and Office & Administration (20 | 5.5%).
Sales and Office Occupations by Sex
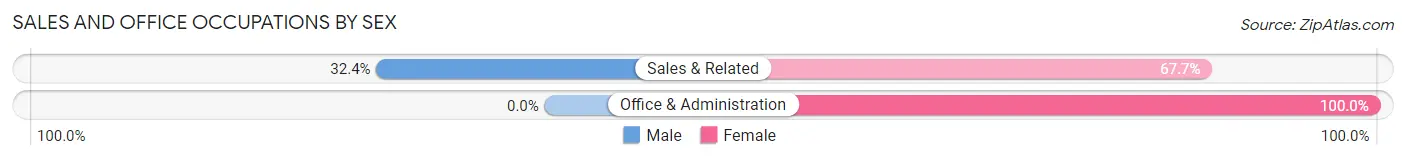
| Occupation | Male | Female |
| Sales & Related | 22 (32.4%) | 46 (67.6%) |
| Office & Administration | 0 (0.0%) | 20 (100.0%) |
| Total (Category) | 22 (25.0%) | 66 (75.0%) |
| Total (Overall) | 200 (55.1%) | 163 (44.9%) |
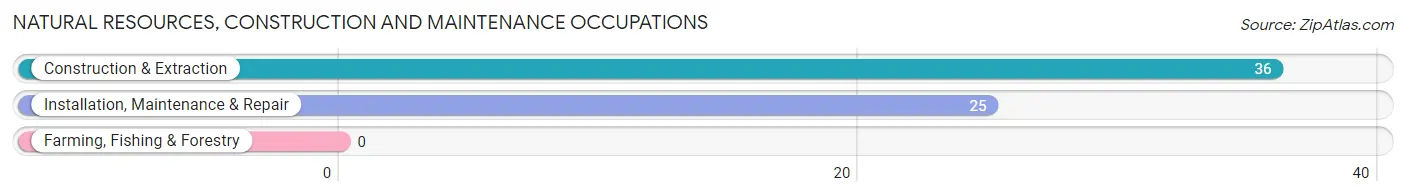
Natural Resources, Construction and Maintenance Occupations
The most common Natural Resources, Construction and Maintenance occupations in Inyokern are Construction & Extraction (36 | 9.9%), and Installation, Maintenance & Repair (25 | 6.9%).
Natural Resources, Construction and Maintenance Occupations by Sex
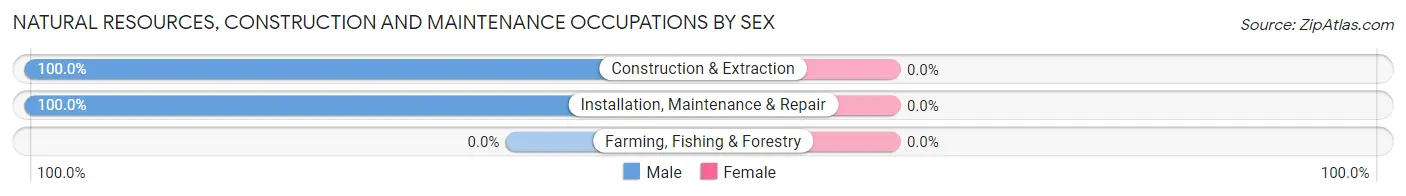
| Occupation | Male | Female |
| Farming, Fishing & Forestry | 0 (0.0%) | 0 (0.0%) |
| Construction & Extraction | 36 (100.0%) | 0 (0.0%) |
| Installation, Maintenance & Repair | 25 (100.0%) | 0 (0.0%) |
| Total (Category) | 61 (100.0%) | 0 (0.0%) |
| Total (Overall) | 200 (55.1%) | 163 (44.9%) |
Production, Transportation and Moving Occupations
The most common Production, Transportation and Moving occupations in Inyokern are Material Moving (52 | 14.3%), and Production (40 | 11.0%).
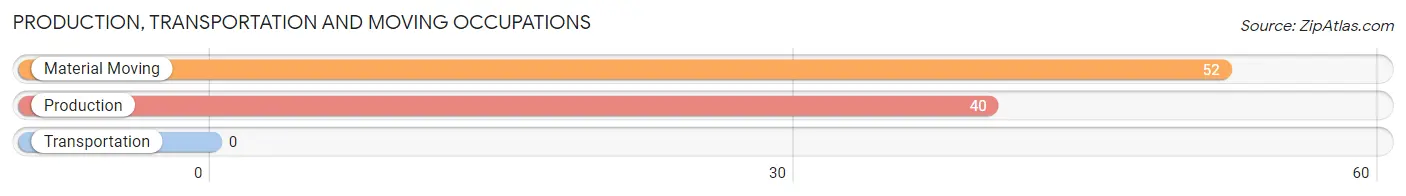
Production, Transportation and Moving Occupations by Sex
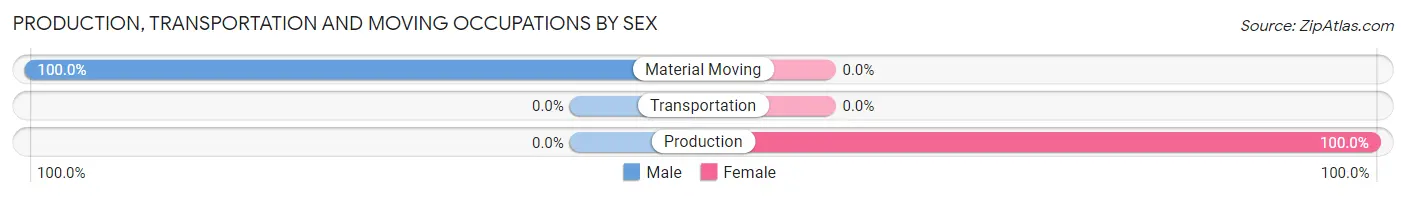
| Occupation | Male | Female |
| Production | 0 (0.0%) | 40 (100.0%) |
| Transportation | 0 (0.0%) | 0 (0.0%) |
| Material Moving | 52 (100.0%) | 0 (0.0%) |
| Total (Category) | 52 (56.5%) | 40 (43.5%) |
| Total (Overall) | 200 (55.1%) | 163 (44.9%) |
Employment Industries by Sex in Inyokern
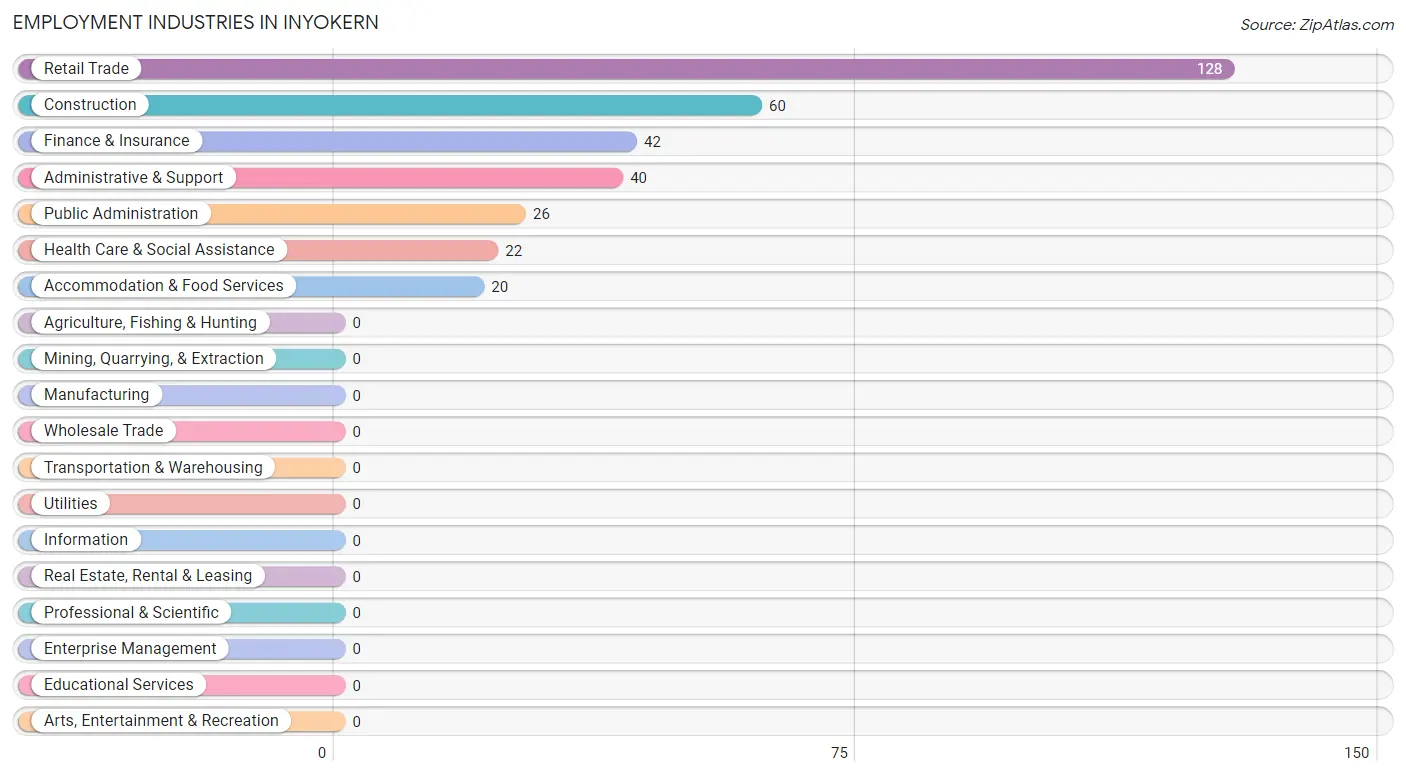
Employment Industries in Inyokern
The major employment industries in Inyokern include Retail Trade (128 | 35.3%), Construction (60 | 16.5%), Finance & Insurance (42 | 11.6%), Administrative & Support (40 | 11.0%), and Public Administration (26 | 7.2%).
Employment Industries by Sex in Inyokern
The Inyokern industries that see more men than women are Construction (100.0%), Public Administration (100.0%), and Finance & Insurance (52.4%), whereas the industries that tend to have a higher number of women are Administrative & Support (100.0%), Accommodation & Food Services (100.0%), and Health Care & Social Assistance (63.6%).
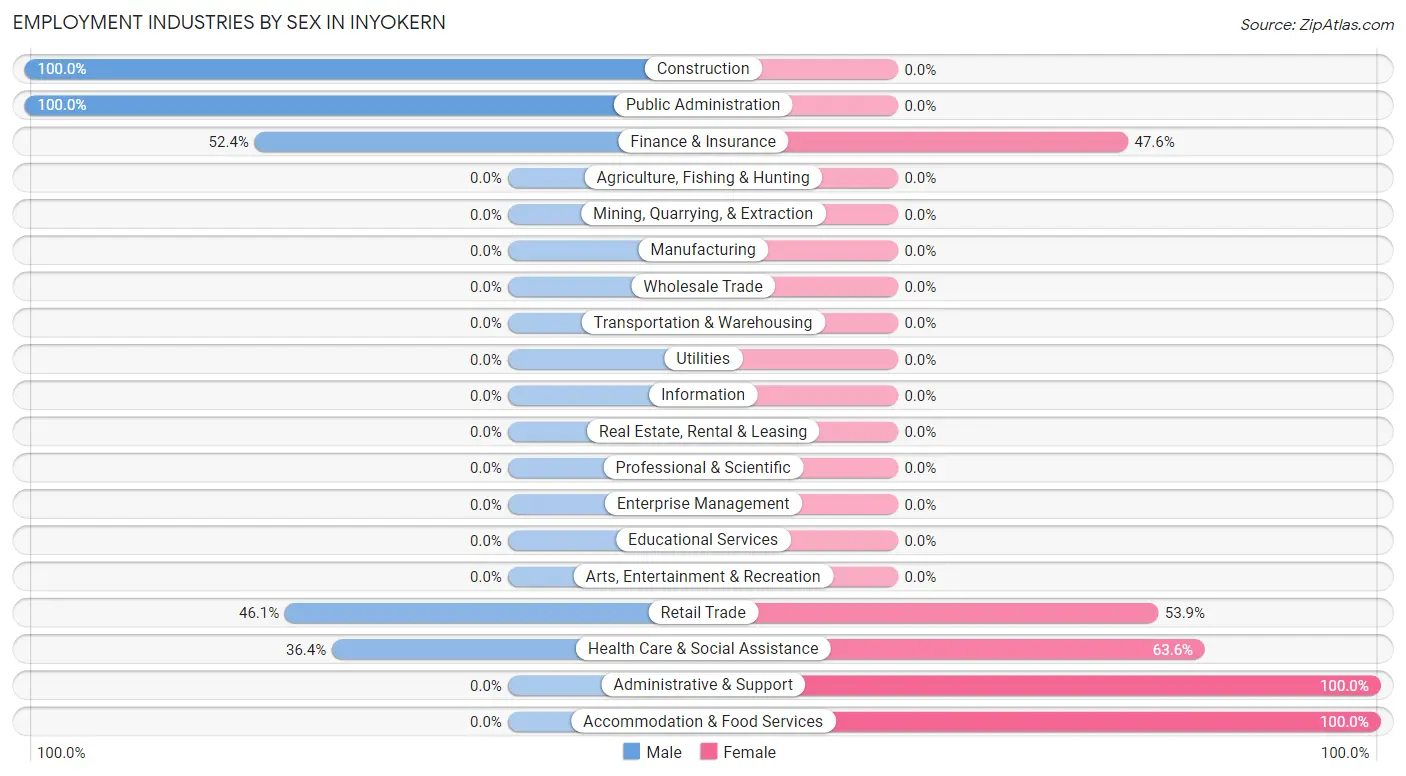
| Industry | Male | Female |
| Agriculture, Fishing & Hunting | 0 (0.0%) | 0 (0.0%) |
| Mining, Quarrying, & Extraction | 0 (0.0%) | 0 (0.0%) |
| Construction | 60 (100.0%) | 0 (0.0%) |
| Manufacturing | 0 (0.0%) | 0 (0.0%) |
| Wholesale Trade | 0 (0.0%) | 0 (0.0%) |
| Retail Trade | 59 (46.1%) | 69 (53.9%) |
| Transportation & Warehousing | 0 (0.0%) | 0 (0.0%) |
| Utilities | 0 (0.0%) | 0 (0.0%) |
| Information | 0 (0.0%) | 0 (0.0%) |
| Finance & Insurance | 22 (52.4%) | 20 (47.6%) |
| Real Estate, Rental & Leasing | 0 (0.0%) | 0 (0.0%) |
| Professional & Scientific | 0 (0.0%) | 0 (0.0%) |
| Enterprise Management | 0 (0.0%) | 0 (0.0%) |
| Administrative & Support | 0 (0.0%) | 40 (100.0%) |
| Educational Services | 0 (0.0%) | 0 (0.0%) |
| Health Care & Social Assistance | 8 (36.4%) | 14 (63.6%) |
| Arts, Entertainment & Recreation | 0 (0.0%) | 0 (0.0%) |
| Accommodation & Food Services | 0 (0.0%) | 20 (100.0%) |
| Public Administration | 26 (100.0%) | 0 (0.0%) |
| Total | 200 (55.1%) | 163 (44.9%) |
Education in Inyokern
School Enrollment in Inyokern
The most common levels of schooling among the 189 students in Inyokern are high school (101 | 53.4%), middle school (33 | 17.5%), and kindergarten (32 | 16.9%).
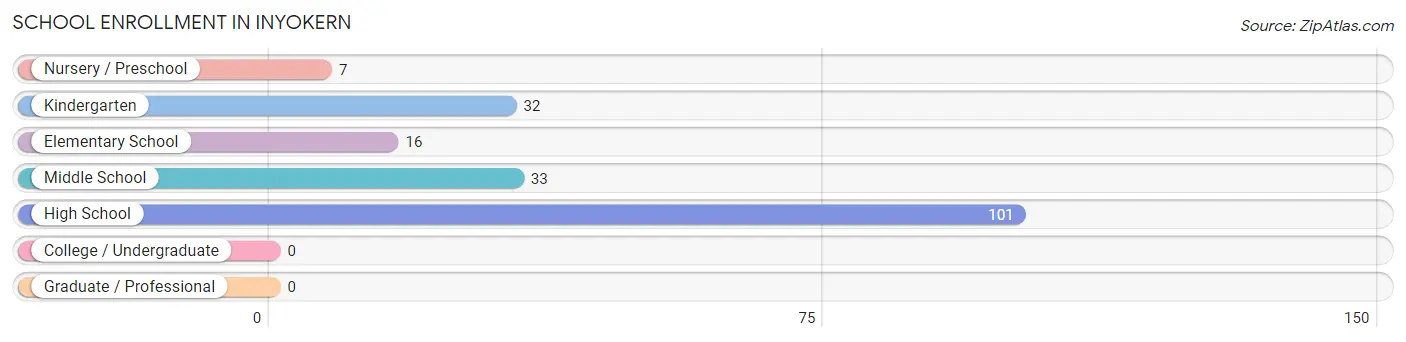
| School Level | # Students | % Students |
| Nursery / Preschool | 7 | 3.7% |
| Kindergarten | 32 | 16.9% |
| Elementary School | 16 | 8.5% |
| Middle School | 33 | 17.5% |
| High School | 101 | 53.4% |
| College / Undergraduate | 0 | 0.0% |
| Graduate / Professional | 0 | 0.0% |
| Total | 189 | 100.0% |
School Enrollment by Age by Funding Source in Inyokern
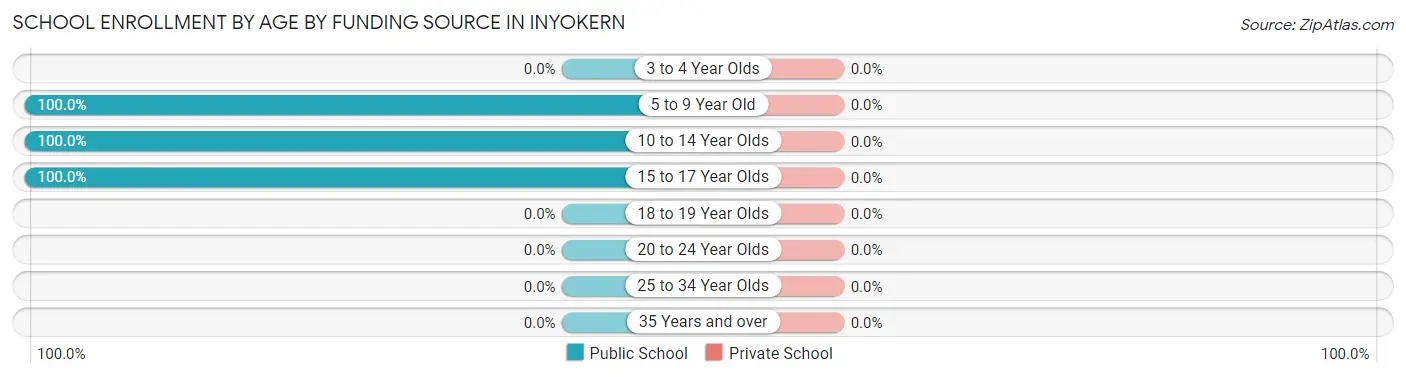
| Age Bracket | Public School | Private School |
| 3 to 4 Year Olds | 0 (0.0%) | 0 (0.0%) |
| 5 to 9 Year Old | 55 (100.0%) | 0 (0.0%) |
| 10 to 14 Year Olds | 17 (100.0%) | 0 (0.0%) |
| 15 to 17 Year Olds | 117 (100.0%) | 0 (0.0%) |
| 18 to 19 Year Olds | 0 (0.0%) | 0 (0.0%) |
| 20 to 24 Year Olds | 0 (0.0%) | 0 (0.0%) |
| 25 to 34 Year Olds | 0 (0.0%) | 0 (0.0%) |
| 35 Years and over | 0 (0.0%) | 0 (0.0%) |
| Total | 189 (100.0%) | 0 (0.0%) |
Educational Attainment by Field of Study in Inyokern
Visual & performing arts (46 | 70.8%), and literature & languages (19 | 29.2%) are the most common fields of study among 65 individuals in Inyokern who have obtained a bachelor's degree or higher.
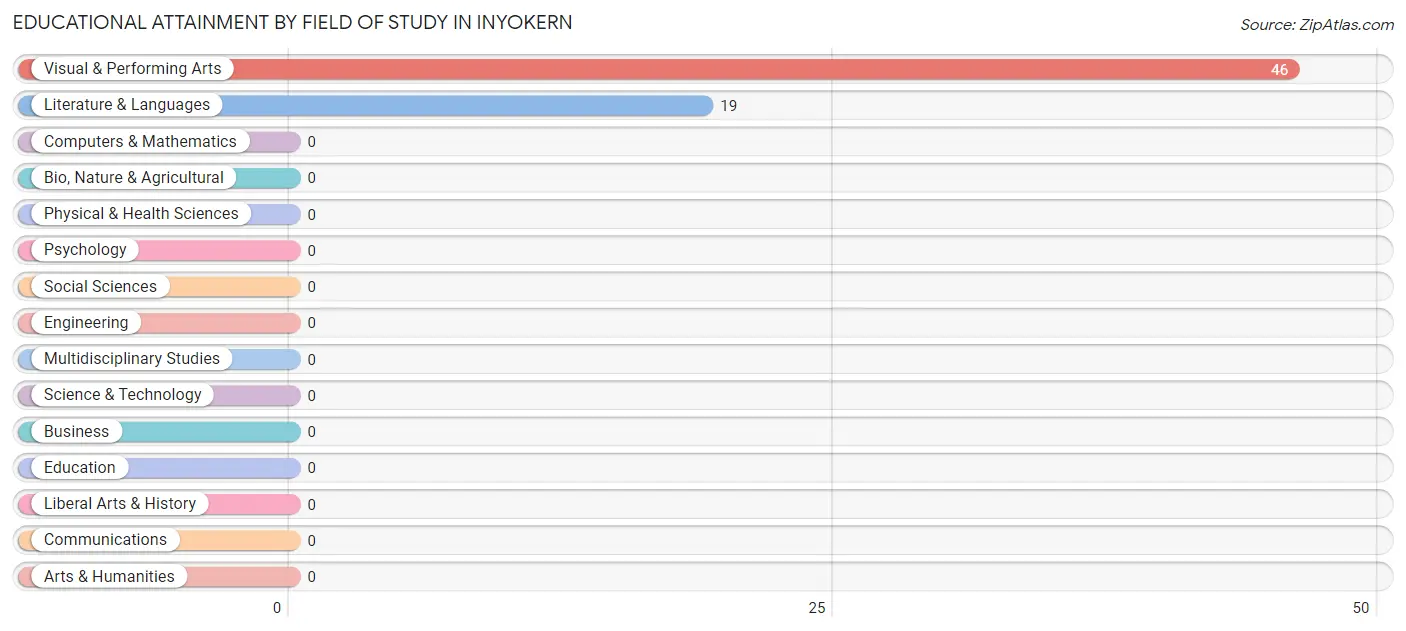
| Field of Study | # Graduates | % Graduates |
| Computers & Mathematics | 0 | 0.0% |
| Bio, Nature & Agricultural | 0 | 0.0% |
| Physical & Health Sciences | 0 | 0.0% |
| Psychology | 0 | 0.0% |
| Social Sciences | 0 | 0.0% |
| Engineering | 0 | 0.0% |
| Multidisciplinary Studies | 0 | 0.0% |
| Science & Technology | 0 | 0.0% |
| Business | 0 | 0.0% |
| Education | 0 | 0.0% |
| Literature & Languages | 19 | 29.2% |
| Liberal Arts & History | 0 | 0.0% |
| Visual & Performing Arts | 46 | 70.8% |
| Communications | 0 | 0.0% |
| Arts & Humanities | 0 | 0.0% |
| Total | 65 | 100.0% |
Transportation & Commute in Inyokern
Vehicle Availability by Sex in Inyokern
The most prevalent vehicle ownership categories in Inyokern are males with 2 vehicles (102, accounting for 51.0%) and females with 2 vehicles (66, making up 60.4%).
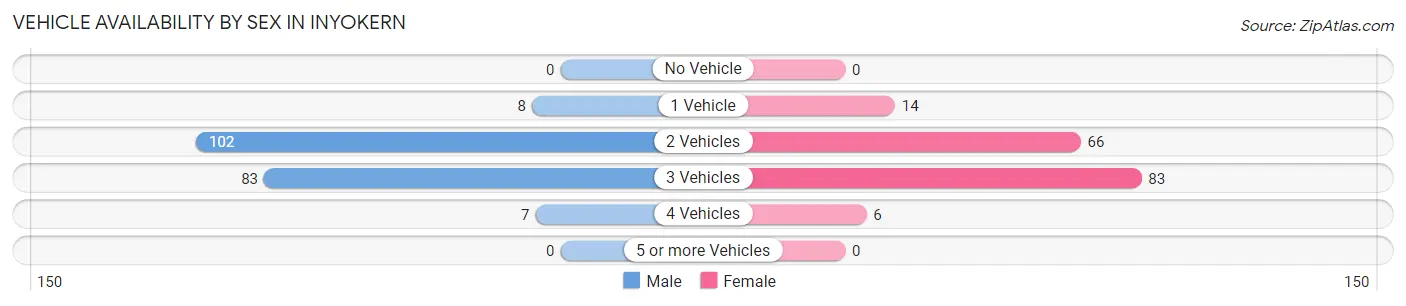
| Vehicles Available | Male | Female |
| No Vehicle | 0 (0.0%) | 0 (0.0%) |
| 1 Vehicle | 8 (4.0%) | 14 (8.3%) |
| 2 Vehicles | 102 (51.0%) | 66 (39.1%) |
| 3 Vehicles | 83 (41.5%) | 83 (49.1%) |
| 4 Vehicles | 7 (3.5%) | 6 (3.5%) |
| 5 or more Vehicles | 0 (0.0%) | 0 (0.0%) |
| Total | 200 (100.0%) | 169 (100.0%) |
Commute Time in Inyokern
The most frequently occuring commute durations in Inyokern are 15 to 19 minutes (147 commuters, 40.7%), 20 to 24 minutes (66 commuters, 18.3%), and 10 to 14 minutes (48 commuters, 13.3%).
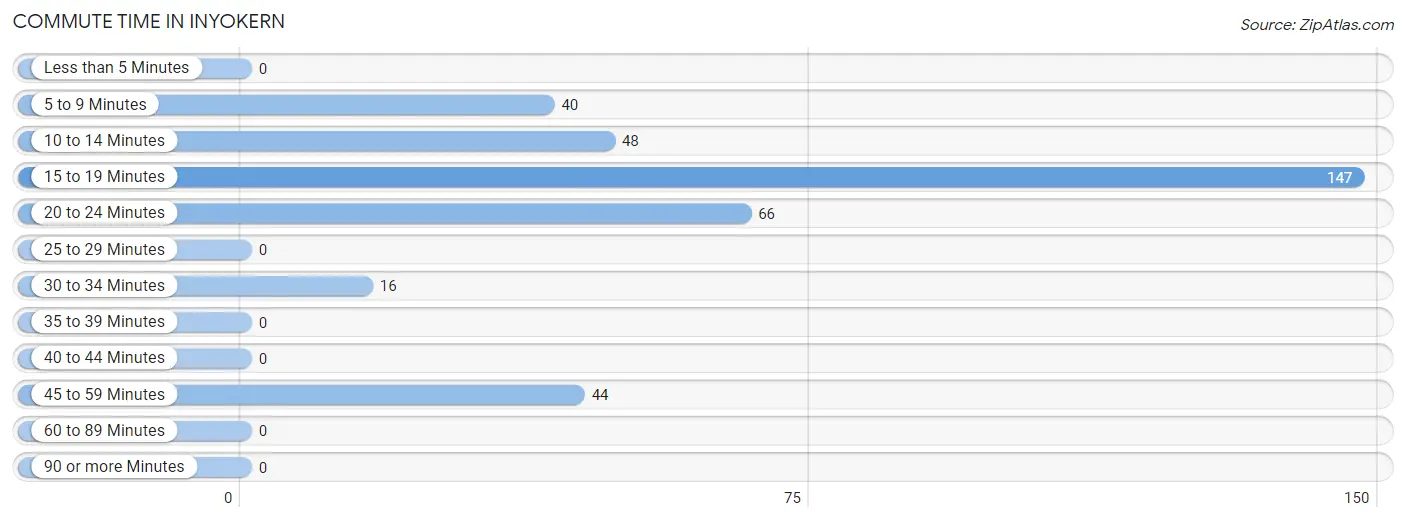
| Commute Time | # Commuters | % Commuters |
| Less than 5 Minutes | 0 | 0.0% |
| 5 to 9 Minutes | 40 | 11.1% |
| 10 to 14 Minutes | 48 | 13.3% |
| 15 to 19 Minutes | 147 | 40.7% |
| 20 to 24 Minutes | 66 | 18.3% |
| 25 to 29 Minutes | 0 | 0.0% |
| 30 to 34 Minutes | 16 | 4.4% |
| 35 to 39 Minutes | 0 | 0.0% |
| 40 to 44 Minutes | 0 | 0.0% |
| 45 to 59 Minutes | 44 | 12.2% |
| 60 to 89 Minutes | 0 | 0.0% |
| 90 or more Minutes | 0 | 0.0% |
Commute Time by Sex in Inyokern
The most common commute times in Inyokern are 15 to 19 minutes (90 commuters, 46.9%) for males and 15 to 19 minutes (57 commuters, 33.7%) for females.
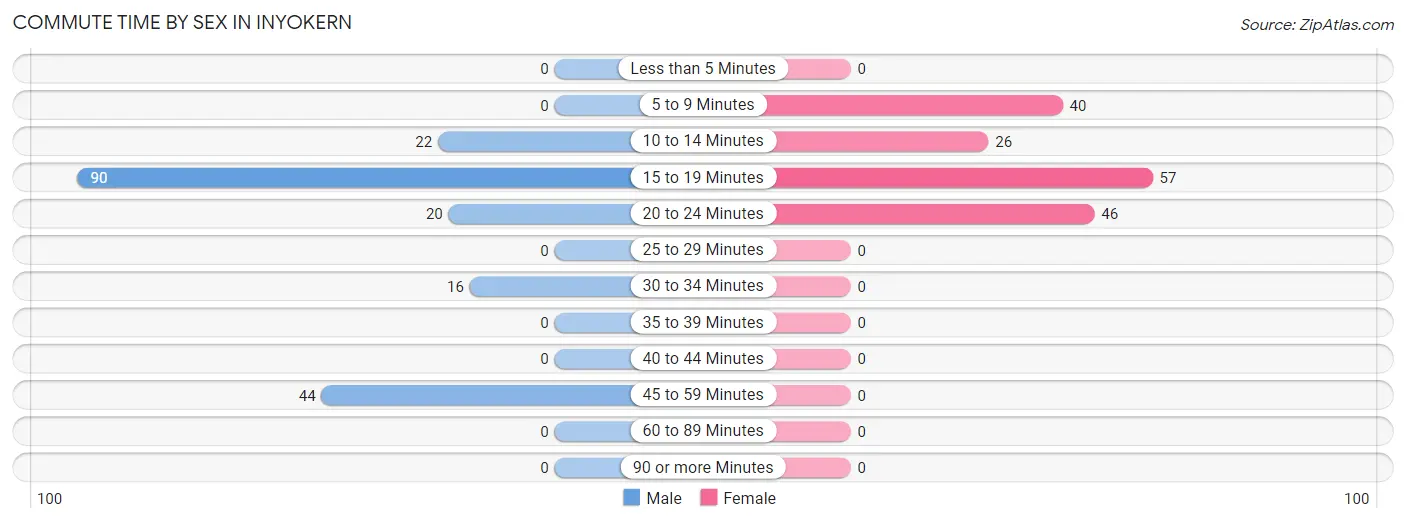
| Commute Time | Male | Female |
| Less than 5 Minutes | 0 (0.0%) | 0 (0.0%) |
| 5 to 9 Minutes | 0 (0.0%) | 40 (23.7%) |
| 10 to 14 Minutes | 22 (11.5%) | 26 (15.4%) |
| 15 to 19 Minutes | 90 (46.9%) | 57 (33.7%) |
| 20 to 24 Minutes | 20 (10.4%) | 46 (27.2%) |
| 25 to 29 Minutes | 0 (0.0%) | 0 (0.0%) |
| 30 to 34 Minutes | 16 (8.3%) | 0 (0.0%) |
| 35 to 39 Minutes | 0 (0.0%) | 0 (0.0%) |
| 40 to 44 Minutes | 0 (0.0%) | 0 (0.0%) |
| 45 to 59 Minutes | 44 (22.9%) | 0 (0.0%) |
| 60 to 89 Minutes | 0 (0.0%) | 0 (0.0%) |
| 90 or more Minutes | 0 (0.0%) | 0 (0.0%) |
Time of Departure to Work by Sex in Inyokern
The most frequent times of departure to work in Inyokern are 12:00 PM to 3:59 PM (77, 40.1%) for males and 6:00 AM to 6:29 AM (46, 27.2%) for females.
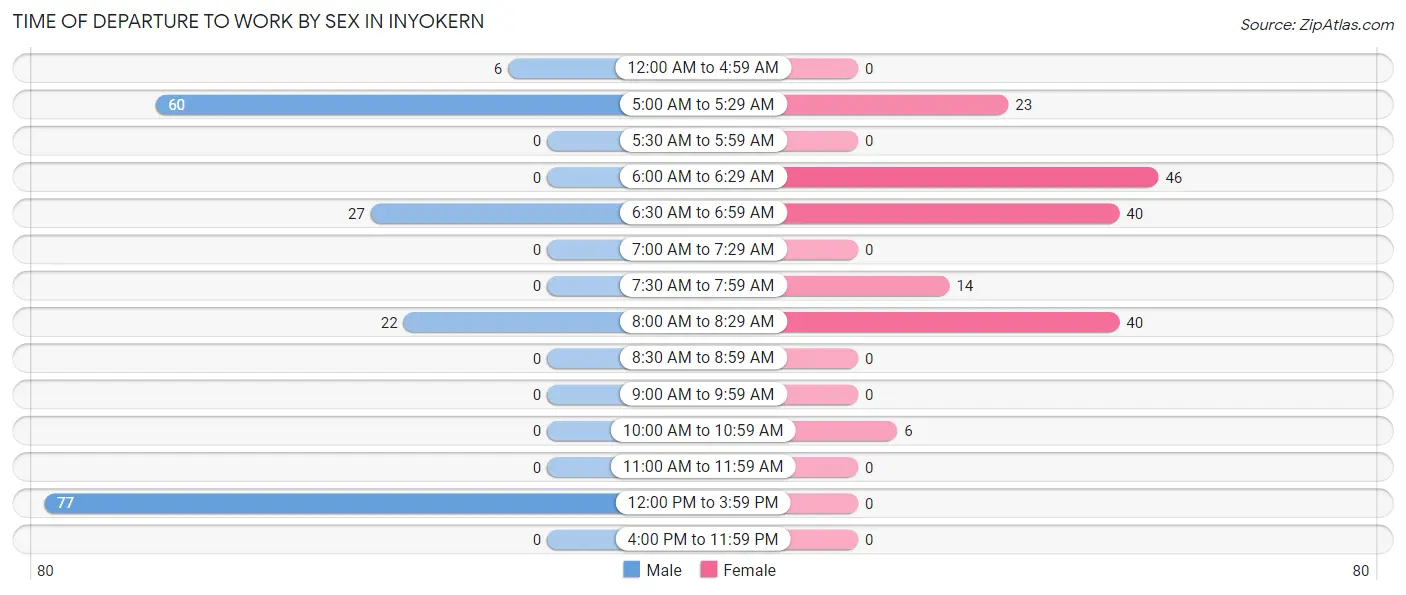
| Time of Departure | Male | Female |
| 12:00 AM to 4:59 AM | 6 (3.1%) | 0 (0.0%) |
| 5:00 AM to 5:29 AM | 60 (31.2%) | 23 (13.6%) |
| 5:30 AM to 5:59 AM | 0 (0.0%) | 0 (0.0%) |
| 6:00 AM to 6:29 AM | 0 (0.0%) | 46 (27.2%) |
| 6:30 AM to 6:59 AM | 27 (14.1%) | 40 (23.7%) |
| 7:00 AM to 7:29 AM | 0 (0.0%) | 0 (0.0%) |
| 7:30 AM to 7:59 AM | 0 (0.0%) | 14 (8.3%) |
| 8:00 AM to 8:29 AM | 22 (11.5%) | 40 (23.7%) |
| 8:30 AM to 8:59 AM | 0 (0.0%) | 0 (0.0%) |
| 9:00 AM to 9:59 AM | 0 (0.0%) | 0 (0.0%) |
| 10:00 AM to 10:59 AM | 0 (0.0%) | 6 (3.5%) |
| 11:00 AM to 11:59 AM | 0 (0.0%) | 0 (0.0%) |
| 12:00 PM to 3:59 PM | 77 (40.1%) | 0 (0.0%) |
| 4:00 PM to 11:59 PM | 0 (0.0%) | 0 (0.0%) |
| Total | 192 (100.0%) | 169 (100.0%) |
Housing Occupancy in Inyokern
Occupancy by Ownership in Inyokern
Of the total 404 dwellings in Inyokern, owner-occupied units account for 286 (70.8%), while renter-occupied units make up 118 (29.2%).
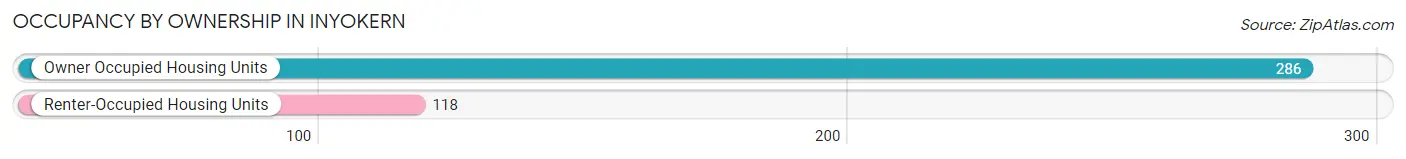
| Occupancy | # Housing Units | % Housing Units |
| Owner Occupied Housing Units | 286 | 70.8% |
| Renter-Occupied Housing Units | 118 | 29.2% |
| Total Occupied Housing Units | 404 | 100.0% |
Occupancy by Household Size in Inyokern
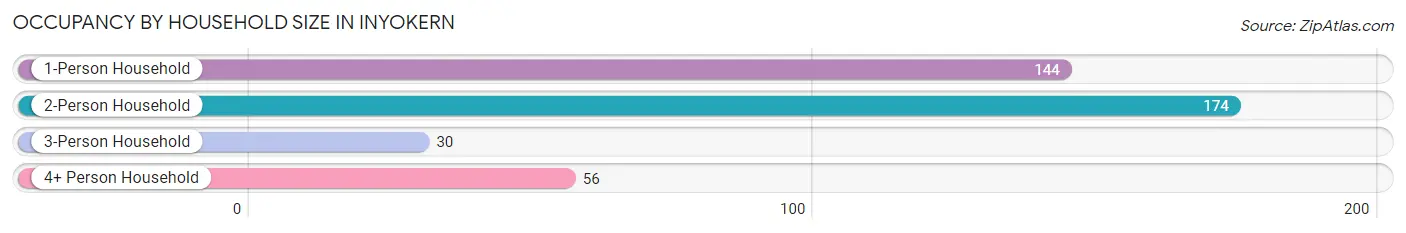
| Household Size | # Housing Units | % Housing Units |
| 1-Person Household | 144 | 35.6% |
| 2-Person Household | 174 | 43.1% |
| 3-Person Household | 30 | 7.4% |
| 4+ Person Household | 56 | 13.9% |
| Total Housing Units | 404 | 100.0% |
Occupancy by Ownership by Household Size in Inyokern
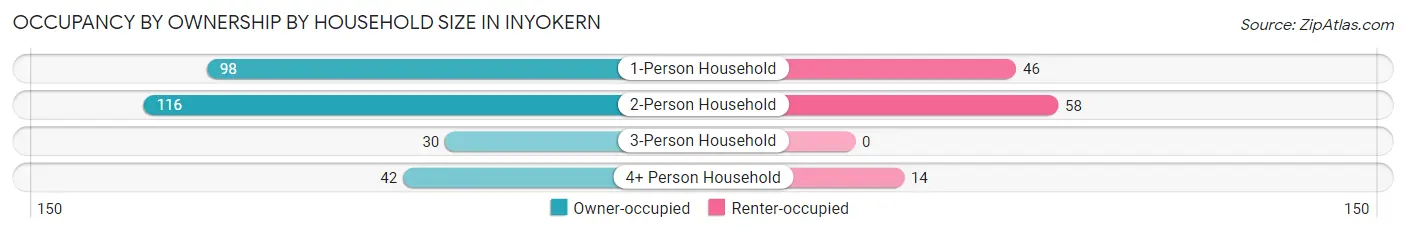
| Household Size | Owner-occupied | Renter-occupied |
| 1-Person Household | 98 (68.1%) | 46 (31.9%) |
| 2-Person Household | 116 (66.7%) | 58 (33.3%) |
| 3-Person Household | 30 (100.0%) | 0 (0.0%) |
| 4+ Person Household | 42 (75.0%) | 14 (25.0%) |
| Total Housing Units | 286 (70.8%) | 118 (29.2%) |
Occupancy by Educational Attainment in Inyokern
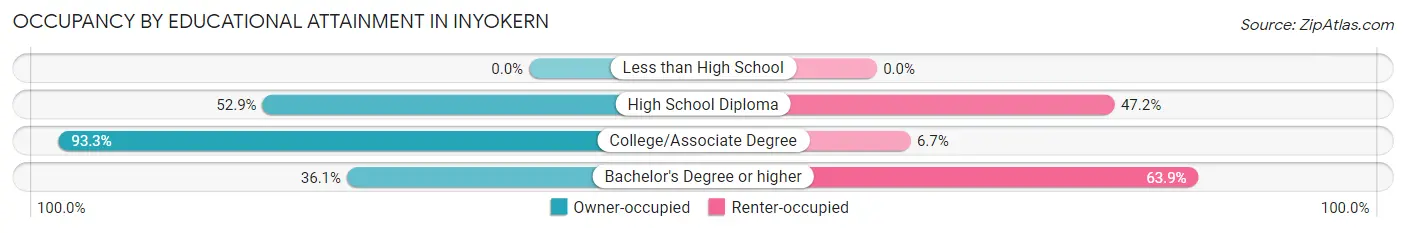
| Household Size | Owner-occupied | Renter-occupied |
| Less than High School | 0 (0.0%) | 0 (0.0%) |
| High School Diploma | 65 (52.8%) | 58 (47.1%) |
| College/Associate Degree | 195 (93.3%) | 14 (6.7%) |
| Bachelor's Degree or higher | 26 (36.1%) | 46 (63.9%) |
Occupancy by Age of Householder in Inyokern
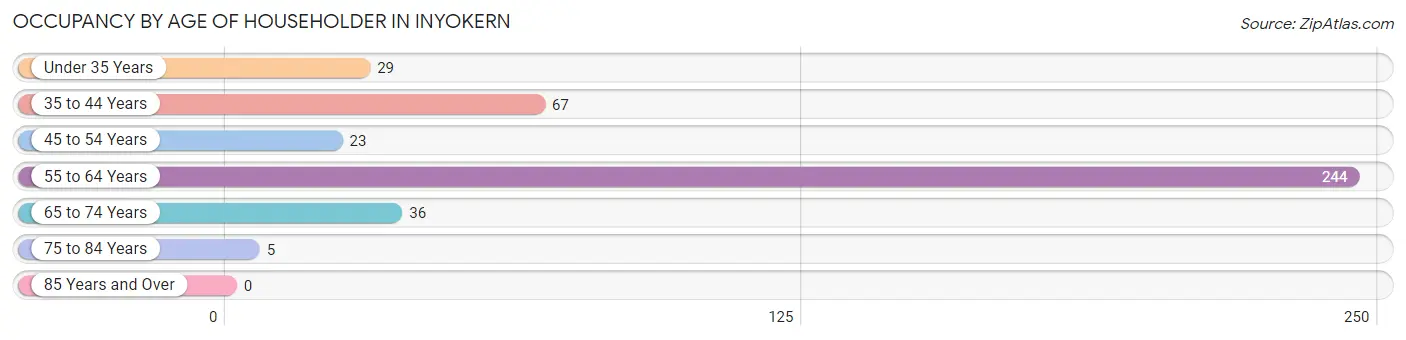
| Age Bracket | # Households | % Households |
| Under 35 Years | 29 | 7.2% |
| 35 to 44 Years | 67 | 16.6% |
| 45 to 54 Years | 23 | 5.7% |
| 55 to 64 Years | 244 | 60.4% |
| 65 to 74 Years | 36 | 8.9% |
| 75 to 84 Years | 5 | 1.2% |
| 85 Years and Over | 0 | 0.0% |
| Total | 404 | 100.0% |
Housing Finances in Inyokern
Median Income by Occupancy in Inyokern
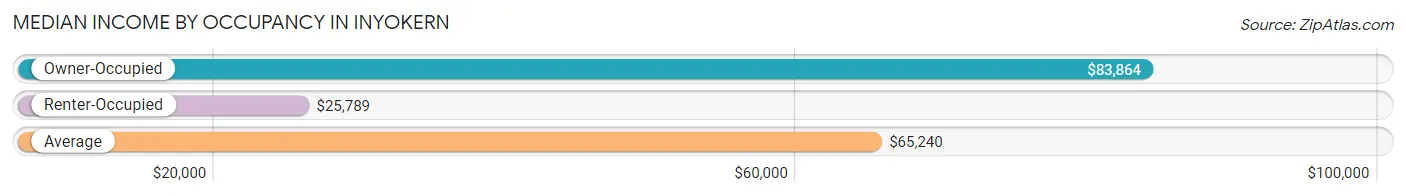
| Occupancy Type | # Households | Median Income |
| Owner-Occupied | 286 (70.8%) | $83,864 |
| Renter-Occupied | 118 (29.2%) | $25,789 |
| Average | 404 (100.0%) | $65,240 |
Occupancy by Householder Income Bracket in Inyokern
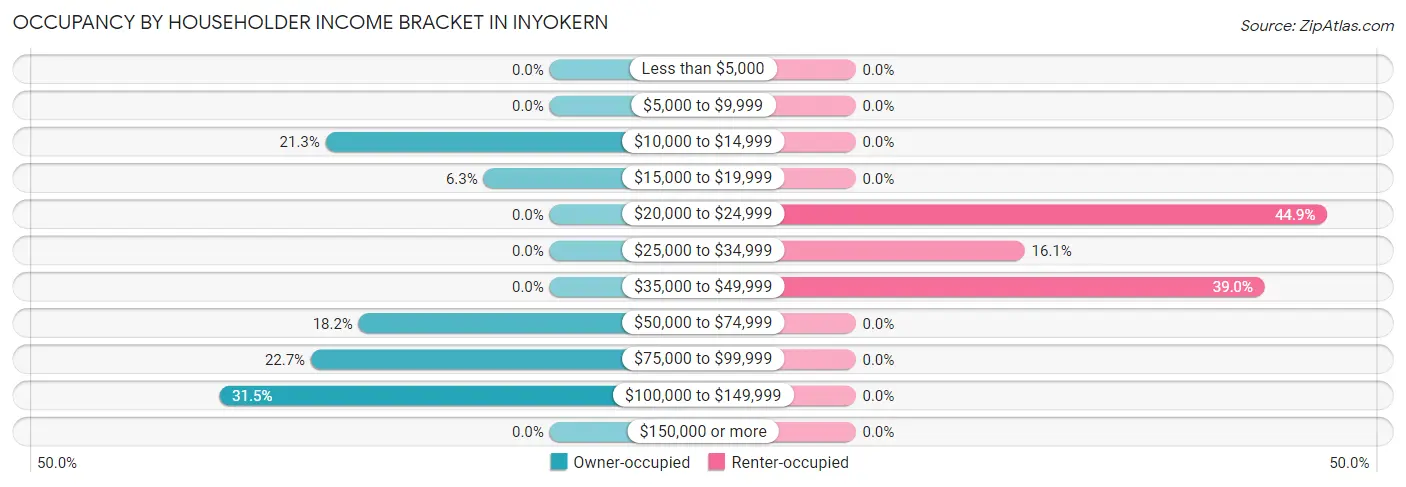
| Income Bracket | Owner-occupied | Renter-occupied |
| Less than $5,000 | 0 (0.0%) | 0 (0.0%) |
| $5,000 to $9,999 | 0 (0.0%) | 0 (0.0%) |
| $10,000 to $14,999 | 61 (21.3%) | 0 (0.0%) |
| $15,000 to $19,999 | 18 (6.3%) | 0 (0.0%) |
| $20,000 to $24,999 | 0 (0.0%) | 53 (44.9%) |
| $25,000 to $34,999 | 0 (0.0%) | 19 (16.1%) |
| $35,000 to $49,999 | 0 (0.0%) | 46 (39.0%) |
| $50,000 to $74,999 | 52 (18.2%) | 0 (0.0%) |
| $75,000 to $99,999 | 65 (22.7%) | 0 (0.0%) |
| $100,000 to $149,999 | 90 (31.5%) | 0 (0.0%) |
| $150,000 or more | 0 (0.0%) | 0 (0.0%) |
| Total | 286 (100.0%) | 118 (100.0%) |
Monthly Housing Cost Tiers in Inyokern
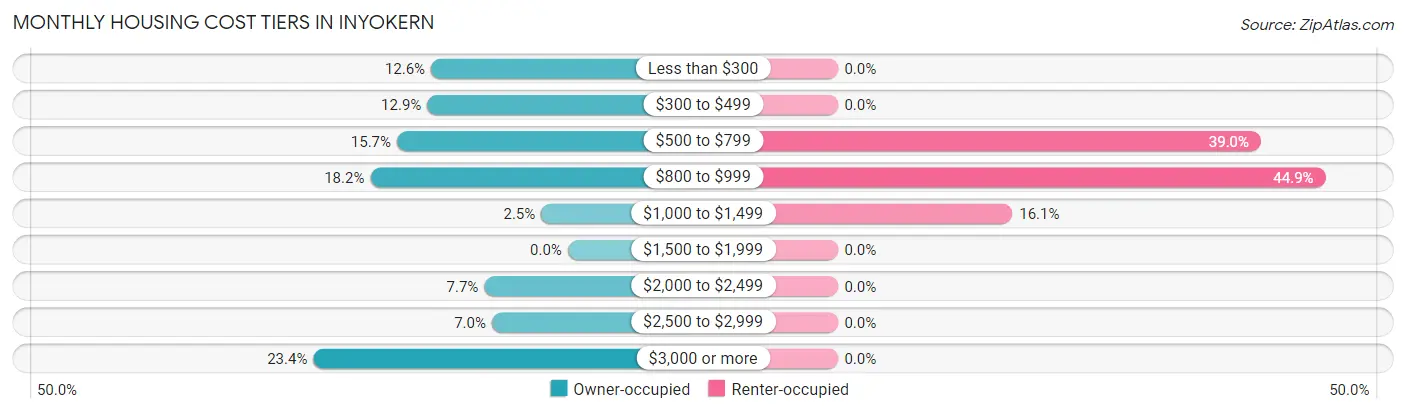
| Monthly Cost | Owner-occupied | Renter-occupied |
| Less than $300 | 36 (12.6%) | 0 (0.0%) |
| $300 to $499 | 37 (12.9%) | 0 (0.0%) |
| $500 to $799 | 45 (15.7%) | 46 (39.0%) |
| $800 to $999 | 52 (18.2%) | 53 (44.9%) |
| $1,000 to $1,499 | 7 (2.5%) | 19 (16.1%) |
| $1,500 to $1,999 | 0 (0.0%) | 0 (0.0%) |
| $2,000 to $2,499 | 22 (7.7%) | 0 (0.0%) |
| $2,500 to $2,999 | 20 (7.0%) | 0 (0.0%) |
| $3,000 or more | 67 (23.4%) | 0 (0.0%) |
| Total | 286 (100.0%) | 118 (100.0%) |
Physical Housing Characteristics in Inyokern
Housing Structures in Inyokern
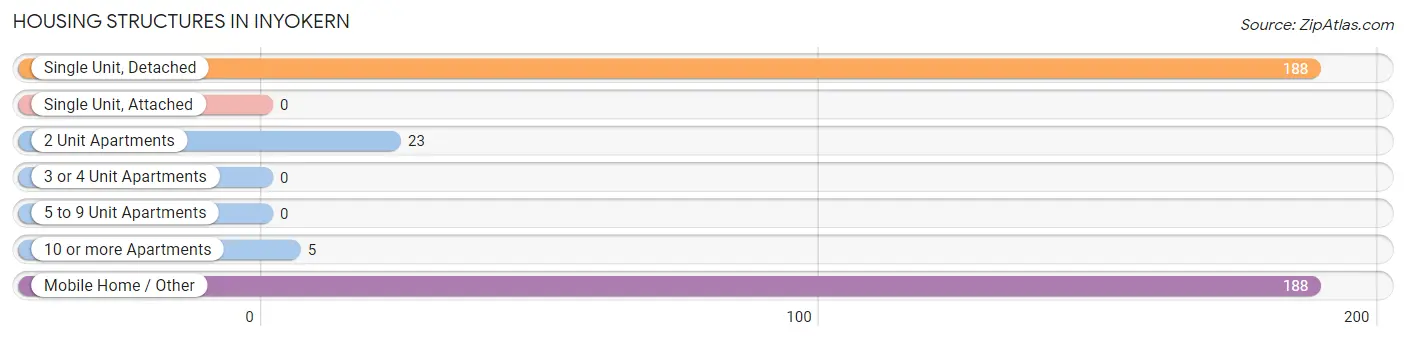
| Structure Type | # Housing Units | % Housing Units |
| Single Unit, Detached | 188 | 46.5% |
| Single Unit, Attached | 0 | 0.0% |
| 2 Unit Apartments | 23 | 5.7% |
| 3 or 4 Unit Apartments | 0 | 0.0% |
| 5 to 9 Unit Apartments | 0 | 0.0% |
| 10 or more Apartments | 5 | 1.2% |
| Mobile Home / Other | 188 | 46.5% |
| Total | 404 | 100.0% |
Housing Structures by Occupancy in Inyokern
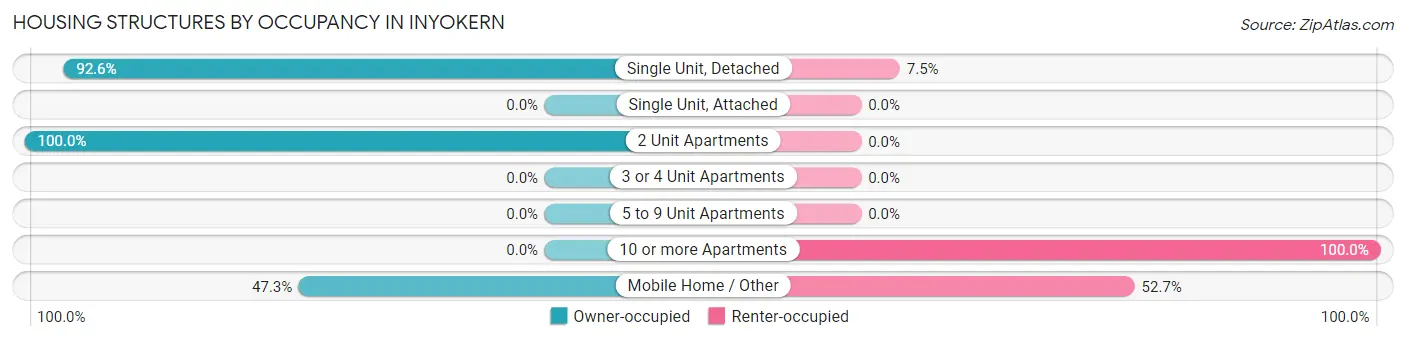
| Structure Type | Owner-occupied | Renter-occupied |
| Single Unit, Detached | 174 (92.5%) | 14 (7.4%) |
| Single Unit, Attached | 0 (0.0%) | 0 (0.0%) |
| 2 Unit Apartments | 23 (100.0%) | 0 (0.0%) |
| 3 or 4 Unit Apartments | 0 (0.0%) | 0 (0.0%) |
| 5 to 9 Unit Apartments | 0 (0.0%) | 0 (0.0%) |
| 10 or more Apartments | 0 (0.0%) | 5 (100.0%) |
| Mobile Home / Other | 89 (47.3%) | 99 (52.7%) |
| Total | 286 (70.8%) | 118 (29.2%) |
Housing Structures by Number of Rooms in Inyokern
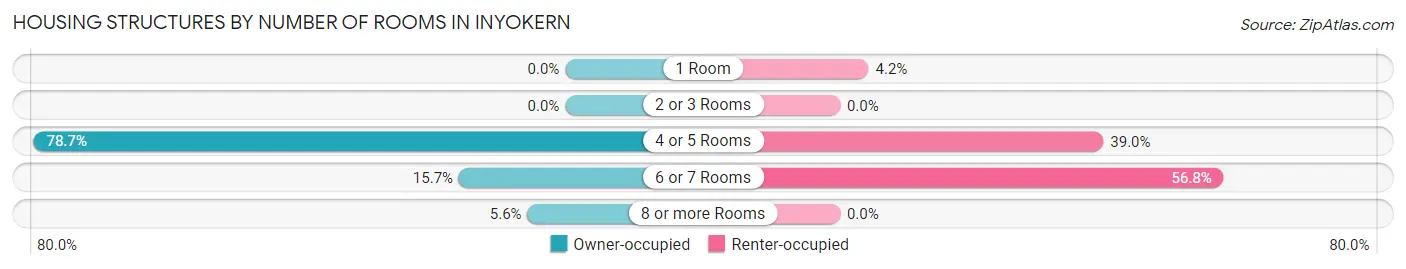
| Number of Rooms | Owner-occupied | Renter-occupied |
| 1 Room | 0 (0.0%) | 5 (4.2%) |
| 2 or 3 Rooms | 0 (0.0%) | 0 (0.0%) |
| 4 or 5 Rooms | 225 (78.7%) | 46 (39.0%) |
| 6 or 7 Rooms | 45 (15.7%) | 67 (56.8%) |
| 8 or more Rooms | 16 (5.6%) | 0 (0.0%) |
| Total | 286 (100.0%) | 118 (100.0%) |
Housing Structure by Heating Type in Inyokern
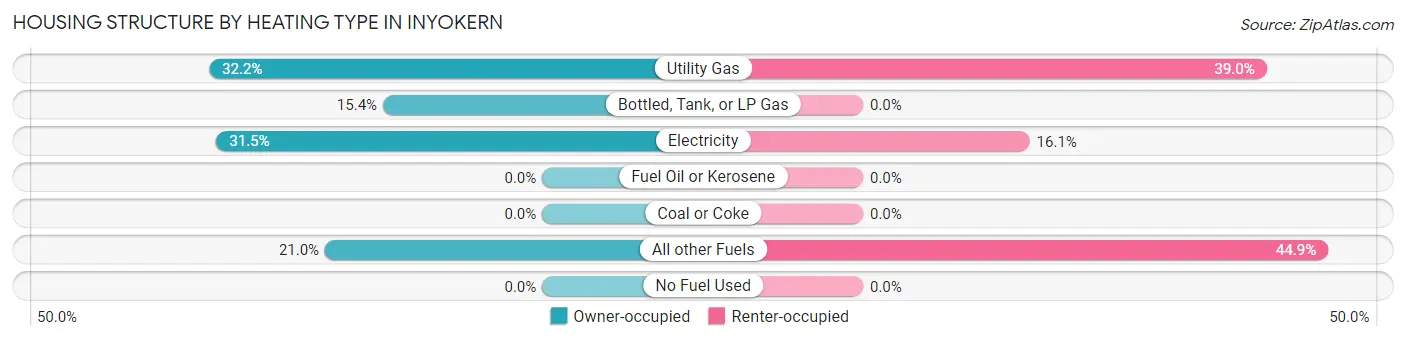
| Heating Type | Owner-occupied | Renter-occupied |
| Utility Gas | 92 (32.2%) | 46 (39.0%) |
| Bottled, Tank, or LP Gas | 44 (15.4%) | 0 (0.0%) |
| Electricity | 90 (31.5%) | 19 (16.1%) |
| Fuel Oil or Kerosene | 0 (0.0%) | 0 (0.0%) |
| Coal or Coke | 0 (0.0%) | 0 (0.0%) |
| All other Fuels | 60 (21.0%) | 53 (44.9%) |
| No Fuel Used | 0 (0.0%) | 0 (0.0%) |
| Total | 286 (100.0%) | 118 (100.0%) |
Household Vehicle Usage in Inyokern
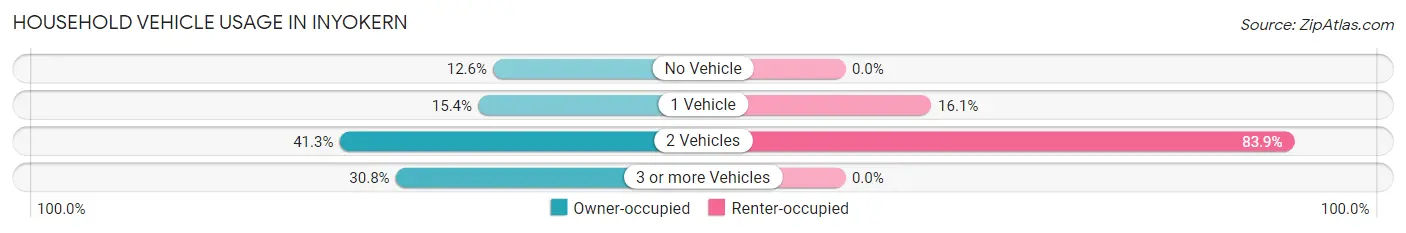
| Vehicles per Household | Owner-occupied | Renter-occupied |
| No Vehicle | 36 (12.6%) | 0 (0.0%) |
| 1 Vehicle | 44 (15.4%) | 19 (16.1%) |
| 2 Vehicles | 118 (41.3%) | 99 (83.9%) |
| 3 or more Vehicles | 88 (30.8%) | 0 (0.0%) |
| Total | 286 (100.0%) | 118 (100.0%) |
Real Estate & Mortgages in Inyokern
Real Estate and Mortgage Overview in Inyokern
| Characteristic | Without Mortgage | With Mortgage |
| Housing Units | 118 | 168 |
| Median Property Value | $177,000 | $0 |
| Median Household Income | - | - |
| Monthly Housing Costs | $462 | $67 |
| Real Estate Taxes | $949 | $0 |
Property Value by Mortgage Status in Inyokern
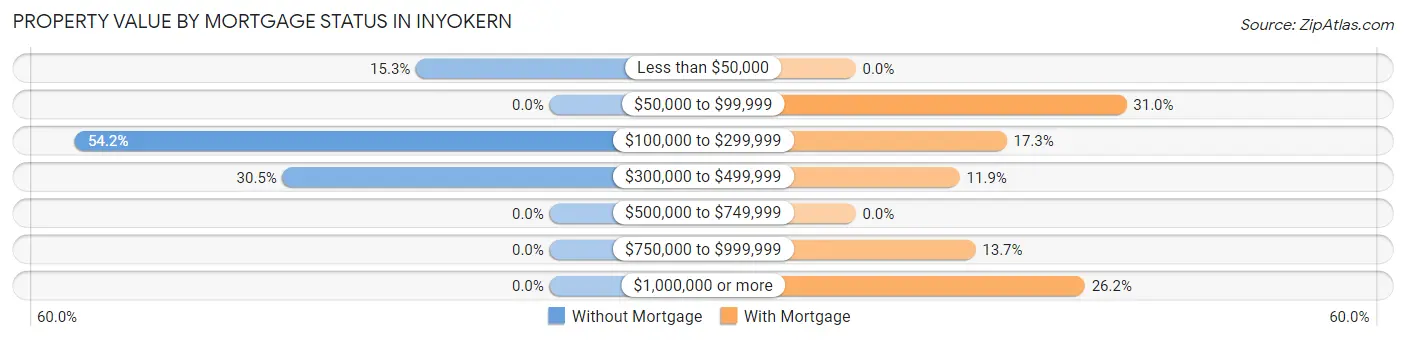
| Property Value | Without Mortgage | With Mortgage |
| Less than $50,000 | 18 (15.2%) | 0 (0.0%) |
| $50,000 to $99,999 | 0 (0.0%) | 52 (30.9%) |
| $100,000 to $299,999 | 64 (54.2%) | 29 (17.3%) |
| $300,000 to $499,999 | 36 (30.5%) | 20 (11.9%) |
| $500,000 to $749,999 | 0 (0.0%) | 0 (0.0%) |
| $750,000 to $999,999 | 0 (0.0%) | 23 (13.7%) |
| $1,000,000 or more | 0 (0.0%) | 44 (26.2%) |
| Total | 118 (100.0%) | 168 (100.0%) |
Household Income by Mortgage Status in Inyokern
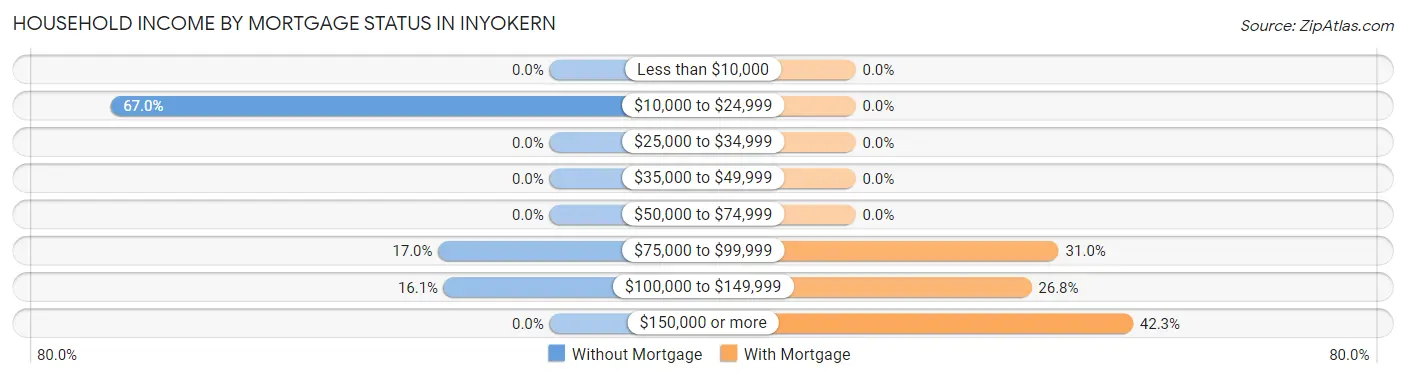
| Household Income | Without Mortgage | With Mortgage |
| Less than $10,000 | 0 (0.0%) | 0 (0.0%) |
| $10,000 to $24,999 | 79 (66.9%) | 0 (0.0%) |
| $25,000 to $34,999 | 0 (0.0%) | 0 (0.0%) |
| $35,000 to $49,999 | 0 (0.0%) | 0 (0.0%) |
| $50,000 to $74,999 | 0 (0.0%) | 0 (0.0%) |
| $75,000 to $99,999 | 20 (17.0%) | 52 (30.9%) |
| $100,000 to $149,999 | 19 (16.1%) | 45 (26.8%) |
| $150,000 or more | 0 (0.0%) | 71 (42.3%) |
| Total | 118 (100.0%) | 168 (100.0%) |
Property Value to Household Income Ratio in Inyokern
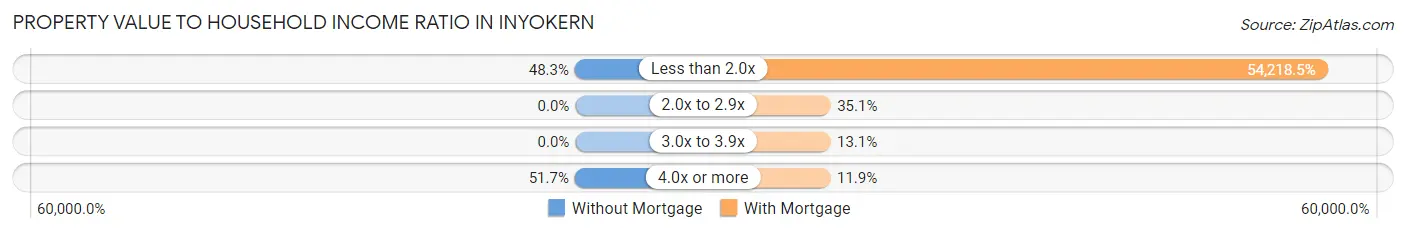
| Value-to-Income Ratio | Without Mortgage | With Mortgage |
| Less than 2.0x | 57 (48.3%) | 91,087 (54,218.4%) |
| 2.0x to 2.9x | 0 (0.0%) | 59 (35.1%) |
| 3.0x to 3.9x | 0 (0.0%) | 22 (13.1%) |
| 4.0x or more | 61 (51.7%) | 20 (11.9%) |
| Total | 118 (100.0%) | 168 (100.0%) |
Real Estate Taxes by Mortgage Status in Inyokern
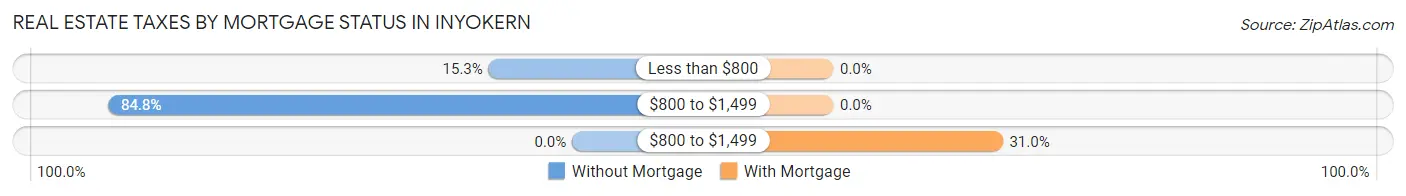
| Property Taxes | Without Mortgage | With Mortgage |
| Less than $800 | 18 (15.2%) | 0 (0.0%) |
| $800 to $1,499 | 100 (84.8%) | 0 (0.0%) |
| $800 to $1,499 | 0 (0.0%) | 52 (30.9%) |
| Total | 118 (100.0%) | 168 (100.0%) |
Health & Disability in Inyokern
Health Insurance Coverage by Age in Inyokern
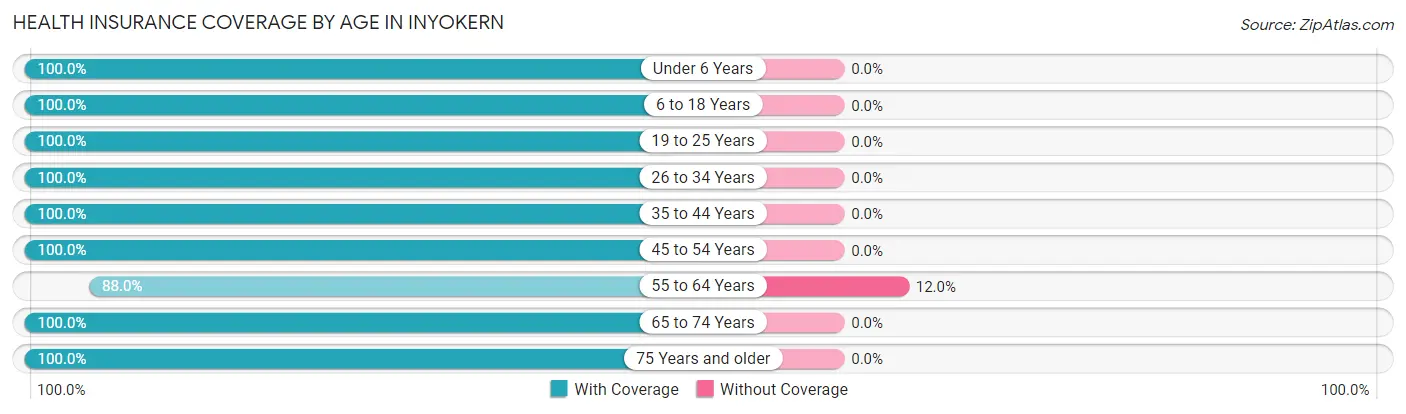
| Age Bracket | With Coverage | Without Coverage |
| Under 6 Years | 69 (100.0%) | 0 (0.0%) |
| 6 to 18 Years | 185 (100.0%) | 0 (0.0%) |
| 19 to 25 Years | 15 (100.0%) | 0 (0.0%) |
| 26 to 34 Years | 29 (100.0%) | 0 (0.0%) |
| 35 to 44 Years | 83 (100.0%) | 0 (0.0%) |
| 45 to 54 Years | 70 (100.0%) | 0 (0.0%) |
| 55 to 64 Years | 373 (88.0%) | 51 (12.0%) |
| 65 to 74 Years | 36 (100.0%) | 0 (0.0%) |
| 75 Years and older | 5 (100.0%) | 0 (0.0%) |
| Total | 865 (94.4%) | 51 (5.6%) |
Health Insurance Coverage by Citizenship Status in Inyokern
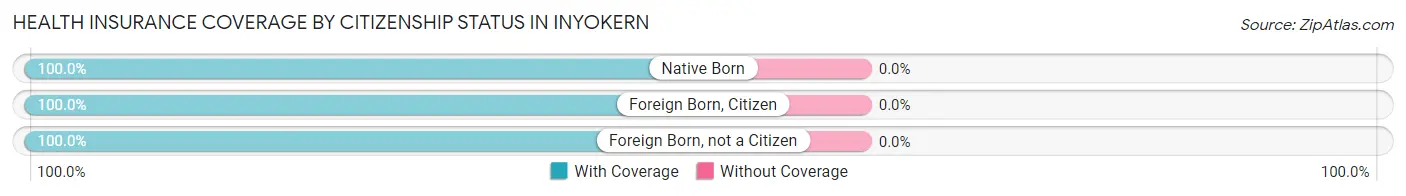
| Citizenship Status | With Coverage | Without Coverage |
| Native Born | 69 (100.0%) | 0 (0.0%) |
| Foreign Born, Citizen | 185 (100.0%) | 0 (0.0%) |
| Foreign Born, not a Citizen | 15 (100.0%) | 0 (0.0%) |
Health Insurance Coverage by Household Income in Inyokern
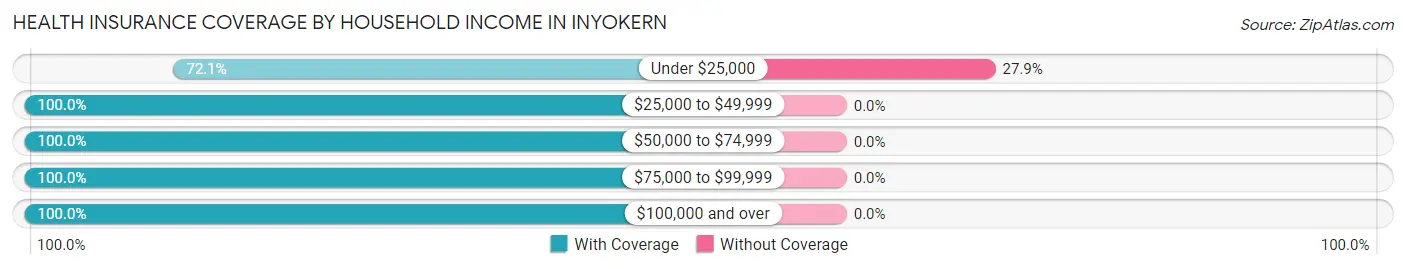
| Household Income | With Coverage | Without Coverage |
| Under $25,000 | 132 (72.1%) | 51 (27.9%) |
| $25,000 to $49,999 | 119 (100.0%) | 0 (0.0%) |
| $50,000 to $74,999 | 92 (100.0%) | 0 (0.0%) |
| $75,000 to $99,999 | 359 (100.0%) | 0 (0.0%) |
| $100,000 and over | 163 (100.0%) | 0 (0.0%) |
Public vs Private Health Insurance Coverage by Age in Inyokern
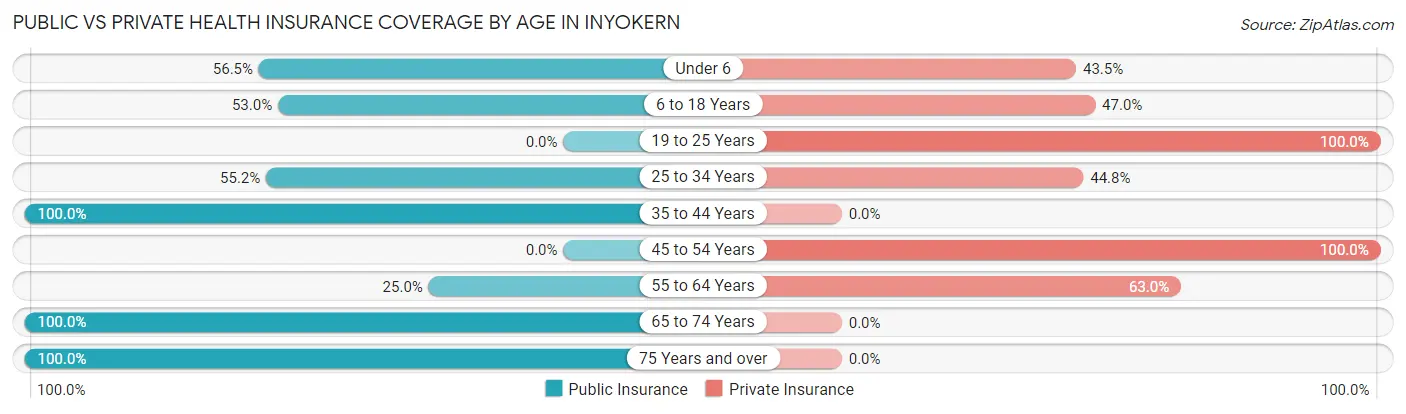
| Age Bracket | Public Insurance | Private Insurance |
| Under 6 | 39 (56.5%) | 30 (43.5%) |
| 6 to 18 Years | 98 (53.0%) | 87 (47.0%) |
| 19 to 25 Years | 0 (0.0%) | 15 (100.0%) |
| 25 to 34 Years | 16 (55.2%) | 13 (44.8%) |
| 35 to 44 Years | 83 (100.0%) | 0 (0.0%) |
| 45 to 54 Years | 0 (0.0%) | 70 (100.0%) |
| 55 to 64 Years | 106 (25.0%) | 267 (63.0%) |
| 65 to 74 Years | 36 (100.0%) | 0 (0.0%) |
| 75 Years and over | 5 (100.0%) | 0 (0.0%) |
| Total | 383 (41.8%) | 482 (52.6%) |
Disability Status by Sex by Age in Inyokern
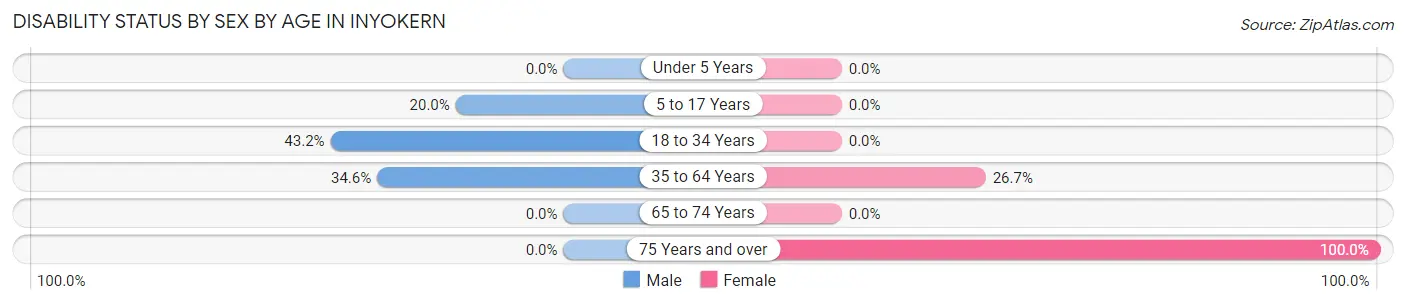
| Age Bracket | Male | Female |
| Under 5 Years | 0 (0.0%) | 0 (0.0%) |
| 5 to 17 Years | 17 (20.0%) | 0 (0.0%) |
| 18 to 34 Years | 16 (43.2%) | 0 (0.0%) |
| 35 to 64 Years | 74 (34.6%) | 97 (26.7%) |
| 65 to 74 Years | 0 (0.0%) | 0 (0.0%) |
| 75 Years and over | 0 (0.0%) | 5 (100.0%) |
Disability Class by Sex by Age in Inyokern
Disability Class: Hearing Difficulty
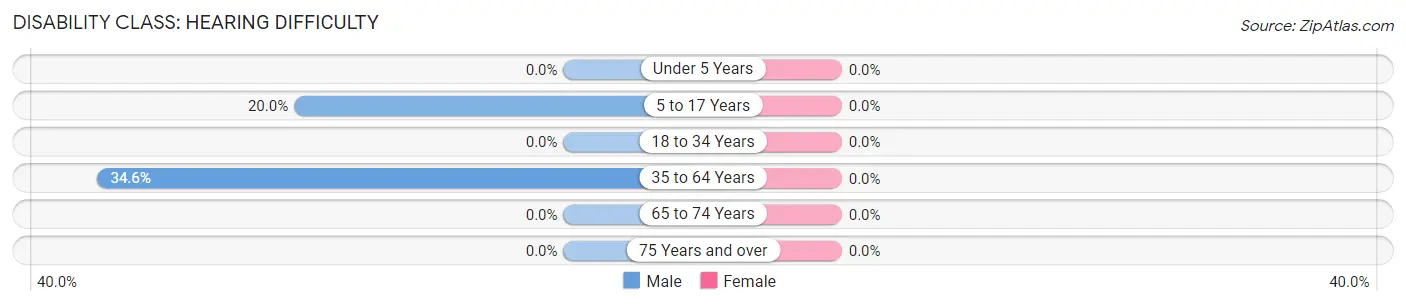
| Age Bracket | Male | Female |
| Under 5 Years | 0 (0.0%) | 0 (0.0%) |
| 5 to 17 Years | 17 (20.0%) | 0 (0.0%) |
| 18 to 34 Years | 0 (0.0%) | 0 (0.0%) |
| 35 to 64 Years | 74 (34.6%) | 0 (0.0%) |
| 65 to 74 Years | 0 (0.0%) | 0 (0.0%) |
| 75 Years and over | 0 (0.0%) | 0 (0.0%) |
Disability Class: Vision Difficulty
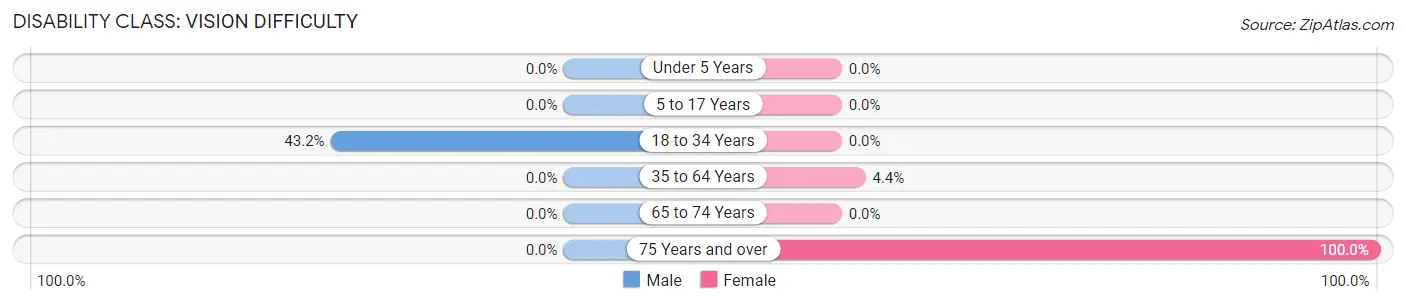
| Age Bracket | Male | Female |
| Under 5 Years | 0 (0.0%) | 0 (0.0%) |
| 5 to 17 Years | 0 (0.0%) | 0 (0.0%) |
| 18 to 34 Years | 16 (43.2%) | 0 (0.0%) |
| 35 to 64 Years | 0 (0.0%) | 16 (4.4%) |
| 65 to 74 Years | 0 (0.0%) | 0 (0.0%) |
| 75 Years and over | 0 (0.0%) | 5 (100.0%) |
Disability Class: Cognitive Difficulty
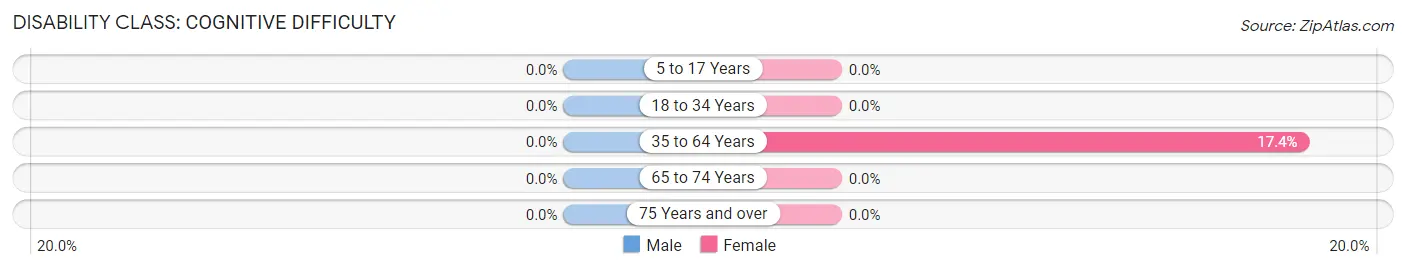
| Age Bracket | Male | Female |
| 5 to 17 Years | 0 (0.0%) | 0 (0.0%) |
| 18 to 34 Years | 0 (0.0%) | 0 (0.0%) |
| 35 to 64 Years | 0 (0.0%) | 63 (17.4%) |
| 65 to 74 Years | 0 (0.0%) | 0 (0.0%) |
| 75 Years and over | 0 (0.0%) | 0 (0.0%) |
Disability Class: Ambulatory Difficulty
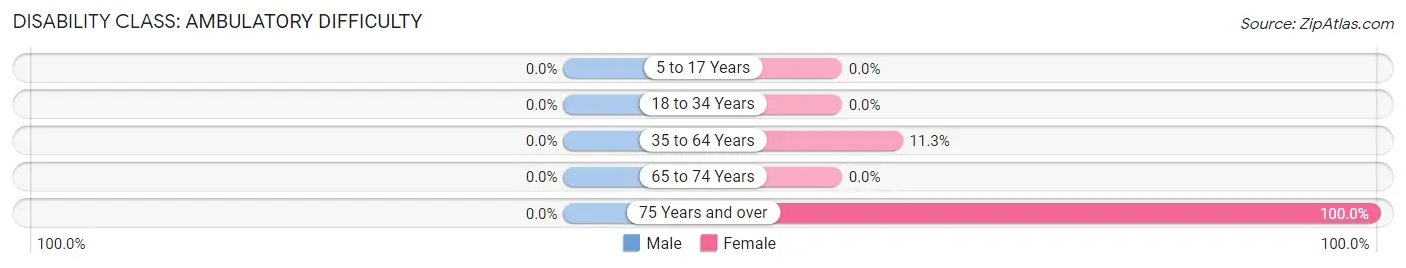
| Age Bracket | Male | Female |
| 5 to 17 Years | 0 (0.0%) | 0 (0.0%) |
| 18 to 34 Years | 0 (0.0%) | 0 (0.0%) |
| 35 to 64 Years | 0 (0.0%) | 41 (11.3%) |
| 65 to 74 Years | 0 (0.0%) | 0 (0.0%) |
| 75 Years and over | 0 (0.0%) | 5 (100.0%) |
Disability Class: Self-Care Difficulty
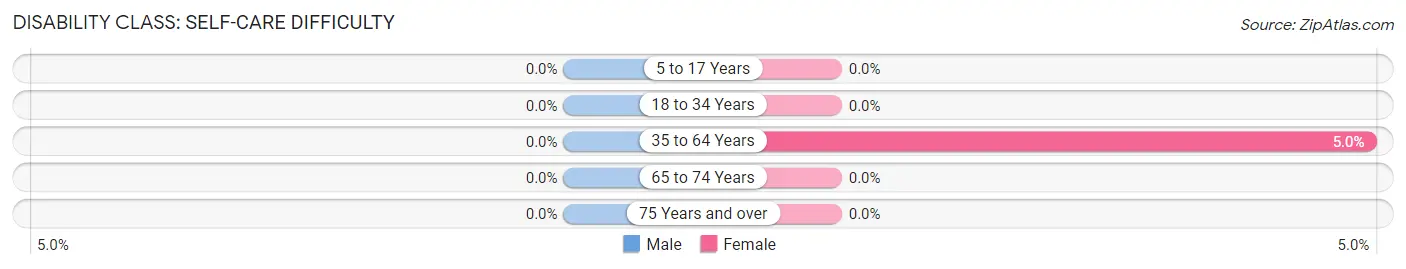
| Age Bracket | Male | Female |
| 5 to 17 Years | 0 (0.0%) | 0 (0.0%) |
| 18 to 34 Years | 0 (0.0%) | 0 (0.0%) |
| 35 to 64 Years | 0 (0.0%) | 18 (5.0%) |
| 65 to 74 Years | 0 (0.0%) | 0 (0.0%) |
| 75 Years and over | 0 (0.0%) | 0 (0.0%) |
Technology Access in Inyokern
Computing Device Access in Inyokern
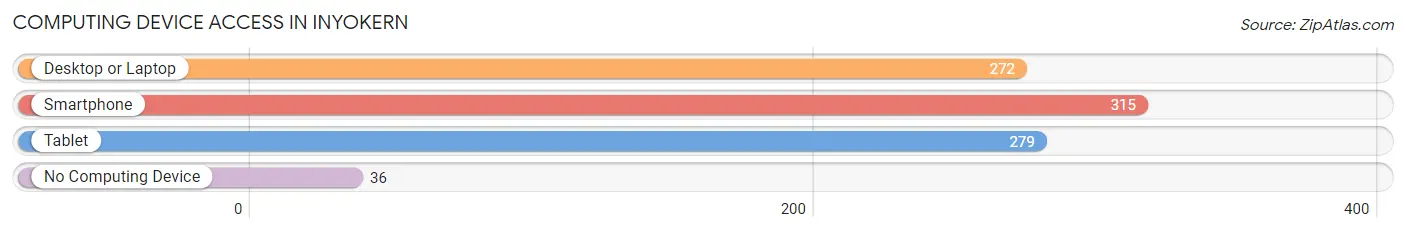
| Device Type | # Households | % Households |
| Desktop or Laptop | 272 | 67.3% |
| Smartphone | 315 | 78.0% |
| Tablet | 279 | 69.1% |
| No Computing Device | 36 | 8.9% |
| Total | 404 | 100.0% |
Internet Access in Inyokern
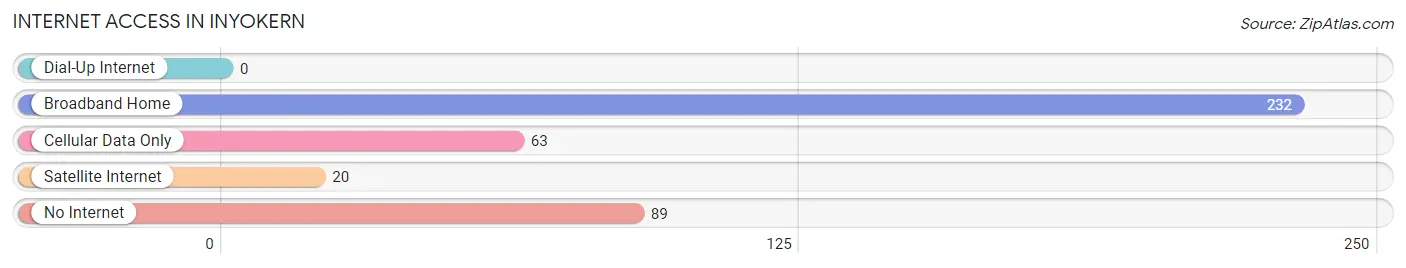
| Internet Type | # Households | % Households |
| Dial-Up Internet | 0 | 0.0% |
| Broadband Home | 232 | 57.4% |
| Cellular Data Only | 63 | 15.6% |
| Satellite Internet | 20 | 5.0% |
| No Internet | 89 | 22.0% |
| Total | 404 | 100.0% |
Inyokern Summary
Inyokern is a small unincorporated community located in Kern County, California, United States. It is situated in the Indian Wells Valley, approximately 11 miles (18 km) east of Ridgecrest, at an elevation of 2,434 feet (742 m). The population was 1,049 at the 2010 census.
History
Inyokern was founded in 1910 by the Southern Pacific Railroad as a station stop on the Tonopah and Tidewater Railroad. The name is derived from the Paiute word for “red earth”. The town was originally a small farming community, but it grew rapidly after World War II when the nearby Naval Air Weapons Station China Lake was established. Inyokern is now a bedroom community for the base, and is home to many retired military personnel.
Geography
Inyokern is located in the Indian Wells Valley, which is part of the Mojave Desert. The valley is surrounded by the Sierra Nevada and Coso Mountains to the west, and the Argus Range to the east. The climate is arid, with hot summers and mild winters. The average annual precipitation is 4.5 inches (114 mm).
Economy
Inyokern’s economy is largely based on the nearby Naval Air Weapons Station China Lake. The base is the largest employer in the area, providing jobs for many of the town’s residents. Other major employers include the Inyokern Airport, which serves as a hub for private and military aircraft, and the Inyokern Industrial Park, which is home to several businesses.
Demographics
As of the 2010 census, there were 1,049 people, 437 households, and 287 families residing in Inyokern. The population density was 545.3 people per square mile (210.9/km2). The racial makeup of the town was 81.2% White, 8.2% African American, 0.7% Native American, 2.2% Asian, 0.2% Pacific Islander, 4.2% from other races, and 3.5% from two or more races. Hispanic or Latino of any race were 11.2% of the population.
The median income for a household in Inyokern was $41,250, and the median income for a family was $50,000. Males had a median income of $41,250 versus $30,000 for females. The per capita income for the town was $20,945. About 8.2% of families and 10.2% of the population were below the poverty line, including 13.2% of those under age 18 and none of those age 65 or over.
Inyokern is served by the Inyokern Elementary School District, which operates two elementary schools and one middle school. The town is also home to the Inyokern Airport, which serves as a hub for private and military aircraft. Inyokern is also home to the Inyokern Industrial Park, which is home to several businesses.
Common Questions
What is Per Capita Income in Inyokern?
Per Capita income in Inyokern is $26,061.
What is the Median Family Income in Inyokern?
Median Family Income in Inyokern is $66,683.
What is the Median Household income in Inyokern?
Median Household Income in Inyokern is $65,240.
What is Income or Wage Gap in Inyokern?
Income or Wage Gap in Inyokern is 74.2%.
Women in Inyokern earn 25.8 cents for every dollar earned by a man.
What is Inequality or Gini Index in Inyokern?
Inequality or Gini Index in Inyokern is 0.38.
What is the Total Population of Inyokern?
Total Population of Inyokern is 922.
What is the Total Male Population of Inyokern?
Total Male Population of Inyokern is 367.
What is the Total Female Population of Inyokern?
Total Female Population of Inyokern is 555.
What is the Ratio of Males per 100 Females in Inyokern?
There are 66.13 Males per 100 Females in Inyokern.
What is the Ratio of Females per 100 Males in Inyokern?
There are 151.23 Females per 100 Males in Inyokern.
What is the Median Population Age in Inyokern?
Median Population Age in Inyokern is 55.2 Years.
What is the Average Family Size in Inyokern
Average Family Size in Inyokern is 2.8 People.
What is the Average Household Size in Inyokern
Average Household Size in Inyokern is 2.3 People.
How Large is the Labor Force in Inyokern?
There are 473 People in the Labor Forcein in Inyokern.
What is the Percentage of People in the Labor Force in Inyokern?
61.1% of People are in the Labor Force in Inyokern.
What is the Unemployment Rate in Inyokern?
Unemployment Rate in Inyokern is 22.3%.