Parkwood, CA Map & Demographics
Parkwood Map
Parkwood Overview
$17,149
PER CAPITA INCOME
$55,930
AVG FAMILY INCOME
$55,087
AVG HOUSEHOLD INCOME
37.3%
WAGE / INCOME GAP [ % ]
62.7¢/ $1
WAGE / INCOME GAP [ $ ]
0.45
INEQUALITY / GINI INDEX
2,073
TOTAL POPULATION
807
MALE POPULATION
1,266
FEMALE POPULATION
63.74
MALES / 100 FEMALES
156.88
FEMALES / 100 MALES
28.8
MEDIAN AGE
4.3
AVG FAMILY SIZE
4.1
AVG HOUSEHOLD SIZE
875
LABOR FORCE [ PEOPLE ]
61.3%
PERCENT IN LABOR FORCE
24.1%
UNEMPLOYMENT RATE
Income in Parkwood
Income Overview in Parkwood
Per Capita Income in Parkwood is $17,149, while median incomes of families and households are $55,930 and $55,087 respectively.
| Characteristic | Number | Measure |
| Per Capita Income | 2,073 | $17,149 |
| Median Family Income | 452 | $55,930 |
| Mean Family Income | 452 | $78,324 |
| Median Household Income | 501 | $55,087 |
| Mean Household Income | 501 | $75,156 |
| Income Deficit | 452 | $0 |
| Wage / Income Gap (%) | 2,073 | 37.30% |
| Wage / Income Gap ($) | 2,073 | 62.70¢ per $1 |
| Gini / Inequality Index | 2,073 | 0.45 |
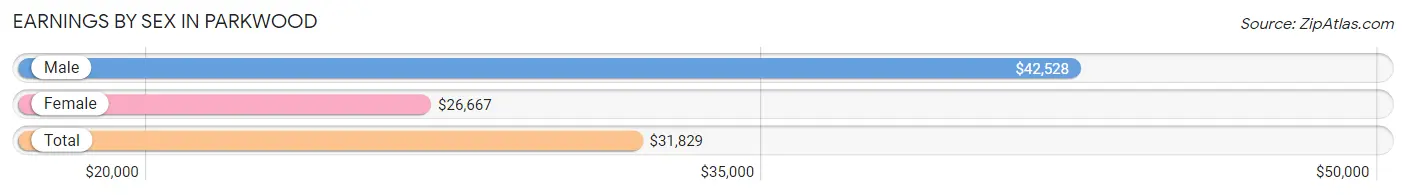
Earnings by Sex in Parkwood
Average Earnings in Parkwood are $31,829, $42,528 for men and $26,667 for women, a difference of 37.3%.
| Sex | Number | Average Earnings |
| Male | 425 (55.7%) | $42,528 |
| Female | 338 (44.3%) | $26,667 |
| Total | 763 (100.0%) | $31,829 |
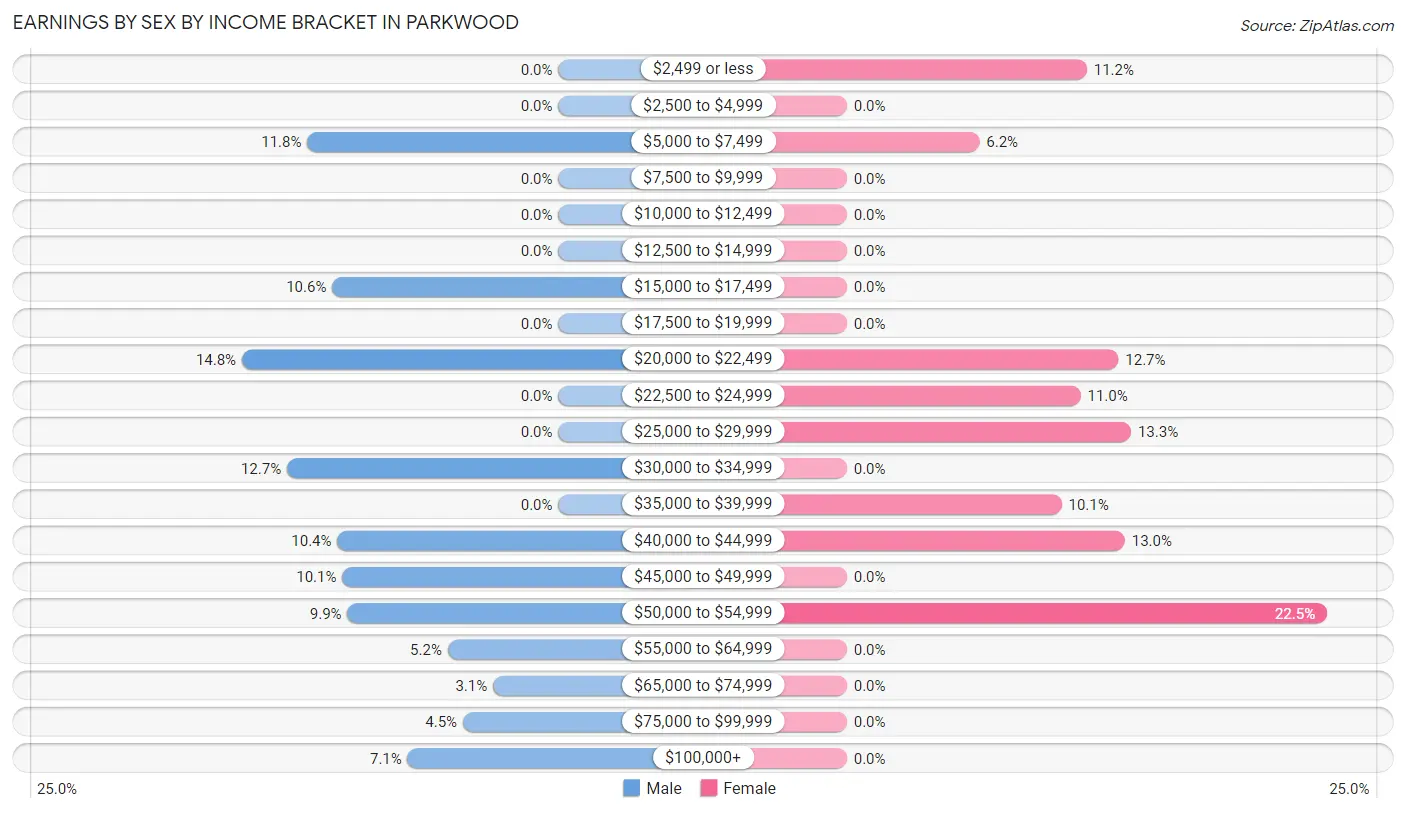
Earnings by Sex by Income Bracket in Parkwood
The most common earnings brackets in Parkwood are $20,000 to $22,499 for men (63 | 14.8%) and $50,000 to $54,999 for women (76 | 22.5%).
| Income | Male | Female |
| $2,499 or less | 0 (0.0%) | 38 (11.2%) |
| $2,500 to $4,999 | 0 (0.0%) | 0 (0.0%) |
| $5,000 to $7,499 | 50 (11.8%) | 21 (6.2%) |
| $7,500 to $9,999 | 0 (0.0%) | 0 (0.0%) |
| $10,000 to $12,499 | 0 (0.0%) | 0 (0.0%) |
| $12,500 to $14,999 | 0 (0.0%) | 0 (0.0%) |
| $15,000 to $17,499 | 45 (10.6%) | 0 (0.0%) |
| $17,500 to $19,999 | 0 (0.0%) | 0 (0.0%) |
| $20,000 to $22,499 | 63 (14.8%) | 43 (12.7%) |
| $22,500 to $24,999 | 0 (0.0%) | 37 (11.0%) |
| $25,000 to $29,999 | 0 (0.0%) | 45 (13.3%) |
| $30,000 to $34,999 | 54 (12.7%) | 0 (0.0%) |
| $35,000 to $39,999 | 0 (0.0%) | 34 (10.1%) |
| $40,000 to $44,999 | 44 (10.3%) | 44 (13.0%) |
| $45,000 to $49,999 | 43 (10.1%) | 0 (0.0%) |
| $50,000 to $54,999 | 42 (9.9%) | 76 (22.5%) |
| $55,000 to $64,999 | 22 (5.2%) | 0 (0.0%) |
| $65,000 to $74,999 | 13 (3.1%) | 0 (0.0%) |
| $75,000 to $99,999 | 19 (4.5%) | 0 (0.0%) |
| $100,000+ | 30 (7.1%) | 0 (0.0%) |
| Total | 425 (100.0%) | 338 (100.0%) |
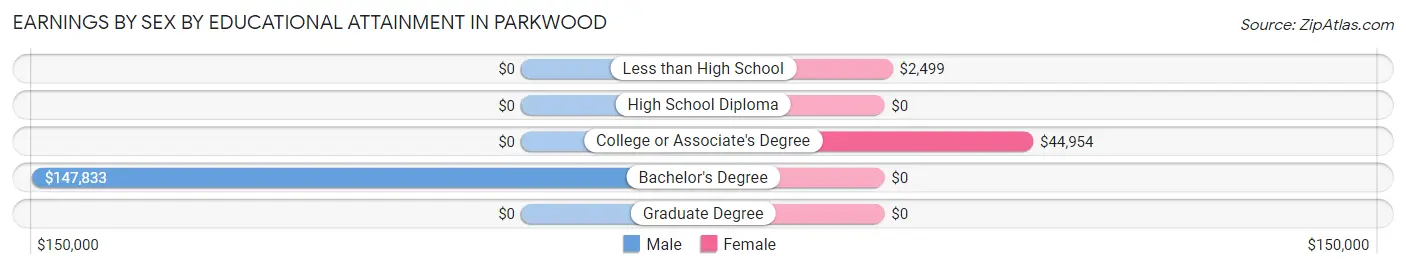
Earnings by Sex by Educational Attainment in Parkwood
Average earnings in Parkwood are $42,976 for men and $37,978 for women, a difference of 11.6%. Men with an educational attainment of bachelor's degree enjoy the highest average annual earnings of $147,833, while those with bachelor's degree education earn the least with $147,833. Women with an educational attainment of college or associate's degree earn the most with the average annual earnings of $44,954, while those with less than high school education have the smallest earnings of $2,499.
| Educational Attainment | Male Income | Female Income |
| Less than High School | - | - |
| High School Diploma | - | - |
| College or Associate's Degree | - | - |
| Bachelor's Degree | $147,833 | $0 |
| Graduate Degree | - | - |
| Total | $42,976 | $37,978 |
Family Income in Parkwood
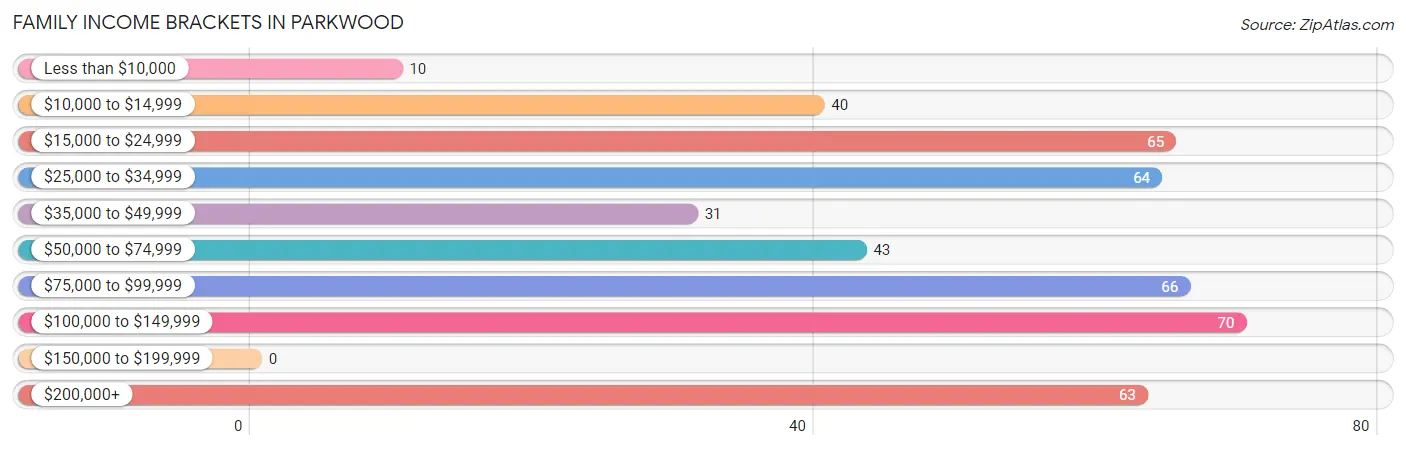
Family Income Brackets in Parkwood
According to the Parkwood family income data, there are 70 families falling into the $100,000 to $149,999 income range, which is the most common income bracket and makes up 15.5% of all families.
| Income Bracket | # Families | % Families |
| Less than $10,000 | 10 | 2.2% |
| $10,000 to $14,999 | 40 | 8.8% |
| $15,000 to $24,999 | 65 | 14.4% |
| $25,000 to $34,999 | 64 | 14.2% |
| $35,000 to $49,999 | 31 | 6.9% |
| $50,000 to $74,999 | 43 | 9.5% |
| $75,000 to $99,999 | 66 | 14.6% |
| $100,000 to $149,999 | 70 | 15.5% |
| $150,000 to $199,999 | 0 | 0.0% |
| $200,000+ | 63 | 13.9% |
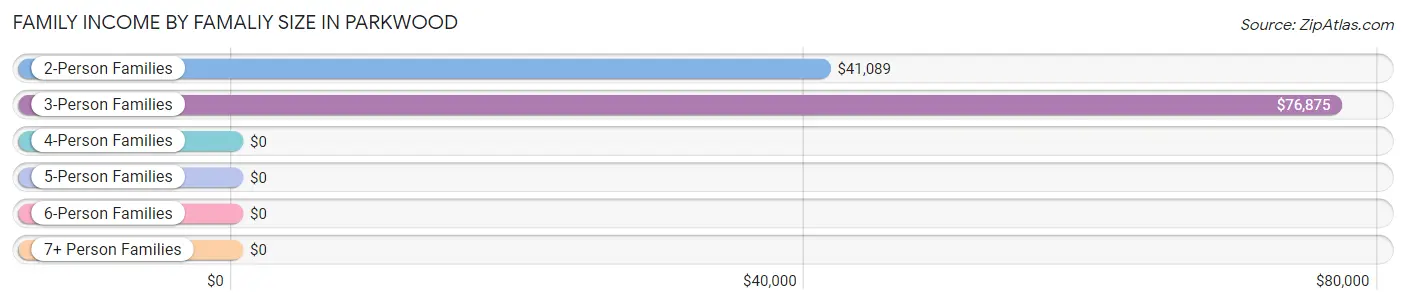
Family Income by Famaliy Size in Parkwood
3-person families (30 | 6.6%) account for the highest median family income in Parkwood with $76,875 per family, while 3-person families (30 | 6.6%) have the highest median income of $25,625 per family member.
| Income Bracket | # Families | Median Income |
| 2-Person Families | 91 (20.1%) | $41,089 |
| 3-Person Families | 30 (6.6%) | $76,875 |
| 4-Person Families | 168 (37.2%) | $0 |
| 5-Person Families | 140 (31.0%) | $0 |
| 6-Person Families | 0 (0.0%) | $0 |
| 7+ Person Families | 23 (5.1%) | $0 |
| Total | 452 (100.0%) | $55,930 |
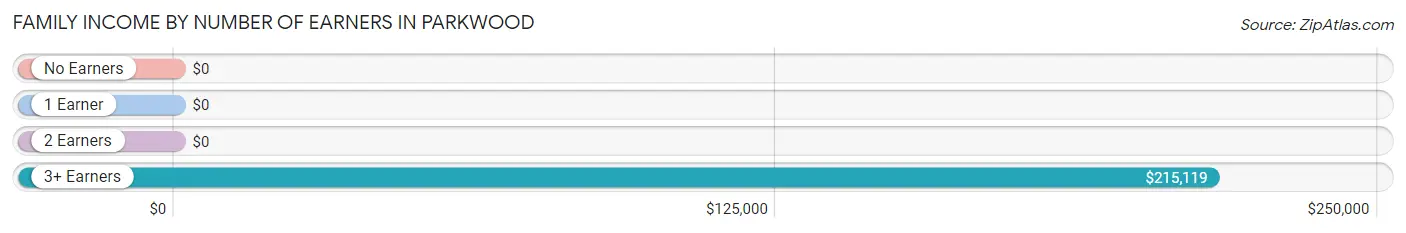
Family Income by Number of Earners in Parkwood
| Number of Earners | # Families | Median Income |
| No Earners | 97 (21.5%) | $0 |
| 1 Earner | 143 (31.6%) | $0 |
| 2 Earners | 92 (20.3%) | $0 |
| 3+ Earners | 120 (26.6%) | $215,119 |
| Total | 452 (100.0%) | $55,930 |
Household Income in Parkwood
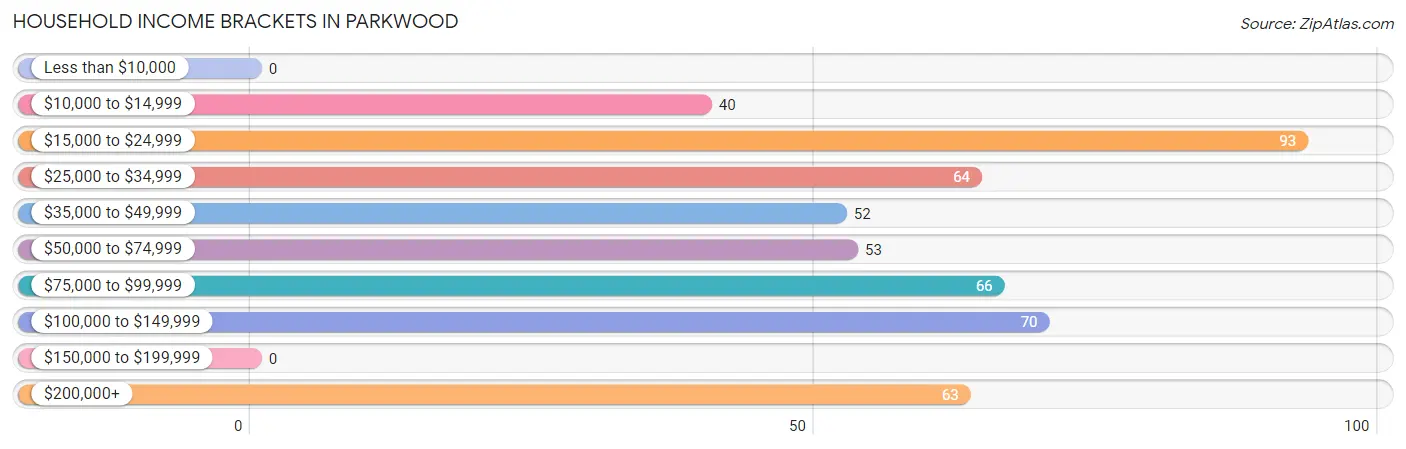
Household Income Brackets in Parkwood
With 93 households falling in the category, the $15,000 to $24,999 income range is the most frequent in Parkwood, accounting for 18.6% of all households.
| Income Bracket | # Households | % Households |
| Less than $10,000 | 0 | 0.0% |
| $10,000 to $14,999 | 40 | 8.0% |
| $15,000 to $24,999 | 93 | 18.6% |
| $25,000 to $34,999 | 64 | 12.8% |
| $35,000 to $49,999 | 52 | 10.4% |
| $50,000 to $74,999 | 53 | 10.6% |
| $75,000 to $99,999 | 66 | 13.2% |
| $100,000 to $149,999 | 70 | 14.0% |
| $150,000 to $199,999 | 0 | 0.0% |
| $200,000+ | 63 | 12.6% |
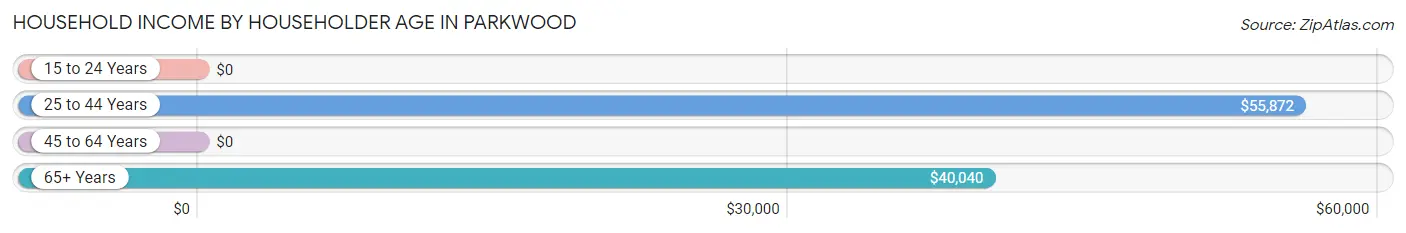
Household Income by Householder Age in Parkwood
The median household income in Parkwood is $55,087, with the highest median household income of $55,872 found in the 25 to 44 years age bracket for the primary householder. A total of 158 households (31.5%) fall into this category. Meanwhile, the 15 to 24 years age bracket for the primary householder has the lowest median household income of $0, with 32 households (6.4%) in this group.
| Income Bracket | # Households | Median Income |
| 15 to 24 Years | 32 (6.4%) | $0 |
| 25 to 44 Years | 158 (31.5%) | $55,872 |
| 45 to 64 Years | 176 (35.1%) | $0 |
| 65+ Years | 135 (27.0%) | $40,040 |
| Total | 501 (100.0%) | $55,087 |
Poverty in Parkwood
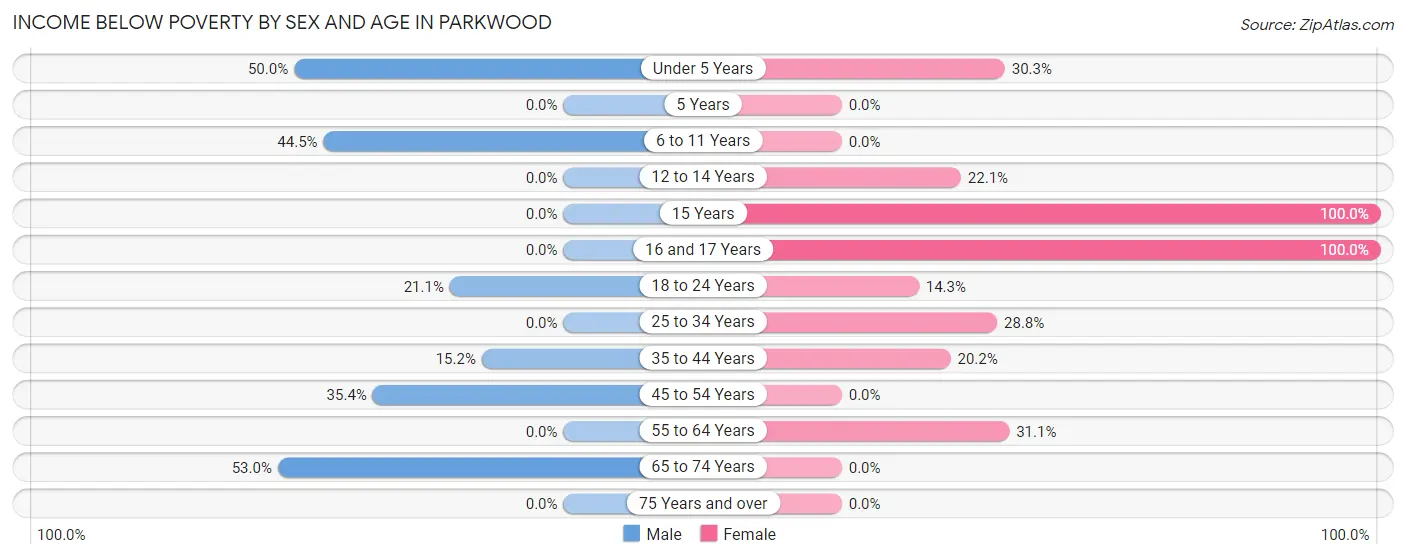
Income Below Poverty by Sex and Age in Parkwood
With 25.1% poverty level for males and 23.7% for females among the residents of Parkwood, 65 to 74 year old males and 15 year old females are the most vulnerable to poverty, with 44 males (53.0%) and 19 females (100.0%) in their respective age groups living below the poverty level.
| Age Bracket | Male | Female |
| Under 5 Years | 22 (50.0%) | 59 (30.3%) |
| 5 Years | 0 (0.0%) | 0 (0.0%) |
| 6 to 11 Years | 53 (44.5%) | 0 (0.0%) |
| 12 to 14 Years | 0 (0.0%) | 21 (22.1%) |
| 15 Years | 0 (0.0%) | 19 (100.0%) |
| 16 and 17 Years | 0 (0.0%) | 27 (100.0%) |
| 18 to 24 Years | 27 (21.1%) | 11 (14.3%) |
| 25 to 34 Years | 0 (0.0%) | 96 (28.8%) |
| 35 to 44 Years | 10 (15.1%) | 21 (20.2%) |
| 45 to 54 Years | 40 (35.4%) | 0 (0.0%) |
| 55 to 64 Years | 0 (0.0%) | 46 (31.1%) |
| 65 to 74 Years | 44 (53.0%) | 0 (0.0%) |
| 75 Years and over | 0 (0.0%) | 0 (0.0%) |
| Total | 196 (25.1%) | 300 (23.7%) |
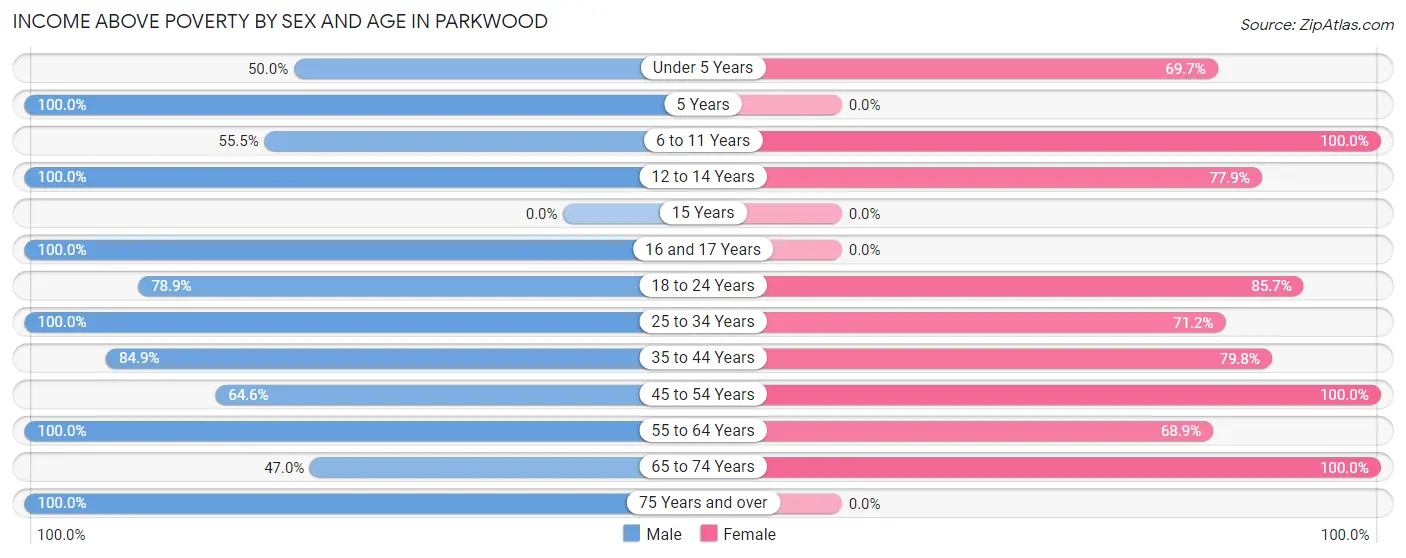
Income Above Poverty by Sex and Age in Parkwood
According to the poverty statistics in Parkwood, males aged 5 years and females aged 6 to 11 years are the age groups that are most secure financially, with 100.0% of males and 100.0% of females in these age groups living above the poverty line.
| Age Bracket | Male | Female |
| Under 5 Years | 22 (50.0%) | 136 (69.7%) |
| 5 Years | 15 (100.0%) | 0 (0.0%) |
| 6 to 11 Years | 66 (55.5%) | 112 (100.0%) |
| 12 to 14 Years | 20 (100.0%) | 74 (77.9%) |
| 15 Years | 0 (0.0%) | 0 (0.0%) |
| 16 and 17 Years | 25 (100.0%) | 0 (0.0%) |
| 18 to 24 Years | 101 (78.9%) | 66 (85.7%) |
| 25 to 34 Years | 105 (100.0%) | 237 (71.2%) |
| 35 to 44 Years | 56 (84.9%) | 83 (79.8%) |
| 45 to 54 Years | 73 (64.6%) | 63 (100.0%) |
| 55 to 64 Years | 32 (100.0%) | 102 (68.9%) |
| 65 to 74 Years | 39 (47.0%) | 93 (100.0%) |
| 75 Years and over | 30 (100.0%) | 0 (0.0%) |
| Total | 584 (74.9%) | 966 (76.3%) |
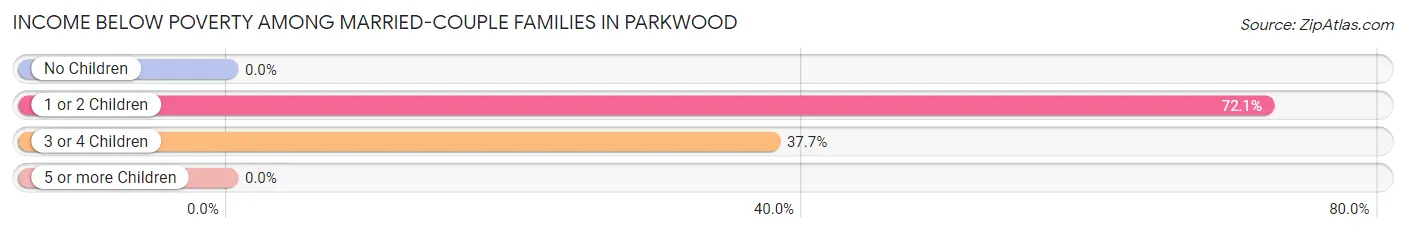
Income Below Poverty Among Married-Couple Families in Parkwood
The poverty statistics for married-couple families in Parkwood show that 27.0% or 84 of the total 311 families live below the poverty line. Families with 1 or 2 children have the highest poverty rate of 72.1%, comprising of 44 families. On the other hand, families with no children have the lowest poverty rate of 0.0%, which includes 0 families.
| Children | Above Poverty | Below Poverty |
| No Children | 144 (100.0%) | 0 (0.0%) |
| 1 or 2 Children | 17 (27.9%) | 44 (72.1%) |
| 3 or 4 Children | 66 (62.3%) | 40 (37.7%) |
| 5 or more Children | 0 (0.0%) | 0 (0.0%) |
| Total | 227 (73.0%) | 84 (27.0%) |
Income Below Poverty Among Single-Parent Households in Parkwood
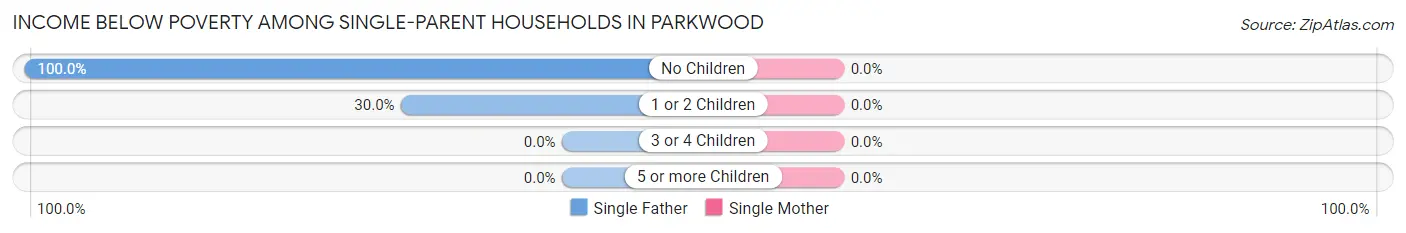
| Children | Single Father | Single Mother |
| No Children | 10 (100.0%) | 0 (0.0%) |
| 1 or 2 Children | 9 (30.0%) | 0 (0.0%) |
| 3 or 4 Children | 0 (0.0%) | 0 (0.0%) |
| 5 or more Children | 0 (0.0%) | 0 (0.0%) |
| Total | 19 (20.2%) | 0 (0.0%) |
Income Below Poverty Among Married-Couple vs Single-Parent Households in Parkwood
The poverty data for Parkwood shows that 84 of the married-couple family households (27.0%) and 19 of the single-parent households (13.5%) are living below the poverty level. Within the married-couple family households, those with 1 or 2 children have the highest poverty rate, with 44 households (72.1%) falling below the poverty line. Among the single-parent households, those with no children have the highest poverty rate, with 10 household (22.7%) living below poverty.
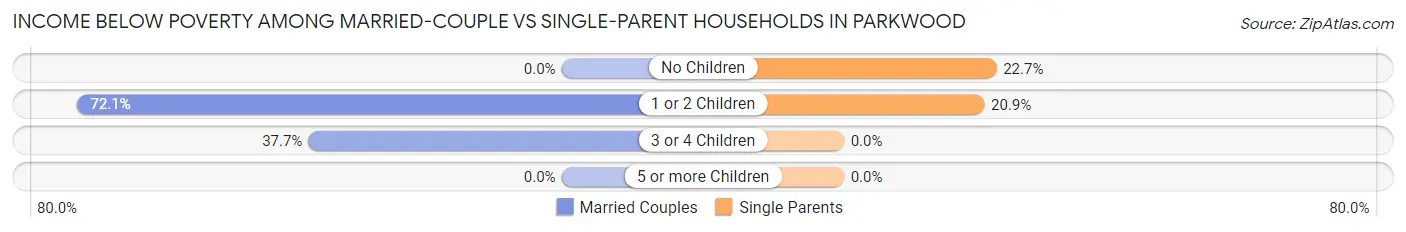
| Children | Married-Couple Families | Single-Parent Households |
| No Children | 0 (0.0%) | 10 (22.7%) |
| 1 or 2 Children | 44 (72.1%) | 9 (20.9%) |
| 3 or 4 Children | 40 (37.7%) | 0 (0.0%) |
| 5 or more Children | 0 (0.0%) | 0 (0.0%) |
| Total | 84 (27.0%) | 19 (13.5%) |
Race in Parkwood
The most populous races in Parkwood are Hispanic or Latino (1,658 | 80.0%), White / Caucasian (992 | 47.8%), and Some other Race (937 | 45.2%).
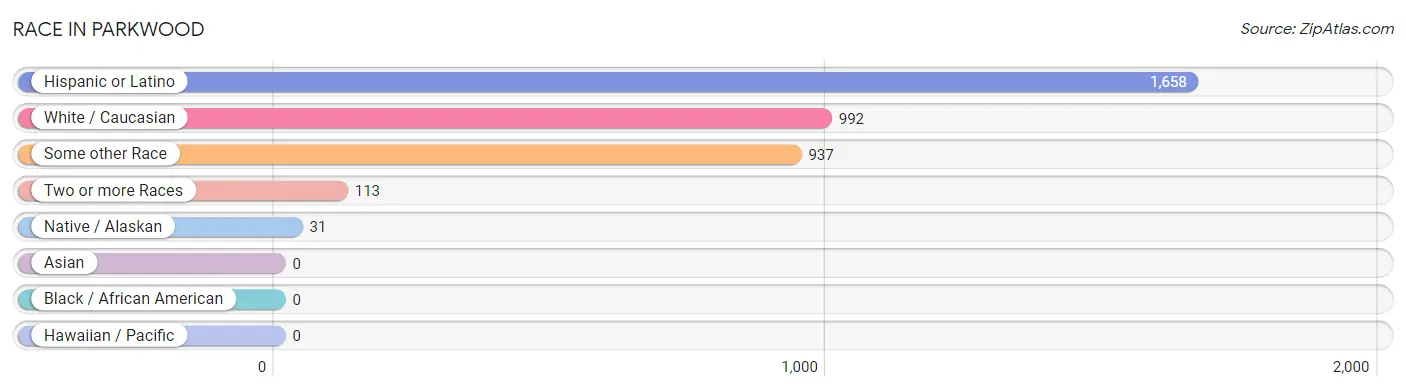
| Race | # Population | % Population |
| Asian | 0 | 0.0% |
| Black / African American | 0 | 0.0% |
| Hawaiian / Pacific | 0 | 0.0% |
| Hispanic or Latino | 1,658 | 80.0% |
| Native / Alaskan | 31 | 1.5% |
| White / Caucasian | 992 | 47.8% |
| Two or more Races | 113 | 5.4% |
| Some other Race | 937 | 45.2% |
| Total | 2,073 | 100.0% |
Ancestry in Parkwood
The most populous ancestries reported in Parkwood are Mexican (1,335 | 64.4%), Irish (220 | 10.6%), Italian (220 | 10.6%), English (105 | 5.1%), and German (61 | 2.9%), together accounting for 93.6% of all Parkwood residents.
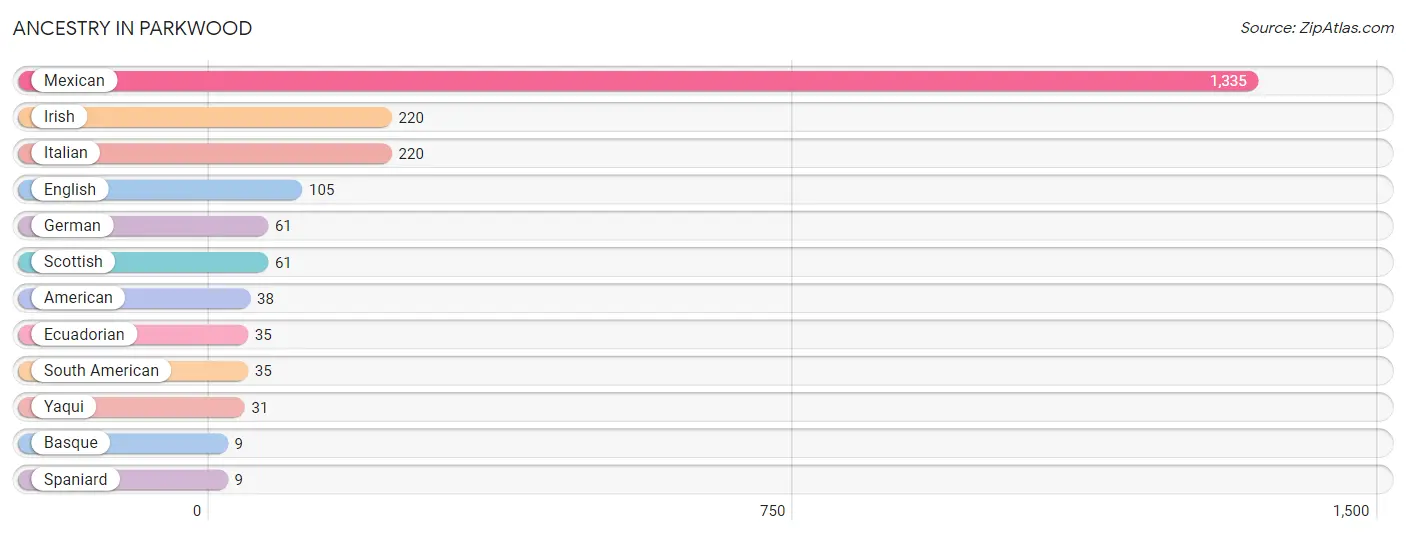
| Ancestry | # Population | % Population |
| American | 38 | 1.8% |
| Basque | 9 | 0.4% |
| Ecuadorian | 35 | 1.7% |
| English | 105 | 5.1% |
| German | 61 | 2.9% |
| Irish | 220 | 10.6% |
| Italian | 220 | 10.6% |
| Mexican | 1,335 | 64.4% |
| Scottish | 61 | 2.9% |
| South American | 35 | 1.7% |
| Spaniard | 9 | 0.4% |
| Yaqui | 31 | 1.5% | View All 12 Rows |
Immigrants in Parkwood
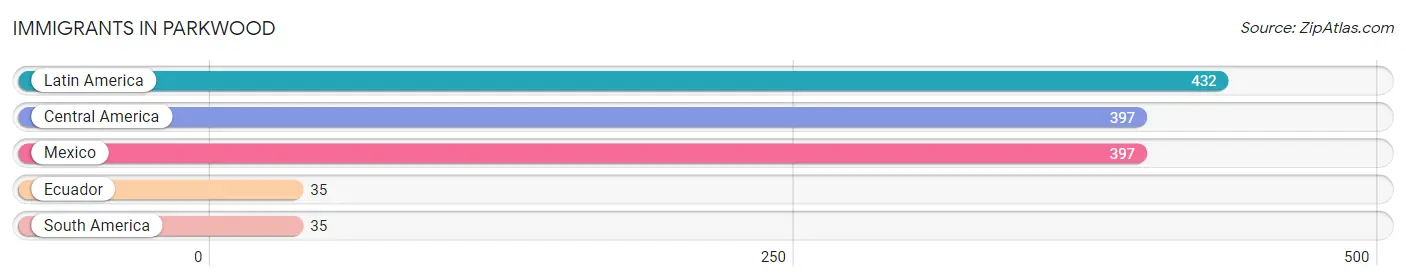
The most numerous immigrant groups reported in Parkwood came from Latin America (432 | 20.8%), Central America (397 | 19.2%), Mexico (397 | 19.2%), Ecuador (35 | 1.7%), and South America (35 | 1.7%), together accounting for 62.5% of all Parkwood residents.
| Immigration Origin | # Population | % Population |
| Central America | 397 | 19.2% |
| Ecuador | 35 | 1.7% |
| Latin America | 432 | 20.8% |
| Mexico | 397 | 19.2% |
| South America | 35 | 1.7% | View All 5 Rows |
Sex and Age in Parkwood
Sex and Age in Parkwood
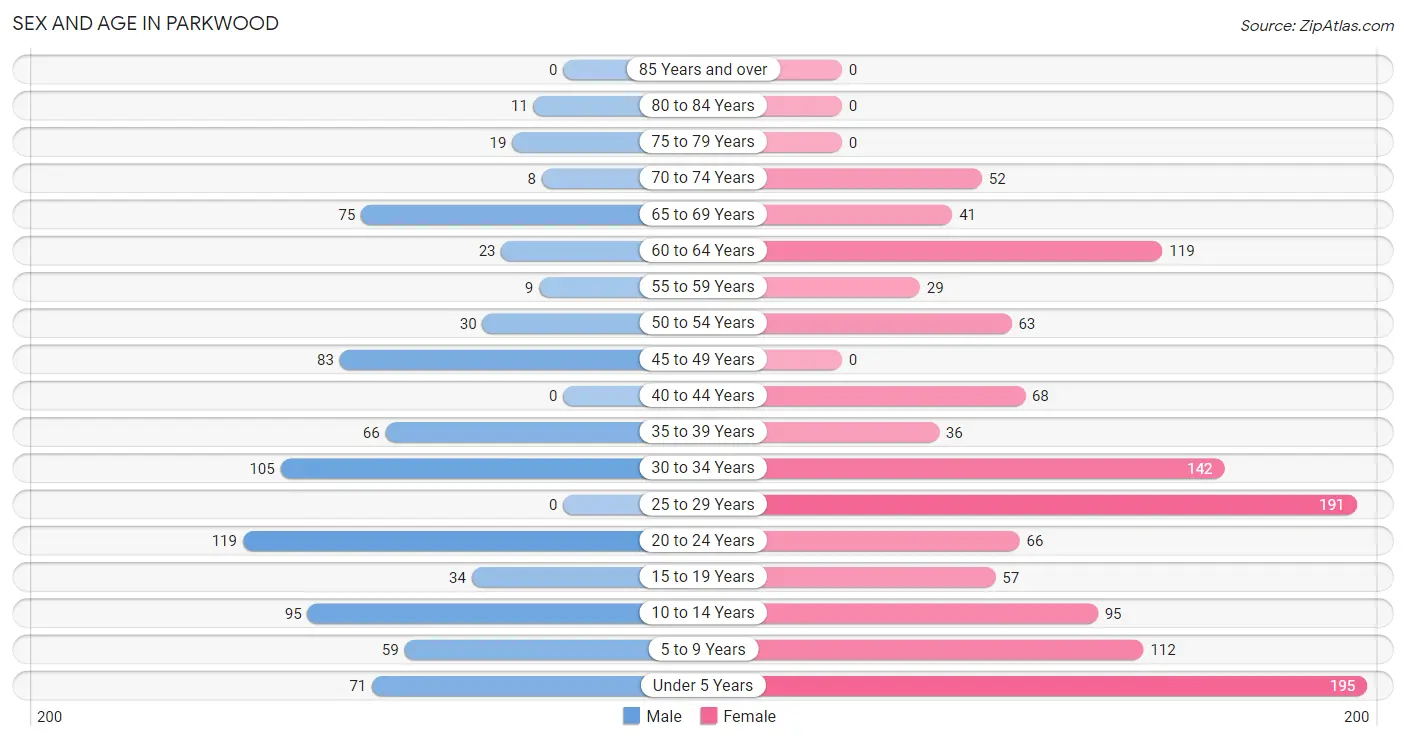
The most populous age groups in Parkwood are 20 to 24 Years (119 | 14.7%) for men and Under 5 Years (195 | 15.4%) for women.
| Age Bracket | Male | Female |
| Under 5 Years | 71 (8.8%) | 195 (15.4%) |
| 5 to 9 Years | 59 (7.3%) | 112 (8.8%) |
| 10 to 14 Years | 95 (11.8%) | 95 (7.5%) |
| 15 to 19 Years | 34 (4.2%) | 57 (4.5%) |
| 20 to 24 Years | 119 (14.7%) | 66 (5.2%) |
| 25 to 29 Years | 0 (0.0%) | 191 (15.1%) |
| 30 to 34 Years | 105 (13.0%) | 142 (11.2%) |
| 35 to 39 Years | 66 (8.2%) | 36 (2.8%) |
| 40 to 44 Years | 0 (0.0%) | 68 (5.4%) |
| 45 to 49 Years | 83 (10.3%) | 0 (0.0%) |
| 50 to 54 Years | 30 (3.7%) | 63 (5.0%) |
| 55 to 59 Years | 9 (1.1%) | 29 (2.3%) |
| 60 to 64 Years | 23 (2.9%) | 119 (9.4%) |
| 65 to 69 Years | 75 (9.3%) | 41 (3.2%) |
| 70 to 74 Years | 8 (1.0%) | 52 (4.1%) |
| 75 to 79 Years | 19 (2.4%) | 0 (0.0%) |
| 80 to 84 Years | 11 (1.4%) | 0 (0.0%) |
| 85 Years and over | 0 (0.0%) | 0 (0.0%) |
| Total | 807 (100.0%) | 1,266 (100.0%) |
Families and Households in Parkwood
Median Family Size in Parkwood
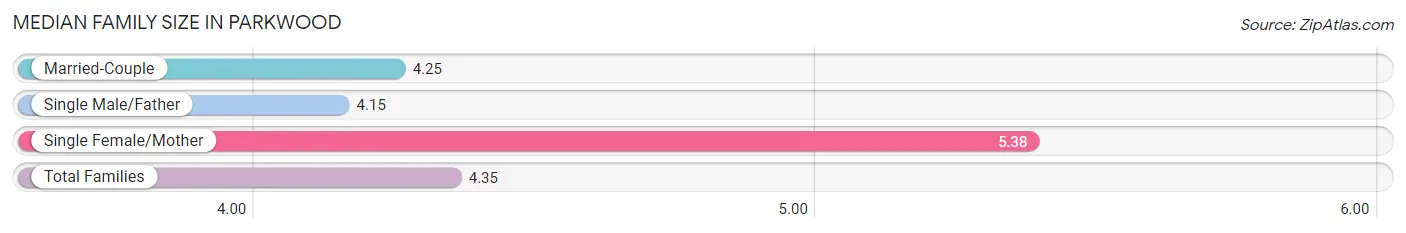
The median family size in Parkwood is 4.35 persons per family, with single female/mother families (47 | 10.4%) accounting for the largest median family size of 5.38 persons per family. On the other hand, single male/father families (94 | 20.8%) represent the smallest median family size with 4.15 persons per family.
| Family Type | # Families | Family Size |
| Married-Couple | 311 (68.8%) | 4.25 |
| Single Male/Father | 94 (20.8%) | 4.15 |
| Single Female/Mother | 47 (10.4%) | 5.38 |
| Total Families | 452 (100.0%) | 4.35 |
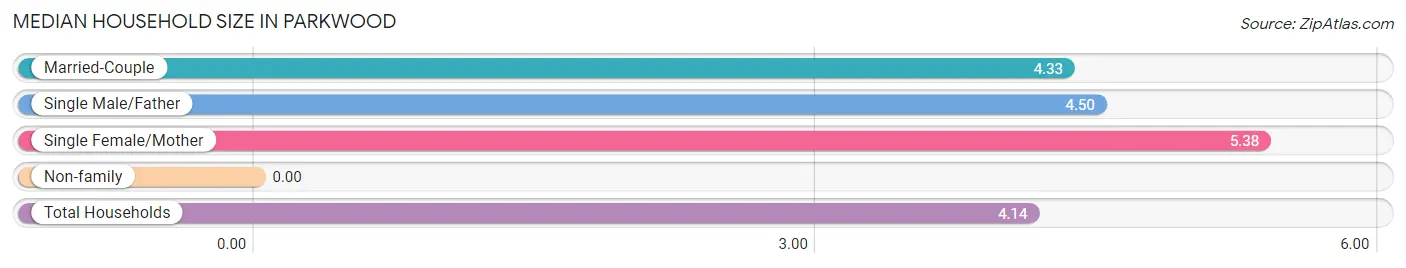
Median Household Size in Parkwood
| Household Type | # Households | Household Size |
| Married-Couple | 311 (62.1%) | 4.33 |
| Single Male/Father | 94 (18.8%) | 4.50 |
| Single Female/Mother | 47 (9.4%) | 5.38 |
| Non-family | 49 (9.8%) | - |
| Total Households | 501 (100.0%) | 4.14 |
Household Size by Marriage Status in Parkwood
Out of a total of 501 households in Parkwood, 452 (90.2%) are family households, while 49 (9.8%) are nonfamily households. The most numerous type of family households are 5-person households, comprising 159, and the most common type of nonfamily households are 1-person households, comprising 49.
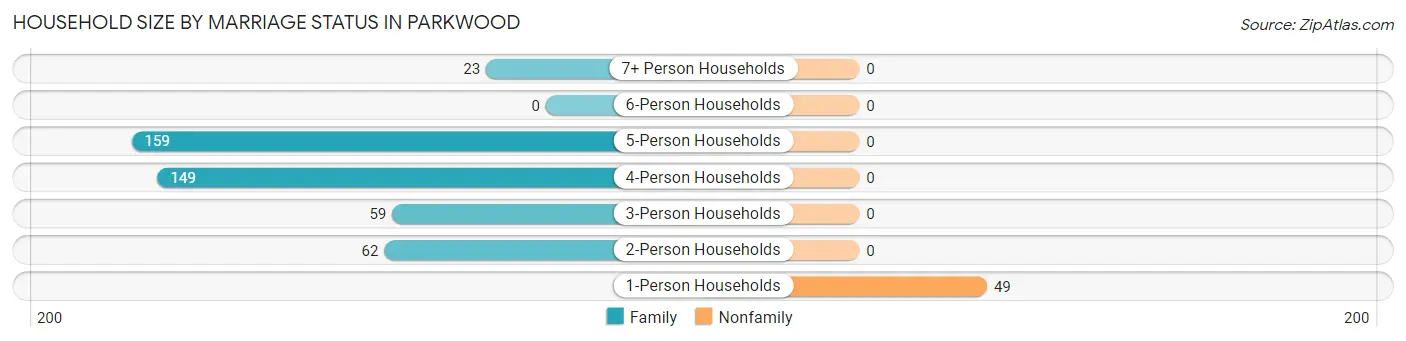
| Household Size | Family Households | Nonfamily Households |
| 1-Person Households | - | 49 (9.8%) |
| 2-Person Households | 62 (12.4%) | 0 (0.0%) |
| 3-Person Households | 59 (11.8%) | 0 (0.0%) |
| 4-Person Households | 149 (29.7%) | 0 (0.0%) |
| 5-Person Households | 159 (31.7%) | 0 (0.0%) |
| 6-Person Households | 0 (0.0%) | 0 (0.0%) |
| 7+ Person Households | 23 (4.6%) | 0 (0.0%) |
| Total | 452 (90.2%) | 49 (9.8%) |
Female Fertility in Parkwood
Fertility by Age in Parkwood
Average fertility rate in Parkwood is 168.0 births per 1,000 women. Women in the age bracket of 20 to 34 years have the highest fertility rate with 236.0 births per 1,000 women. Women in the age bracket of 20 to 34 years acount for 100.0% of all women with births.
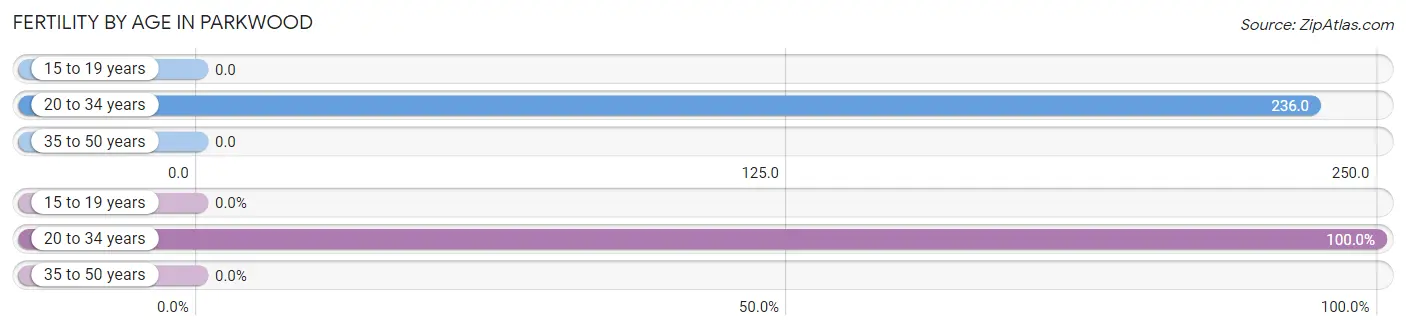
| Age Bracket | Women with Births | Births / 1,000 Women |
| 15 to 19 years | 0 (0.0%) | 0.0 |
| 20 to 34 years | 94 (100.0%) | 236.0 |
| 35 to 50 years | 0 (0.0%) | 0.0 |
| Total | 94 (100.0%) | 168.0 |
Fertility by Age by Marriage Status in Parkwood
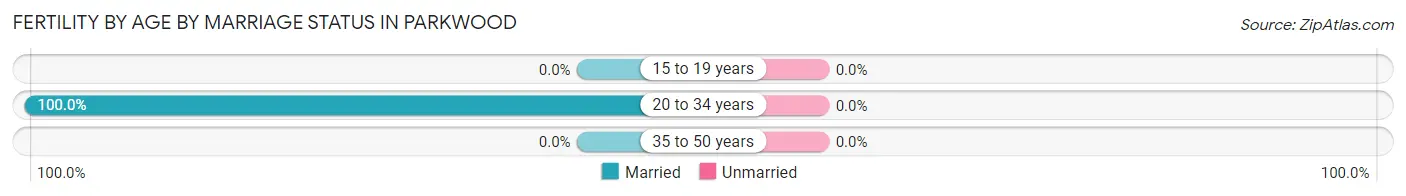
| Age Bracket | Married | Unmarried |
| 15 to 19 years | 0 (0.0%) | 0 (0.0%) |
| 20 to 34 years | 94 (100.0%) | 0 (0.0%) |
| 35 to 50 years | 0 (0.0%) | 0 (0.0%) |
| Total | 94 (100.0%) | 0 (0.0%) |
Fertility by Education in Parkwood
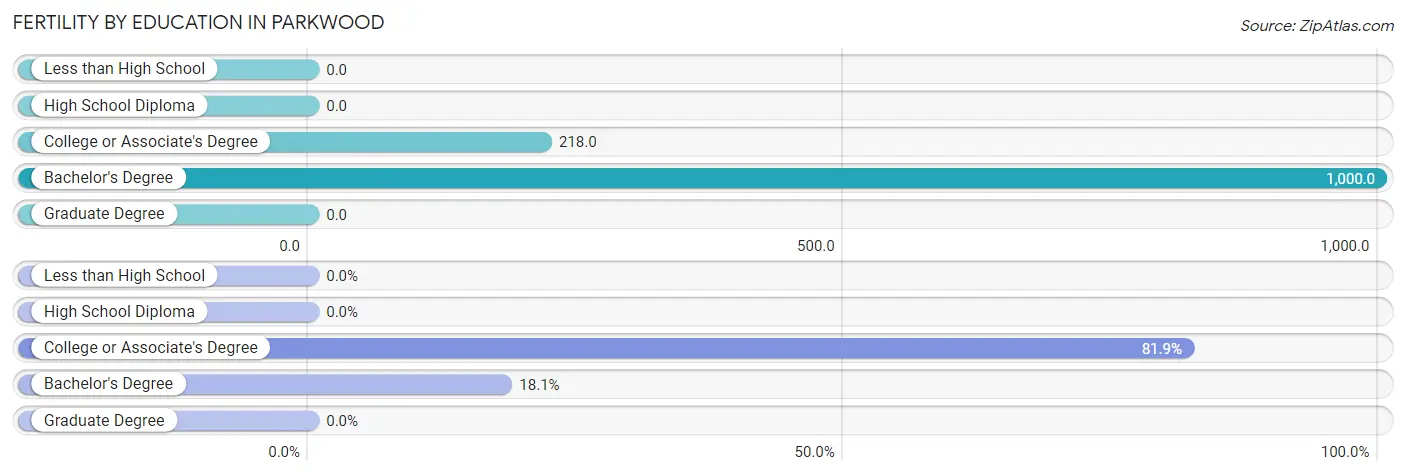
| Educational Attainment | Women with Births | Births / 1,000 Women |
| Less than High School | 0 (0.0%) | 0.0 |
| High School Diploma | 0 (0.0%) | 0.0 |
| College or Associate's Degree | 77 (81.9%) | 218.0 |
| Bachelor's Degree | 17 (18.1%) | 1,000.0 |
| Graduate Degree | 0 (0.0%) | 0.0 |
| Total | 94 (100.0%) | 168.0 |
Fertility by Education by Marriage Status in Parkwood
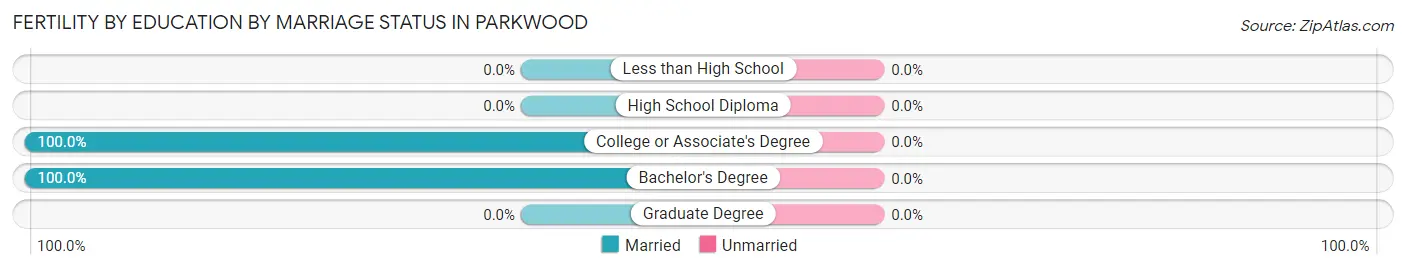
| Educational Attainment | Married | Unmarried |
| Less than High School | 0 (0.0%) | 0 (0.0%) |
| High School Diploma | 0 (0.0%) | 0 (0.0%) |
| College or Associate's Degree | 77 (100.0%) | 0 (0.0%) |
| Bachelor's Degree | 17 (100.0%) | 0 (0.0%) |
| Graduate Degree | 0 (0.0%) | 0 (0.0%) |
| Total | 94 (100.0%) | 0 (0.0%) |
Employment Characteristics in Parkwood
Employment by Class of Employer in Parkwood
Among the 664 employed individuals in Parkwood, private company employees (471 | 70.9%), local government employees (77 | 11.6%), and self-employed (not incorporated) (73 | 11.0%) make up the most common classes of employment.
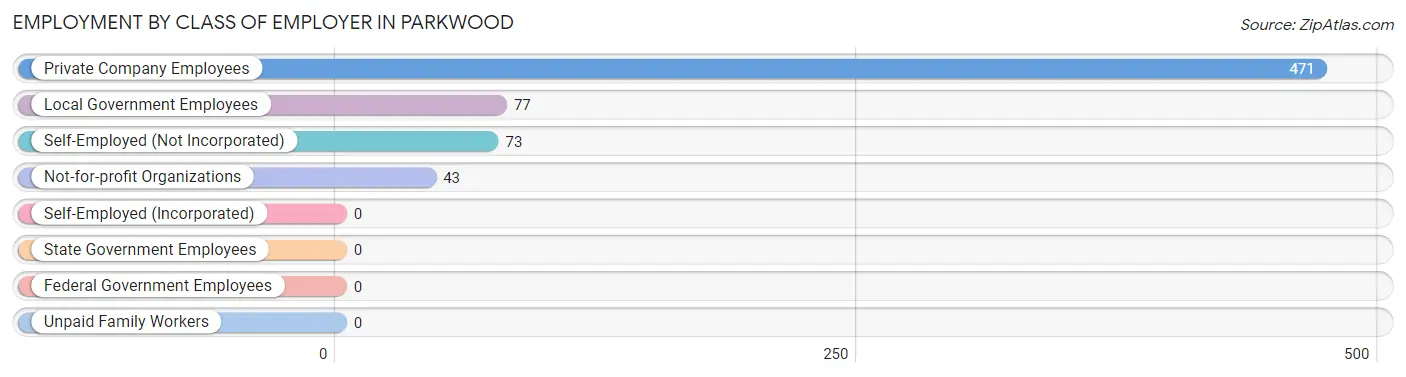
| Employer Class | # Employees | % Employees |
| Private Company Employees | 471 | 70.9% |
| Self-Employed (Incorporated) | 0 | 0.0% |
| Self-Employed (Not Incorporated) | 73 | 11.0% |
| Not-for-profit Organizations | 43 | 6.5% |
| Local Government Employees | 77 | 11.6% |
| State Government Employees | 0 | 0.0% |
| Federal Government Employees | 0 | 0.0% |
| Unpaid Family Workers | 0 | 0.0% |
| Total | 664 | 100.0% |
Employment Status by Age in Parkwood
According to the labor force statistics for Parkwood, out of the total population over 16 years of age (1,427), 61.3% or 875 individuals are in the labor force, with 24.1% or 211 of them unemployed. The age group with the highest labor force participation rate is 30 to 34 years, with 100.0% or 247 individuals in the labor force. Within the labor force, the 25 to 29 years age range has the highest percentage of unemployed individuals, with 100.0% or 112 of them being unemployed.
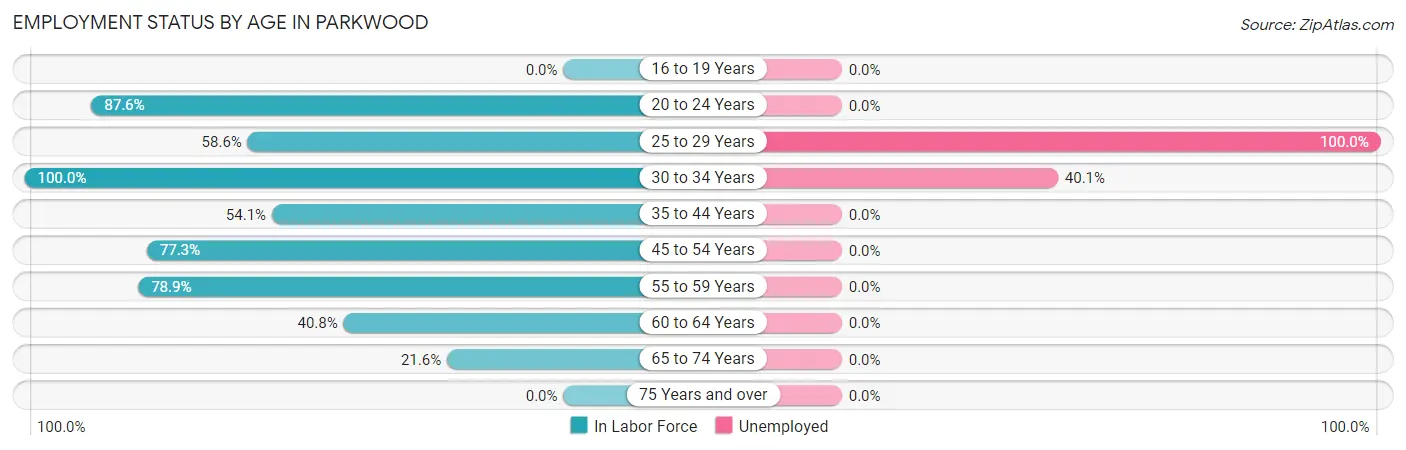
| Age Bracket | In Labor Force | Unemployed |
| 16 to 19 Years | 0 (0.0%) | 0 (0.0%) |
| 20 to 24 Years | 162 (87.6%) | 0 (0.0%) |
| 25 to 29 Years | 112 (58.6%) | 112 (100.0%) |
| 30 to 34 Years | 247 (100.0%) | 99 (40.1%) |
| 35 to 44 Years | 92 (54.1%) | 0 (0.0%) |
| 45 to 54 Years | 136 (77.3%) | 0 (0.0%) |
| 55 to 59 Years | 30 (78.9%) | 0 (0.0%) |
| 60 to 64 Years | 58 (40.8%) | 0 (0.0%) |
| 65 to 74 Years | 38 (21.6%) | 0 (0.0%) |
| 75 Years and over | 0 (0.0%) | 0 (0.0%) |
| Total | 875 (61.3%) | 211 (24.1%) |
Employment Status by Educational Attainment in Parkwood
According to labor force statistics for Parkwood, 70.0% of individuals (675) out of the total population between 25 and 64 years of age (964) are in the labor force, with 31.3% or 211 of them being unemployed. The group with the highest labor force participation rate are those with the educational attainment of high school diploma, with 100.0% or 122 individuals in the labor force. Within the labor force, individuals with college / associate degree education have the highest percentage of unemployment, with 47.0% or 189 of them being unemployed.
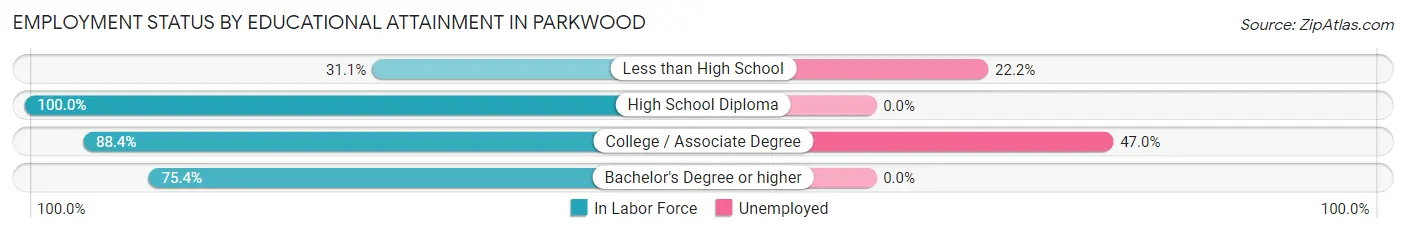
| Educational Attainment | In Labor Force | Unemployed |
| Less than High School | 99 (31.1%) | 71 (22.2%) |
| High School Diploma | 122 (100.0%) | 0 (0.0%) |
| College / Associate Degree | 402 (88.4%) | 214 (47.0%) |
| Bachelor's Degree or higher | 52 (75.4%) | 0 (0.0%) |
| Total | 675 (70.0%) | 302 (31.3%) |
Employment Occupations by Sex in Parkwood
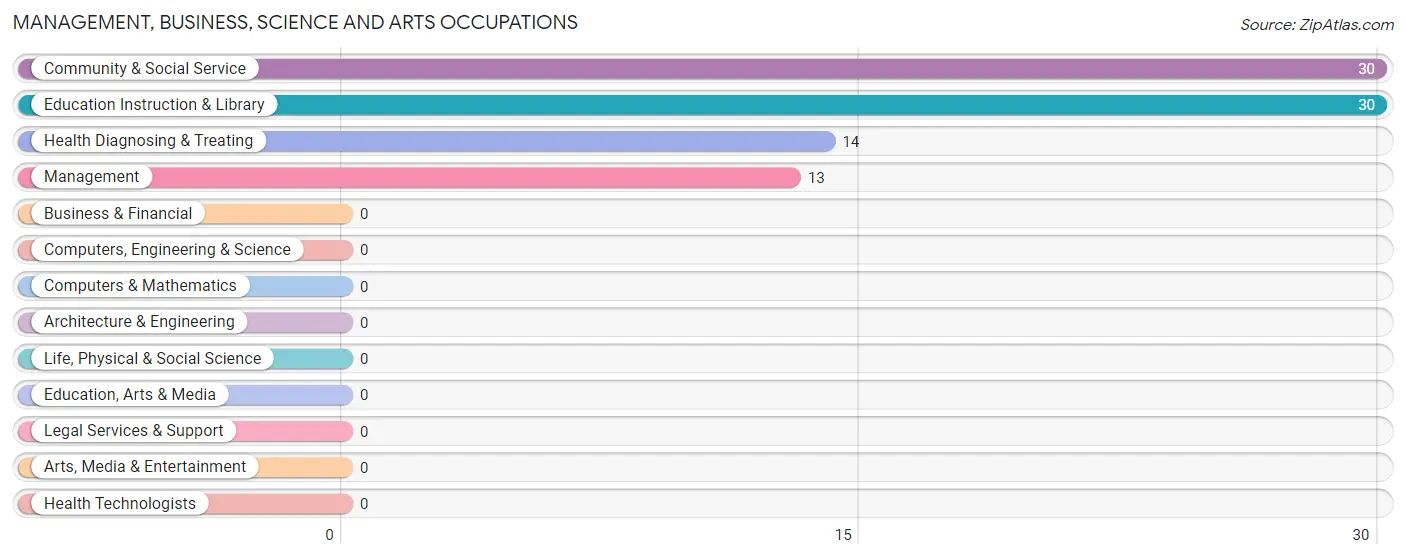
Management, Business, Science and Arts Occupations
The most common Management, Business, Science and Arts occupations in Parkwood are Community & Social Service (30 | 4.5%), Education Instruction & Library (30 | 4.5%), Health Diagnosing & Treating (14 | 2.1%), and Management (13 | 2.0%).
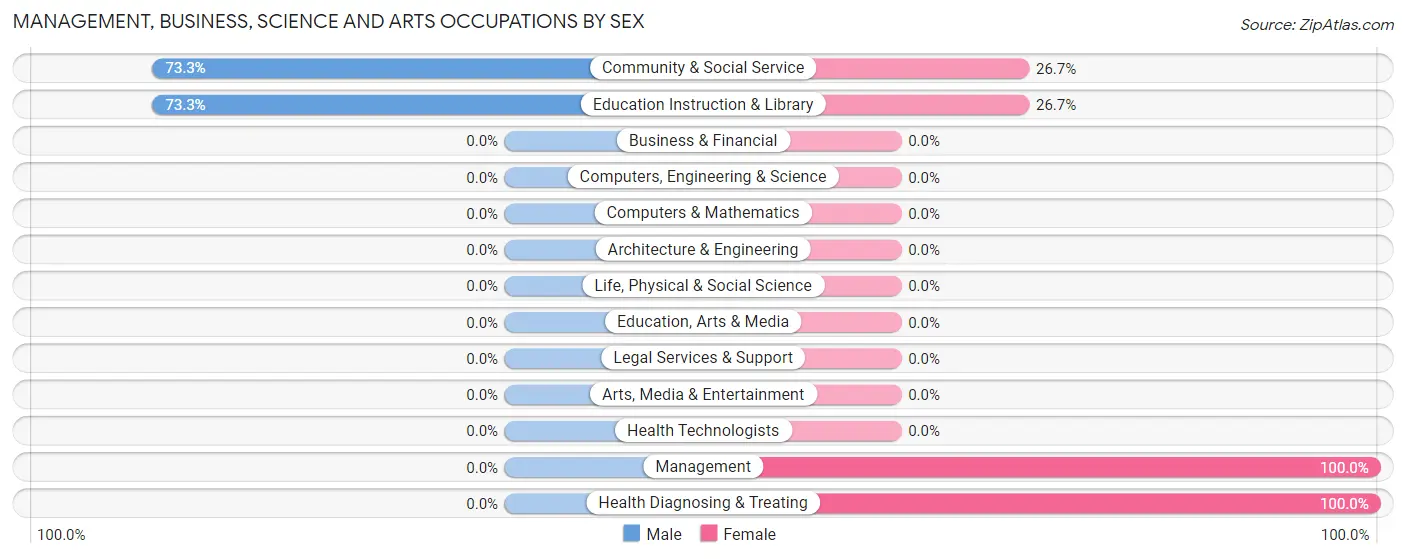
Management, Business, Science and Arts Occupations by Sex
Within the Management, Business, Science and Arts occupations in Parkwood, the most male-oriented occupations are Community & Social Service (73.3%), and Education Instruction & Library (73.3%), while the most female-oriented occupations are Management (100.0%), Health Diagnosing & Treating (100.0%), and Community & Social Service (26.7%).
| Occupation | Male | Female |
| Management | 0 (0.0%) | 13 (100.0%) |
| Business & Financial | 0 (0.0%) | 0 (0.0%) |
| Computers, Engineering & Science | 0 (0.0%) | 0 (0.0%) |
| Computers & Mathematics | 0 (0.0%) | 0 (0.0%) |
| Architecture & Engineering | 0 (0.0%) | 0 (0.0%) |
| Life, Physical & Social Science | 0 (0.0%) | 0 (0.0%) |
| Community & Social Service | 22 (73.3%) | 8 (26.7%) |
| Education, Arts & Media | 0 (0.0%) | 0 (0.0%) |
| Legal Services & Support | 0 (0.0%) | 0 (0.0%) |
| Education Instruction & Library | 22 (73.3%) | 8 (26.7%) |
| Arts, Media & Entertainment | 0 (0.0%) | 0 (0.0%) |
| Health Diagnosing & Treating | 0 (0.0%) | 14 (100.0%) |
| Health Technologists | 0 (0.0%) | 0 (0.0%) |
| Total (Category) | 22 (38.6%) | 35 (61.4%) |
| Total (Overall) | 364 (54.8%) | 300 (45.2%) |
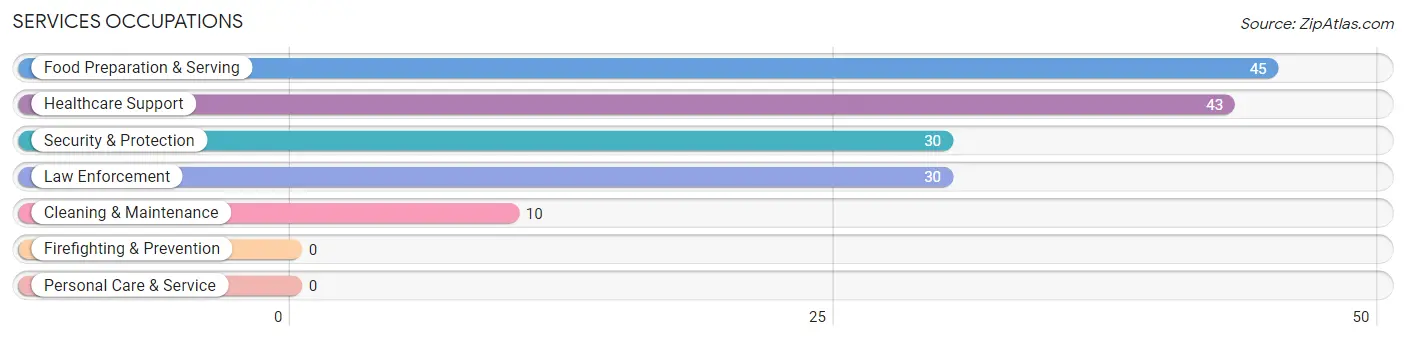
Services Occupations
The most common Services occupations in Parkwood are Food Preparation & Serving (45 | 6.8%), Healthcare Support (43 | 6.5%), Security & Protection (30 | 4.5%), Law Enforcement (30 | 4.5%), and Cleaning & Maintenance (10 | 1.5%).
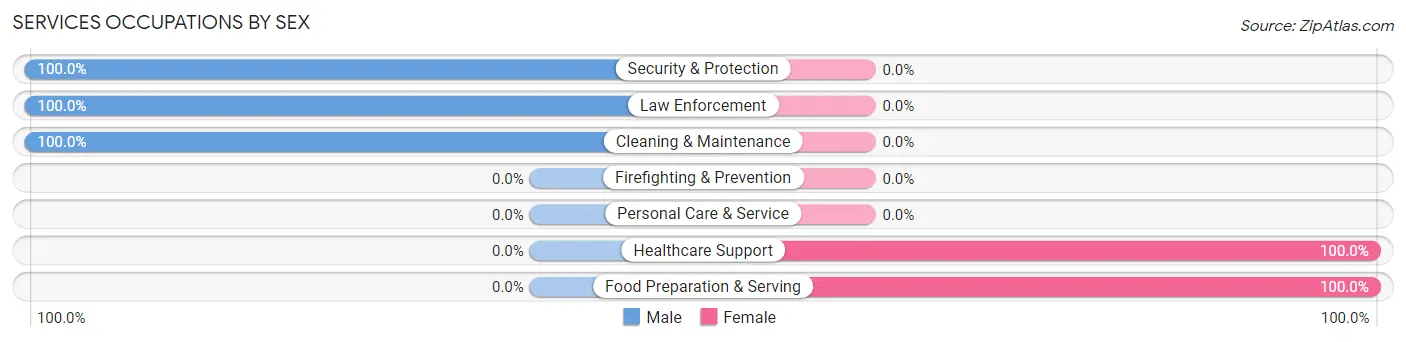
Services Occupations by Sex
Within the Services occupations in Parkwood, the most male-oriented occupations are Security & Protection (100.0%), Law Enforcement (100.0%), and Cleaning & Maintenance (100.0%), while the most female-oriented occupations are Healthcare Support (100.0%), and Food Preparation & Serving (100.0%).
| Occupation | Male | Female |
| Healthcare Support | 0 (0.0%) | 43 (100.0%) |
| Security & Protection | 30 (100.0%) | 0 (0.0%) |
| Firefighting & Prevention | 0 (0.0%) | 0 (0.0%) |
| Law Enforcement | 30 (100.0%) | 0 (0.0%) |
| Food Preparation & Serving | 0 (0.0%) | 45 (100.0%) |
| Cleaning & Maintenance | 10 (100.0%) | 0 (0.0%) |
| Personal Care & Service | 0 (0.0%) | 0 (0.0%) |
| Total (Category) | 40 (31.2%) | 88 (68.8%) |
| Total (Overall) | 364 (54.8%) | 300 (45.2%) |
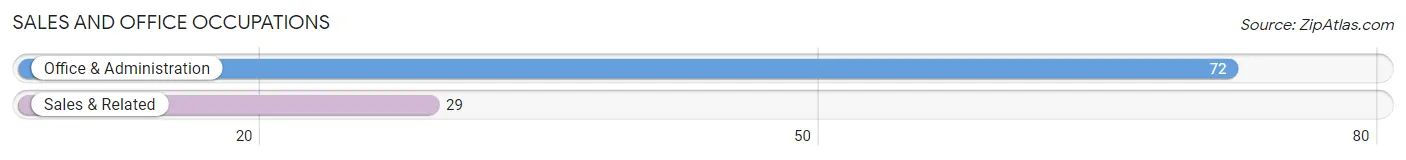
Sales and Office Occupations
The most common Sales and Office occupations in Parkwood are Office & Administration (72 | 10.8%), and Sales & Related (29 | 4.4%).
Sales and Office Occupations by Sex
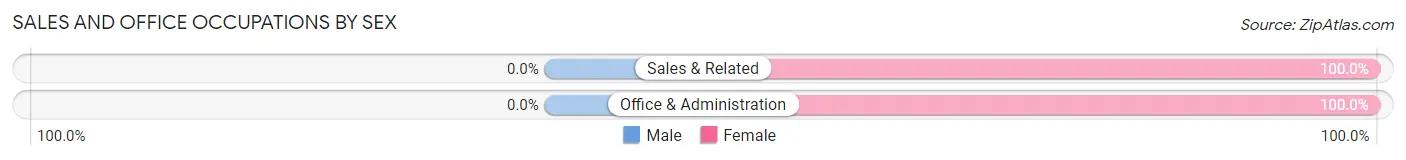
| Occupation | Male | Female |
| Sales & Related | 0 (0.0%) | 29 (100.0%) |
| Office & Administration | 0 (0.0%) | 72 (100.0%) |
| Total (Category) | 0 (0.0%) | 101 (100.0%) |
| Total (Overall) | 364 (54.8%) | 300 (45.2%) |
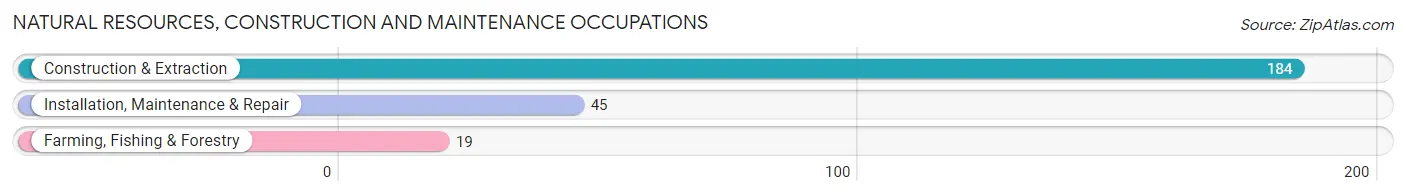
Natural Resources, Construction and Maintenance Occupations
The most common Natural Resources, Construction and Maintenance occupations in Parkwood are Construction & Extraction (184 | 27.7%), Installation, Maintenance & Repair (45 | 6.8%), and Farming, Fishing & Forestry (19 | 2.9%).
Natural Resources, Construction and Maintenance Occupations by Sex
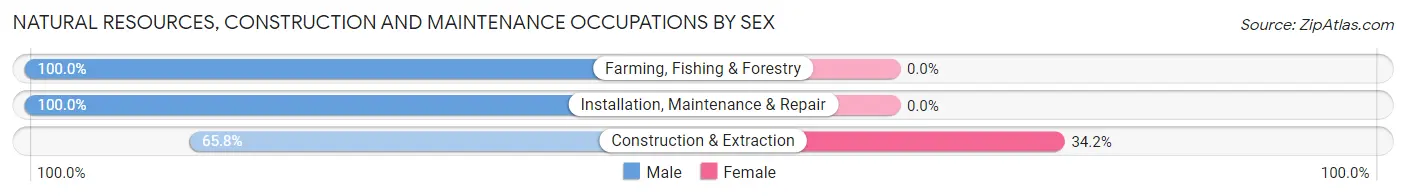
| Occupation | Male | Female |
| Farming, Fishing & Forestry | 19 (100.0%) | 0 (0.0%) |
| Construction & Extraction | 121 (65.8%) | 63 (34.2%) |
| Installation, Maintenance & Repair | 45 (100.0%) | 0 (0.0%) |
| Total (Category) | 185 (74.6%) | 63 (25.4%) |
| Total (Overall) | 364 (54.8%) | 300 (45.2%) |
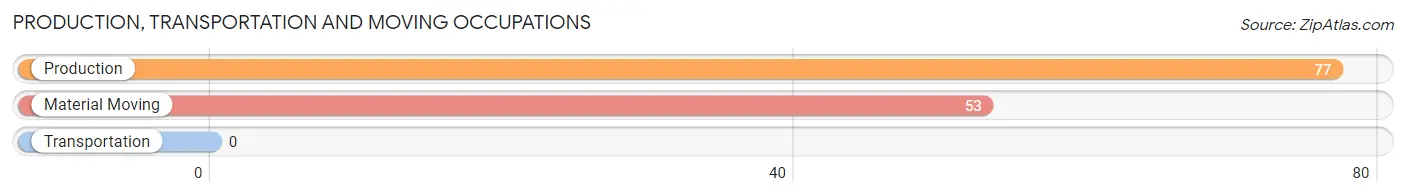
Production, Transportation and Moving Occupations
The most common Production, Transportation and Moving occupations in Parkwood are Production (77 | 11.6%), and Material Moving (53 | 8.0%).
Production, Transportation and Moving Occupations by Sex
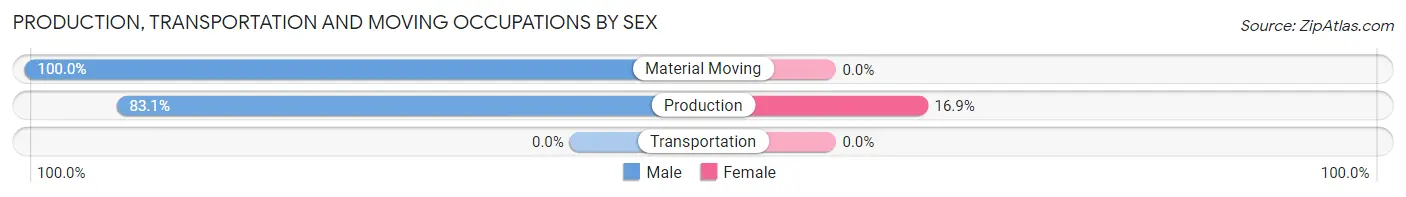
| Occupation | Male | Female |
| Production | 64 (83.1%) | 13 (16.9%) |
| Transportation | 0 (0.0%) | 0 (0.0%) |
| Material Moving | 53 (100.0%) | 0 (0.0%) |
| Total (Category) | 117 (90.0%) | 13 (10.0%) |
| Total (Overall) | 364 (54.8%) | 300 (45.2%) |
Employment Industries by Sex in Parkwood
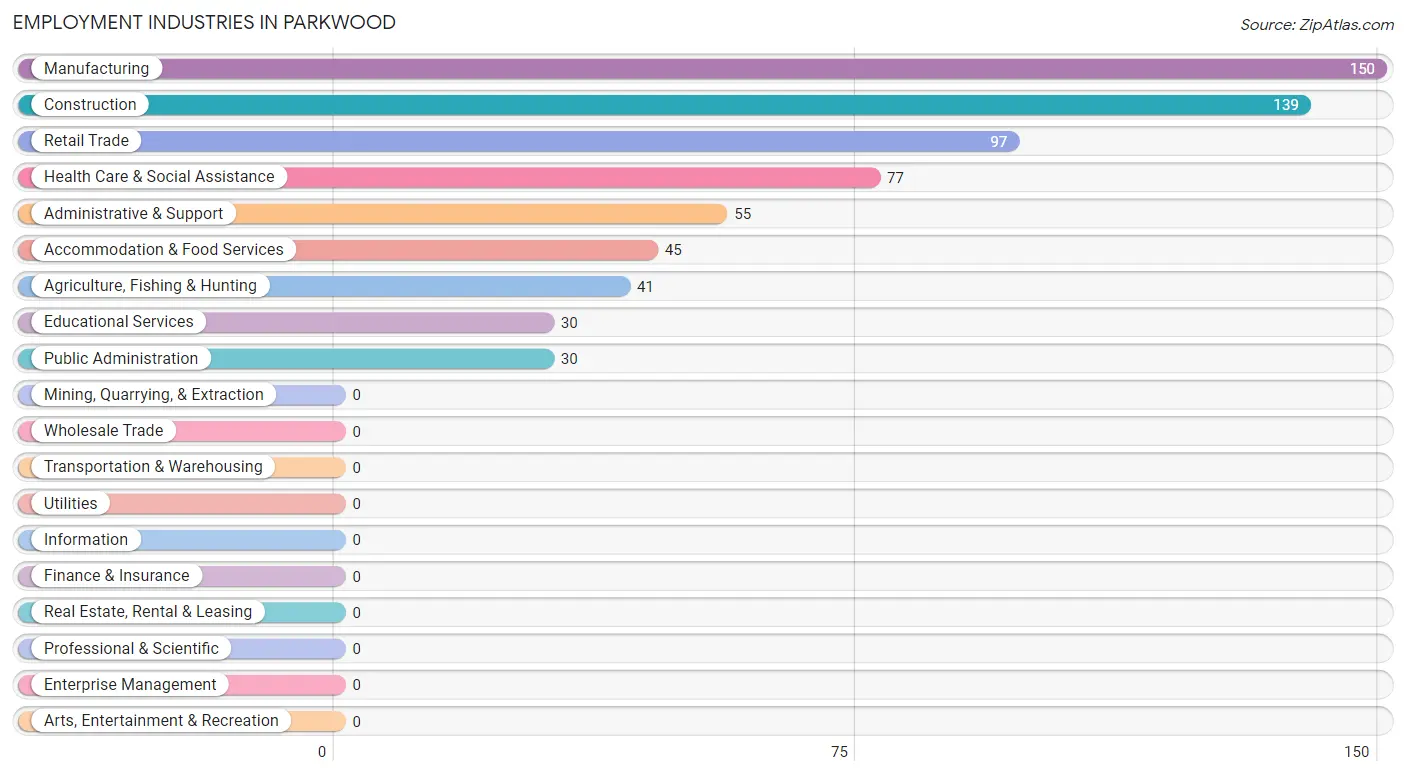
Employment Industries in Parkwood
The major employment industries in Parkwood include Manufacturing (150 | 22.6%), Construction (139 | 20.9%), Retail Trade (97 | 14.6%), Health Care & Social Assistance (77 | 11.6%), and Administrative & Support (55 | 8.3%).
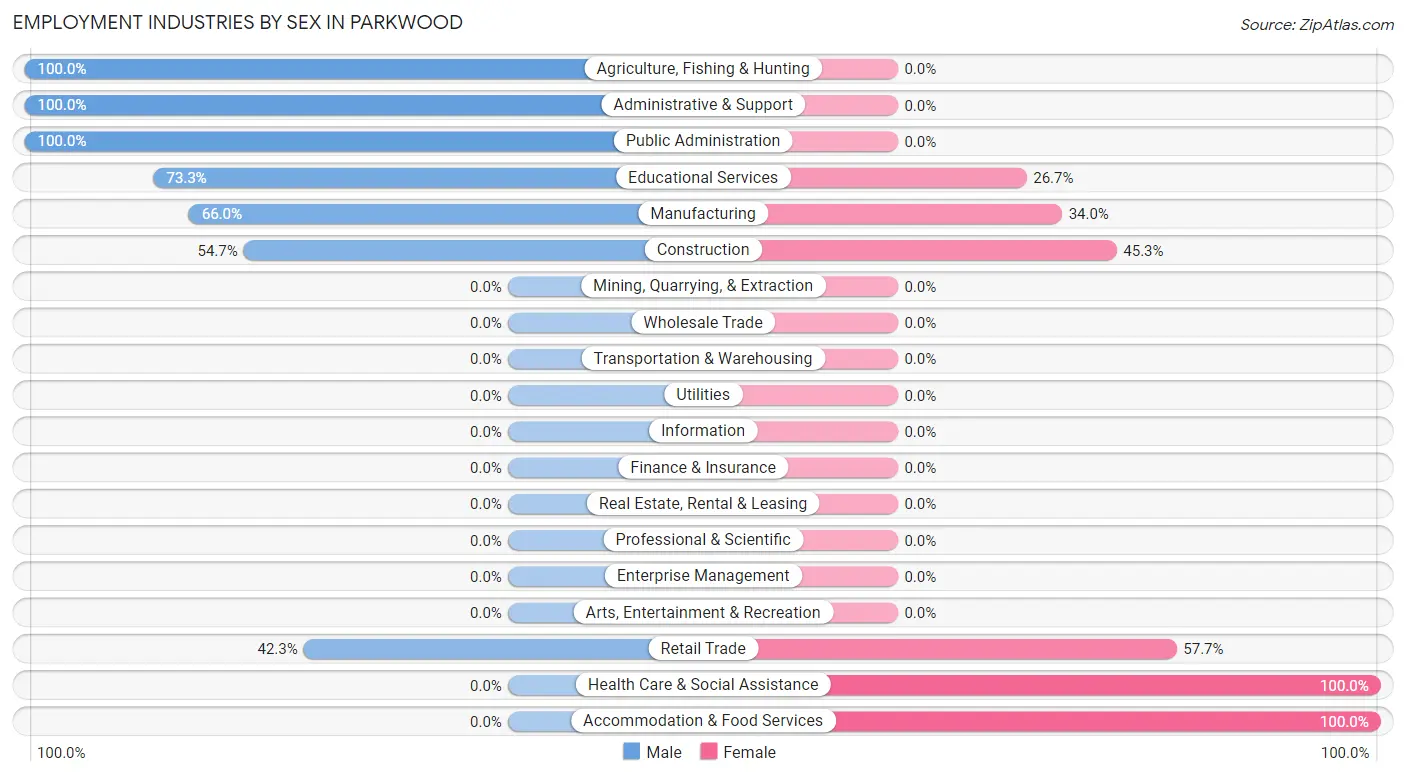
Employment Industries by Sex in Parkwood
The Parkwood industries that see more men than women are Agriculture, Fishing & Hunting (100.0%), Administrative & Support (100.0%), and Public Administration (100.0%), whereas the industries that tend to have a higher number of women are Health Care & Social Assistance (100.0%), Accommodation & Food Services (100.0%), and Retail Trade (57.7%).
| Industry | Male | Female |
| Agriculture, Fishing & Hunting | 41 (100.0%) | 0 (0.0%) |
| Mining, Quarrying, & Extraction | 0 (0.0%) | 0 (0.0%) |
| Construction | 76 (54.7%) | 63 (45.3%) |
| Manufacturing | 99 (66.0%) | 51 (34.0%) |
| Wholesale Trade | 0 (0.0%) | 0 (0.0%) |
| Retail Trade | 41 (42.3%) | 56 (57.7%) |
| Transportation & Warehousing | 0 (0.0%) | 0 (0.0%) |
| Utilities | 0 (0.0%) | 0 (0.0%) |
| Information | 0 (0.0%) | 0 (0.0%) |
| Finance & Insurance | 0 (0.0%) | 0 (0.0%) |
| Real Estate, Rental & Leasing | 0 (0.0%) | 0 (0.0%) |
| Professional & Scientific | 0 (0.0%) | 0 (0.0%) |
| Enterprise Management | 0 (0.0%) | 0 (0.0%) |
| Administrative & Support | 55 (100.0%) | 0 (0.0%) |
| Educational Services | 22 (73.3%) | 8 (26.7%) |
| Health Care & Social Assistance | 0 (0.0%) | 77 (100.0%) |
| Arts, Entertainment & Recreation | 0 (0.0%) | 0 (0.0%) |
| Accommodation & Food Services | 0 (0.0%) | 45 (100.0%) |
| Public Administration | 30 (100.0%) | 0 (0.0%) |
| Total | 364 (54.8%) | 300 (45.2%) |
Education in Parkwood
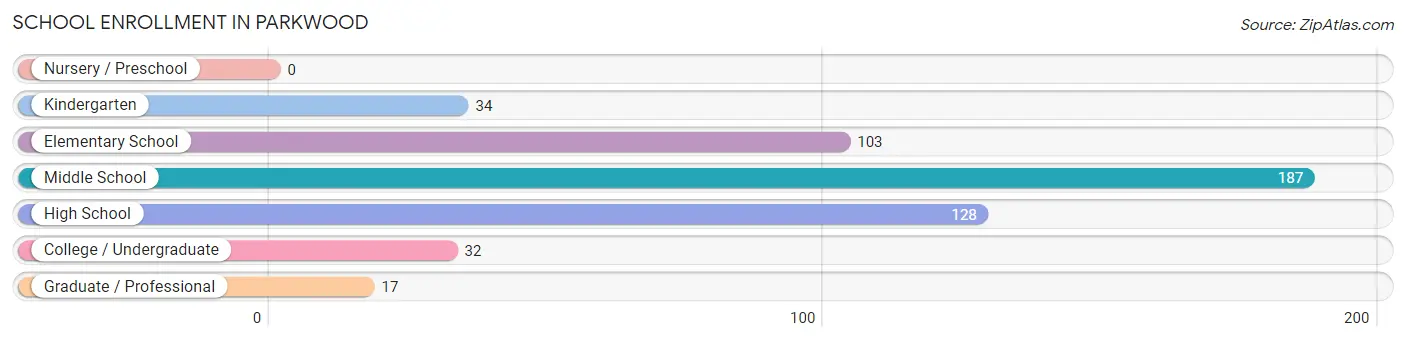
School Enrollment in Parkwood
The most common levels of schooling among the 501 students in Parkwood are middle school (187 | 37.3%), high school (128 | 25.6%), and elementary school (103 | 20.6%).
| School Level | # Students | % Students |
| Nursery / Preschool | 0 | 0.0% |
| Kindergarten | 34 | 6.8% |
| Elementary School | 103 | 20.6% |
| Middle School | 187 | 37.3% |
| High School | 128 | 25.6% |
| College / Undergraduate | 32 | 6.4% |
| Graduate / Professional | 17 | 3.4% |
| Total | 501 | 100.0% |
School Enrollment by Age by Funding Source in Parkwood
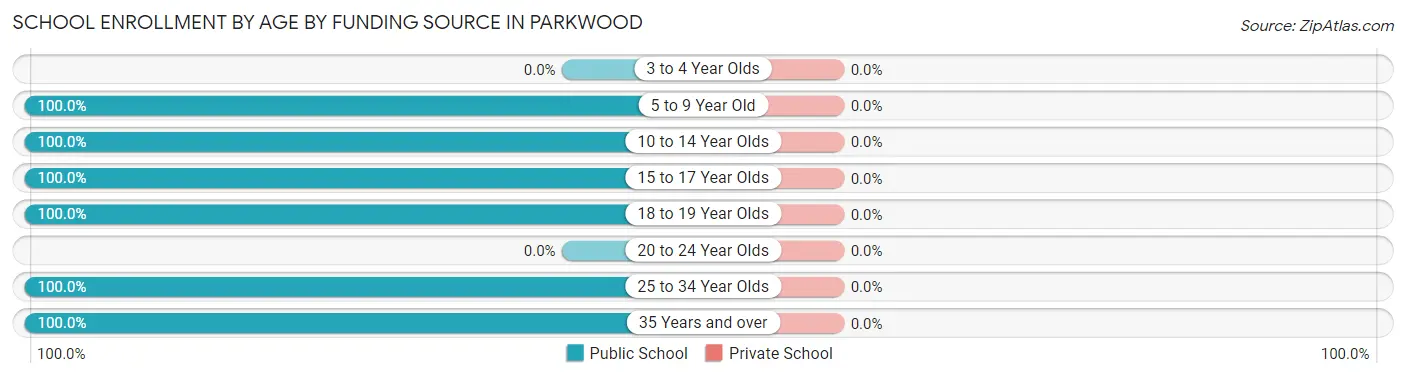
| Age Bracket | Public School | Private School |
| 3 to 4 Year Olds | 0 (0.0%) | 0 (0.0%) |
| 5 to 9 Year Old | 171 (100.0%) | 0 (0.0%) |
| 10 to 14 Year Olds | 190 (100.0%) | 0 (0.0%) |
| 15 to 17 Year Olds | 71 (100.0%) | 0 (0.0%) |
| 18 to 19 Year Olds | 20 (100.0%) | 0 (0.0%) |
| 20 to 24 Year Olds | 0 (0.0%) | 0 (0.0%) |
| 25 to 34 Year Olds | 36 (100.0%) | 0 (0.0%) |
| 35 Years and over | 13 (100.0%) | 0 (0.0%) |
| Total | 501 (100.0%) | 0 (0.0%) |
Educational Attainment by Field of Study in Parkwood
Business (30 | 43.5%), education (26 | 37.7%), and visual & performing arts (13 | 18.8%) are the most common fields of study among 69 individuals in Parkwood who have obtained a bachelor's degree or higher.
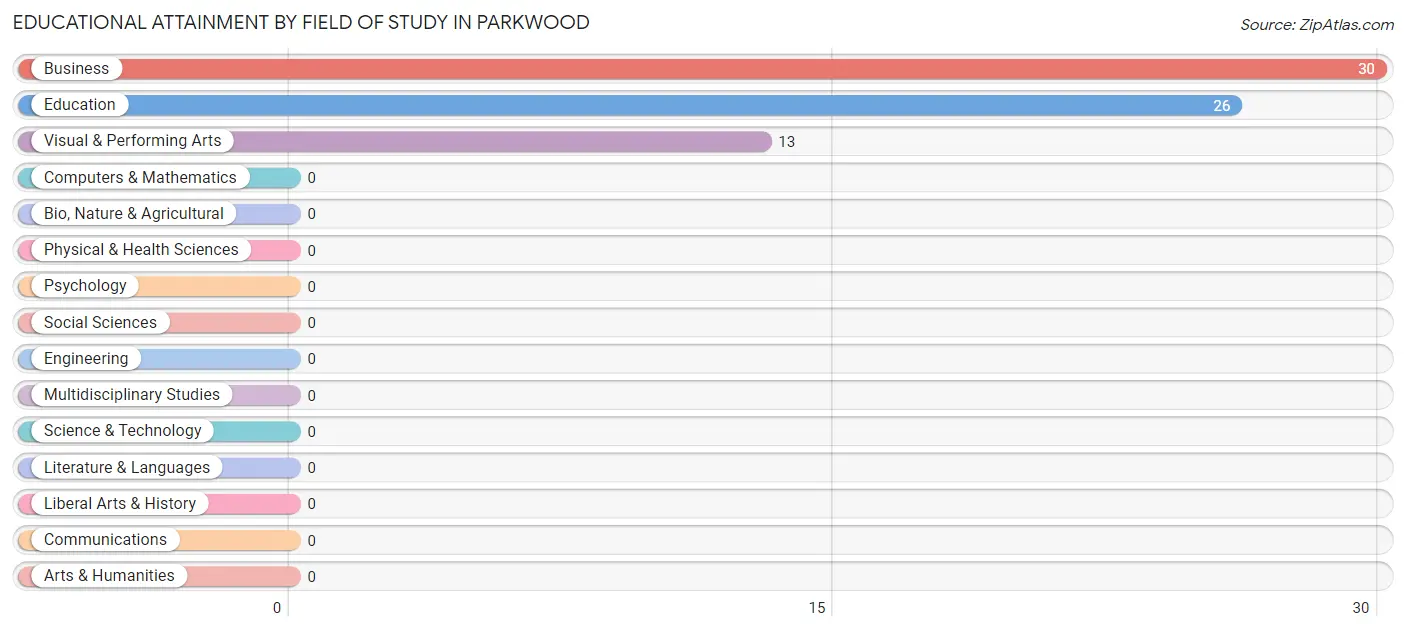
| Field of Study | # Graduates | % Graduates |
| Computers & Mathematics | 0 | 0.0% |
| Bio, Nature & Agricultural | 0 | 0.0% |
| Physical & Health Sciences | 0 | 0.0% |
| Psychology | 0 | 0.0% |
| Social Sciences | 0 | 0.0% |
| Engineering | 0 | 0.0% |
| Multidisciplinary Studies | 0 | 0.0% |
| Science & Technology | 0 | 0.0% |
| Business | 30 | 43.5% |
| Education | 26 | 37.7% |
| Literature & Languages | 0 | 0.0% |
| Liberal Arts & History | 0 | 0.0% |
| Visual & Performing Arts | 13 | 18.8% |
| Communications | 0 | 0.0% |
| Arts & Humanities | 0 | 0.0% |
| Total | 69 | 100.0% |
Transportation & Commute in Parkwood
Vehicle Availability by Sex in Parkwood
The most prevalent vehicle ownership categories in Parkwood are males with 2 vehicles (180, accounting for 49.4%) and females with 2 vehicles (37, making up 60.0%).
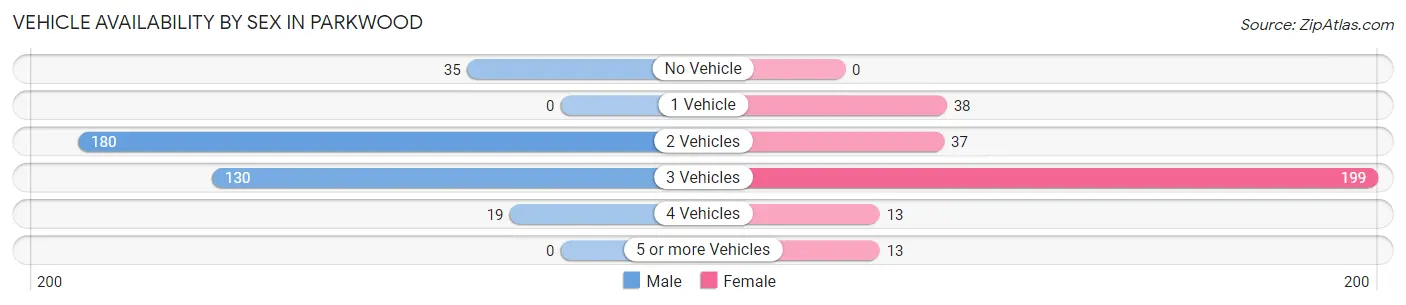
| Vehicles Available | Male | Female |
| No Vehicle | 35 (9.6%) | 0 (0.0%) |
| 1 Vehicle | 0 (0.0%) | 38 (12.7%) |
| 2 Vehicles | 180 (49.4%) | 37 (12.3%) |
| 3 Vehicles | 130 (35.7%) | 199 (66.3%) |
| 4 Vehicles | 19 (5.2%) | 13 (4.3%) |
| 5 or more Vehicles | 0 (0.0%) | 13 (4.3%) |
| Total | 364 (100.0%) | 300 (100.0%) |
Commute Time in Parkwood
The most frequently occuring commute durations in Parkwood are 10 to 14 minutes (223 commuters, 33.6%), 30 to 34 minutes (189 commuters, 28.5%), and 60 to 89 minutes (114 commuters, 17.2%).
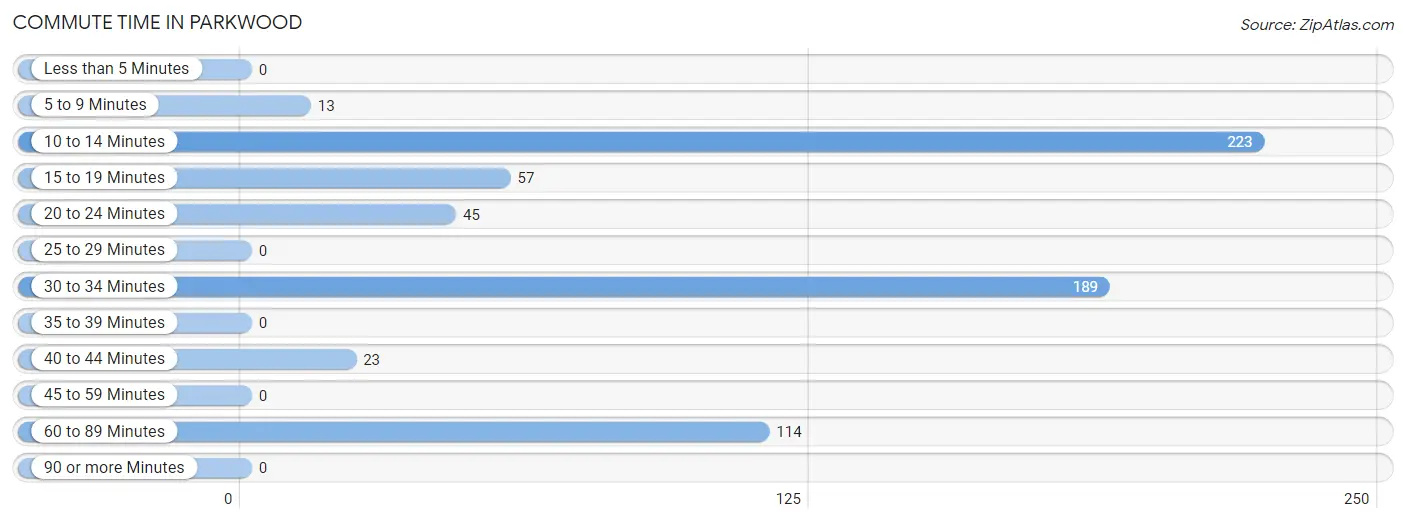
| Commute Time | # Commuters | % Commuters |
| Less than 5 Minutes | 0 | 0.0% |
| 5 to 9 Minutes | 13 | 2.0% |
| 10 to 14 Minutes | 223 | 33.6% |
| 15 to 19 Minutes | 57 | 8.6% |
| 20 to 24 Minutes | 45 | 6.8% |
| 25 to 29 Minutes | 0 | 0.0% |
| 30 to 34 Minutes | 189 | 28.5% |
| 35 to 39 Minutes | 0 | 0.0% |
| 40 to 44 Minutes | 23 | 3.5% |
| 45 to 59 Minutes | 0 | 0.0% |
| 60 to 89 Minutes | 114 | 17.2% |
| 90 or more Minutes | 0 | 0.0% |
Commute Time by Sex in Parkwood
The most common commute times in Parkwood are 10 to 14 minutes (117 commuters, 32.1%) for males and 10 to 14 minutes (106 commuters, 35.3%) for females.
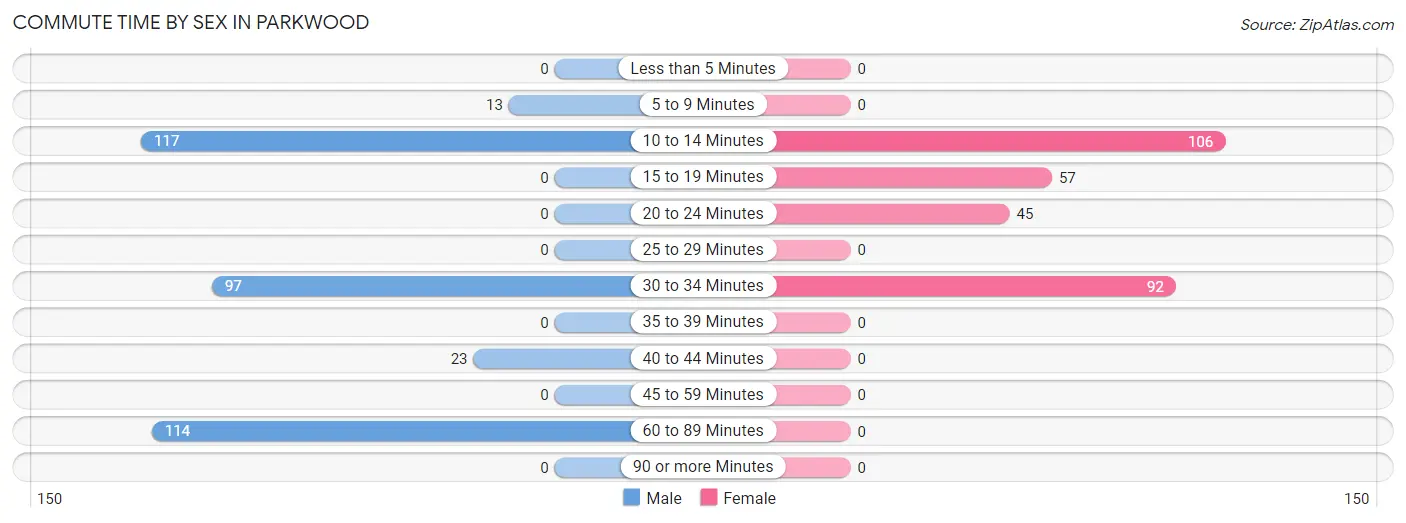
| Commute Time | Male | Female |
| Less than 5 Minutes | 0 (0.0%) | 0 (0.0%) |
| 5 to 9 Minutes | 13 (3.6%) | 0 (0.0%) |
| 10 to 14 Minutes | 117 (32.1%) | 106 (35.3%) |
| 15 to 19 Minutes | 0 (0.0%) | 57 (19.0%) |
| 20 to 24 Minutes | 0 (0.0%) | 45 (15.0%) |
| 25 to 29 Minutes | 0 (0.0%) | 0 (0.0%) |
| 30 to 34 Minutes | 97 (26.7%) | 92 (30.7%) |
| 35 to 39 Minutes | 0 (0.0%) | 0 (0.0%) |
| 40 to 44 Minutes | 23 (6.3%) | 0 (0.0%) |
| 45 to 59 Minutes | 0 (0.0%) | 0 (0.0%) |
| 60 to 89 Minutes | 114 (31.3%) | 0 (0.0%) |
| 90 or more Minutes | 0 (0.0%) | 0 (0.0%) |
Time of Departure to Work by Sex in Parkwood
The most frequent times of departure to work in Parkwood are 6:00 AM to 6:29 AM (112, 30.8%) for males and 5:30 AM to 5:59 AM (146, 48.7%) for females.
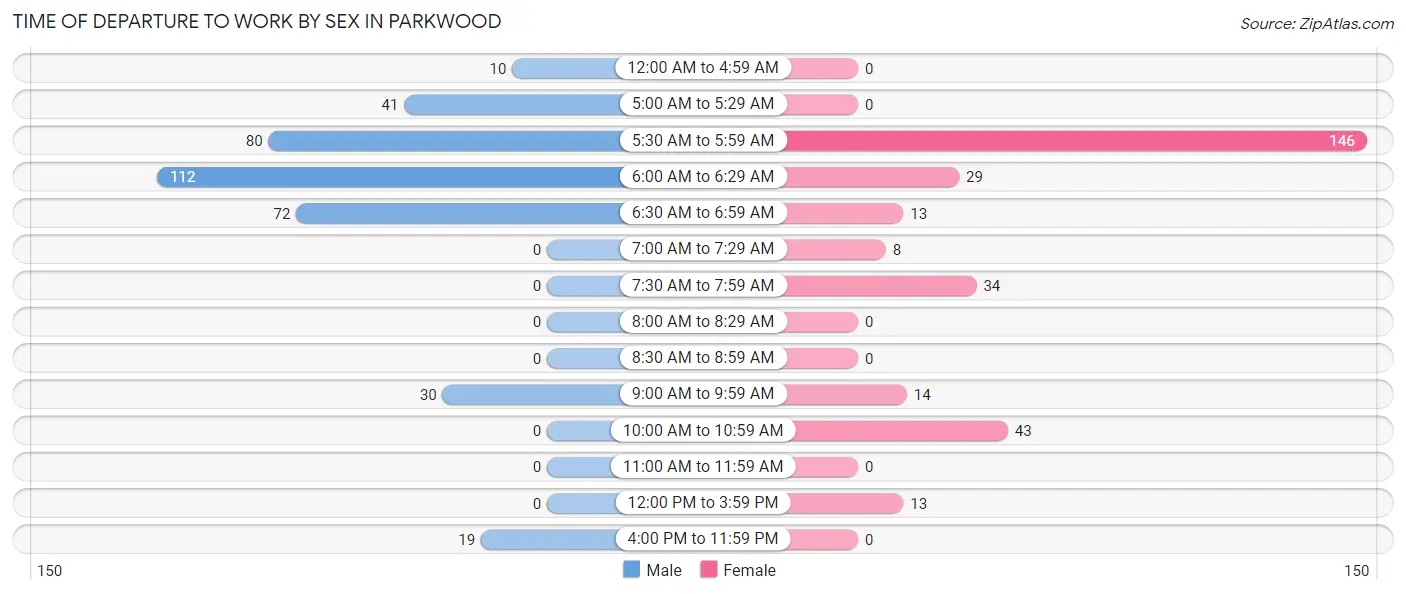
| Time of Departure | Male | Female |
| 12:00 AM to 4:59 AM | 10 (2.8%) | 0 (0.0%) |
| 5:00 AM to 5:29 AM | 41 (11.3%) | 0 (0.0%) |
| 5:30 AM to 5:59 AM | 80 (22.0%) | 146 (48.7%) |
| 6:00 AM to 6:29 AM | 112 (30.8%) | 29 (9.7%) |
| 6:30 AM to 6:59 AM | 72 (19.8%) | 13 (4.3%) |
| 7:00 AM to 7:29 AM | 0 (0.0%) | 8 (2.7%) |
| 7:30 AM to 7:59 AM | 0 (0.0%) | 34 (11.3%) |
| 8:00 AM to 8:29 AM | 0 (0.0%) | 0 (0.0%) |
| 8:30 AM to 8:59 AM | 0 (0.0%) | 0 (0.0%) |
| 9:00 AM to 9:59 AM | 30 (8.2%) | 14 (4.7%) |
| 10:00 AM to 10:59 AM | 0 (0.0%) | 43 (14.3%) |
| 11:00 AM to 11:59 AM | 0 (0.0%) | 0 (0.0%) |
| 12:00 PM to 3:59 PM | 0 (0.0%) | 13 (4.3%) |
| 4:00 PM to 11:59 PM | 19 (5.2%) | 0 (0.0%) |
| Total | 364 (100.0%) | 300 (100.0%) |
Housing Occupancy in Parkwood
Occupancy by Ownership in Parkwood
Of the total 501 dwellings in Parkwood, owner-occupied units account for 259 (51.7%), while renter-occupied units make up 242 (48.3%).
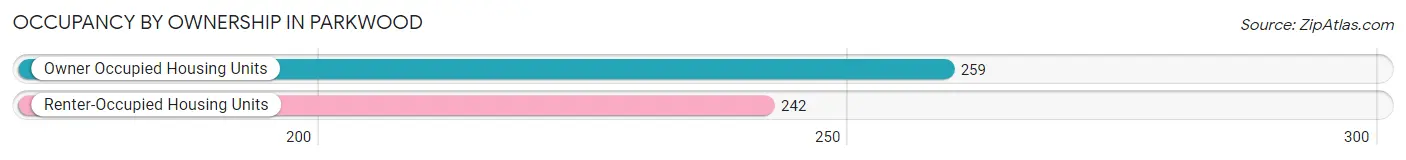
| Occupancy | # Housing Units | % Housing Units |
| Owner Occupied Housing Units | 259 | 51.7% |
| Renter-Occupied Housing Units | 242 | 48.3% |
| Total Occupied Housing Units | 501 | 100.0% |
Occupancy by Household Size in Parkwood
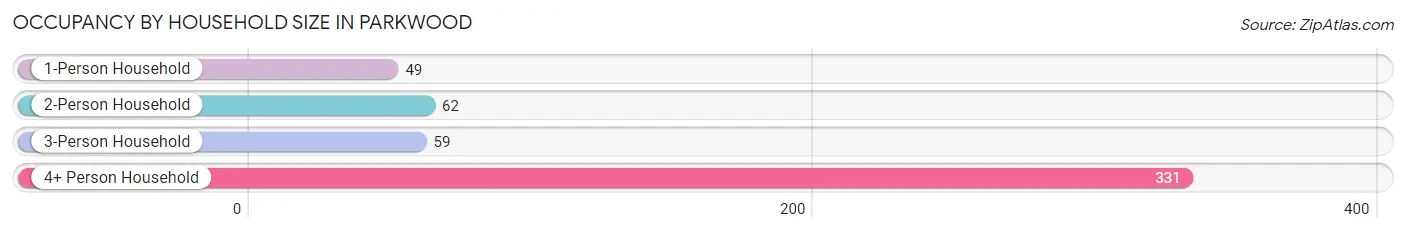
| Household Size | # Housing Units | % Housing Units |
| 1-Person Household | 49 | 9.8% |
| 2-Person Household | 62 | 12.4% |
| 3-Person Household | 59 | 11.8% |
| 4+ Person Household | 331 | 66.1% |
| Total Housing Units | 501 | 100.0% |
Occupancy by Ownership by Household Size in Parkwood
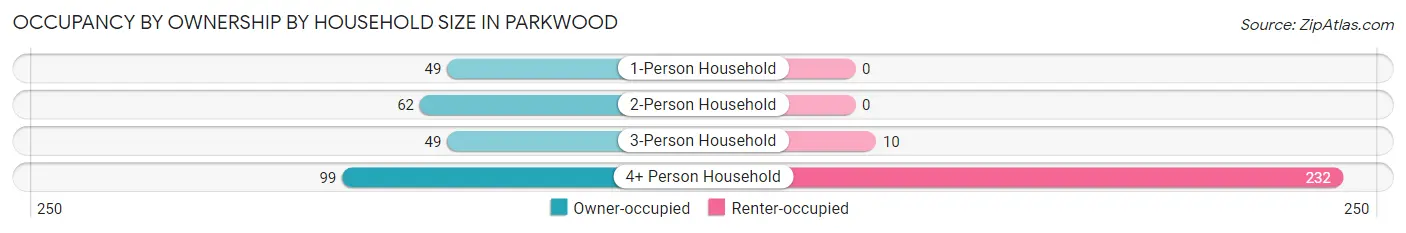
| Household Size | Owner-occupied | Renter-occupied |
| 1-Person Household | 49 (100.0%) | 0 (0.0%) |
| 2-Person Household | 62 (100.0%) | 0 (0.0%) |
| 3-Person Household | 49 (83.1%) | 10 (17.0%) |
| 4+ Person Household | 99 (29.9%) | 232 (70.1%) |
| Total Housing Units | 259 (51.7%) | 242 (48.3%) |
Occupancy by Educational Attainment in Parkwood
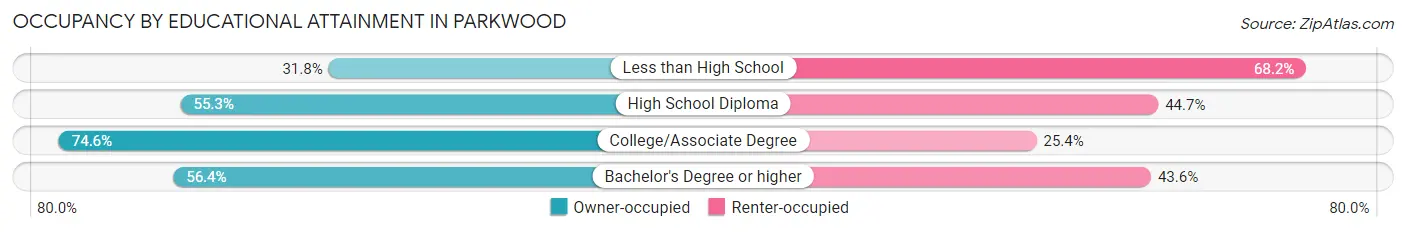
| Household Size | Owner-occupied | Renter-occupied |
| Less than High School | 69 (31.8%) | 148 (68.2%) |
| High School Diploma | 42 (55.3%) | 34 (44.7%) |
| College/Associate Degree | 126 (74.6%) | 43 (25.4%) |
| Bachelor's Degree or higher | 22 (56.4%) | 17 (43.6%) |
Occupancy by Age of Householder in Parkwood
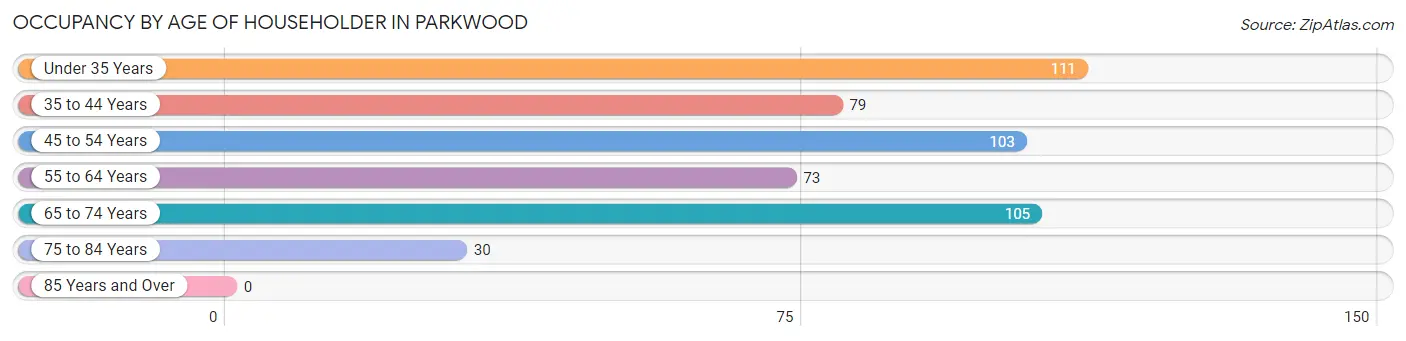
| Age Bracket | # Households | % Households |
| Under 35 Years | 111 | 22.2% |
| 35 to 44 Years | 79 | 15.8% |
| 45 to 54 Years | 103 | 20.6% |
| 55 to 64 Years | 73 | 14.6% |
| 65 to 74 Years | 105 | 21.0% |
| 75 to 84 Years | 30 | 6.0% |
| 85 Years and Over | 0 | 0.0% |
| Total | 501 | 100.0% |
Housing Finances in Parkwood
Median Income by Occupancy in Parkwood
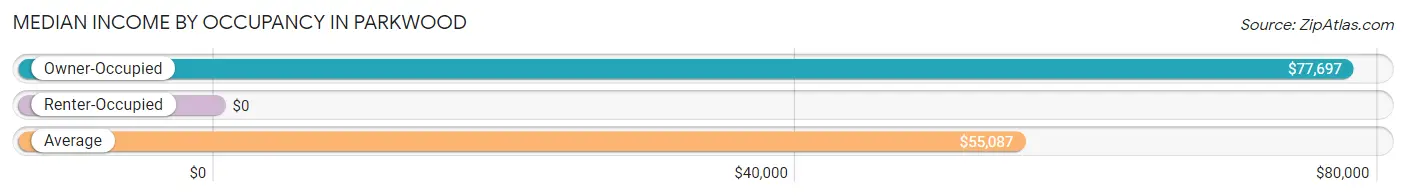
| Occupancy Type | # Households | Median Income |
| Owner-Occupied | 259 (51.7%) | $77,697 |
| Renter-Occupied | 242 (48.3%) | $0 |
| Average | 501 (100.0%) | $55,087 |
Occupancy by Householder Income Bracket in Parkwood
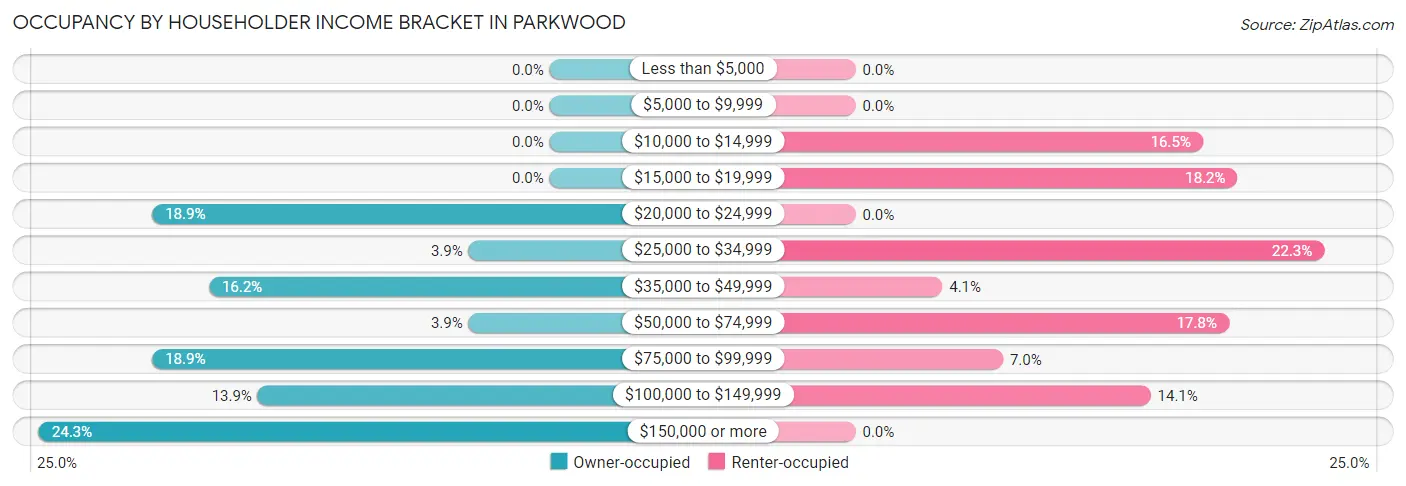
| Income Bracket | Owner-occupied | Renter-occupied |
| Less than $5,000 | 0 (0.0%) | 0 (0.0%) |
| $5,000 to $9,999 | 0 (0.0%) | 0 (0.0%) |
| $10,000 to $14,999 | 0 (0.0%) | 40 (16.5%) |
| $15,000 to $19,999 | 0 (0.0%) | 44 (18.2%) |
| $20,000 to $24,999 | 49 (18.9%) | 0 (0.0%) |
| $25,000 to $34,999 | 10 (3.9%) | 54 (22.3%) |
| $35,000 to $49,999 | 42 (16.2%) | 10 (4.1%) |
| $50,000 to $74,999 | 10 (3.9%) | 43 (17.8%) |
| $75,000 to $99,999 | 49 (18.9%) | 17 (7.0%) |
| $100,000 to $149,999 | 36 (13.9%) | 34 (14.1%) |
| $150,000 or more | 63 (24.3%) | 0 (0.0%) |
| Total | 259 (100.0%) | 242 (100.0%) |
Monthly Housing Cost Tiers in Parkwood
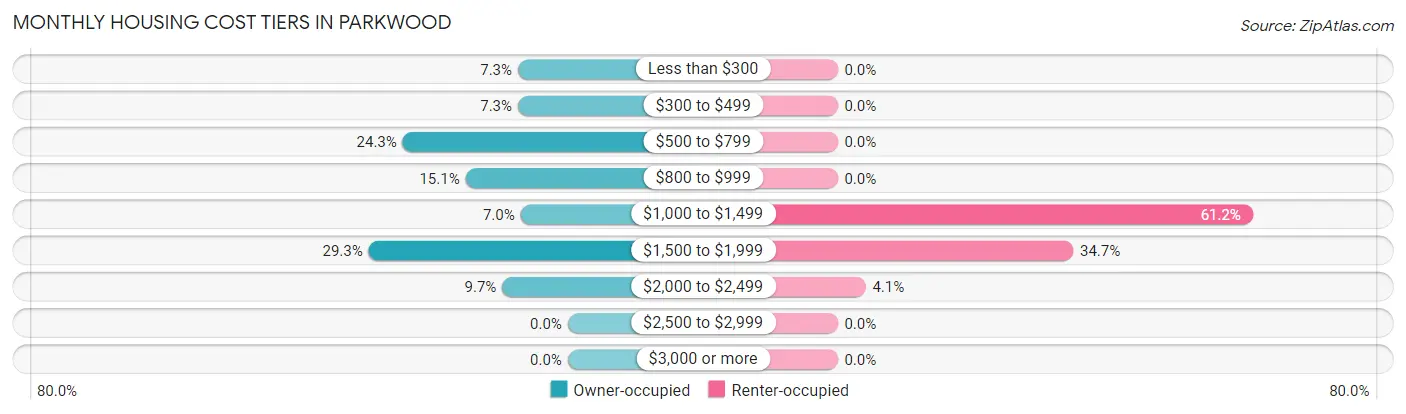
| Monthly Cost | Owner-occupied | Renter-occupied |
| Less than $300 | 19 (7.3%) | 0 (0.0%) |
| $300 to $499 | 19 (7.3%) | 0 (0.0%) |
| $500 to $799 | 63 (24.3%) | 0 (0.0%) |
| $800 to $999 | 39 (15.1%) | 0 (0.0%) |
| $1,000 to $1,499 | 18 (7.0%) | 148 (61.2%) |
| $1,500 to $1,999 | 76 (29.3%) | 84 (34.7%) |
| $2,000 to $2,499 | 25 (9.7%) | 10 (4.1%) |
| $2,500 to $2,999 | 0 (0.0%) | 0 (0.0%) |
| $3,000 or more | 0 (0.0%) | 0 (0.0%) |
| Total | 259 (100.0%) | 242 (100.0%) |
Physical Housing Characteristics in Parkwood
Housing Structures in Parkwood
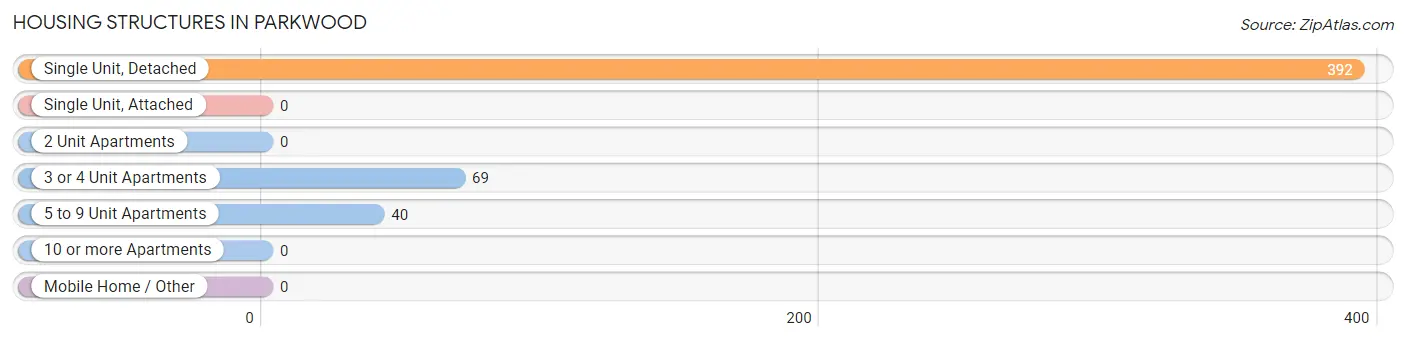
| Structure Type | # Housing Units | % Housing Units |
| Single Unit, Detached | 392 | 78.2% |
| Single Unit, Attached | 0 | 0.0% |
| 2 Unit Apartments | 0 | 0.0% |
| 3 or 4 Unit Apartments | 69 | 13.8% |
| 5 to 9 Unit Apartments | 40 | 8.0% |
| 10 or more Apartments | 0 | 0.0% |
| Mobile Home / Other | 0 | 0.0% |
| Total | 501 | 100.0% |
Housing Structures by Occupancy in Parkwood
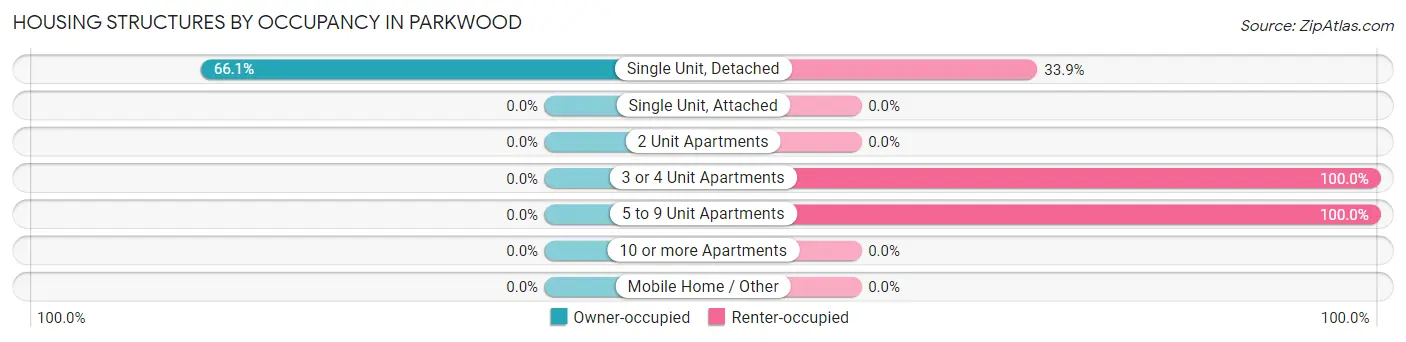
| Structure Type | Owner-occupied | Renter-occupied |
| Single Unit, Detached | 259 (66.1%) | 133 (33.9%) |
| Single Unit, Attached | 0 (0.0%) | 0 (0.0%) |
| 2 Unit Apartments | 0 (0.0%) | 0 (0.0%) |
| 3 or 4 Unit Apartments | 0 (0.0%) | 69 (100.0%) |
| 5 to 9 Unit Apartments | 0 (0.0%) | 40 (100.0%) |
| 10 or more Apartments | 0 (0.0%) | 0 (0.0%) |
| Mobile Home / Other | 0 (0.0%) | 0 (0.0%) |
| Total | 259 (51.7%) | 242 (48.3%) |
Housing Structures by Number of Rooms in Parkwood
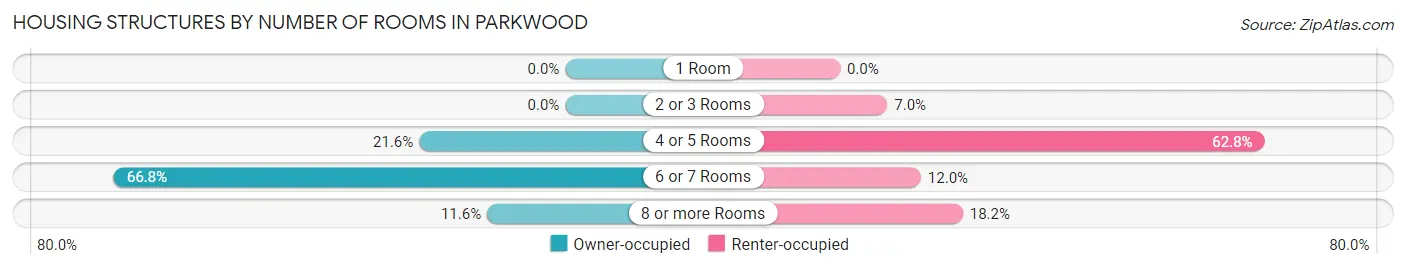
| Number of Rooms | Owner-occupied | Renter-occupied |
| 1 Room | 0 (0.0%) | 0 (0.0%) |
| 2 or 3 Rooms | 0 (0.0%) | 17 (7.0%) |
| 4 or 5 Rooms | 56 (21.6%) | 152 (62.8%) |
| 6 or 7 Rooms | 173 (66.8%) | 29 (12.0%) |
| 8 or more Rooms | 30 (11.6%) | 44 (18.2%) |
| Total | 259 (100.0%) | 242 (100.0%) |
Housing Structure by Heating Type in Parkwood
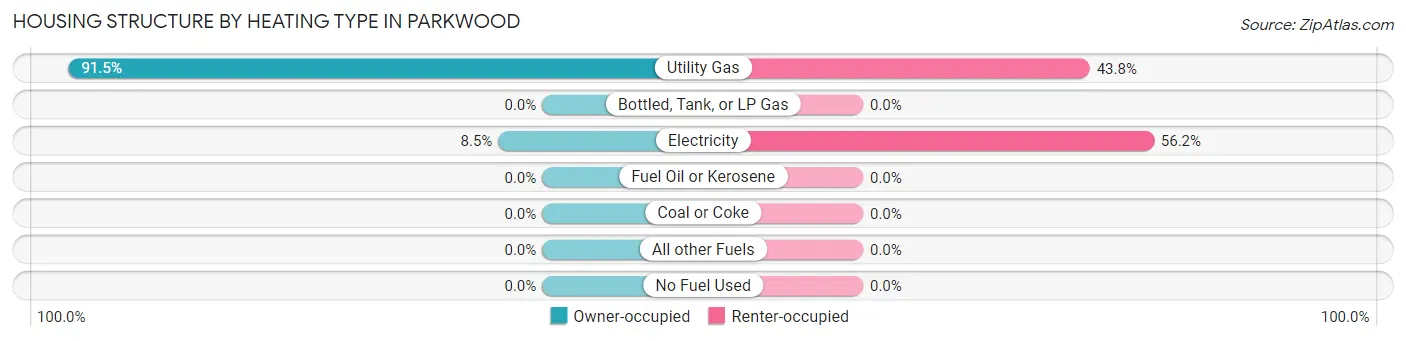
| Heating Type | Owner-occupied | Renter-occupied |
| Utility Gas | 237 (91.5%) | 106 (43.8%) |
| Bottled, Tank, or LP Gas | 0 (0.0%) | 0 (0.0%) |
| Electricity | 22 (8.5%) | 136 (56.2%) |
| Fuel Oil or Kerosene | 0 (0.0%) | 0 (0.0%) |
| Coal or Coke | 0 (0.0%) | 0 (0.0%) |
| All other Fuels | 0 (0.0%) | 0 (0.0%) |
| No Fuel Used | 0 (0.0%) | 0 (0.0%) |
| Total | 259 (100.0%) | 242 (100.0%) |
Household Vehicle Usage in Parkwood
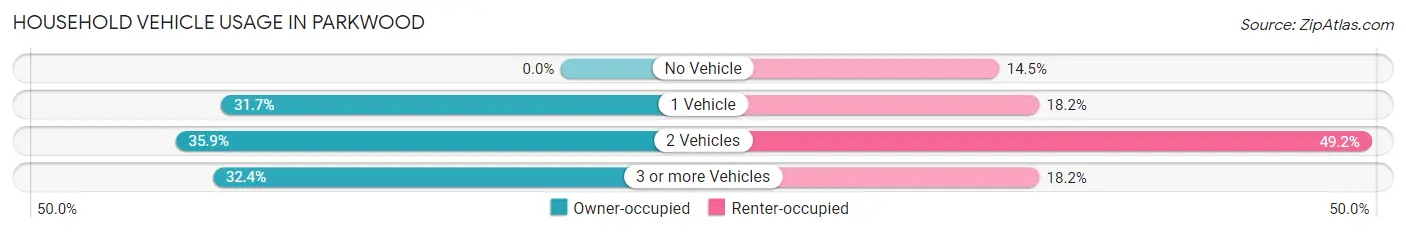
| Vehicles per Household | Owner-occupied | Renter-occupied |
| No Vehicle | 0 (0.0%) | 35 (14.5%) |
| 1 Vehicle | 82 (31.7%) | 44 (18.2%) |
| 2 Vehicles | 93 (35.9%) | 119 (49.2%) |
| 3 or more Vehicles | 84 (32.4%) | 44 (18.2%) |
| Total | 259 (100.0%) | 242 (100.0%) |
Real Estate & Mortgages in Parkwood
Real Estate and Mortgage Overview in Parkwood
| Characteristic | Without Mortgage | With Mortgage |
| Housing Units | 112 | 147 |
| Median Property Value | $106,700 | $246,100 |
| Median Household Income | - | - |
| Monthly Housing Costs | $529 | $0 |
| Real Estate Taxes | $1,189 | $0 |
Property Value by Mortgage Status in Parkwood
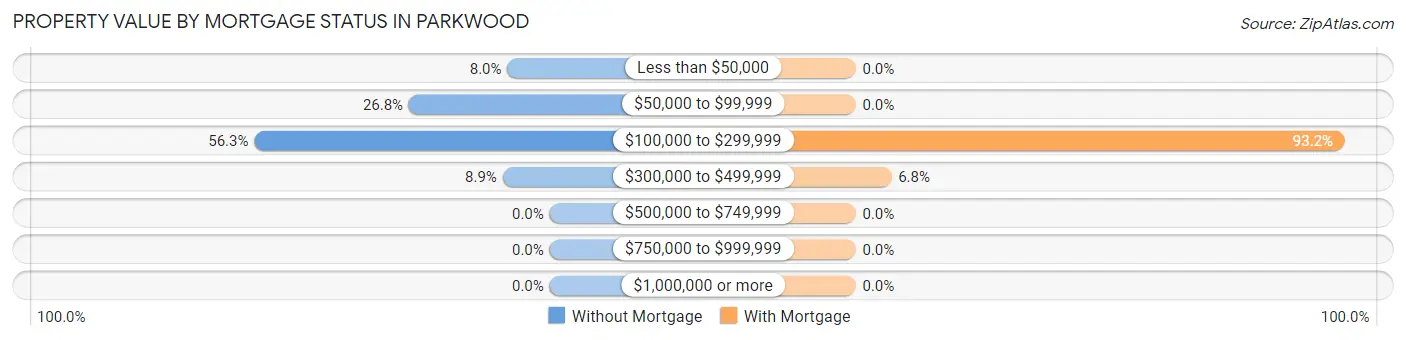
| Property Value | Without Mortgage | With Mortgage |
| Less than $50,000 | 9 (8.0%) | 0 (0.0%) |
| $50,000 to $99,999 | 30 (26.8%) | 0 (0.0%) |
| $100,000 to $299,999 | 63 (56.2%) | 137 (93.2%) |
| $300,000 to $499,999 | 10 (8.9%) | 10 (6.8%) |
| $500,000 to $749,999 | 0 (0.0%) | 0 (0.0%) |
| $750,000 to $999,999 | 0 (0.0%) | 0 (0.0%) |
| $1,000,000 or more | 0 (0.0%) | 0 (0.0%) |
| Total | 112 (100.0%) | 147 (100.0%) |
Household Income by Mortgage Status in Parkwood
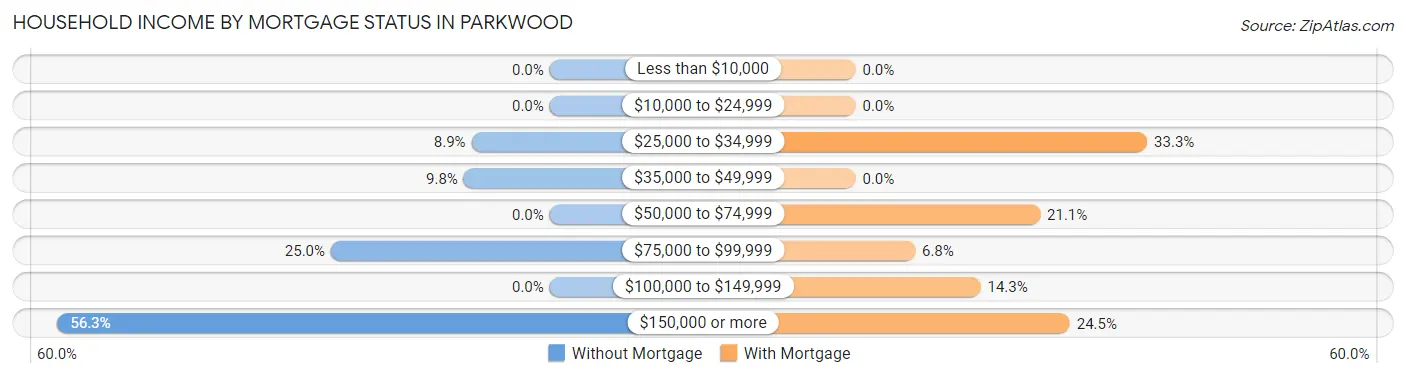
| Household Income | Without Mortgage | With Mortgage |
| Less than $10,000 | 0 (0.0%) | 0 (0.0%) |
| $10,000 to $24,999 | 0 (0.0%) | 0 (0.0%) |
| $25,000 to $34,999 | 10 (8.9%) | 49 (33.3%) |
| $35,000 to $49,999 | 11 (9.8%) | 0 (0.0%) |
| $50,000 to $74,999 | 0 (0.0%) | 31 (21.1%) |
| $75,000 to $99,999 | 28 (25.0%) | 10 (6.8%) |
| $100,000 to $149,999 | 0 (0.0%) | 21 (14.3%) |
| $150,000 or more | 63 (56.2%) | 36 (24.5%) |
| Total | 112 (100.0%) | 147 (100.0%) |
Property Value to Household Income Ratio in Parkwood
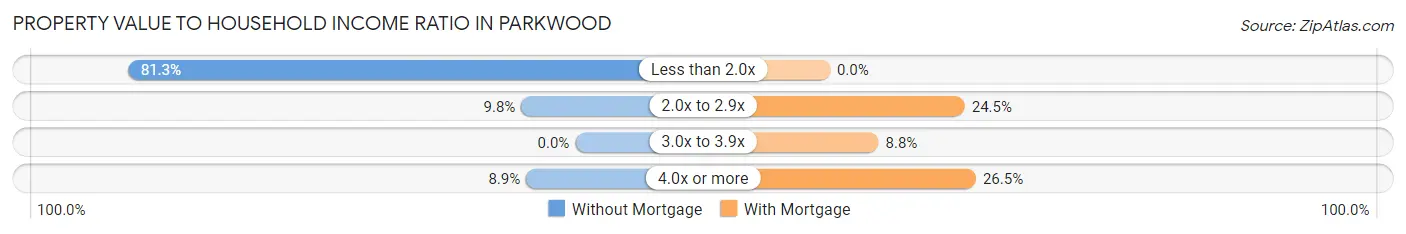
| Value-to-Income Ratio | Without Mortgage | With Mortgage |
| Less than 2.0x | 91 (81.2%) | 0 (0.0%) |
| 2.0x to 2.9x | 11 (9.8%) | 36 (24.5%) |
| 3.0x to 3.9x | 0 (0.0%) | 13 (8.8%) |
| 4.0x or more | 10 (8.9%) | 39 (26.5%) |
| Total | 112 (100.0%) | 147 (100.0%) |
Real Estate Taxes by Mortgage Status in Parkwood
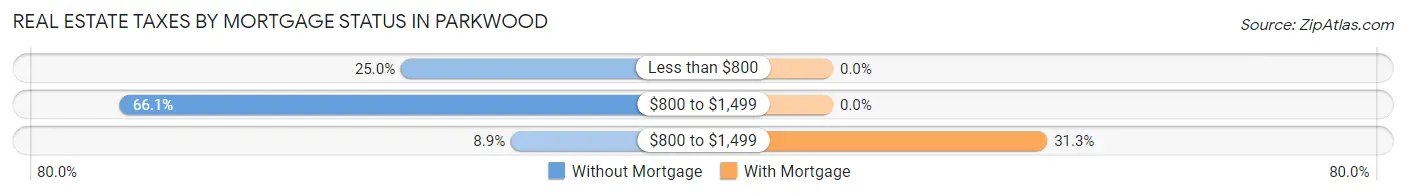
| Property Taxes | Without Mortgage | With Mortgage |
| Less than $800 | 28 (25.0%) | 0 (0.0%) |
| $800 to $1,499 | 74 (66.1%) | 0 (0.0%) |
| $800 to $1,499 | 10 (8.9%) | 46 (31.3%) |
| Total | 112 (100.0%) | 147 (100.0%) |
Health & Disability in Parkwood
Health Insurance Coverage by Age in Parkwood
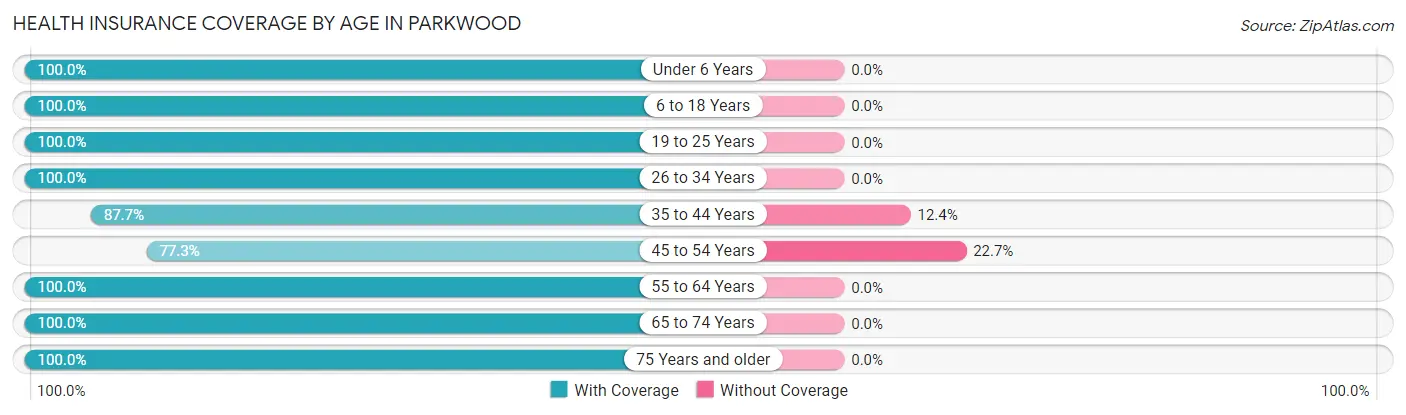
| Age Bracket | With Coverage | Without Coverage |
| Under 6 Years | 281 (100.0%) | 0 (0.0%) |
| 6 to 18 Years | 437 (100.0%) | 0 (0.0%) |
| 19 to 25 Years | 185 (100.0%) | 0 (0.0%) |
| 26 to 34 Years | 438 (100.0%) | 0 (0.0%) |
| 35 to 44 Years | 149 (87.6%) | 21 (12.3%) |
| 45 to 54 Years | 136 (77.3%) | 40 (22.7%) |
| 55 to 64 Years | 180 (100.0%) | 0 (0.0%) |
| 65 to 74 Years | 176 (100.0%) | 0 (0.0%) |
| 75 Years and older | 30 (100.0%) | 0 (0.0%) |
| Total | 2,012 (97.1%) | 61 (2.9%) |
Health Insurance Coverage by Citizenship Status in Parkwood
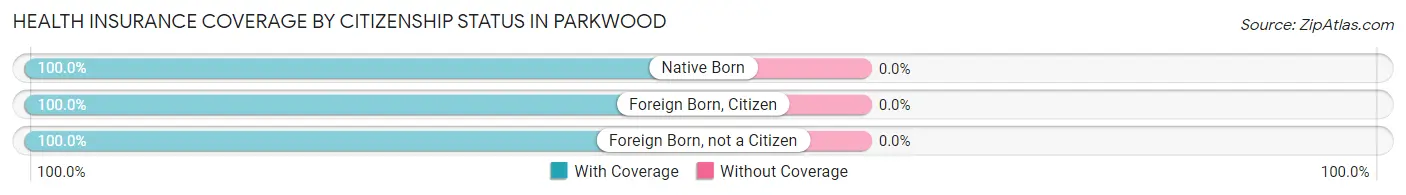
| Citizenship Status | With Coverage | Without Coverage |
| Native Born | 281 (100.0%) | 0 (0.0%) |
| Foreign Born, Citizen | 437 (100.0%) | 0 (0.0%) |
| Foreign Born, not a Citizen | 185 (100.0%) | 0 (0.0%) |
Health Insurance Coverage by Household Income in Parkwood
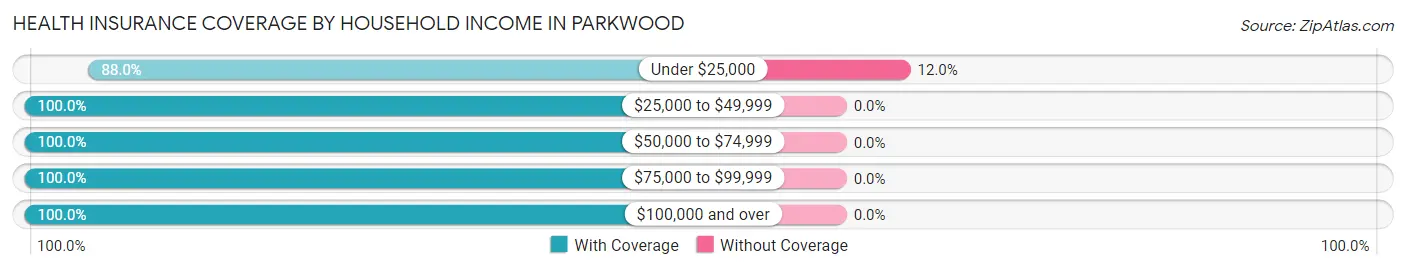
| Household Income | With Coverage | Without Coverage |
| Under $25,000 | 449 (88.0%) | 61 (12.0%) |
| $25,000 to $49,999 | 364 (100.0%) | 0 (0.0%) |
| $50,000 to $74,999 | 151 (100.0%) | 0 (0.0%) |
| $75,000 to $99,999 | 272 (100.0%) | 0 (0.0%) |
| $100,000 and over | 776 (100.0%) | 0 (0.0%) |
Public vs Private Health Insurance Coverage by Age in Parkwood
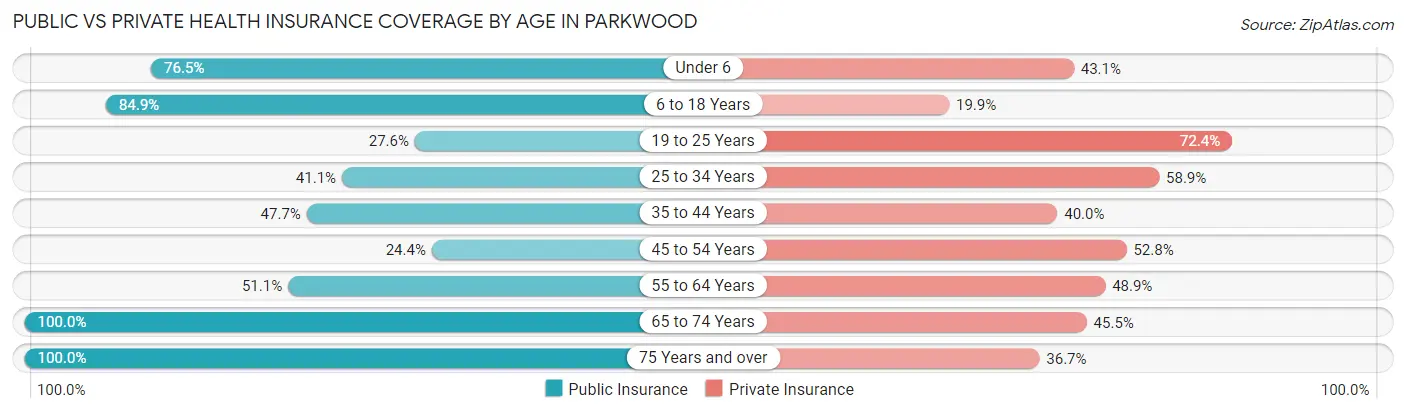
| Age Bracket | Public Insurance | Private Insurance |
| Under 6 | 215 (76.5%) | 121 (43.1%) |
| 6 to 18 Years | 371 (84.9%) | 87 (19.9%) |
| 19 to 25 Years | 51 (27.6%) | 134 (72.4%) |
| 25 to 34 Years | 180 (41.1%) | 258 (58.9%) |
| 35 to 44 Years | 81 (47.6%) | 68 (40.0%) |
| 45 to 54 Years | 43 (24.4%) | 93 (52.8%) |
| 55 to 64 Years | 92 (51.1%) | 88 (48.9%) |
| 65 to 74 Years | 176 (100.0%) | 80 (45.5%) |
| 75 Years and over | 30 (100.0%) | 11 (36.7%) |
| Total | 1,239 (59.8%) | 940 (45.3%) |
Disability Status by Sex by Age in Parkwood
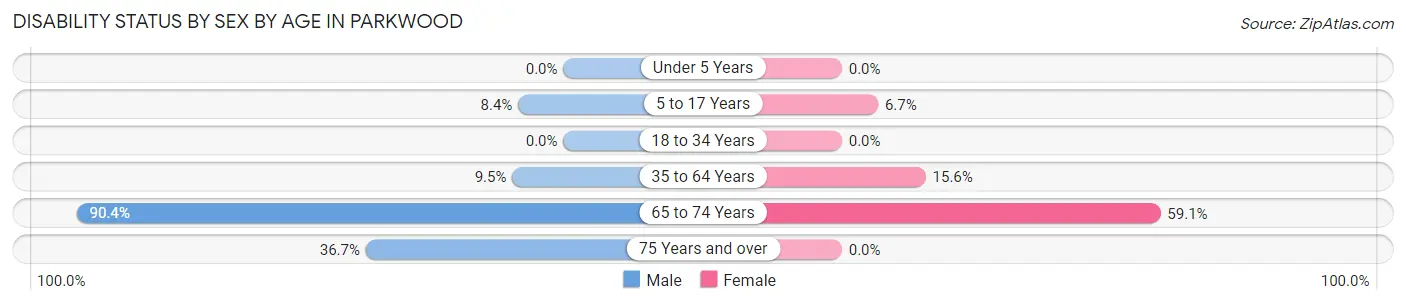
| Age Bracket | Male | Female |
| Under 5 Years | 0 (0.0%) | 0 (0.0%) |
| 5 to 17 Years | 15 (8.4%) | 17 (6.7%) |
| 18 to 34 Years | 0 (0.0%) | 0 (0.0%) |
| 35 to 64 Years | 20 (9.5%) | 49 (15.6%) |
| 65 to 74 Years | 75 (90.4%) | 55 (59.1%) |
| 75 Years and over | 11 (36.7%) | 0 (0.0%) |
Disability Class by Sex by Age in Parkwood
Disability Class: Hearing Difficulty
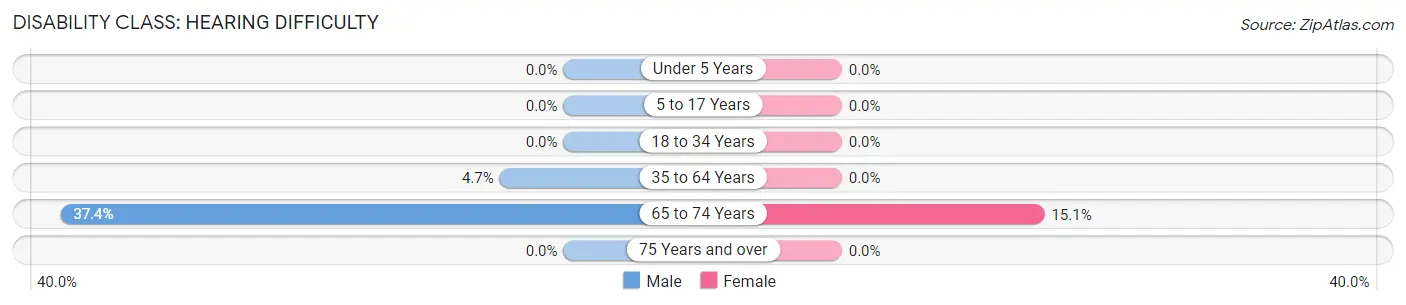
| Age Bracket | Male | Female |
| Under 5 Years | 0 (0.0%) | 0 (0.0%) |
| 5 to 17 Years | 0 (0.0%) | 0 (0.0%) |
| 18 to 34 Years | 0 (0.0%) | 0 (0.0%) |
| 35 to 64 Years | 10 (4.7%) | 0 (0.0%) |
| 65 to 74 Years | 31 (37.3%) | 14 (15.0%) |
| 75 Years and over | 0 (0.0%) | 0 (0.0%) |
Disability Class: Vision Difficulty
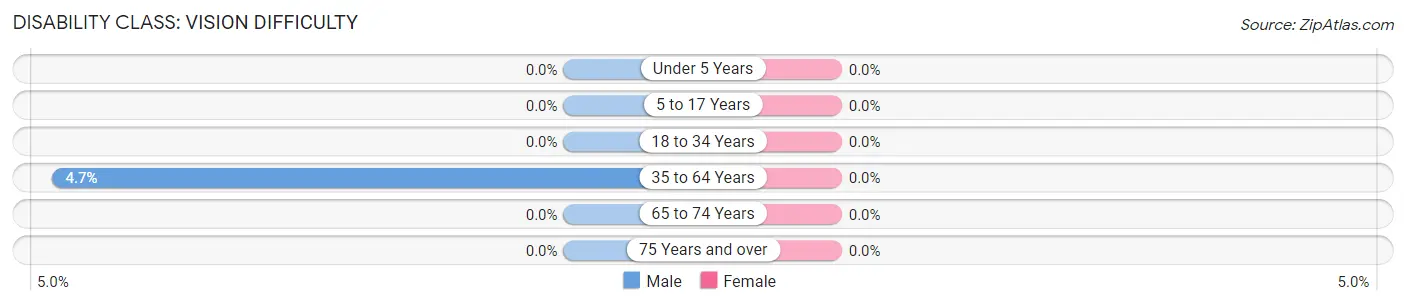
| Age Bracket | Male | Female |
| Under 5 Years | 0 (0.0%) | 0 (0.0%) |
| 5 to 17 Years | 0 (0.0%) | 0 (0.0%) |
| 18 to 34 Years | 0 (0.0%) | 0 (0.0%) |
| 35 to 64 Years | 10 (4.7%) | 0 (0.0%) |
| 65 to 74 Years | 0 (0.0%) | 0 (0.0%) |
| 75 Years and over | 0 (0.0%) | 0 (0.0%) |
Disability Class: Cognitive Difficulty
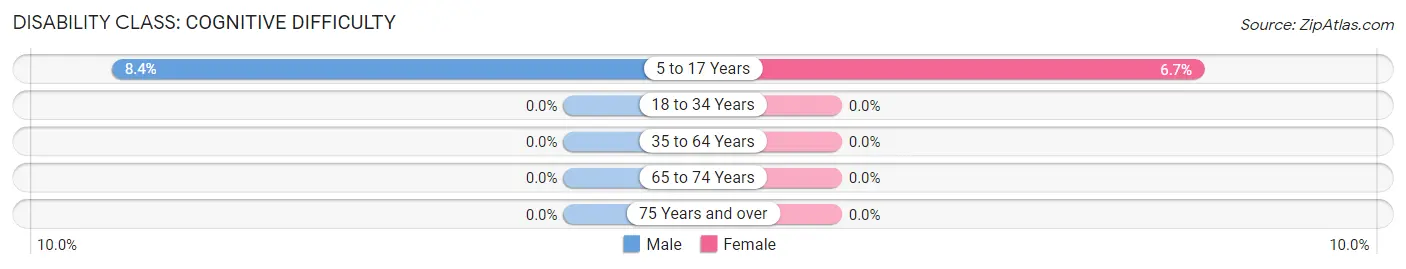
| Age Bracket | Male | Female |
| 5 to 17 Years | 15 (8.4%) | 17 (6.7%) |
| 18 to 34 Years | 0 (0.0%) | 0 (0.0%) |
| 35 to 64 Years | 0 (0.0%) | 0 (0.0%) |
| 65 to 74 Years | 0 (0.0%) | 0 (0.0%) |
| 75 Years and over | 0 (0.0%) | 0 (0.0%) |
Disability Class: Ambulatory Difficulty
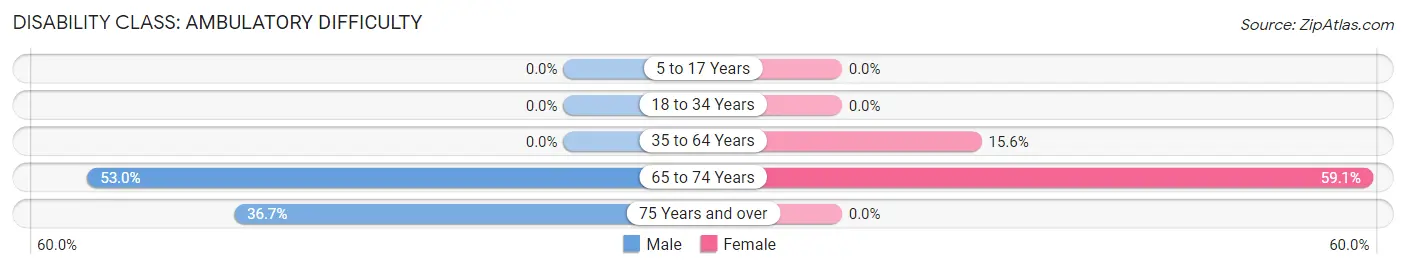
| Age Bracket | Male | Female |
| 5 to 17 Years | 0 (0.0%) | 0 (0.0%) |
| 18 to 34 Years | 0 (0.0%) | 0 (0.0%) |
| 35 to 64 Years | 0 (0.0%) | 49 (15.6%) |
| 65 to 74 Years | 44 (53.0%) | 55 (59.1%) |
| 75 Years and over | 11 (36.7%) | 0 (0.0%) |
Disability Class: Self-Care Difficulty
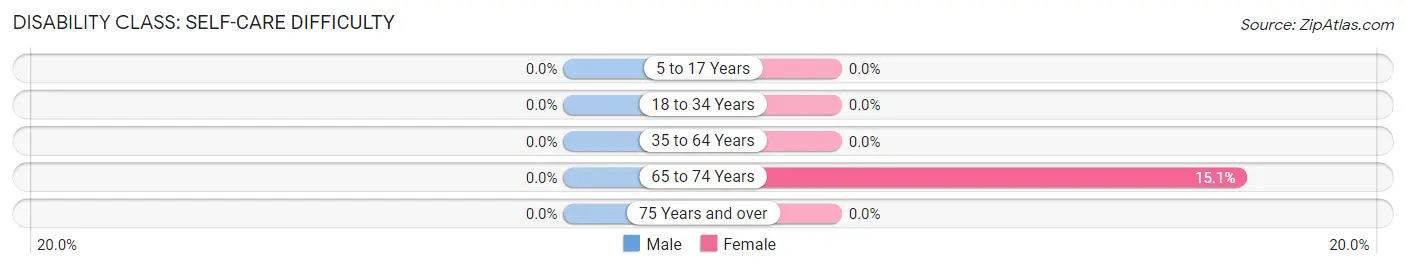
| Age Bracket | Male | Female |
| 5 to 17 Years | 0 (0.0%) | 0 (0.0%) |
| 18 to 34 Years | 0 (0.0%) | 0 (0.0%) |
| 35 to 64 Years | 0 (0.0%) | 0 (0.0%) |
| 65 to 74 Years | 0 (0.0%) | 14 (15.0%) |
| 75 Years and over | 0 (0.0%) | 0 (0.0%) |
Technology Access in Parkwood
Computing Device Access in Parkwood
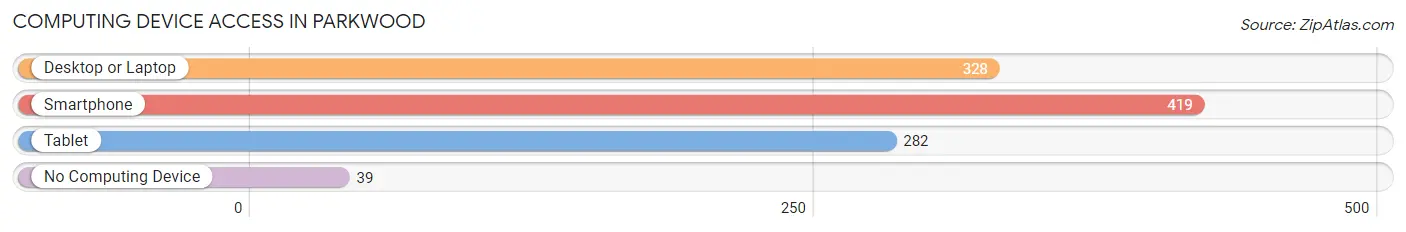
| Device Type | # Households | % Households |
| Desktop or Laptop | 328 | 65.5% |
| Smartphone | 419 | 83.6% |
| Tablet | 282 | 56.3% |
| No Computing Device | 39 | 7.8% |
| Total | 501 | 100.0% |
Internet Access in Parkwood
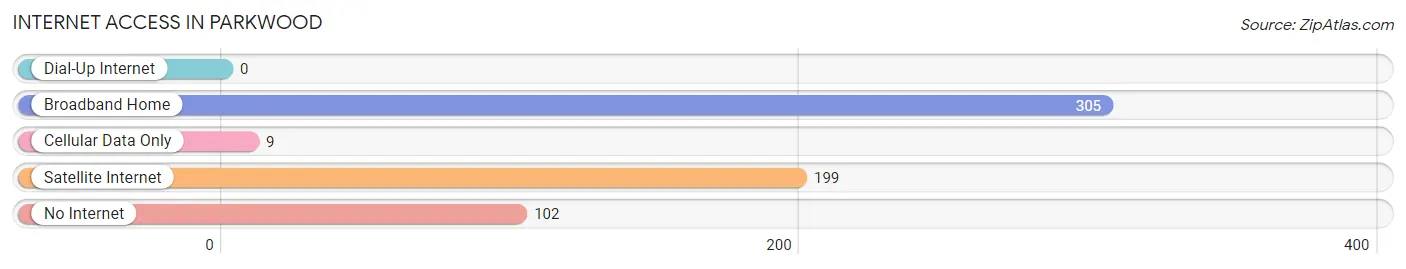
| Internet Type | # Households | % Households |
| Dial-Up Internet | 0 | 0.0% |
| Broadband Home | 305 | 60.9% |
| Cellular Data Only | 9 | 1.8% |
| Satellite Internet | 199 | 39.7% |
| No Internet | 102 | 20.4% |
| Total | 501 | 100.0% |
Parkwood Summary
Parkwood is a small unincorporated community located in the foothills of the Sierra Nevada Mountains in El Dorado County, California. It is situated in the Sierra Nevada foothills, approximately 25 miles east of Placerville and 40 miles northeast of Sacramento. Parkwood is a rural community with a population of approximately 1,000 people.
History
Parkwood was originally settled in the late 1800s by miners and loggers who were attracted to the area by the abundance of timber and gold. The town was named after the Parkwood Lumber Company, which was founded in the area in 1887. The company was responsible for the construction of the first sawmill in the area, which was located on the banks of the South Fork of the American River. The sawmill was used to process the timber harvested from the surrounding forests.
In the early 1900s, the town began to grow as more people moved to the area to take advantage of the abundant natural resources. The town was incorporated in 1912 and the first post office was established in 1913. The town was home to a variety of businesses, including a general store, a blacksmith shop, a hotel, and a saloon.
Geography
Parkwood is located in the Sierra Nevada foothills, approximately 25 miles east of Placerville and 40 miles northeast of Sacramento. The town is situated at an elevation of 2,400 feet and is surrounded by rolling hills and forests. The South Fork of the American River runs through the town and is a popular destination for fishing and rafting.
The climate in Parkwood is mild and temperate, with hot summers and cool winters. The average annual temperature is around 60 degrees Fahrenheit and the average annual precipitation is around 30 inches.
Economy
The economy of Parkwood is largely based on tourism and recreation. The town is home to several campgrounds, hiking trails, and fishing spots, which attract visitors from all over the region. The town is also home to several wineries, which produce a variety of wines from the local grapes.
In addition to tourism and recreation, the town is also home to several small businesses, including a general store, a hardware store, and a restaurant. The town is also home to a small manufacturing plant, which produces a variety of products.
Demographics
As of the 2010 census, the population of Parkwood was 1,000 people. The racial makeup of the town was 95.2% White, 0.7% African American, 0.7% Native American, 0.7% Asian, 0.3% Pacific Islander, and 2.1% from other races. The median household income was $45,000 and the median family income was $50,000. The per capita income was $20,000.
Conclusion
Parkwood is a small unincorporated community located in the foothills of the Sierra Nevada Mountains in El Dorado County, California. It is a rural community with a population of approximately 1,000 people and is largely based on tourism and recreation. The town is home to several campgrounds, hiking trails, and fishing spots, which attract visitors from all over the region. The town is also home to several wineries, which produce a variety of wines from the local grapes. The economy of Parkwood is largely based on tourism and recreation, as well as small businesses, including a general store, a hardware store, and a restaurant. The racial makeup of the town is 95.2% White, 0.7% African American, 0.7% Native American, 0.7% Asian, 0.3% Pacific Islander, and 2.1% from other races. The median household income was $45,000 and the median family income was $50,000.
Common Questions
What is Per Capita Income in Parkwood?
Per Capita income in Parkwood is $17,149.
What is the Median Family Income in Parkwood?
Median Family Income in Parkwood is $55,930.
What is the Median Household income in Parkwood?
Median Household Income in Parkwood is $55,087.
What is Income or Wage Gap in Parkwood?
Income or Wage Gap in Parkwood is 37.3%.
Women in Parkwood earn 62.7 cents for every dollar earned by a man.
What is Inequality or Gini Index in Parkwood?
Inequality or Gini Index in Parkwood is 0.45.
What is the Total Population of Parkwood?
Total Population of Parkwood is 2,073.
What is the Total Male Population of Parkwood?
Total Male Population of Parkwood is 807.
What is the Total Female Population of Parkwood?
Total Female Population of Parkwood is 1,266.
What is the Ratio of Males per 100 Females in Parkwood?
There are 63.74 Males per 100 Females in Parkwood.
What is the Ratio of Females per 100 Males in Parkwood?
There are 156.88 Females per 100 Males in Parkwood.
What is the Median Population Age in Parkwood?
Median Population Age in Parkwood is 28.8 Years.
What is the Average Family Size in Parkwood
Average Family Size in Parkwood is 4.3 People.
What is the Average Household Size in Parkwood
Average Household Size in Parkwood is 4.1 People.
How Large is the Labor Force in Parkwood?
There are 875 People in the Labor Forcein in Parkwood.
What is the Percentage of People in the Labor Force in Parkwood?
61.3% of People are in the Labor Force in Parkwood.
What is the Unemployment Rate in Parkwood?
Unemployment Rate in Parkwood is 24.1%.