Zip Codes with the Highest Percentage of Population with a Degree in Visual and Performing Arts in Malibu, CA
RELATED REPORTS & OPTIONS
Visual and Performing Arts
Malibu
Compare Zip Codes
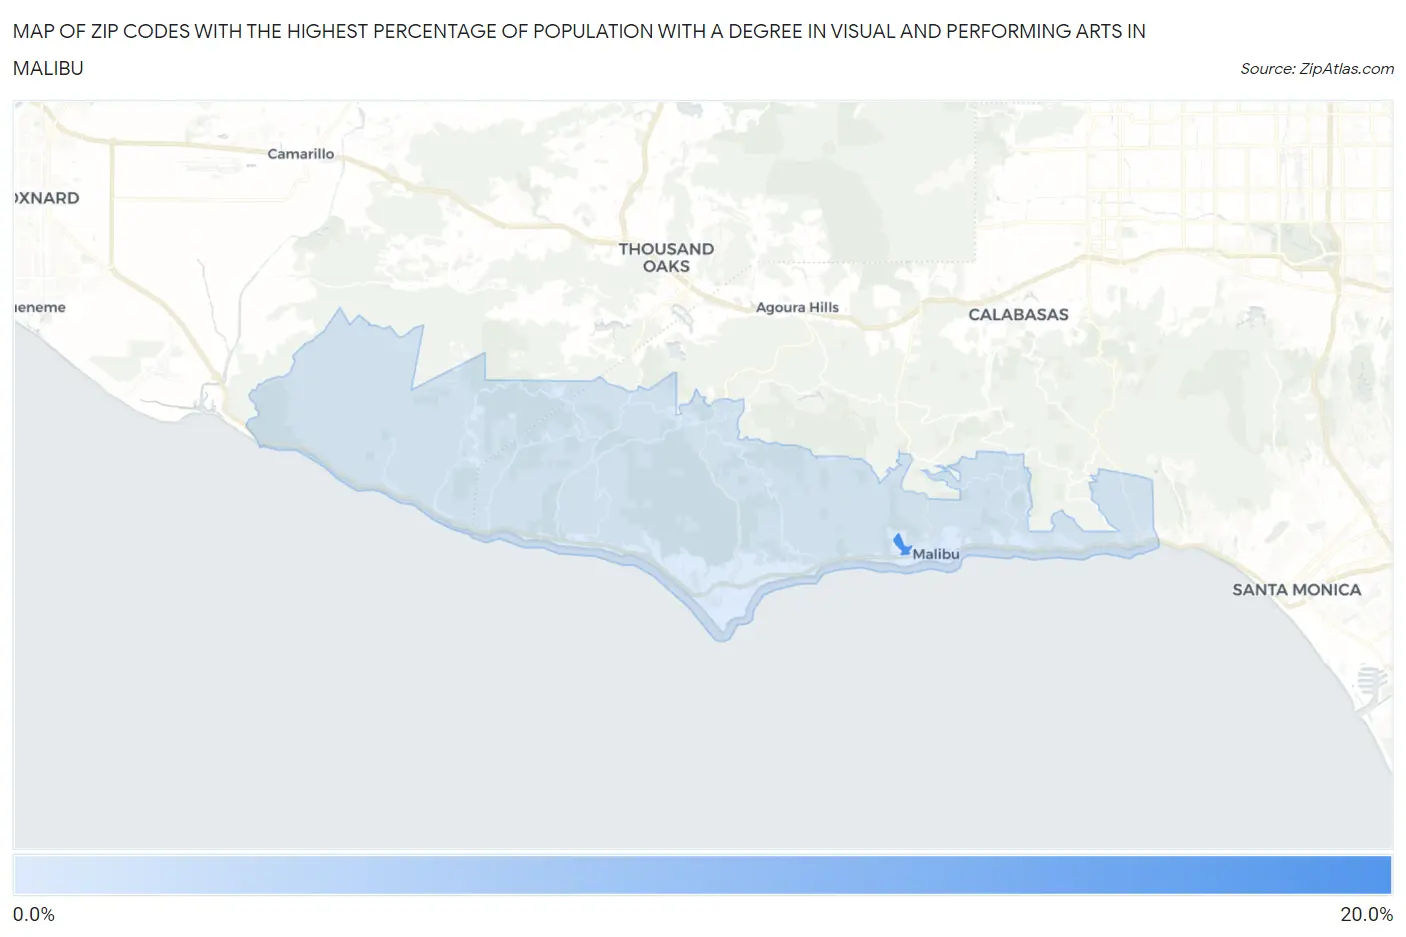
Map of Zip Codes with the Highest Percentage of Population with a Degree in Visual and Performing Arts in Malibu
9.3%
15.9%
Zip Codes with the Highest Percentage of Population with a Degree in Visual and Performing Arts in Malibu, CA
| Zip Code | % Graduates | vs State | vs National | |
| 1. | 90263 | 15.9% | 5.7%(+10.1)#76 | 4.3%(+11.6)#728 |
| 2. | 90265 | 9.3% | 5.7%(+3.55)#230 | 4.3%(+5.04)#2,119 |
1
Common Questions
What are the Top Zip Codes with the Highest Percentage of Population with a Degree in Visual and Performing Arts in Malibu, CA?
Top Zip Codes with the Highest Percentage of Population with a Degree in Visual and Performing Arts in Malibu, CA are:
What zip code has the Highest Percentage of Population with a Degree in Visual and Performing Arts in Malibu, CA?
90263 has the Highest Percentage of Population with a Degree in Visual and Performing Arts in Malibu, CA with 15.9%.
What is the Percentage of Population with a Degree in Visual and Performing Arts in Malibu, CA?
Percentage of Population with a Degree in Visual and Performing Arts in Malibu is 9.1%.
What is the Percentage of Population with a Degree in Visual and Performing Arts in California?
Percentage of Population with a Degree in Visual and Performing Arts in California is 5.7%.
What is the Percentage of Population with a Degree in Visual and Performing Arts in the United States?
Percentage of Population with a Degree in Visual and Performing Arts in the United States is 4.3%.